128 and 107!!
Record-setting heat developed over the Mojave Desert and Death Valley region around July 11, 2012. This post looks at some of the records, with links to associated weather information concerning the event.
The National Weather Service’s cooperative weather station in Furnace Creek, Death Valley, reached 128F on July 11th, 2012. This is six degrees cooler than the “official” record maximum temperature report from Greenland Ranch (Furnace Creek) on July 10, 1913, but only one degree lower than the hottest official temperature reading at Furnace Creek-area stations since 1913. The 134F temperature and the other maximum temperature reports of 127 to 131F in July, 1913, are not supported by surrounding temperature readings during the same time frame, and are suspect.
The minimum overnight temperature at Death Valley on July 11/12 was 107F. This reading (and the 128F for the prior afternoon) appears reliable, and is the warmest overnight morning minimum temperature observation since a minimum of 110F was reported in 1918:
000 SXUS75 KVEF 121650 RERVEF RECORD EVENT REPORT
NATIONAL WEATHER SERVICE LAS VEGAS NV
950 AM PDT THU JUL 12 2012
…SECOND WARMEST LOW TEMPERATURE EVER RECORDED AT DEATH VALLEY ON RECORD…
THE LOW TEMPERATURE AT THE OFFICIAL DEATH VALLEY WEATHER STATION
IN FURNACE CREEK THIS MORNING ONLY FELL TO 107 DEGREES.
THIS BREAKS THE RECORD FOR THE HIGHEST MINIMUM TEMPERATURE
FOR JULY 12TH OF 100 DEGREES SET IN 1931. THE LOW OF 107
DEGREES THIS MORNING IS THE SECOND WARMEST MINIMUM TEMPERATURE
EVER RECORDED AT DEATH VALLEY SINCE RECORDS
STARTED IN JUNE 1911.
ONLY JULY 5TH 1918…WHEN THE LOW TEMPERATURE FELL TO 110
DEGREES HAS BEEN WARMER. THE LAST TIME DEATH VALLEY RECORDED
A LOW OF 105 DEGREES OR GREATER WAS ON JULY 11TH 1920.
A LOW OF 101 WAS RECORDED ON JULY 19TH 2010 AND THIS WAS
THE LAST TIME A MINIMUM IN THE TRIPLE DIGITS WAS RECORDED
IN DEATH VALLEY. THE ABOVE INFORMATION IS PRELIMINARY AND
IS SUBJECT TO A FINAL REVIEW BEFORE BEING CERTIFIED BY THE
NATIONAL CLIMATIC DATA CENTER.
STACHELSKI
My research has shown that the first 20 years or so of temperature data from Greenland Ranch in Death Valley is riddled with untrustworthy reports, and the daily minimum of 110F in 1918 is probably bogus. Therefore, I contend that the 107F minimum temperature reading for Death Valley on July 12, 2012 is the ALL-TIME HIGHEST RELIABLE daily minimum temperature report for Death Valley and for the United States.
My Masters Thesis “A Critical Analysis of Eastern Mojave Desert Temperatures” (1987) looked into the historic temperature and climate records from Death Valley, and showed the inconsistencies and suspect nature of data from Greenland Ranch from about 1911 to 1930. It is unfortunate that the untrustworthy records from this period contaminate the climate record of Death Valley, and the United States. Eventually I intend to provide an online detailed write-up to demonstrate the veracity, or lack thereof, of the early Death Valley records, including the 134F report. For the time being, I am providing this page “for the record” for this record-setting heat event. It will serve in part to help understand why many of the old Death Valley records are not reliable.
The remainder of this post provides links to lists of weather data, discussion, maps and soundings, etc., that I have collected online. One of the primary reasons as to why the 130F-plus maximums from Death Valley/Greenland Ranch in 1913 are suspect (or should I say, “bogus”) is because the maximums at the surrounding stations were not high enough to support such hot readings in Death Valley. Because of excellent vertical and horizontal mixing in the lower and mid-levels of the troposhere during summertime heat events in the region, air temperature decreases (very predictably!) by approximately 5.5 degrees Fahrenheit with every 1000-foot gain in elevation. This change in temperature with height is the dry adiabatic lapse rate. When comparing reports in the region, even between stations separated by 100 miles or more, you will find that station elevation is the primary determining factor on daily maximum temperature differences. This relationship is easily seen during the heat wave from July 9-12, 2012. If a station reports a maximum temperature which appears to be a good bit cooler or warmer than what might be expected based on its elevation AND the trustworthy reports from nearby stations, then there may be a good reason to discredit the reports —– as is the case with the 1913 records.
Anyway, I don’t want to get into the weeds of the early Death Valley records right here and now! But, I feel that by providing all of the data below, in combination with the historical temperature record from Death Valley and Death Valley-area stations (to be provided eventually online, and in my thesis), that finally the 134F record at Greenland Ranch can be officially discredited. That is the goal, and the best way to be convinced is to have a solid foundation of knowledge of Death Valley and Mojave Desert temperature patterns, climatology and meteorology.
Weather Underground Blog entry on Death Valley’s 128F on July 10, 2012
CIMSS Blog on Death Valley’s 128F on July 10, 2012
Area Forecast Discussions, July 10-13 (AFDs)
Regional Max/Min Temp and Precip Listings, July 10-13 (RTPs)
Public Information Statements and Record-Setting Weather (July 11-14)
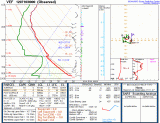
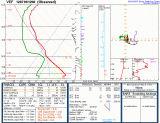
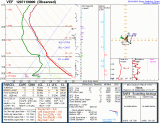
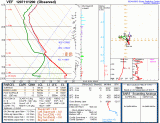
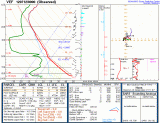
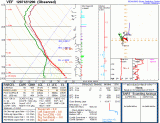
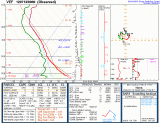
Upper Air Sounding Skew-T plots at Las Vegas, NV (VEF) July 10-13
Upper Air sounding data at Las Vegas, NV
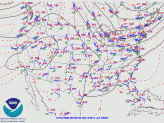
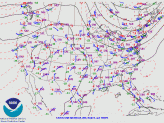
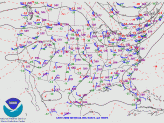
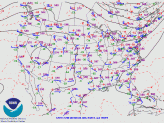
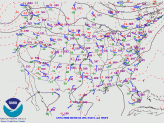
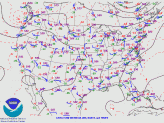
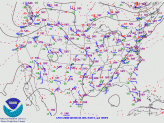
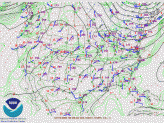
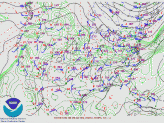
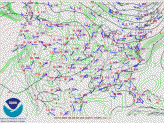
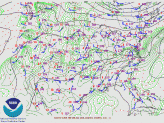
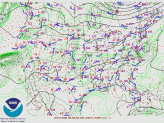
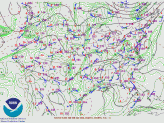
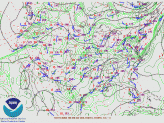
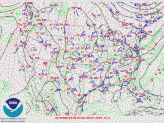
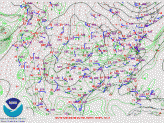
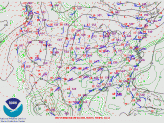
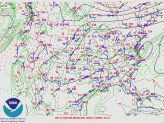
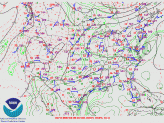
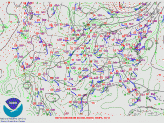
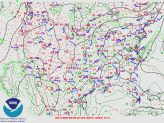
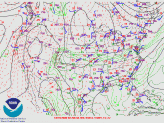
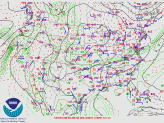
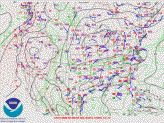
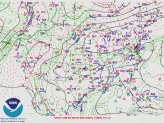
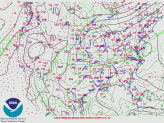
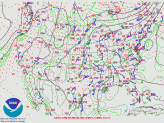
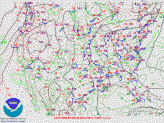
UPPER AIR MAPS for July 10-13
500 mb 00Z July 10 to 00Z July 13
700 mb 00Z July 10 to 00Z July 13
850 mb 00Z July 10 to 00Z July 13
925 mb 00Z July 10 to 00Z July 13
HOURLY OBSERVATIONS/WEATHER DATA for July 9-14, 2012
Weather data for about 6 dozen automatic weather stations in Death Valley and vicinity were copied and saved for this study. Click on a station listed below for the hourly (or even more frequent) weather reports from about July 9 to July 14, 2012. Data from these stations are plotted on this NWS/Mesowest map.
The data for this time frame from the stations below have not necessarily been closely scrutinized for errors! These are official and non-official reports from a variety of sources, from the NWS and FAA to local government agencies to home weather stations in the backyards of John Q. Public. Generally speaking, NWS/FAA station data (for instance, data from airports) are reliable with conservative, trustworthy temperature readings. Data from other agencies or private stations may or may not be worthy of direct comparison, due to differences in station and instrument exposures, station and instrument quality, station and instrument maintenance and calibration and general quality control, among other things! Having said that, the temperature readings for the stations below are, for the most part, “trustworthy.”
In addition to NWS/FAA data from regional airports and NWS mesonets are data from
RAWS stations (Remote Automatic Weather Stations),
CEMP stations (Community Environmental Monitoring Program),
DRI stations (Desert Research Institute),
SCAN stations (Soil Climate Analysis Network),
CIMIS stations (California Irrigation Management Information System) and
UPR stations (Union Pacific Railroad).
Some, if not many, RAWS stations generate inflated daytime temperature readings (often by several degrees) when the sun is shining and the wind is not blowing strongly (based on my personal experience and my opinion for RAWS stations here in Southern California). RAWS stations are typically well ventilated and very well exposed to any wind. Sunny-day temperature readings with wind speeds of about 15 mph or greater are generally reasonable at the RAWS sites, but beware midday readings in the sunshine with light wind.
Since this heat wave produced temperatures in Death Valley which are among the highest temperatures ever observed in the United States, I think it is important to reiterate the following:
It is prudent to maintain a healthy level of skepticism when it comes to evaluating temperature reports by any station, whether automatic or by an individual. Temperature readings are arrived by different methods and by different instrumentation with varying degrees of accuracy and quality and exposure. Truly accurate, conservative, and reliable ambient air temperature readings are not easy to come by during strong insolation with light winds, as is common in the desert during the hottest part of the day.
Included after the station name below are its elevation in feet, the maximum temperature for July 10, the morning minimum for July 11, the maximum temperature for July 11, the morning minimum for July 12, and the maximum temperature for July 12th. Also noted are any other particularly noteworthy temperature reports. If it appears that temperature data appear a little bit off or unreliable, I will note that.
Amargosa Valley/CEMP 2450′ 110/78/112/90/103 north of Death Valley Jct, 99F at 11:30 p.m. on 11th
Area 12 Mesa A40 7525′ 87/69/89/70/85 ne of Yucca Mountain, NV
Balch/UPR 962′ 122/89/122/91/102 Devils Playground area, 100F at 2:20 a.m. on 12th
Barcroft Research Lab BRCFT/DRI 12,410′ 63/46/63/46/61 White Mountain ne of Bishop
Beatty CMP03/CEMP 3215′ 107/72/108/85/102 north of Furnace Creek, 98F at 11:30 p.m. on 11th
Big Pine AN047 4048′ 103/72/104/77/95 Owens Valley, CA
Bishop KBIH 4121′ 105/60/106/64/97 northern Owens Valley
Blythe AP KBLH 397′ 117/86/109/79/99
Bullhead City BHCA3 564′ 120/92/112/90/102 106F at 12:03 a.m. on 11th
Bullhead City KIFP 696′ 118/91/111/90/100 104F at 11:55 p.m. on 10th
Cadiz Valley CIMIS est. 791′ 116/89/110/85/99 100F at 2 a.m. on 11th
Charlotte Lake/HADS 10,400′ 65/40/64/41/60 west of Independence in the Eastern Sierra
China Lake KNID 2283′ 111/76/113/85/107 89F at 4:56 a.m. on 12th
Cima UP034 4095′ 98/69/99/74/86 south of Mountain Pass on Cima Dome
Crooked Creek CCRF/DRI 10,151′ 73/45/75/47/71 White Mountain ne of Bishop
Daggett KDAG 1926′ 112/81/114/90/100 97F at 12:50 a.m. on 12th
Death Valley CQ162/CARB 410′ 120/103/121/106/112 near Furnace Creek, 114F at 12 a.m. (midnight) on 12th
Deep Springs/SCAN 5399′ 98/70/100/73/91 80F at 3 a.m. on 12th, east of Bishop
Deer Creek Hwy/NV DOT 8218′ 83/67/85/63/80 Spring Mountains, NV
Desert NWR Portable NV TS566/RAWS 2165′ 115/75/116/90/104 ne of Death Valley Jct
Desert Rock Airport KDRA 3238′ 108/74/110/88/101
Dos Palmas RAWS -95′ 120/89/109/85/104 eastern edge of Salton Sea, 106F at 12:14 a.m. on 11th
Dunn UPR 1475′ 111/87/112/88/98 between Barstow and Baker
Dyer Wallace Farms 4883′ 99/55/98/56/90 east of White Mountain
Edwards AFB KEDW 2303′ 108/72/110/82/101
Essex SCAN 2644′ 109/84/103/77/91 about 7 miles se of and 900 feet higher than Essex, 90F at 6 a.m. on 11th
Five Mile RAWS 4150′ 105/86/106/81/100 south of Little Lake, west of U.S. 395
Fort Irwin Bicycle Lake KBYS 2349′ 110/87/110/84/96 northeast of Barstow, 95F at 5:55 a.m. on 12th
Goldfield CMP09 5625′ 96/67/99/74/94 south of Tonopah, NV
Hunter Mountain RAWS 6880′ 92/72/93/70/90 Panamint Range station above the north end of the Panamint Valley
Independence DRI 3941′ 106/74/106/76/104
Jean AN901 3122′ 107/85/106/85/94
Kelso UPR 2005′ 110/84/114/87/98
Lancaster KWJF 2346′ 107/70/111/86/97
Las Vegas KLAS 2172′ 114/91/114/89/104 94F at 5:56 a.m. on 12th
Laural Mountain RAWS 4390′ 102/82/103/78/97 86F at 3:26 a.m. on 11th, south of Ridgecrest
Lee Canyon LCAN2 8626′ 77/60/78/54/71 west of LAS, near Charleston Peak
Lone Pine AN044 4229′ 104/71/105/75/98
Manix UPR 1790′ 111/87/109/86/96 ne of Daggett on I-15
Mid Hills RAWS 5365′ 99/77/95/68/82 81F at 1:51 a.m. on 12th, south of Cima
Mojave AP KMHV 2785′ 106/79/108/82/99
Mojave National Preserve CQ224 3952′ 101/82/101/76/86 nw of Kelso
Needles AP KEED 984′ 120/94/113/88/103 106F at 12:56 a.m. on 11th
Needles DW8341 554′ 117/90/110/89/100 110F at 9:26 p.m. on 10th
Opal Mountain RAWS 3240′ 105/76/110/82/95 nnw of Barstow
Owens Lake North CI183 3684′ 103/71/105/76/99
Owens Lake South CI189 3682′ 106/68/107/72/102
Pahrump CMP17 2640′ 112/81/113/91/104 97F at 5:10 a.m. on 12th
Pahrump CW9143 2540′ 114/72/115/91/99 95F at 5:04 a.m. on 12th
Pahrump DW7657 2560′ 111/77/112/89/102 data missing 11:30 a.m. to 3:30 p.m. on 11th, may have been hotter than 112F
Palm Springs AP KPSP 459′ 119/87/110/85/98
Panamint Mountains RAWS 6880′ 95/70/98/74/88 near the top of Surprise Canyon at Panamint City ghost town
Pinto Wells 1075′ 116/94/108/85/99 102F at 2 a.m. on 11th
Primm PRIN2 2642′ 115/89/114/87/101 104F at 10 p.m. on 10th
Rainbow Canyon RACN2 7975′ 82/64/82/62/76 just below Mount Charleston
Rice Valley RAWS 831′ 120/85/111/84/100
Ridgecrest CW9067 2464′ 113/86/114/89/107
Rogers Spring NROG DRI 2260′ 111/68/112/83/103 94F at 3:50 a.m. on 12th, ne of DV Junction
Sarcobatus Flats CMP20 4106′ 104/66/106/74/101 between Goldfield and Beatty
Shadow Mountains SCAN DWMC1 3643′ 105/74/104/82/88 near I-15 and Cima Road
Shoshone CMP28 1517′ 114/81/116/92/100 98F at 5 a.m. on 12th
Sierra Rotors 15 DRI 3727′ 106/60/108/63/101 se of Independence
South Lake Cabin SOUC1 9580′ 78/54/78/55/74 HADS station in E. Sierra, sw of Bishop
Squaw Springs RAWS 3661′ 104/78/107/77/98 east of Johannesburg
Stovepipe Wells ISWC1 July 10 80′ 122/97/124/104/118 nw of Furnace Creek in Death Valley
Stovepipe Wells ISWC1 July 8-15
Sweeney Granite Mountains DRI 4279′ 102/84/99/72/85 88F at 5:50 a.m. on 11th, near I-40 and Kelbaker Rd.
Thermal KTRM -125′ 117/84/109/84/99
Tonopah AP KTPH 5426′ 100/65/101/65/96 85F at 11:56 p.m. on 10th
Twentynine Palms KNXP 2054′ 113/88/110/84/97 97F at 11:56 p.m. on 10th
Warm Springs Summit CMP26 7550′ 88/71/89/71/84 along U.S. 6 east of Tonopah
The hottest daily maximum temperatures of the heat event generally occurred on July 10th southeast of I-15, and on the 11th northwest of I-15. Late on the 10th, relatively cool air at low levels spread into eastern portions of the Mojave Desert from the east and southeast. (Note the dew point jump and decrease in temperature at Blythe AP at about 11 p.m. on the 10th.) Rain-cooled outflow from thunderstorms in western Arizona, combined with a general increase in moisture at low and mid-levels (and additional convection) continued to spread northwestward on the 11th and 12th. Some areas were about 20 degrees cooler on the 12th compared to the 10th, and many stations received measurable rain with the “monsoon” surge.
The moister and cooler low-level air reached the Furnace Creek area a little after sunrise on the 12th. This was the morning with the minimum temperature of 107F at the cooperative station in Furnace Creek. An automatic station at 410 feet elevation, a few miles north of Furnace Creek, showed a jump in dew point nto the 50s around noon, with a nice increase in southerly winds. Interestingly, the temperature here was warmer at sunrise than it was at sunset on the 12th. It was 107F at 6 a.m., 107F at noon, and 103F at 6 p.m. No doubt, considerable cloudiness and shower activity helped to keep the late afternoon temperatures down.
The following table provides the max/min temp data at the official Death Valley cooperative weather station at Furnace Creek (elevation -194 feet); at the Death Valley automatic “CARB” station (CQ162, elevation 410 feet), about three miles NNE of Furnace Creek; and at the Stovepipe Wells automatic station (CRN Site near Stovepipe Wells 1SW, elevation 80 feet), about 1000 feet south of Stovepipe Wells:
8) 121/93 115/– 117/–
9) 123/87 117/97 120/91
10) 126/89 120/102 122/96
11) 128/98 121/103 124/97
12) 120/107 112/106 118/104
13) 100/93 97/92 103/95
14) 112/77 106/80 105/78
Note that the cooperative station in Furnace Creek has high temperatures which are regularly about six degrees hotter than the nearby CARB station. About half of that can be attributed to the difference in elevation. The CARB station, 600 feet higher, would be expected to be three degrees cooler on average on typical summer afternoons with good mixing. Why might the Furnace Creek station be another 3 to 4 degrees warmer than the CARB station after factoring in the elevation difference? The stations are separated by only three miles, and a 3 to 4-degree temperature difference seems a bit much…is this difference real?? Probably not — or not entirely! Several ingredients may be coming into play. One factor is likely the way that the maximum temperature is determined. The Furnace Creek coop station max temp is based on continuously updated temperature measurements. The CARB station maximums are taken from the once-an-hour reports. It is very, very likely that the air temperature at the CARB station occasionally exceeds that shown by the highest hourly report on most days. Here are the hourly reports from the CARB station on July 11, when it showed a max of 121F (while nearby Furnace Creek hit 128F):
11 Jul 11:00 pm PDT	116	40	8	SE	9	Caution
11 Jul 10:00 pm PDT	117	41	8	SE	7	Caution
11 Jul 9:00 pm PDT	118	42	8	S	9	Caution
11 Jul 8:00 pm PDT	120	39	7	SSW	9	Caution
11 Jul 7:00 pm PDT	121	40	7	SSW	10	OK
11 Jul 6:00 pm PDT	121	40	7	SW	8	OK
11 Jul 5:00 pm PDT	121	44	8	SSW	9	OK
11 Jul 4:00 pm PDT	120	43	8	WSW	7	OK
11 Jul 3:00 pm PDT	118	42	8	SSW	6	OK
11 Jul 2:00 pm PDT	117	41	8	SW	5	OK
11 Jul 1:00 pm PDT	114	42	9	SSW	6	Caution
11 Jul 12:00 pm PDT	112	43	10	SSW	8	Caution
11 Jul 11:00 am PDT	110	41	10	S	9	Caution
11 Jul 10:00 am PDT	108	40	10	S	12	Caution
11 Jul 9:00 am PDT	109	40	10	W	4	Caution
11 Jul 8:00 am PDT	106	41	11	NE	4	Caution
11 Jul 7:00 am PDT	104	39	11	ENE	2	Caution
11 Jul 6:00 am PDT	103	39	11	N	4	Caution
11 Jul 5:00 am PDT	105	40	11	NNW	4	Caution
11 Jul 4:00 am PDT	107	39	10	SSE	3	Caution
11 Jul 3:00 am PDT	107	39	10	SE	5	Caution
11 Jul 2:00 am PDT	109	41	10	E	2	Caution
11 Jul 1:00 am PDT	110	41	10	ENE	4	Caution
11 Jul 12:00 am PDT	111	39	9	ESE	6	Caution
The CARB station shows 121F at 5 p.m., 6 p.m., and 7 p.m. PDT. I do not know if these hourly CARB temperature reports are based on spot readings or are one, or two, or five-minute averages. It seems safe to assume, though, that the air temperature at this CARB site was likely as high as 122F or 123F on July 11. So, add the 3 degrees due to elevation, and we are up to 125 to 126F, only 2 or 3 degrees less than the Furnace Creek station reading of 128F. What might account for the additional difference? One factor might be instrumentation —- the CARB station “might” be a little better at warding off direct solar radiation and providing a better, truer ambient air temperature. I am not familiar with the CARB station, but if its temperature sensor is well above the normal 5 or 6 feet above ground level, then it would likely provide slightly cooler readings comparably. Finally, overall ventilation and exposure to wind could be important. The CARB station appears to be located well out in the open on an alluvial fan. There is NOTHING between it and the typical summertime south winds through Death Valley except for the smallest and scrawniest of scrub bushes. On the other hand, the Furnace Creek station is north of the Visitors Center and the buildings and trees of Furnace Creek. South winds are no doubt diminished some as they reach the Furnace Creek coop station. This could aid in boosting ambient air temperature in and around the station a degree or two compared to nearby well-exposed locales. However, the increase in vegetation and local moisture in the Furnace Creek area would act to have the opposite effect on temperature, due to cooling effects of evaporation. Perhaps the safest statement is “the Furnace Creek village area, near the bottom of the valley and with its trees and buildings, is not as breezy as the nearby well-exposed slopes to its north and east. The poorer ventilation through Furnace Creek allows low-level air heated by the hot ground to linger a little longer near the surface comparably, likely allowing ambient air temperature in some parts of the village to be a degree or two warmer (other things being equal!).”
Maximum temperatures at the Stovepipe Wells station run about three to four degrees cooler than at the Furnace Creek coop station. Elevation differences would make the Stovepipe Wells station no more than 1.5 degrees cooler on average. Again, the better exposure to wind at Stovepipe Wells, and/or the other items discussed above, are likely responsible for the additional two degrees of warmth at the Furnace Creek coop station. The Stovepipe Wells station reports every five minutes, so the “in-between” reports problem is not as severe as at the CARB station.
It is interesting to note that the morning minimum temperatures on the 12th are exactly what one might expect given a windy, well-mixed boundary layer all night long—–i.e, the temperatures decrease nicely according to station elevation. The Stovepipe Wells station, about 280 feet higher than the Furnace Creek coop station, is one degree cooler. The CARB station, about 600 feet higher than the coop station, is three degrees cooler. On most nights, Furnace Creek is cooler than the higher CARB station due to calmer winds and routine low-level nighttime radiation inversions. The CARB station, along the slopes, is in a spot where shallow nighttime radiation inversion formation is difficult and/or weak, as cool surface air is easily mixed away. One would expect warmer overnight minimums at Furnace Creek only on those nights when the wind is blowing continuously.

ccburt says
This is a great analysis of heat waves in Death Valley. I’d like to discuss further with you at some time.