UPDATE, August, 2016
This part remains incomplete — sorry about that. I have been working on Part 4, which will help me with the remaining portion of Part 3.
——————
HOT TEMPERATURE COMPARISONS IN THE DEATH VALLEY REGION
Previous studies of Death Valley’s high temperature record (outside of my Masters Thesis, completed in 1987) have not compared the July 1913 Greenland Ranch maximums with those at surrounding stations. McAdie (MWR, 1915) noted that other stations in the region were not excessively warm during the week with 128F to 134F maximums at Greenland Ranch, but he provided no details. Most climatologists accept the record, but have not been able to adequately explain the hot maximums. Arnold Court studied July maximums and annual maximums for the first 35 to 40 years of record at Greenland Ranch. He determined, statistically, that it was very unlikely that the 134F record maximum would be exceeded. Court was one of the few who cast doubt on the authenticity of the record by proposing that there may have been a “short-term bubble” in the maximum thermometer, or perhaps “super-heated sand” affecting the instruments during windstorms. But, there was no evidence to support these explanations. If Oscar Denton, the observer at Greenland Ranch in 1913, artificially “bumped up” the maximum temperature observations in July 1913 (as suggested earlier in this paper), then there is probably no one around now who can verify that. What we CAN demonstrate is that the maximum temperatures at surrounding stations in July, 1913, were not high enough to support legitimate air temperature readings near and above 130F inside of the thermometer shelter at Greenland Ranch during that month. In order to get there, a detailed investigation of Death Valley’s summer temperature record and how it compares to surrounding stations is necessary. First, we’ll take a look at the distribution of all of the annual maximum temperature reports.
ANNUAL MAXIMUM TEMPERATURES AND LONG-TERM TRENDS
The two charts below are similar and show the annual maximum temperatures since 1911 at the Furnace Creek stations Greenland Ranch (1911-1960) and Death Valley (1961-2013).
Tables 3-1 and 3-2 (above)
The second chart includes a 7-year “running average” (where the running average point for any particular year is the average for that year and the preceding six years). The annual maximums at Greenland Ranch during its 50 summers (1911-1960) ranged from 120F to 127F, except for the 134F in 1913. The annual maximums at the “Death Valley” station for its first 53 summers (1961-2013) range from 119F to 129F. Annual maximums at Greenland Ranch (including the 122F value at Furnace Creek Ranch in 1891) averaged 123.9F. If the 134F in 1913 is discarded, the average is 123.7F. Since 1961, at Death Valley, the average annual maximum temperature is 124.8F, about a degree warmer than that for Greenland Ranch.
Tables 3-3, 3-4 and 3-5 (above)
The frequency distribution of annual maximums (Tables 3-3 to 3-5) indicates that 123F, 124F and 125F have occurred most frequently. More than half of the previous 103 summers (through 2013) have had maximums of 123, 124 or 125F. Most noteworthy is the relatively recent increase of annual maximums at Death Valley (Table 3-2). The 7-year running average hovered fairly closely to 124F at Greenland Ranch from the 1920s to the 1940s and was near 123F during the 1950s. The first ten years for the “Death Valley” record (1961-1970) were comparatively cool, with the 7-year average bottoming out a little under 122F in 1969. The 1970s and most of the 1980s were back up around 123F to 124F. Then, rather abruptly, beginning in 1988, annual maximums of 125F and higher became the norm rather than the exception. For Death Valley’s first 27 summers (1961 to 1987), only four annual maximums were 125F or warmer. For the next 26 summers (1988 to 2013), only two annual maximums were COOLER than 125F! The 7-year running average has been within a degree of 127F since the mid-1990s. Though only four years reached 127F prior to 1988 (three if the 134F in 1913 is ignored), SIXTEEN different years have had 127F or higher since 1988! Are the hottest summer days in and around Furnace Creek getting hotter, or is this due to something else? Recall Roof and Callagan’s article in BAMS (2002, page 1736), which noted that “average daily wind movement measured at Furnace Creek has decreased by more than 50 percent over the last 25 years, most likely not due to changes in weather patterns, but due at least in part to growth of trees near the weather station.” If wind movement through the Death Valley weather station and vicinity has indeed diminished considerably due to vegetation growth in the past several decades, then it is no surprise that the temperature on the hottest days is on the increase. The Death Valley weather station is on the north side of the visitor center building, which is on the north side of the Furnace Creek village area. Summer afternoon winds through Death Valley are usually from the south. When I wrote my Masters Thesis in the mid-1980s, I felt that the cooling effects of transpiration and evaporation due to all of the vegetation and irrigation in and around the visitors center and Furnace Creek resulted in somewhat cooler maximums at the weather station compared to adjacent areas that were not affected by the cooling. However, today, these cooling effects may be substantially offset by increasingly poorer ventilation through the station site. The southerly winds through the weather station area are now weaker due to the taller trees and denser vegetation just to the south. Air heated locally above the bare ground immediately in and around the weather station area is permitted to linger longer and to warm a little more compared to earlier decades. Of course, if the current weather station suddenly found itself above irrigated, “cultivated” ground, as the Greenland Ranch station originally was, the upward trend in recent decades would cease and there would be a sharp downward trend, as locally cooler air would be allowed to linger around the thermometer shelter.
(As an aside, IF the 134F and 131F and 130F reports from 1913 are indeed legitimate, and were indeed read off of a properly functioning maximum thermometer in a standard shelter that was above an alfalfa field; is it not strange that the current, warmer weather station environment at Furnace Creek has never reached 130F? And is it not peculiar that there has been no official 130F maximum temperature despite a slew of summer heat waves in the region that were hotter than the one of July, 1913?)
One way to see if the summer maximums are on the increase would be to compare different 30-year normal periods at Death Valley. Here is a list of the monthly average maximum temperatures for 1951-1980 and for 1981-2010, and the difference (normals provided by the National Climatic Data Center, courtesy of the Western Region Climate Center):
1951-1980/1981-2010/Difference
J 65.3 66.9 +1.6
F 73.3 73.3 0.0
M 80.6 82.1 +1.5
A 89.5 90.5 +1.0
M 98.7 100.5 +1.8
J 108.7 109.9 +1.2
J 115.4 116.5 +1.1
A 113.0 114.7 +1.7
S 106.0 106.5 +0.5
O 92.9 92.8 -0.1
N 75.9 77.1 +1.2
D 65.4 65.2 -0.2
Ann 90.4 91.4 +1.0
All of the warm-season months are about one-to-two (F) degrees warmer for the more-recent 30-year period, on maximum temperatures. It would seem that the local environment around the Death Valley instrument shelter has indeed warmed, likely in part to changes in the immediate surroundings. Since the winter maximums have not warmed as much, and since winds are more often out of the north on winter afternoons than in summer, it follows that the increase in vegetation just south of the Death Valley station may well be a big reason for the warming, by decreasing the ventilation through the station.
Let’s do a few quick comparisons among some long-term stations to see how average summer maximums have changed in the region. The table below shows the average daily maximums for JJA for the 30-year periods of 1951-1980 and 1981-2010:
“Normal” maximum temperature/JJA/1951-80 and 1981-2010
Greenland Ranch/Death Valley
June 108.7 109.9
July 115.4 116.5
August 113.0 114.7
JJA 112.4 113.7 (+1.3)
Daggett AP
June 97.4 98.3
July 104.0 104.2
August 101.4 102.6
JJA 100.9 101.6 (+0.7)
Needles AP
June 103.4 104.2
July 108.7 108.8
August 105.9 106.9
JJA 106.0 106.6 (+0.6)
Las Vegas AP
June 98.6 98.7
July 104.5 104.2
August 101.9 102.0
JJA 101.7 101.6 (-0.1)
Bishop AP
June 90.4 92.0
July 97.5 98.4
August 95.2 96.3
JJA 94.4 95.6 (+1.2)
Randsburg
June 91.5 90.3
July 98.8 96.9
August 96.5 95.5
JJA 95.6 94.2 (-1.4)
Goldfield*
June 80.8 81.4
July 88.3 89.6
August 85.8 87.4
JJA 85.0 86.1 (+1.1)
Dyer*
June 86.3 86.3
July 93.3 93.2
August 90.9 90.8
JJA 90.2 90.1 (-0.1)
*For Goldfield and Dyer, the 30-year normals are for the overlapping periods 1961-1990 and 1981-2010.
It is a bit of a mixed bag when comparing the change in average daily maximum temperatures in summer between 1951-80 and 1981-2010, but most of these stations indicate some warming. Death Valley showed the greatest warming (+1.3 degrees for JJA), with Bishop AP (+1.2) about the same. Daggett and Needles warmed about a half degree, while Las Vegas changed little. (Trona also showed a half degree of warming, but it is not included here because of a lengthy period of problematic data between about 1995 and 2005.) Looking at July only, the airports in the region changed little, while Death Valley increased a full degree. A detailed investigation into each station’s “substation history” (i.e., any changes in location, ground cover, exposure, instrumentation —- e.g. cotton region shelter versus MMTS) would be necessary to try to separate any “real” regional warming on summer maximums from that due to changes in and around the station. It might seem reasonable to state that summer afternoons were a little warmer in the region during the more recent 30-year period. But then how does one explain the significantly cooler maximums at Randsburg, a station with one of the better exposures and consistent climate records? As discussed previously, the warmer maximums for the latter period at Death Valley are likely due to changes in ventilation around the instrument site.
FREQUENCY DISTRIBUTION OF ANNUAL MAXIMUM TEMPERATURES IN THE REGION
Tables 3-3, 3-4 and 3-5 (above) show the frequency distribution of the annual maximums at Greenland Ranch and Death Valley. Again, all of the annual maximums range from 119F to 129F, except for the 134F outlier. All but 8 of the 104 maximums (the maximum of 122F in 1891 included) fall into the narrower range of 121F to 128F. The average annual maximum for Greenland Ranch/Death Valley (for 1891 and 1911-2013) is 124.4F, and the standard deviation for the data set is 2.4. A value of 134F is exactly four standard deviations from the mean.
For Greenland Ranch annual maximums, 1911 to 1960, WITHOUT the 134F value averaged in, the average annual maximum is 123.7F and the standard deviation is a much narrower 1.6. A value of 134F is more than six standard deviations from the mean.
By this measure, statistically, the 134F maximum temperature report for 1913 at Greenland Ranch is an extreme outlier.
The frequency distribution of annual maximums at surrounding stations is worth investigating. Do other desert stations have extreme “outliers” in their records?
Tables 3-6 to 3-17 (above) Frequency distribution of annual maximum temperatures at various long-term stations in the Death Valley region.
(Keep in mind that temperature record reliability is generally better at airport stations, where the quality control is typically better, instrument exposure is excellent, and changes in instrument siting are few.) Annual maximums at long-term California and southern Nevada airport stations generally cover a temperature range of about 9 to 12 degrees. About 90 percent of the values fall within an eight-degree range. For instance, at Daggett AP (elev. 1917′), all of the annual maximums range from 107F to 118F, and all but 4 of the 69 values are from 109 to 117F. At Las Vegas AP (elev. 2162′) all 77 annual maximums since 1937 have been from 109 to 117F.
If the 118 years of annual maximums at Needles are combined (for the coop station in town, elev. 480′; and after 1940 the airport station, elev. 914′), annual maximums range rather “widely” from 108F to 125F. All but three of the annual maximums range from 111F to 123F, and the “outliers” of 108F and the two years with 125F deserve some scrutiny. In 1913, when Greenland Ranch reported 134F on July 10, Needles reached “only” 114F (on July 11). At Needles AP since 1948, all annual maximums have ranged from 113 to 123F, except for a 125F in 2005.) The instruments in Needles were above grass, at least occasionally, during its early years of record. So, even though the elevation in town is 500 feet lower than at Needles airport, the moderating influence of the grassy environment there resulted in cooler maximums comparably.
All 47 annual maximums in Tonopah (elev. 6090′) from 1906 to 1953 were from 91F to 99F, except for a curious case of only 88F for 1907 (which appears trustworthy). The annual maximum at Tonopah in 1913 was decidedly on the low side of most Tonopah annual maximums, only 92F (on July 6 and July 12). At Tonopah Airport, annual maximums have ranged from 95F to 104F since 1954, with 55 out of 59 of them from 97F to 103F.
At Independence (elev. 3950′), from 1892 to 1944, annual maximums ranged from 96F to 109F. There were a number of station moves, a wide range of ground covers, perhaps, and the Owens Valley was drying and warming during the first half of the 20th century as Owens River flows were diverted to Los Angeles. For this 52-year period, 45 of the 51 annual maximums were from 100F to 106F. The high temperature at Independence in 1913 was 103F, on July 10th. Independence’s maximum of 109F on July 27, 1934, though during a very hot period (with 117F at Trona and 125F at Greenland Ranch), may be suspect. Its next-hottest maximum for this 52-year period is only 106F. Perhaps its instruments were temporarily not above grass in July, 1934, allowing such a hot reading. Observations were not taken at Independence for a couple of years in the mid-1940s, and then resumed again in 1947. It seemed appropriate to break the record at Independence into two parts (before 1945 and after 1945), as annual maximums in the latter period ran quite a bit warmer compared to the former period. Annual maximums at Independence ranged from 101F to 114F from 1947 to 2013, with all but four from 104F to 113F. These values are significantly warmer than those observed from 1892 to 1944! Only 5 out of 51 annual maximums were 105F or hotter at Independence prior to 1945. Since then, only nine years have FAILED to reach at least 105F. Though summers in Owens Valley gradually warmed through the 1900s following the water diversions and the evaporation of Owens Lake, it seems likely that the primary reason for the much hotter summer maximums at Independence is the difference in the immediate environment around the thermometer shelter. Early stations were above grassy (and perhaps partly shaded) lawns, while the more-recent stations have been in largely bare-ground “highway maintenance” or utility company yards. The numerous maximums of 111F to 114F at Independence during the past couple of decades suggest a poorly ventilated and somewhat unrepresentative instrument exposure at Independence. A detailed investigation of the weather stations and temperature record at Independence since the late 1800s would be quite interesting!
The long-term temperature record for summers at Independence starkly illustrates the effects of ground cover and instrument exposure on air temperature measurement in a desert environment. The average daily maximum temperature at Independence for its first 33 Julys (through 1930) was 93.6F. Its instruments were above grass during most, if not all, of this time frame. For the 30 Julys from 1981-2010, with the instruments above a mostly bare and dry ground cover, the average daily maximum temperature was 99.8F.
The distribution of annual maximums for stations in the Death Valley region is roughly “normal,” statistically; and legitimate, authentic, extreme “outliers” are very rare.
EXTREME MAXIMUMS, AVERAGE ANNUAL MAXIMUMS and AVERAGE DAILY MAXIMUMS FOR JULY
The tables below show the range of annual maximums, the average annual maximum temperature, and the average maximum for July at long-term stations in the Death Valley region. Except for Sarcobatus and Pahrump, added at the end, the stations are listed by distance from Furnace Creek. The tables generally include all reliable desert stations within about 100 miles of Death Valley, and all but a few have records of 50 years or longer. Annual maximums which appeared suspect and/or very unrepresentative were excluded. The average maximums for July are derived from the period of record that is indicated for each station, with a few exceptions. Average maximum data for July which appeared suspect were not incorporated into the long-term average.
Tables 3-18 to 3-20 (above) Average and extreme maximum temperature data for Death Valley area stations.
It might be mentioned now that, though Greenland Ranch recorded a maximum of 129F on July 18, 1960; the daily data from nearby Cow Creek do not support that reading. The 129F day was likely only 124F in reality, and the most trustworthy maximum temperature at Greenland Ranch from 1911 to 1960 was 127F. (EDIT made in March, 2020: The thermograph records for July, 1960, at Greenland Ranch were recently obtained and, yes, the high temperature for July 18, 1960, as indicated by the thermograph trace, is 124F and NOT 129F. The day prior shows a high of 124F to match the official high as recorded by the observer. The observation of 129F at Greenland Ranch is NOT VALID. See an image of the thermograph in the July 1960 section of Part 4). Similarly, a maximum temperature of 128F was recorded once at Cow Creek. But, an investigation by the U.S. Weather Bureau found the 128F reading to be five degrees too high, based on the maximum for the day at Greenland Ranch and the thermograph trace in the shelter at Cow Creek. The 128F reading was officially changed to 123F. The highest reliable temperature observation at Cow Creek from 1935 to 1960 (three miles north of Furnace Creek, 152 feet below sea level, with the Park Service as observer) was 126F.
The average and extreme maximum temperature data at long-term, reliable desert stations in the Death Valley region exhibit some notable consistencies. The range of annual maximums at each station is generally 8 to 10 degrees. (A few stations with a wide variety of station sites, exposures, ground cover, and/or suspect annual maximum temperature reports have wider ranges.) Average annual maximum temperatures are mostly 8 to 9 degrees warmer than the average daily maximum temperature for July, and the extreme maximum temperature at each station is about 12 to 15 degrees higher than the average daily maximum temperature for July (see table below). The consistency of these “differences” from station to station is rather remarkable, given the various and long periods of record, and the distances and elevations involved.
Table 3-21 (above, taken from data in Tables 3-18 to 3-20). Averages and extremes and differences in summer maximum temperatures for stations in the Death Valley region.
For long-term stations in the Death Valley region, for 50-to-60-year periods and even longer, the hottest temperature on record is likely to be about 13 to 14 degrees higher than the average daily maximum temperature for July for that place during that time frame. Based on the above, the reliable maximum of 129F for Death Valley (13.5 degrees higher than the average maximum for July) is a much better “fit” than the suspect 134F report in 1913.
Cow Creek was a very reliable temperature station, but it operated for only 26 summers. All of its annual maximums ranged from 122F to 126F. The average daily maximum for July was 116.0F, and the average annual maximum was 124.2F. The (trustworthy) annual maximums at the Furnace Creek stations (Greenland Ranch and Death Valley combined) have ranged from 119 to 129F since 1911, and with averages very similar to those at Cow Creek. The average annual maximum (124.4F at GR/DV) is 8.4 degrees warmer than its average daily maximum for July (116.0F).
One of the highest-elevation stations in the tables above is Goldfield, Nevada, 89 miles north of Furnace Creek at 5690 feet. In 82 years, annual maximums have ranged from 91F to 103F, and the average annual maximum is 8.3 degrees warmer than its average daily maximum for July. Two very suspicious reports of 108F at Goldfield have been deemed not credible and have been discarded.
At the old mining town of Randsburg (elev. 3570′), southwest of Death Valley, temperature has been measured since 1937. Only two summers here failed to reach 104F (a 102F and a 103F), and the remaining 73 were from 104F to 111F. The long temperature record at Randsburg appears to be one of the better ones in the region. The small town has not changed too much in 75 years, and the instruments have been well-exposed and above natural ground cover. Its all-time maximum of 111F is 13 degrees warmer than its average daily maximum temperature for July.
At Trona, elevation 1695′, the temperature record began in 1920. Annual maximums have ranged mostly from 112F to 118F. The summers of 1963 and 1965 featured no noteworthy hot spells in the region, and Trona reached only 110F and 109F in these years. Trona’s temperature record was excellent prior to about 1993, but was not trustworthy for about a dozen years thereafter. Some very suspect annual maximums from this period (including 97F, 105F, and 107F) were not included in its frequency chart above. It is peculiar that Trona has reached 118F in ten different summers since 1920, but has never hit 119F. Authentic temperatures of 120F are extremely rare in the region at elevations near or above 2000 feet. Trona’s all-time high temperature of 118F is 12 degrees higher than its average daily maximum for July.
Iron Mountain (elevation 922′, southwest of Needles, not included above) has a long and mostly very reliable temperature record. It is not particularly close to Death Valley, but it is an excellent low-elevation desert station in the middle of nowhere, with a record which reflects a good and consistent instrument exposure. All annual maximums since 1935 have ranged from 114F to 122F, except for a 111F in 1982 and a scorching 127F in 2013. The “cool” 111F annual maximum appears reliable, but the 127F in 2013 is decidedly not credible. Average annual maximums at Iron Mountain have averaged 117.1F since 1935, 8.8 degrees hotter than its average daily maximum for July of 108.3F. Its all-time (credible) maximum of 122F is 13.7 degrees hotter than its average daily maximum for July, which fits in nicely with the pattern for stations in the Death Valley region and the eastern Mojave Desert.
Regarding the 127F at Iron Mountain, observed at 7 a.m. on June 28: the next-hottest maximum in about 80 years of record here is five degrees lower, and maximum temperatures on the 27th at surrounding stations were only a few degrees warmer than normal for late June. Nearby Hayfield Pumping Plant, elevation 1370′, had only 109F on the 27th (observed at 6 a.m. on the 28th), and Needles AP had a high of 114F. What might have caused such a hot reading at Iron Mountain on June 27/28, 2013? Was there a brief electronic glitch with the temperature sensor? Did the observer accidentally write down the wrong reading? The 127F observation came a couple of days before the big heat event in the region, when Death Valley had 128F and 129F, and when Needles had 123F on the 29th. The maximum temperature for the 7 a.m. observation at Iron Mountain on June 30th was missing (and the minimum temperature was not missing — it was 82F), which suggests that there might have been an instrument problem at the time. Did the instrumentation show a value which the observer thought to be incorrect, causing the observer to decide to omit an entry? What if the maximum temperature reading on the 30th showed 135F, and was reported as such? Do you think that observation would have been questioned and the veracity thoroughly checked?! Of course! In any case, it appears likely that a problem of some sort existed with the instrumentation at Iron Mountain at the end of June, 2013, and its maximum temperature report of 127F is very suspect.
East of Death Valley is the Desert National Wildlife Refuge (aka Desert Game Range), in Clark County, Nevada, at 2914′. Annual maximums here have ranged from 105F to 117F since 1940, but the highest on record was only 112F for its first 45 summers of operation. The very hot spell at the end of June, 2013, was “only” 112F at this station, and July, 1972, reached only 110F. The handful of annual maximums of 113F to 117F since 1985 are likely from a different and/or inadequately-exposed instrument location. Authentic temperatures of 115F or hotter in the region at elevations near or above 3000 feet are extremely uncommon at stations that are well-exposed, well-ventilated, and above natural ground cover.
Haiwee, west of Death Valley and south of Owens Valley, is a station in a narrow valley at 3825 feet. It operated from 1923 to 2012. Maximums from the past few decades here do not appear to be readily comparable to those from earlier periods, however. Haiwee’s highest annual maximum was 107F from 1923 to 1971, and it hit a new all-time high of 110F during the intense heat wave of mid-July, 1972. After 1980, numerous annual maximums of 110F or greater were reported, including an observation of 117F. This suggests that there was a significant change in exposure or ground cover, and/or occasional issues with the equipment or observer. The 30-year “normal” daily maximums for summer jumped considerably and unnaturally from 1971-2000 to 1981-2010. The hottest temperature at Haiwee which can be considered trustworthy and representative of most of the station’s temperature history is the 110F in 1972.
Barstow had a cooperative weather station as early as 1903, and there have been numerous station changes in the 110 years since. There were 25 missing years prior to 1940, and annual maximums have ranged from 107F to 116F.
As noted already, annual maximums at long-term stations in the Death Valley region and in the Mojave Desert typically cover a range of about 8 to 10 degrees. The frequency distribution of the annual maximums generally resembles a “normal” bell-shaped curve, with most annual maximums within two or three degrees of the average annual maximum. (Standard deviation values for the most reliable and stable long-term stations are about 2.0 to 2.5 degrees.) There are a handful of values towards the extremes of the curve, as would be expected, and these values are usually no more than 5 or 6 degrees from the mean of the annual maximums. At some stations, there are “outlier” values, which may or may not be credible, depending on the circumstances. Some long-term stations with a variety of station sites, ground covers, instrument exposures, and/or local and regional climate changes through its history (such as Haiwee and Independence) are much more apt to have an abnormally wide range of annual maximums.
Annual maximums that are more than about seven or eight degrees hotter than the average of all of the annual maximums, such as at Greenland Ranch in 1913 and at Iron Mountain in 2013, are likely problematic. These need to be carefully checked for credibility and validity.
A detailed research study of the highest temperatures in the Death Valley region is laced with uncertainties. Station moves and ground cover and instrument-exposure differences and changes can be big influences on daytime temperature measurement, and these are not always well-documented. Thermometers are sometimes well maintained, and sometimes they are not. Some observers are reliable and do a good job; some are not reliable. Human errors are sometimes obvious and at other times virtually undetectable. The climate researcher has to wade through all of the information available and determine if the extreme temperatures in a station’s record are credible or not. Were the 108F readings at Goldfield authentic? Is the 125F at Needles in July, 1925, valid? Needles went another 42 years before getting hotter than 120F. Should the rather hot annual maximums at Haiwee during the last two decades of its record be considered or tossed?
If an observer writes down “76” instead of “67”, or writes a “4” that looks like a “9”, or looks at a thermometer and records “83” instead of “87”, then these mistakes get into the record books, are incorporated into the long-term averages, and no one may ever notice. But if human error or instrument error occurs on one of the hottest days of the year, then the report is more apt to be noticed. The bottom line: climate data — old and new, long record or short record — are occasionally messy and error-filled! One thing we know for sure in high-temperature studies is that the atmosphere abides by the laws of physics, and it does not play tricks. When it comes to temperature reports which seem to “stray” a bit from what might be expected, sometimes all we can do is provide some sense of our confidence level with the data. Sometimes all we can say is “this value may be problematic.” It is important to be very skeptical when it comes to weather data that might appear a little “off.”
SUMMER AVERAGE MAXIMUM TEMPERATURES VERSUS ELEVATION
My Master’s Thesis, “A Critical Analysis of Eastern Mojave Desert Temperatures,” found that average maximum and extreme maximum temperatures in summer in the region changed at a rate of about 4.5 degrees per 1000 feet. Let’s revisit that here. The relationship between maximum temperature and elevation is very strong during summertime, and during the exceptionally hot events. By demonstrating this physical association, it should become apparent (or, better yet, “obvious!”) that the very hot temperatures from Greenland Ranch in July, 1913, were physically impossible, based on surrounding reports.
Table 3.22 to 3-24 (below) Average daily maximums for July and for JJA (June/July/August) versus elevation at Death Valley area stations.
Only stations within about 110 miles of Furnace Creek are included. These include stations as distant as Bishop, CA and Dyer, NV, to the northwest; Goldfield and Tonopah to the north; Desert Game Refuge and Pahranagat NWR to the east; Baker, CA, and Las Vegas, NV, to the southeast; Barstow and Daggett to the south, Randsburg and Inyokern to the southwest; and Haiwee and Independence to the west. Only a few long-term stations with 30-year normal temperature data to compare are within 50 miles of Furnace Creek. These include Wildrose Ranger Station (22 miles SW of Furnace Creek, elevation 4100′, 1971 to 2000 normals used here); Amargosa Farms-Garey (25 miles to the ENE, elevation 2450′ in Nye County, NV); Desert Rock AP (48 miles ESE, elevation 3301′); and Beatty 8N (40 miles north, elevation 3550′). There are very few stations within 75 miles of Furnace Creek to its southeast, south and southwest. Besides Wildrose RS, only Pahrump (elevation 2674′, 52 miles to the ESE of Furnace Creek) and Trona (elevation 1695′, 56 miles to the southwest) are within 75 miles in or near the southern quadrant. There are vast, empty tracts of land in Death Valley National Park and surrounding areas without available long-term weather data. These include the Panamint Valley, the Saline Valley, the Eureka Valley, the Fort Irwin National Training Center, and the China Lake Naval Weapons Center. The main message here is that the stations included are scattered over a huge chunk of both eastern California and southern Nevada, covering parts of the Great Basin and Mojave Desert regions. The region is very arid with hot summers and cool to cold winters.
The graph for JJA (average daily maximums versus elevation for 1981-2010) shows temperatures ranging from nearly 114F at Death Valley/Furnace Creek (elevation -194′) to about 86F at Goldfield, NV (elevation 5690′). A “best-fit” line was drawn through the points (6000’/85F) and (0’/111F). Most of the values lie within a degree or so of the line, which slopes at a rate of 4.33 degrees (F) per 1000 feet. Stations to the right of the line are generally those in basins and/or with less-than-optimal exposure, with likely some localized midday warming around the instruments on sunny afternoons. Examples are Independence, Silverpeak, and Death Valley. Stations to the left of the line by more than one degree are generally those with excellent exposure to the wind, especially those elevated above surrounding terrain; or, perhaps, stations above grass and/or in locally cool areas due to nearby water sources and vegetation. Examples are Randsburg, Beatty 8N, and Barstow FS.
Similarly, a graph for July-only “normal” daily maximums for 1981-2010 was prepared, and a “best-fit” line was “eye-balled” and drawn through the data points. The line passes close to 114F at sea level, and near 88F at 6000 feet. This gives a slope of 4.33 degrees (F) per 1000 feet. For well-exposed places in the Death Valley region, above a natural desert surface, near the bottom of their basin or valley (in other words, not a place at or near a mountaintop or ridge), the average daily maximum temperatures in July by elevation are estimated to be as follows:
sea level/0′ 114F
1000′ 109.5F
2000′ 105.5F
3000′ 101F
4000′ 97F
5000′ 93F
6000′ 88.5F
At the bottom of Death Valley, at 280 feet below sea level, the average daily maximum temperature for July is estimated to be 116F. The average maximum at a “perfect” well-exposed station near Furnace Creek, not affected by structures or cooling effects of vegetation, would be just a little cooler, around 115.5F. (As discussed in Part 2, it appears that an increase in vegetative growth, and perhaps buildings and pavement, near the current Death Valley station site, has contributed to a “less-than-natural” increase in summertime maximum temperatures in the past couple of decades. The 30-year normal maximum for July at Death Valley/Furnace Creek increased from 114.3F for 1961-1990 to 116.5F for 1981-2010. Thus, current maximum temperature reports from the official Death Valley cooperative weather station in summer are thought to be “inflated” by a degree or two.) For places in Death Valley near 1000 feet in elevation, and at the bottom of both the Panamint Valley and the Saline Valley, both near 1100 feet, the average daily maximum temperature in July is approximately 109.5F. Again, this is for very well-exposed spots above a natural, dry, desert surface. Places above bare ground that are wind-sheltered to some degree by nearby terrain, or structures, and/or thick and tall vegetation would be a little warmer.
Average maximums at basin stations in the Death Valley region change with elevation at a rate “less” steep than the dry adiabatic lapse rate. With such good mixing and strong low-level convection on practically every July afternoon region-wide, why is the observed lapse rate of the average maximums about a full degree-per-1000 feet smaller, or less steep? It may be that a less-dense boundary layer warms more readily immediately above dry and sun-baked surfaces.
Figures 3-25 and 3-26 (above) — average annual maximum temperatures versus elevation for long-term temperature stations in the Death Valley region
Similar to that for average July maximums versus elevation, a plot of average annual maximum temperature against station elevation shows a very close correlation between the two. The average annual maximum temperature for a station in the region is approximately nine degrees warmer than its average daily maximum temperature for July. At an elevation of sea level, the average annual maximum temperature in the region is approximately 122.5F, and at an elevation of 6000 feet it is about 97.5F (slope=4.2 deg F/1000 feet):
Average annual maximum temperature by elevation in the Death Valley region:
sea level/0′ 122.5F
1000′ 118F
2000′ 114F
3000′ 110F
4000′ 106F
5000′ 102F
6000′ 97.5F
It should be reiterated here that these approximations are for well-exposed, well-ventilated places above a typical, dry, desert surface. Based on the frequency analysis of annual maximums discussed earlier, one can expect the annual maximum at any particular station to be plus-or-minus two degrees from the average annual maximum about two-thirds of the time, and plus-or-minus four degrees from the annual average for approximately 95 percent of years.
RECORD MAXIMUM TEMPERATURES VERSUS ELEVATION IN THE DEATH VALLEY REGION
Figures 3-27 and 3-28 (above) All-time record maximum temperature versus elevation for long-term stations in the Death Valley region
The figures above plot all-time maximums versus elevation. A few maximum temperature records which appear untrustworthy or problematic were dismissed, such as the 134F at Greenland Ranch in 1913 and the 108F at Goldfield, NV.
Most importantly, when a “best-fit” line is drawn through the data points, the line easily fits within a few degrees Fahrenheit of each station. This, despite the great distances involved in the region and the disparities of station locations and exposures and ground surfaces and periods of record. Note that the maximums plotted for Cow Creek (126F), Greenland Ranch (127F) and Death Valley (129F) are the “trustworthy” all-time record maximums for each site. Cow Creek (128F) and Greenland Ranch (129F in July, 1960 and 129F to 134F in July 1913) have reported higher temperatures which are suspect.
Afternoon temperatures in summer in the Death Valley region are determined, or “controlled largely,” by elevation and the temperature aloft (i.e., the temperature from about 850 mb to 650 mb). Typical, sunny summertime weather is characterized by excellent mixing between the surface and low-to-mid levels of the troposphere. Afternoon temperature soundings (at Desert Rock and Las Vegas) show a decrease in temperature with height at a rate at or very near the dry adiabatic lapse rate from the surface to altitudes above 10,000 feet. Thus, it follows that average maximum temperature differences at stations in summer are almost entirely a function of elevation difference. Local influences, local ground cover differences, and differing exposure conditions topographically and at the weather station (among other things!) can and do result in minor non-comformity, of course. But, for the most part, one can expect to find that maximum temperatures decrease by about 5 degrees (F) in the Mojave Desert and Death Valley region in summer for every increase of 1000 feet in elevation. Naturally, this relationship works best for stations in close proximity. But, since mid-level temperature (for instance, the temperature at the 600 millibar level) changes little over vast areas during summer’s hot spells, the temperature/elevation relationship is remarkably good even for stations separated by 100 to 150 miles on the hottest afternoons.
This section compares Death Valley maximum temperatures in summer with those at the closest temperature stations operating in July 1913. Unfortunately, the closest stations to Greenland Ranch back in 1913 were not very close! There were a handful of temperature stations open north-northwest of Furnace Creek, in southern Esmeralda County, NV, in 1913. These were around Lida, about 80 miles from Furnace Creek. However, these were relatively short-lived stations in mining towns which soon went bust. The closest long-term station to the north of Furnace Creek that was operating in 1913 was Tonopah, about 115 miles distant. To the east and southeast, the closest stations were Las Vegas and Jean, both about 95 miles from Furnace Creek. About 170 miles to the southeast was the long-term station at Needles, CA, and 110 miles to the south was Barstow. Mojave had a station at the railroad depot in 1913, 125 miles southwest of Greenland Ranch and Furnace Creek. The closest stations to Furnace Creek in 1913 were those in the Owens Valley, to the west and northwest. The station at Lone Pine was only 65 miles west of Furnace Creek, but at Independence was a long-term station manned by the U.S. Weather Bureau. Independence is 75 miles west-northwest of Furnace Creek, and we’ll compare Death Valley maximums with those at Independence first.
INDEPENDENCE AND GREENLAND RANCH
A cooperative weather station was operating in the town of Independence, in the Owens Valley, as early as 1893. By the time that the Greenland Ranch station was established, the Independence station observer was the U.S. Weather Bureau. The Weather Bureau abandoned Independence around 1917, but a cooperative station has continued in town for nearly all of the 96 years since then.
Average maximum temperatures at Independence in summer have increased markedly since the station opened in the late 19th Century. The diversion of Owens River water to Los Angeles, beginning in 1913, left little water for ranching and farming in the basin. Owens Lake and Owens Valley dried considerably, leading to hotter summers. In addition, the station’s thermometer shelter was over grass in the early days, but has recently been at much warmer locations in town, well removed from lawns and moist surfaces.
In the Climatic Summary of the United States, with data through 1930, Independence showed a length of record of 33 years and Greenland Ranch had a length of record of 20 years. Here are the average maximum temperatures for May through September at Independence and Greenland Ranch, and the differences:
Average maximum temperature through 1930
Independence/Greenland Ranch/Difference
May 77.4 99.1 21.7
June 87.7 110.4 22.7
July 93.6 116.4 22.8
Aug 91.2 113.7 22.5
Sept 83.8 105.5 21.7
Maximum temperature differences between the two stations averaged approximately 22 degrees for the summer months.
The average maximums in summer at Independence are about six degrees warmer in the latest 30-year normal period. Here are the 30-year normals for 1981-2010 and for 1961-1990 for May through September:
Independence, CA, normal maximum temperature
1981-2010/1961-1990
May 84.1 82.3
June 93.6 91.6
July 99.8 97.7
Aug 97.6 95.7
Sept 90.3 88.5
Like Death Valley, summer maximums have increased at Independence according to the latest 30-year normal. The summer months from 1991 to 2010 averaged about three full degrees warmer than the summer months from 1961 to 1980. (The ten-year period from 1981 to 1990 overlaps on these 30-year normals, so the difference of two degrees between the two 30-year periods equates to a three degree difference between the two 20-year periods which do not overlap.) The hotter summertime maximums at Independence since the 1980s mimic the trend at Death Valley. However, I am not familiar enough with the history of the weather station locations and environments at Independence to determine how much might be due to station exposure, ventilation, local vegetation, ground-cover changes, etc.
Now compare the latest summer normals in maximum temperature at Independence and Greenland Ranch:
Average maximum temperature (1981-2010)
Independence/Death Valley/Difference
May 84.1 99.1 15.0
June 93.6 110.4 16.8
July 99.8 116.4 16.6
Aug 97.6 113.7 16.1
Sept 90.3 105.5 15.2
The difference in average maximum temperature between Independence and Death Valley in summer has narrowed from about 22 degrees prior to 1930 to about 16.5 degrees for 1981 to 2010. Independence is at an elevation of 3950 feet, or about 4125 feet higher than Furnace Creek in Death Valley. Given a dry adiabatic lapse rate of 5.4 degrees (F) per 1000 feet, one would expect (assuming similarly sited, well-exposed weather stations) that the Independence area should average about 22 degrees cooler than the Furnace Creek area. The early years showed an average difference of 22 degrees in summer. The smaller difference in recent decades is probably due to rather inadequate siting of the temperature equipment at Independence, in spots where ventilation is poor and local low-level heat buildup on summer afternoons is the norm.
Tables 2-6 and 2-7 show the annual maximums for the period of record at both Independence and Greenland Ranch/Death Valley.
Table 2-6 is for the period from 1891 to 1944, and includes the 122F maximum recorded at Harrington’s temporary station at Furnace Creek in 1891. Annual maximums at Independence were generally within a few degrees of 100F from 1892 to about 1915. From 1915 to 1944, annual maximums were generally within a few degrees of 103F. The 109F at Independence in 1934 is a slight outlier on table 2-6, but the Owens Valley was gradually drying and warming during the 1920s and 1930s and annual maximums were trending upward. Independence reached 103F in July, 1913. This was on the 10th, the same day as the 134F report at Greenland Ranch. The annual maximum of 103F at Independence in 1913 is not abnormally high compared to other annual maximums during its first 20 to 30 years of record; it is only a couple of degrees warmer than the average annual maximum for Independence from 1892 to 1920. Greenland Ranch’s annual maximum of 134F in 1913 is about ten degrees warmer than the average annual maximum for the first 30 years of record at Greenland Ranch.
Table 2-7 shows the annual maximums from 1945 to 2013, with a 9-year running average of the annual maximums (centered on the year given). At Independence, the 9-year running average is near 105F for the 1950s and 1960s, and gradually rises to around 110F for 1999 to 2009. A handful of days since 1972 have reached 112F to 114F. Temperatures near 115F are quite uncommon for any locations at or near 4000 feet in elevation. Again, the siting of the Independence weather instruments is likely responsible for a few extra degrees of warmth on most sunny summer afternoons compared to nearby locales with excellent exposure to the wind. It is indeed noteworthy that the annual maximums at Independence have increased nearly ten degrees (F) in 100 years!
Table 2-8 (above) provides a look at the differences in annual maximum temperatures (from 1911 to 1953) between Greenland Ranch and Independence (and between Greenland Ranch and Tonopah, NV). Except for 1913, 1914, and 1915, the annual maximum at Greenland Ranch was never more than 24 degrees higher than that at Independence. Typical differences during the first 30 years of record at Greenland Ranch were from 20 to 23 degrees, about what would be expected at two basin-bottom stations with an elevation difference of about 4125 feet. Of course, what is important to note here is that the differences in annual maximums are consistently about 20 to 23 degrees every year through the early 1940s, and the 31-degree difference in 1913 is an outlier. Independence had several annual maximums of 103F to 106F from 1916 through the 1920s, but Greenland Ranch was never again warmer than 127F. If Greenland Ranch had eight legitimate maximums ranging from 127F to 134F in July 1913, then why was Independence ONLY 103F?
Let’s look at average monthly maximums for July at Greenland Ranch and Independence. We have seen that the average maximums for the summer months for the two stations differed by about 22 degrees through 1930. Table 2-9 (below, left) graphs the average daily maximum temperatures for all Julys from 1901 to 1935 at Independence and Greenland Ranch:
The plots for both stations mimic each other fairly well on the ups and downs from July to July, though from July 1912 to July 1913, Greenland Ranch jumps up more than five degrees, while Independence changes little. Ironically, July 1913 is one of the coolest Julys at Independence during this 35-year period. Table 2-10 (above, right) shows the differences in average daily maximum temperature for each of these Julys at the two stations. The general trend is downward. Differences were as high as 25 to 27 degrees during the “Denton years” at Greenland Ranch, especially 1913 to 1917. After 1917, the average differences in maximum temperature for July were within a degree or two of 20, for the most part.
The rather drastic drying and warming of Owens Valley during the 20th Century, and the station changes for the weather equipment in Independence, combined with any observer errors and/or shenanigans at Greenland Ranch, make it a bit difficult and hazardous to confidently explain some of the temperature differences between the two places through the years. The ultimate goal in this study is to show the untrustworthy nature of the Greenland Ranch maximums in July 1913. The temperature data for the first two summers at Greenland Ranch (1911 and 1912) appear relatively problem-free. And, the Weather Bureau in Independence was operating a stable and reliable station in town from 1911 to 1913. Thus, a close comparison of daily maximum temperatures during the summers of 1911, 1912, 1913 and a perhaps a bit thereafter should be fairly straightforward and unproblematic. The following discussion scrutinizes the Greenland Ranch maximums versus the (presumably) trustworthy and “stable” daily data from Independence.
Table 2-11 (below) gives the monthly maximum temperatures at Independence and Greenland Ranch from June to December, 1911 (the first observation at Greenland Ranch was at 5 p.m. on June 8, 1911):
Maximum temperatures (F) by month for June to December, 1911, at Independence and Greenland Ranch (and difference)
Jun 96 120 (24)
Jul 96 122 (26)
Aug 100 122 (22)
Sep 96 118 (22)
Oct 81 100 (19)
Nov 72 90 (18)
Dec 63 80 (17)
Differences in monthly maximums for the warm season months ranged from 22 to 26 degrees in 1911. Cool season differences are a little lower, as low-level mixing in winter is probably a little better in the Owens Valley compared to Death Valley.
The four charts below (Tables 2-12 to 2-15) plot daily maximums at Independence and Greenland Ranch for JJA of 1911, 1912, 1913 and 1914.
Note that the temperature scale varies somewhat from year to year. Included is a 5-day running average for daily maximum temperature (centered on the third day). It is clear that maximums in Death Valley and the Owens Valley trend similarly day-to-day and week-to-week during the summer, despite their 70-mile separation.
The four charts above (Tables 2-16 to 2-19) give the frequency distribution of the daily maximum temperature differences between Independence and Greenland Ranch for the four summers (JJA/June July August) from 1911 to 1914. For instance, on 20 days during June, July and August of 1912, the maximum temperature reports differed by exactly 22 degrees (F). (Observations at Greenland Ranch began on June 8, 1911, so there are only 85 days of data for 1911 compared to 92 days each for the next three years.) Keep in mind that the time of observation was not the same: Independence observed at midnight, and Greenland Ranch at 5 p.m. local time. Since 5 p.m. is so close to the warmest time of the day —- typically only one to three hours after the maximum temperature is reached (if that!) —- Greenland Ranch will from time-to-time report a maximum temperature which is higher than that actually reached on that date. I.e., days which are cooler than the day prior at Greenland Ranch might show a maximum temperature which reflects the temperature at or around observation time the day before. If a cold front, or a storm, or a switch from clear skies to thick cloudiness (as examples) affects the region during the daytime hours, that day’s maximum at Independence will nearly always reflect cooler conditions, while Greenland Ranch would not. Greenland Ranch’s maximum thermometer will still be stuck on yesterday’s reading taken around 5 p.m. The late afternoon observation time occasionally causes greater maximum temperature differences between Greenland Ranch and Independence. Since the “set max” temperature was entered by the observer at Greenland Ranch from 1911 to 1914, it is possible to determine which days might have “previous day” maximums. It is also possible, since the 5 p.m. observation time at Greenland Ranch is relatively close to the hottest part of the day, that the maximum temperature report there winds up a little short if it gets even hotter after 5 p.m. Such are the hazards to keep in mind when daily maximum temperatures are compared.
Independence versus Greenland Ranch, 1911
During the summer of 1911, Greenland Ranch maximums averaged about 24 degrees warmer than those at Independence, CA:
Average Max Temp and Difference, summer 1911
June/G.R. 111.9/Ind 87.3/Diff 24.6 (June 8 to 30 only)
July/G.R. 117.0/Ind 92.6/Diff 24.4
Aug/G.R. 115.6/Ind 92.8/Diff 22.8
For JJA of 1911 (Table 2-16), all but four days had differences in maximum temperature from 19 to 29 degrees. On June 13, the maximum at Independence was 83F and at Greenland Ranch was 115F, for a difference of 32 degrees, the largest for the three summer months. The maximum of 83F at Independence was down from 96F on the day prior, and 0.09″ of rain occurred on the 13th. At Greenland Ranch, the maximum on the 13th was 115F, but the “set max” temperature (around 5 p.m., presumably) was only 98F. The observer, Thomas Osborn, noted cloudy skies and a north wind for the 13th. If we check the observation for the 12th, we see that the 115F maximum temperature for the 13th almost certainly occurred on the previous afternoon, probably shortly after the observer reset the thermometers. Greenland Ranch had a maximum of 120F on the 12th and a “set max” of 113F. Given the “set max” temperature of 98F on the 13th, the actual daytime maximum temperature (after a low of 89F) at Greenland Ranch was probably around 102 to 106F, well below the 115F report. The difference between Independence and Greenland Ranch on high temperature on June 13th was likely about 22 degrees.
The next greatest difference for JJA 1911 is 29 degrees, on four occasions. On June 23, Independence had 82F, down from 84F the day prior. Greenland Ranch had 111F on the 23rd, the same as the day prior. The 5 p.m. “set max” temperature at Greenland Ranch was 109F on the 22nd and 101F on the 23rd, which strongly suggests that the 111F report for the 23rd was from the previous day. The “real” difference in maximum temperature between Independence and Greenland Ranch on June 23rd was likely less than 29 degrees. It is likely that a handful of the other differences of 26 to 29 degrees are a bit inflated due to “previous-day maximums” at Greenland Ranch. Regardless of these issues, for the summer of 1911, about 90 percent of the daily differences in maximum temperature between Independence and Greenland Ranch ranged from 20 to 28 degrees.
On the hottest summer days, the 5 p.m. time of observation at Greenland Ranch and “previous-day maximum” effect is usually not an issue, or at least not a big factor, when comparing maximums in the region. Let’s look at some of the hottest periods during the summer of 1911, and the differences in maximum temperature between Independence and Greenland Ranch.
June 10-12
G.R. 115, 117, 120; Ind 92, 94, 96; Diff 23, 23, 24
June 26-28
G.R. 115, 116, 116; Ind 92, 92, 90; Diff 23, 24, 26
July 3-8
G.R. 117, 118, 119, 120, 121, 120; Ind 94, 94, 96, 96, 96, 94; Diff 23, 24, 23, 24, 25, 26
July 14-17
G.R. 122, 119, 119, 120; Ind 96, 96, 96, 91; Diff 26, 23, 23, 29
July 20-21
G.R. 117, 119; Ind 94, 90; Diff 23, 29
July 25-26
G.R. 120, 117; Ind 91, 92; Diff 29, 25
Aug 7-9
G.R. 118, 117, 119; Ind 94, 94, 92; Diff 24, 23, 27
Aug 17-20
G.R. 120, 121 120, 122; Ind 97, 100, 98, 96; Diff 23, 21, 22, 26
Sept 1-2
G.R. 118, 117; Ind 96, 88; Diff 22, 29
For these 29 days, the differences in maximum temperature range from 21 to 29 degrees and the median value is 24 degrees. More than half of the differences were 23 or 24 degrees. (Of the four differences of 29 degrees, three are at the end of the hot spell and it is possible that these are inflated a little due to previous-day maximums at Greenland Ranch.) On the hottest summer days, with the typical clear to mostly clear skies and good mixing in the region, afternoon temperatures decrease with increasing elevation at a rate of about 5.4 degrees per 1000 feet, the same as the dry adiabatic lapse rate. The 4125-foot elevation difference gives Greenland Ranch a 23-degree advantage due to compression. The maximums for the hottest days during the summer of 1911 at Greenland Ranch and Independence, and the daily temperature differences, are close to that which would be expected based only on the difference in elevation between the two stations.
Independence versus Greenland Ranch, 1912
During the summer of 1912, Greenland Ranch maximums averaged about 22 degrees warmer than those at Independence, CA:
Average Max Temp and Difference, summer 1912
June/G.R. 109.5/Ind 86.5/Diff 23.0
July/G.R. 110.7/Ind 89.3/Diff 21.4
Aug/G.R. 111.4/Ind 90.5/Diff 20.9
Table 2-17 shows the frequency distribution of the differences in daily maximum temperatures between Greenland Ranch and Independence for June, July and August of 1912. The distribution is similar to that for 1911, with a bit of a shift towards smaller values. At least 90 percent of the differences range from 17 to 27 degrees, and 50 of the 92 differences are from 20 to 23 degrees. Let’s take a look at the maximum temperature differences on the hottest days during the summer of 1912. We’ll start with the last several days of May, 1912, when Greenland Ranch hit an all-time May record of 120F.
Maximums at Greenland Ranch and Independence, May 26 to May 31, 1912:
G.R./97, 103, 110, 120, 110, 107
Ind/76, 85, 90, 92, 84, 87
Diff/21, 18, 20, 28, 26, 20
The Greenland Ranch form indicates a north wind on the 28th and a south wind on the 29th and 30th. The Independence form shows clear skies for all six days. The sudden jump to a 28-degree difference between the two stations on May 29th is a bit curious. The maximum of 120F on May 29, 1912, is the hottest temperature on record at Greenland Ranch for its 49 Mays from 1912 to 1960. (The Death Valley station broke this record with a 122F maximum on May 30, 2000.) The 5 p.m. “set max” readings during this period cast some doubt upon the 120F reading on the 29th. Here are the max/min and “set max” observations at Greenland Ranch from May 26 to May 31:
26) 97/64 set max 92
27) 103/68 set max 96
28) 110/73 set max 97
29) 120/69 set max 102
30) 110/75 set max 99
31) 107/74 set max 95
Note the changes in the differences between the 5 p.m. “set max” temperature from the day’s maximum temperature. On a typical hot, sunny and breezy afternoon at Furnace Creek in late May, the high temperature for the day is during the mid-afternoon, around 3 p.m., and by 5 p.m. the temperature is normally a few degrees cooler than the maximum temperature for the day. The differences of five and seven degrees on May 26 and May 27 are reasonable, but the differences of 13, 18, 11 and 12 degrees on the final four days of the month are quite a bit higher than expected. It is possible, or perhaps probable, that the observer did not take the readings until later in the evening, giving the lower “set max” temperatures. If the 5 p.m. “set max” temperatures are indeed the actual 5 p.m. temperatures, then the maximum temperature of 120F on the 29th is very suspect.
Below are the maximum temperatures at Greenland Ranch and Independence, and the differences, during the hottest periods of the summer of 1912:
June 2-6
G.R. 115, 116, 119, 120, 118; Ind 95, 97, 97, 94, 93; Diff 20, 19, 22, 26, 25
June 27-29
G.R. 114, 115, 114; Ind 90, 90, 85; Diff 24, 25, 29
July 8-11
G.R. 114, 115, 117, 118; Ind 92, 97, 94, 94; Diff 22, 18, 23, 24
July 20-21
G.R. 117, 115; Ind 94, 94; Diff 23, 21
July 26-27
G.R. 115, 117; Ind 92, 94; Diff 23, 23
August 5-9
G.R. 115, 117, 118, 120, 118; Ind 95, 97, 100, 98, 96; Diff 20, 20, 18, 22, 22
August 23-26
G.R. 117, 116, 117, 115; Ind 96, 94, 95, 90; Diff 21, 22, 22, 25
The summer of 1912 was remarkably cool at Greenland Ranch. The high temperature was 120F (in May, June and August), and a high of only 118F in July. The average maximum at Greenland Ranch in July and August was about 4 to 5 degrees below normal. On the hottest days, Greenland Ranch maximums were typically 20 to 25 degrees warmer than those at Independence. The median value of the 31 sample hottest days listed above (including those in late May) is 22 degrees. As was the case during the summer of 1911, the maximum temperature differences on the hottest days during the summer of 1912 correlate closely with the 22 to 23 degrees that would be expected due to the difference in elevation.
Independence versus Greenland Ranch, 1913
The Greenland Ranch monthly weather forms were signed by Oscar Denton beginning in September, 1912, and he was the station observer through February 1921. In 1911 and 1912, the differences in average daily maximum temperature during the summer months between Independence and Greenland Ranch were roughly from 21 to 25 degrees. The greatest temperature differences between the two stations on a daily basis were about 30 degrees, but these were sometimes due to “previous-day maximums” at Greenland Ranch, and were infrequent. During the summer of 1913, daily temperature differences of 30 were NOT infrequent. Here are the average daily maximums at Greenland Ranch and Independence from April through September, 1913:
Average Max Temp and Difference, summer 1913
April/G.R. 96.2/Ind 68.6/Diff 27.6
May/G.R. 103.4/Ind 77.6/Diff 26.8
June/G.R. 110.0/Ind 82.0/Diff 29.0
July/G.R. 116.5/Ind 89.5/Diff 27.0
Aug/G.R. 116.5/Ind 87.9/Diff 28.6
Sept/G.R. 107.4/Ind 83.5/Diff 23.9
The differences in average maximum temperature between Independence and Greenland Ranch jump up considerably during the summer of 1913. Whereas average differences were around 22 to 24 degrees during the previous two summers, they jump up to 27 to 29 degrees in 1913. Table 2-18 gives the frequency distribution of the differences in maximum temperature between the two stations for June, July and August of 1913. About 33 percent of the days show differences of 30 degrees or more! Fifty-seven of the 92 differences range from 25 to 30 degrees, and the median value of the differences is 28 degrees. The increase compared to 1911 and 1912 is about five degrees. What is the reason for this? There were no official changes in the weather stations or the equipment. The Independence station was operated directly by U.S. Weather Bureau employees during 1913, so the temperature data there can, presumably, be considered trustworthy. Let’s look closely at daily maximums, beginning in February, 1913.
February, 1913, was wet, with 2.74″ measured at Independence and 1.90″ at Greenland Ranch. A warm spell mid-month separated two wet periods. Here are the maximums (F) from February 10 to 18 at Greenland Ranch and Independence, respectively, with the difference (in parentheses):
Feb 10) 72, 58 (14)
11) 80, 60 (20)
12) 82, 60 (22)
13) 76, 60 (16)
14) 74, 65 (9)
15) 86, 67 (19)
16) 90, 64 (26)
17) 79, 65 (14)
18) 78, 45 (33)*
(*) previous-day maximum at G.R.
Skies were clear at both stations for the entire 9-day stretch. The maximum at Greenland Ranch jumped up from 74F on the 14th to 90F on the 16th, while decreasing at Independence from 65F to 64F. The low midday sun angles of winter do not promote the deep mixing which is the norm during the summer, so maximum temperature differences are, not surprisingly, less consistent between the two stations during this time of the year. Still, the jump to the 26-degree difference on February 16th is curious. On the 18th, the maximum at Independence plummets to 45F, while Greenland Ranch reported 78F, which was the “set max” temperature there on the 17th. The “set max” temperature at Greenland Ranch on the 18th was 72F.
March, 1913, was primarily clear and dry at Greenland Ranch (0.10″ of rain for the month) and there were a few very warm periods. Here are the maximums, and differences (in parentheses) at Greenland Ranch and Independence for a handful of the warmest periods during March, 1913:
6) 89, 64 (25)
7) 86, 64 (22)
8) 87, 66 (21)
9) 88, 64 (24)
10) 89, 62 (27)
—
17) 90, 68 (22)
18) 90, 54 (36)
19) 95, 56 (39)
20) 82, 55 (27)
—
29) 89, 73 (16)
30) 93, 78 (15)
31) 98, 77 (21)
My mid-to-late March, sun angles are high enough over the region midday to promote much better mixing between the surface and low-to-mid levels of the troposphere compared to mid-winter. Also, general atmospheric circulation is typically strong during the spring, which significantly helps the mixing process which would support maximum temperature differences of about 22 degrees between Independence and Greenland Ranch on sunny, warm days in March. Through 1930, the average maximum temperature at Greenland Ranch for March was 80F, and at Independence was 62F. The differences in maximum temperature on the warmest days in March, 1913 (listed above) appear reasonable, except for the period from the 17th to the 20th. Greenland Ranch shows 90F for both the 17th and 18th (“set max” temperature of 84F and 85F on these two days), while Independence maximum temperature drops considerably from 68F to 54F. Even stranger, Greenland Ranch jumps up to 95F on the 19th, while Independence remains in the mid-50s with 56F. The difference on the 19th is 39 degrees. Greenland Ranch indicated clear skies during this period, while Independence reported partly cloudy skies with 0.02″ on the 18th. The “set max” temperature on March 19th at Greenland Ranch was 88F, but the maximum temperature observation for the 20th is only 82F. There are several instances during the first few months of 1913 where the “set max” temperature from the previous day is warmer than the high temperature report for the current day. Of course, a 24-hour maximum temperature can not be lower than the “set max” temperature observation at the beginning of the 24-hour period. It appears that the observer ignored, or was unaware of, proper observing procedure on occasion. As for the 39-degree difference in maximum temperature on March 19th, it seems a bit extreme (but not totally out of the question). Given the season, the distance between the locales, and the markedly different weather that sometimes exists across the region from the Eastern Sierra to the deep basins east of there, a legitimate 39-degree difference might occur on rare occasions. Of course, another possibility is that the observer at Greenland Ranch, Oscar Denton, manipulated the maximum temperature measurements or observations in some fashion, resulting in bogus, inflated maximums.
Maximums in April, 1913, differed by an average of 27.6 degrees, compared to the long-term average difference (through 1930) of 20 degrees for April at Independence and Greenland Ranch. The average maximum at Greenland Ranch in April 1913 was 96.2F, compared to the 1912-1930 average of about 90F. The average maximum at Independence in April 1913 was 68.6F, compared to the average of about 70F (for 33 Aprils through 1930).
April 1913 was dry, and about 18 days were clear at both stations. Here are the daily maximum temperatures at Greenland Ranch and Independence, and the difference (in parentheses) for the warmest periods during April 1913:
1) 97, 74 (23)
2) 100, 62 (38)
3) 95, 59 (36)*
—
8) 90, 68 (22)
9) 100, 68 (32)
10) 96, 70 (26)
11) 96, 72 (24)
12) 99, 72 (27)
13) 98, 66 (32)
14) 93, 52 (41)*
—
20) 92, 66 (26)
21) 103, 70 (33)
22) 98, 78 (20)
23) 101, 75 (26)
24) 99, 78 (21)
25) 109, 78 (31)
26) 105, 84 (21)
27) 108, 80 (28)
28) 105, 76 (29)*
The asterisk (*) indicates that the Greenland Ranch maximum is likely from the previous day, based on the “set max” temperature.
Five of the days listed above show maximum temperature differences of 30 degrees or more (that are not due to previous-day maximums at Greenland Ranch). Again, the “normal” difference in high temperature between the two stations is about 20 degrees, and the difference in elevation would suggest a difference of only 22 or 23 degrees. What caused these excessive differences?
Moving on to May, 1913, the average maximum at Greenland Ranch was 103.4F, about four degrees above normal. The average maximum at Independence was 77.6F, nearly the same as the normal through 1930 (77.4F). Here are the maximums at Greenland Ranch and Independence (and the difference, in parentheses), for the warmest periods during May 1913:
3) 90, 73 (17)
4) 110, 78 (32)
5) 104, 80 (24)
6) 102, 80 (22)
—
16) 104, 84 (20)
17) 110, 84 (26)
—
22) 111, 88 (23)
23) 114, 89 (25)
24) 113, 89 (24)
25) 120, 89 (31)
26) 115, 84 (31)*
(*) Greenland Ranch maximum likely a previous-day maximum
May 1913 was mostly clear and dry until the last six days, which were partly cloudy with some rain at Independence. Though maximum temperature differences “normally” differ by about 22 degrees between Independence and Greenland Ranch, based on averages through 1930, differences during the warmest periods of May 1913 were primarily 24 to 32 degrees.
For June, 1913, the average maximum at Greenland Ranch was 110.0F, about the same as its 20-year average through 1930 (110.4F). The average maximum at Independence was 82.0F, nearly six degrees cooler than its average of 87.7F through 1930. Differences in maximum temperature averaged a very uncharacteristically high 28 degrees for the entire month! By comparison, the average difference in June 1911 was 24.6 degrees and in June 1912 was 23.0 degrees. Why was Greenland Ranch near normal on average maximums while Independence was six degrees below normal? Other surrounding stations had below-average maximums in June 1913 (compared to averages through 1930):
Barstow, 90.9F, 4.9 degrees below “normal”
Needles, 99.2F, 4.4 degrees below “normal”
Las Vegas, 93.2F, about 5.5 degrees below “normal”
Tonopah, 72.3F, about 5.7 degrees below “normal”
(“Normal” is in quotation marks because these are long-term averages, and not standard 30-year normals.)
Average maximums at five of the closest surrounding stations were decidedly below normal for June 1913, while Greenland Ranch was near normal. Can the Greenland Ranch maximums be trusted? Since this is the month prior to July 1913, with its record 130F-plus reports, it is prudent to examine the entire month closely. Tables 2-20 and 2-21 (below) compare the Greenland Ranch maximums during June 1913 with those at five of the closest, long-term stations in the region:
Independence had small rain amounts on the 1st, 2nd, 3rd and 9th of June 1913. Greenland Ranch reported 0.00″ of precipitation for the month. On the 9th and the 10th at Greenland Ranch, the maximum temperatures (103F and 92F, respectively) are lower than the “set max” temperatures provided on the 5 p.m. observation for the previous afternoon (104F and 98F on the 8th and 9th, respectively). The “set max” temperatures at Greenland Ranch in June 1913 are, for the most part, 3 to 10 degrees lower than the maximum temperature readings for the day. These are values that would be expected here when observations are taken between about 5 and 7 p.m. Six of the “set max” readings late in the month are more than ten degrees cooler than the maximum temperature for the day, up to 16 and 17 degrees in two instances, which suggests that the observer was taking the observation well into the evening hours on occasion.
The average maximum and minimum values for Greenland Ranch in June, 1913, were 110.0F and 74.9F. This gives an average daily temperature range of 35.1 degrees for the month. June 1911 (23 days, June 8 – 30) had an average daily temperature range of 36.2 degrees (111.9-75.7F), while June 1912 had 38.5 degrees (109.5-71.0F). These are amazingly large daily range values as compared to the most recent normals for June at Death Valley. The latest 30-year normals (1981-2010) for June at Death Valley are 109.9F and 81.2F, giving an average daily range of 28.7 degrees. The averages at Greenland Ranch through 1930 were 110.4F and 77.6F, for a 20-year average daily range of 32.8 degrees for June. It is clear that average daily ranges have diminished substantially (for June, at least) at Greenland Ranch since the first few Junes on record. And, it is not the average maximum temperature which changed much. Minimum temperatures were much cooler during the first few years of record at Greenland Ranch because the thermometer shelter was “over alfalfa sod” (Willson, MWR, 1915). By the mid-1920s, the shelter was over bare ground but adjacent to cultivated land, and not too long afterward there was no cultivated land or grass in the immediate vicinity of the weather instruments. Warm to hot and dry air which moves over a moist field or grassy area will cool substantially. At night, when winds are light, air a few feet above a cultivated field can be 5 to 10 degrees or more cooler than the ambient air nearby that is not affected by the cooling evaporation and transpiration. With the Greenland Ranch instrument shelter above sod during the first few years of operation, it allowed summertime minimum temperature readings to be considerably cooler comparably. June minimums warmed after 1913, suggesting that the shelter was not affected by irrigated, cultivated land to the degree it was from 1911 to 1913, and average daily ranges declined.
It is important to keep in mind that the relatively low minimums during June 1913, and into July, strongly support the understanding that the thermometer shelter was still above moist, cultivated sod —- as placed there two years earlier when the station was established.
The greatest daily ranges at Greenland Ranch in June 1913 would be on bright, dry, clear and sunny days with light winds. Weak winds during the hours before sunrise would allow a shallow radiation inversion to form along the bottom of the basin and at Greenland Ranch. The moist environment around the shelter would effectively cool the air that is wafting around the shelter even further. On nights with active winds and no chance for shallow surface inversion development, the minimum temperature will remain relatively high, perhaps 10 to 20 degrees warmer than on calm and clear nights with strong, shallow inversions. Windy and cloudy weather promotes narrow daily ranges, while clear and calm conditions promote larger daily temperature ranges. This is important to note, as it might seem that relatively high minimums might be associated with relatively high maximums, and vice versa. But this is not necessarily the case. The minimum temperature for the day is not a very good predictor for the maximum temperature for the day at Greenland Ranch, especially without knowing the overnight cloud cover, humidity, wind behavior, etc.
Table 2-20 (above) provides the daily maximum temperatures for each day in June, 1913, at (top to bottom, generally) Greenland Ranch, Needles, Las Vegas, Barstow, Independence, and Tonopah. A quick look at the chart indicates that the maximum temperatures behaved fairly similarly among the stations from day to day and cool spell to warm spell and back again. There were two notable cool periods, around June 10 and June 27th, when, presumably, cool troughs of low pressure moved through the region. The warmest period was June 21 to 23. Let’s look at some of the warmer stretches and how Greenland Ranch compares to Independence, the closest of these to Furnace Creek.
With a difference in elevation of about 4125 feet, Greenland Ranch “should” average about 22 to 23 degrees warmer than Independence on summer afternoons (assuming similar station sitings, exposures, ground cover, etc.). The first week of June, 1913, is characterized by unusually large differences in maximum temperature between the two stations:
June 1 – 7
G.R. 105, 104, 108, 110, 108, 105, 110
Ind. 75, 72, 80, 79, 78, 79, 81
Diff. 30, 32, 28, 31, 30, 26, 29
For the week Greenland Ranch averaged 107F, three degrees below the June average maximum of 110F. Independence averaged 78F, a full ten degrees below its June average. Rain and clouds on June 1 and 2 at Independence likely helped to keep maximums down an extra bit more. Table 2-21 illustrates the daily “departure from normal” for each day of June, 1913 at stations in the region. Like the five surrounding stations, Greenland Ranch is about five degrees cooler than normal on the 1st and 2nd. On the 4th, 5th, and 7th, however, Greenland Ranch is close to normal, while the surrounding stations are hovering around 5 to 10 degrees below normal. A major cool-down commenced on the 8th. By the 10th, the California desert stations were about 18 degrees below normal on maximums, and Las Vegas and Tonopah were 23 and 26 degrees below normal, respectively.
By the 13th, the cool period was history and the region had warmed considerably, with maximums warmer than 110F at Greenland Ranch. The week from the 13th to the 20th was remarkably consistent and stable with regard to maximums at the six stations, see Table 2-20. Maximums at Independence ranged from 86F to 89F for all eight days, quite close to its average maximum for June of 88F. During the same eight days, the maximums at Greenland Ranch were not as regular, ranging from 109F to 116F. Daily differences between Greenland Ranch and Independence were 26 degrees on the 13th, 14th and 15th, 24, 25, and 23 degrees from the 16th to 18th, and then jumped up to 30 and 28 degrees on the 19th and 20th. Though Independence was near normal on maximum temperature during these eight days, four of the days at Greenland Ranch were 4 to 6 degrees above normal.
During this same eight-day period, all of the maximums at Tonopah were from 76F to 80F, compared to its long-term average maximum of 78F. Tonopah is a mining town near small mountain summits on a high plateau, some 115 miles north of Furnace Creek. Its weather station in 1913 was at 6090 feet elevation, and the observer was the U.S. Weather Bureau. Temperature measured at Tonopah’s relatively well-exposed and elevated location make for a good estimate of the temperature of the free air at 6000 feet in the region. An air parcel which descends from 6000 feet to 200 feet below sea level will warm by about 34 degrees. Not surprisingly, the average maximums for June at Greenland Ranch and Tonopah (through 1930) differed by about the same amount — 32 degrees. During summer’s hottest spells, the region is typically dominated by a large upper-level high pressure system, and horizontal temperature gradients aloft are weak to nil. During a typical summertime period with a hotter-than-average air mass affecting the region, and the associated clear skies and excellent mixing during the afternoons, it is reasonable to assume that maximum temperature differences between Greenland Ranch and Tonopah would be close to 32 to 34 degrees rather consistently. Differences of much greater than 34 degrees under these conditions, at least for extended periods of time, would be difficult to explain. As was shown in Part 1, the air temperature from about 6,000 to 14,000 feet “governs” the maximum temperatures at the surface. A certain air temperature at 6000 feet altitude can support temperatures only up to a certain point in a desert basin below.
Daily maximum temperature differences between Greenland Ranch and Tonopah from June 13 to June 20 were 34, 36, 36, 33, 32, 34, 38 and 37. Differences of this magnitude are a little greater than normal, but cannot be characterized as unreasonably or inexplicably large.
On June 19th, the maximum temperature at Greenland Ranch jumped up five degrees to 116F, six degrees above normal, while the surrounding stations changed little from the day prior and remained close to normal.
Maximums at Greenland Ranch were well above normal from June 20 to 26, 1913, except for a one-day drop to 109F on the 25th. Here are the comparisons with Independence for the week:
June 20-26
G.R. 116, 118, 119, 116, 118, 109, 117
Ind. 88, 92, 90, 88, 88, 81, 76
Diff. 28, 26, 29, 28, 30, 27, 41
These maximum temperature differences during this warm period were, for the most part, several degrees greater than the “normal” June difference of about 23 to 24 degrees between Greenland Ranch and Independence. Compared to Tonopah, Greenland Ranch maximums were 37, 34, 39, 41, 44, 42, and 55 degrees warmer from the 20th to 26th — all warmer than the normal difference of 32 degrees. Maximums fell substantially from the 24th to the 25th at all of the stations. But, inexplicably, Greenland Ranch came up from 109F on the 25th to 117F on the 26th, while Independence, Tonopah and Las Vegas dropped another five degrees. (Stations to the south of Death Valley, Barstow and Las Vegas, changed little.) Maximums on the 26th were 12 to 16 degrees below normal at Independence, Tonopah, Las Vegas and Barstow (see Table 2-21); Greenland Ranch, with 117F, was 7 degrees above normal! Obviously, a cool air mass invaded the region on the 25th and 26th — much too cool based on maximum temperatures in the region to support a maximum of 117F at Greenland Ranch on the 26th. The “set max” temperature at Greenland Ranch on the 26th (observed, presumably, around 5 p.m.) was 91F. It is likely that the temperature at Greenland Ranch was in the mid-to-upper 90s during the afternoon of the 26th, and nowhere near 117F.
A warming trend closed out the month, and by the 30th, most stations in the region were near normal.
Table 2-21 reveals that Greenland Ranch was consistently perched atop the five surrounding stations for the bulk of June, 1913, with regard to departure from normal. The maximums at Greenland Ranch during June, 1913, appear to be too warm on most days compared to the maximums at other stations in the region. I would not be uncomfortable characterizing the maximum temperature data at Greenland Ranch as “very suspect.”
Greenland Ranch Versus Surrounding Stations, July 1913
coming soon!!

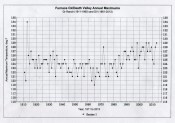
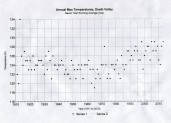
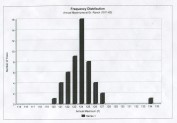
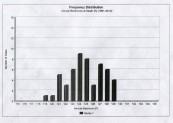
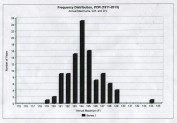
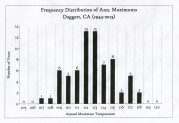
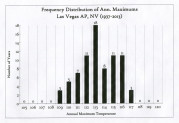
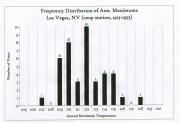
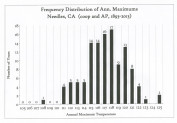
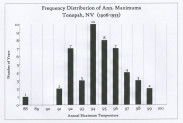
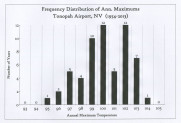
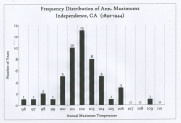
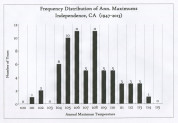
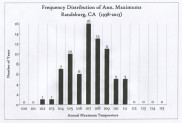
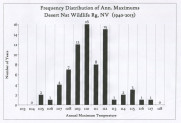
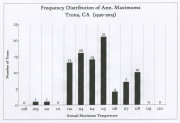
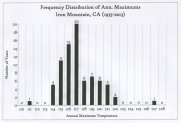


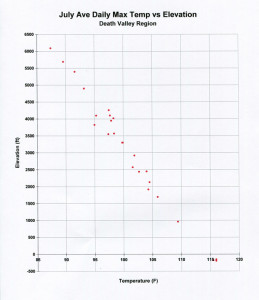
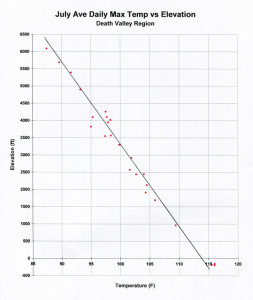
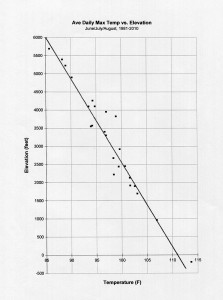
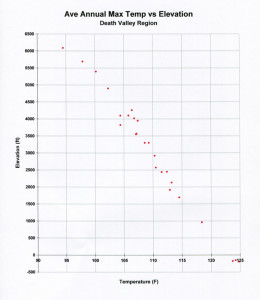
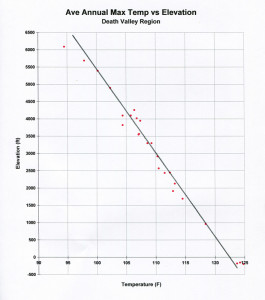
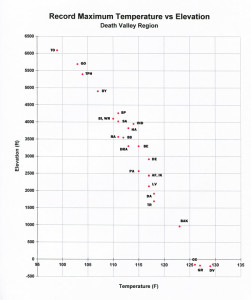
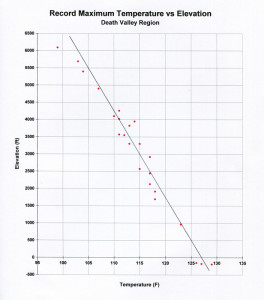
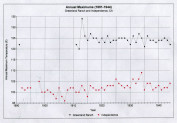
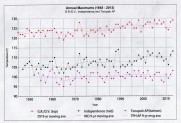
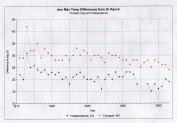
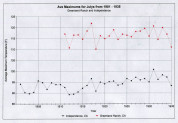
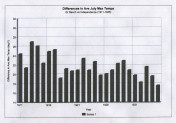
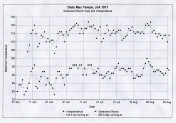
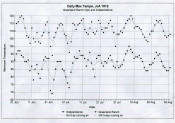
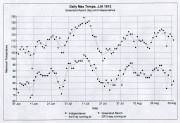
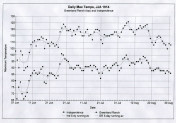
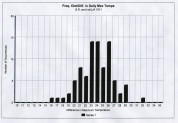
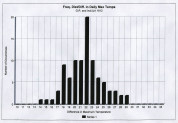
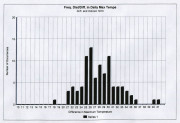
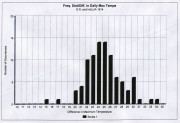
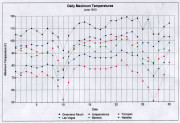
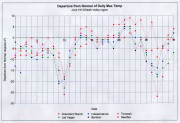
Leave a Reply
You must be logged in to post a comment.