Note: This entry details my findings and thoughts on detailed temperature measurements and patterns in and around Death Valley on July 23. There is a second entry for July 23 which features some of the landscape and astro photography by me on this trip.
——–
Since I am a researcher of Mojave Desert and Death Valley temperatures, especially hot summer temperatures, I take the occasion to venture out to these areas during less-than-pleasant weather conditions. During these journeys I take temperature readings numerous times every hour, in and around different places. It is my intention to learn and to share my findings, and I find it fun to see how the atmosphere behaves and to figure out how and why some places, some spots, are hotter (or colder) than other places. Weird? Of course. I did the same back in the mid-1980s when I was doing research for my Masters Thesis (“A Critical Analysis of Eastern Mojave Desert Temperatures”). I drove about and took temperature readings with a psychrometer thermometer — the kind one spins to get a dry bulb and wet bulb temperature reading. Some of these observations are provided in the Appendix section of my thesis.
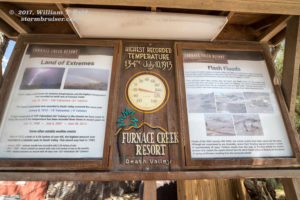
I am currently working on a paper to show that the record maximum temperature of 134F in Death Valley in 1913 is bogus. This high temperature is officially the world record high temperature. But, I am convinced that the figure was artificially and inappropriately augmented, or “jacked up” somehow, by the station observer way back then. A temperature that hot is not supported by the maximum temperatures at the same time at other stations in the region. For more information on this study, see my article in this Weather Underground blog with Chris Burt. Naturally, a better understanding of how ambient air temperature behaves in and around Furnace Creek on typical, hot summer afternoons should aid in understanding why and how the 134F reading came to be, and why it can not be valid.
So, part of the purpose of this trip was to get out to Death Valley and the Furnace Creek Ranch area on a very hot day, and to check my thermometer readings against those at the official station. I also wanted to check around the ranch for other thermometers and to see what those were reading during the hottest part of the afternoon. The official Death Valley temperature measurements are (currently) made at the weather station that was set up just NNW of the Visitors Center in 1961. Back in 1913, two years after the U.S. Weather Bureau first set up a cooperative station (called “Greenland Ranch”), the instruments were placed above “cultivated” land, where extensive irrigation was in use. (This was about a quarter-mile south of the current station site.) Furnace Creek Ranch/Greenland Ranch is, and has been, an oasis area with a variety of different ground covers, and with an assortment of buildings and vegetation which have significant effects on the local temperature patterns on sunny summer days. Today, I wanted to document the temperature differences and patterns around Furnace Creek. It is not an official study, but the results should give one a good idea of how different areas of the ranch and oasis compare. I think it is important because my hypothesis is that the observer in 1913, Oscar Denton, felt some compunction to artificially and inappropriately “jack up” the official readings during a heat wave during the first two weeks of July, 1913. The short version of my theory: In the decades leading up to the establishment of the new USWB weather station at Greenland Ranch in 1911, it was a widely-held belief that temperatures in Death Valley soared easily into the 130s on the hottest summer afternoons. It might even touch 140F, according to some reports. During a very hot stretch during the second week of July, 1913, Denton was getting official measurements of maximum temperatures which seemed, in his mind, to under-represent the true high temperatures, or the true nature of the hot weather in Death Valley. So, he changed the readings from the standard instruments (that were likely in the mid-120s) to values that he thought were more accurate, or more representative. Denton’s entries from July 7 to July 14, 1913, included several maximums of 127F to 129F and entries of 130F, 131, and 134F. Greenland Ranch had no maximums as high as 130F at any other time during its period of record from 1911 to 1960. While Denton likely knew that what he was doing went against protocol, he might have convinced himself that his actions were appropriate, or necessary, since the official station measurements were too low.
Southern California and Nevada were under the influence of an upper-level high pressure system on July 23, 2017. It wasn’t the mega-strong type of upper high that produces near-record summer heat in the desert areas, but it was medium-strong by mid-summer standards. There was the typical moderate onshore flow at the surface along the California coastline to inland areas, with a thermal low hanging out around Needles, as usual. Surface flow was weak in the Death Valley region. Low-level moisture was minimal-to-moderate, with dew points generally in the 40s to maybe low 50s (F) in the southern reaches. A surge of monsoonal moisture from the southeast was expected the next day, but today there wasn’t enough moisture to cause more than a few mid-level clouds and some very high-based flat cumulus over the highest mountains during the afternoon convection. Thus, for the bulk of the region on this afternoon, the skies were bright and sunny and winds were generally light. At the bottom of this paper I include a bunch of regional weather data to look over if you are interested. Below are the hourly observations by the NWS automatic instrumentation in the Furnace Creek weather station corral (at the National Park Service Visitors Center):
23 July 2017
PDT Temp/Dew Pt Wind
0500 101/41 S4 G7
0600 98/40 E4
0700 98/43 NW2
0800 102/48 Calm
0900 106/48 SE3 G6
1000 109/46 ESE4 G6
1100 112/46 SE2 G5
1200 115/49 SE1 G5
1300 116/44 WNW4 G5
1400 119/46 S2 G6
1500 120/44 SE5 G7
1600 121/47 SSW3 G7
1700 122/49 S4 G7
1800 121/48 SW5 G7
1900 119/49 S3 G6
2000 114/48 SE2 G5
2100 114/50 S3
2200 109/48 WSW3 G4
2300 110/52 WSW2 G4
The official maximum temperature for the day was 123F here at the Death Valley weather station. It likely occurred close to 5 p.m. PDT (4 p.m. PST), when the hourly observation was 122F. The official low temperature on the 23rd was 97F, and the morning low temperature on the 24th was a toasty 100F. The maximum of 123F is about 6-7 degrees above the normal average maximum temperature for July, and it is about 6 degrees below the reliable all-time record maximum temperature of 129F at the station. (I would postulate that this day was likely some 3-4 degrees cooler than conditions on July 10, 1913, when a maximum of 134F was recorded by Denton.) The hourly march of temperatures on July 23 at Furnace Creek was very typical for a day of this type. The temperature rose gradually and steadily from 7 a.m. to noon, increasing about four degrees each hour. The temperature continued to rise during the early afternoon, but at a slower rate.
(Meteorological lesson: By about 2 or 3 p.m. PDT, the lower atmosphere had “mixed out” entirely. This implies that there was full convection from the surface to about 15,000 feet above sea level in the region, and environmental lapse rates were near or at the dry adiabatic lapse rate. When this occurs, the surface temperature is at its “upper limit.” Though the temperature may creep up a little more into the mid-late afternoon, there can be, generally speaking, no additional significant increase in the ambient air temperature because that would require a similar increase in temperature of the entire air mass from the surface to levels up to 15,000 feet or thereabouts. Once the atmosphere has “mixed out” and reached its upper-limit temperature, the ambient air temperature tends to remain within a couple of degrees of the day’s maximum temperature for about four hours.)
The hourly temperatures at Furnace Creek ranged from 119F to 122F from 2 p.m. to 7 p.m. PDT. Sunset is around 8 p.m. PDT, and temperature was 114F at that time. It was still a hot 110F at 11 p.m. PDT. The wind was mostly light at the station for the entire day, with average speeds of 5 mph or less. Once the atmosphere had mixed out in the afternoon, the wind had a southerly component. This, again, is very typical at Furnace Creek on hot summer afternoons. The screaming message here is this: July 23, 2017, was a very typical hot summer day in Death Valley and in the region as a whole. Conditions on this day (sunshine, wind, humidity, hourly march of temperature, etc.) were likely very similar to conditions experienced on most of the very hottest of summer days at Furnace Creek in the past 100 years and more. Add about 5-6 degrees (F) to the temperatures below, and you will have a very good estimate of what the temperature will be during the afternoon in various locations at the given times on the hottest days on record in the region.
TEMPERATURE MEASUREMENT
The temperature measurements for this study were made with my plastic handheld Kestrel weather instrument. It measures wind, temperature, and humidity. The temperature sensor is quite sensitive and the instrument gives readings to the nearest tenth of a degree. While driving, I would roll down the driver-side window and hold the Kestrel outside and into the wind as far forward as I could reach, so that air inside the vehicle was not be affecting the reading. Typically, the temperature readouts would vary quite a bit over the course of a 10-20 second “measurement” while moving at about 60 mph. Temperature would commonly vary by 3 to even 4 degrees (F) or so. This variance is due to the normal character of the desert atmosphere on sunny summer days, and the sensor’s high sensitivity and quick reaction time. On sunny days, local mini-hotspots form above the desert surface amid the not-so-hotspots, according to terrain and wind for the most part. Localized sunlit areas in calm or weak winds tend to warm a little more (by just a couple of degrees F) than nearby areas where the wind might be a little stronger or the ground surface a little different, and the air near the surface a bit more mixed. We are talking areas separated by perhaps 25-to-50 meters, more-or-less!
So, again, the instrument typically showed temperature ranging over a 3-4 degree spread for a 10-20 second measurement period while driving. If the range was from 100F to 102F, then I would give that measurement a value of 101F. If the spread was 99F to 102F, then I would give it a 100F. Even if it was a slightly larger range, such as 98F to 102F, then I would write down a 99F temperature. I wanted to be conservative on every measurement.
THE DRIVE — Mojave area
I left home around 8 a.m. and reached Mojave about 90 minutes later. At 10 a.m., eight miles north of Mojave (elevation about 2400 feet), the temperature was 94F. Interestingly, about 15 minutes later and about 500 feet lower, along the north edge of Koehn Dry Lake, the temperature reading was 92F. Presumably, mid-morning mixing was still relatively weak in the Koehn basin. The cooler (and heavier) surface and near-surface air associated with the nighttime radiation inversion had yet to mix out fully. It would later in the day, of course, as the sun got higher in the sky and the wind increased. Just down the road, at Garlock (elev. 2150 feet), it was 95F at 10:26 a.m.
Trona area
Skies continued to be very clear and the sunshine very bright on the way from Garlock to Trona. The wind was light. I was on U.S. 395 for a few miles, and then turned northeast on Searles Station Cutoff Road. The intersection of the two is near the top of a ridge. I measured 93F here at 10:36 a.m., elevation about 3400 feet. There is another ridge along Trona Road, southeast of Ridgecrest, and it was 97F here at 10:52 a.m. (about 3300 feet). Trona Road then descends to Highway 178, east of Ridgecrest. Here, near 2040 feet in elevation, the temperature was 101F at 11 a.m.; at 11:07 a.m. it was 99F at the turnoff to the Trona Pinnacles (elev. about 1650 feet). Again, the cooler air in the desert basins (comparably) indicates that some heavier nighttime air still lingered late morning. I took a break in Trona, and my next reading was at 11:50 a.m. on the north side of town, at Pioneer Point: 102F (1675 feet). Though Trona-Wildrose Road ascends to the pass to the Panamint Valley at close to 3000 feet elevation, more than 1000 feet higher than Trona and Searles Lake, the temperature was only a degree cooler (101F) at 12:03 p.m.
Temperatures at noon in the region were 99F at Lancaster, 98F at Edwards AFB, 100F at Daggett, 109F at Death Valley, and 92F at Bishop.
Panamint Valley area
Trona-Wildrose Road makes a steep descent into Panamint Valley. At 12:13 p.m. I measured 107F at the turnoff to Ballarat. This is not too far west of the dry lake in the southern half of the basin, at an elevation of about 1300 feet. The dry lake is at about 1050 feet elevation, or about 1300 feet higher than the lowest parts of Death Valley. Summer maximums at Ballarat, near the eastern “shore” of Panamint Valley’s southern dry lake, would average about 6-7 degrees cooler than maximums in Death Valley. For July, the average maximum temperature at Ballarat would be quite close to 110F.
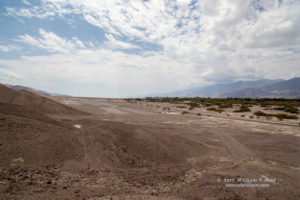
Figures 1 and 2 (above): On the left is a zoomed-in view of the Panamint Valley’s southern dry lake, taken from the pass between the Panamint Valley and the Searles Valley along Trona-Woldrose Road. The dirt road across the dry lake to Ballarat is visible. Some flat cumulus clouds were above Telescope Peak and the Panamint Range by about noon. These were not able to develop much vertically during the afternoon. Dew points in Death Valley and Panamint Valley were around 50F on this afternoon, and cloud bases were probably around 14,000 to 15,000 feet above sea level.
About 15 miles north of here, Trona-Wildrose Road veers off to the northeast into Wildrose Canyon, and Panamint Valley road continues northward into the northern portion of Panamint Valley. The route into Wildrose Canyon was closed due to old flood damage to the road. The elevation at the intersection is 1320 feet and the temperature at 12:27 p.m. was 108F. Thirteen minutes later, at 12:40 p.m. and two miles south of Highway 190 at 1540 feet elevation, temperature was 110F. By this time the sun was nearing its highest point in the sky for the day and the lower half of the troposphere was mixing strongly — not quite to the “upper limit” temperature for the day yet, however! This location is near the dry lake in the northern part of Panamint Valley. The lake bottom here is at about 1535 feet, nearly 500 feet above the lower dry lake to the south (near Ballarat). I measured 108F at 12:50 p.m. on the dry lake along Highway 190.
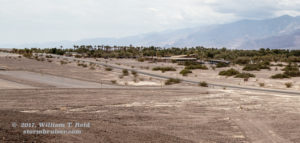
Figures 3 and 4 (above): These images were taken at the intersection of Panamint Valley Rd. and Highway 190 in Panamint Valley. Panamint Springs is a few miles west of here, and the dry lake is nearby to the east. The elevation is about 1540 feet and the ground cover is very sparse. The view is to the east in Figure 3 and to the north in Figure 4, towards the Panamint Dunes (visible in the distance).
From the dry lake the road steeply climbs into the Panamint Range towards Death Valley. I measured 107F at the 2000-foot sign at 12:53 p.m., 104F at 3000 feet at 12:56 p.m., and 98F at 4000 feet at 12:59 p.m. Three minutes later (at 1:02 p.m.) I had reached Towne Pass at 4956 feet, and the temperature was a rather refreshing 92F. Here at the pass it was about 17 degrees cooler than the dry lake in Panamint Valley along Highway 190, 3420 feet lower in elevation.
Regional temperatures at 1 p.m. were 102F at Lancaster (wind SW 20 mph), 102F at Edwards (wind SW 9 mph), 106F at China Lake (wind S 10 mph), 116F at Death Valley/Furnace Creek, and 102F at Bishop (S 12 mph). Towne Pass, about 5150 feet above Furnace Creek, was 24 degrees cooler than that Death Valley locale at 1 p.m.
Death Valley/Stovepipe Wells area
In the early afternoon hours on sunny summer days such as today, the desert atmosphere is nearing the point of full mixing to heights up to three miles above the desert basins. Typically the low-level air is in motion and a breeze with a speed of 5-10 mph is blowing. It is not unusual to see dust devils on the desert flats and alluvial fans. The relatively cool air that pooled in the basins at night is mixed out entirely, or nearly so. The lower atmosphere is mixed sufficiently so that air warms and cools at a rate of about 5 degrees F/1000 feet, or slightly less steep than the dry adiabatic lapse rate (of 5.4 degrees F/1000 feet). By about 2:30 p.m. PDT on days such as today, with full and bright sunshine, full mixing is in progress and the ambient temperature is near or at its upper limit. One would not expect the high temperature for the day to get more than 2-to-3 degrees (F) hotter than the readings reached by 2:30 p.m. PDT.
Highway 190 descends rapidly in elevation from Towne Pass to Stovepipe Wells, which is very close to sea level in Death Valley. Here are the times and temperatures along 190:
Towne Pass/4956 feet 92F/1:02 p.m.
4000 feet 99F/1:07 p.m.
3000 feet 102F/1:09 p.m.
2000 feet 108F/1:13 p.m.
1000 feet 113F/1:17 p.m.
St. Wells/5 feet 119F/1:21 p.m.
Temperature increased by 27 degrees in the 20 minutes from Towne Pass to Stovepipe Wells. Elevation change was 4950 feet.
I spent some time taking readings with the Kestrel thermometer from about 1:30 to 1:35 p.m. in front of the Stovepipe Wells General Store. Readings in the shade of the building ranged from 117F to 121F for the most part. It seemed that the temperature was more apt to rise when the breeze kicked up. At the nearby Ranger Station, where an old thermometer shelter still stands, I measured 119F. The Kestrel showed a dew point in the upper 50s (though on dew point it reads about five degrees too high), and some flat cumulus clouds were forming over the highest elevations of the Panamint Range. There were quite a few people milling about outside at Stovepipe Wells. It seems that many people, especially from Germany and other European countries, now choose Death Valley as a mid-summer destination in order to experience such hostile conditions…at least for an afternoon! Thirty years ago, when I visited Death Valley in the summer a few times, there would be very few visitors out and about during the early afternoon.
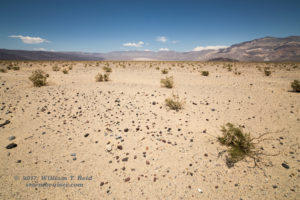
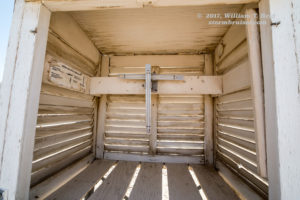
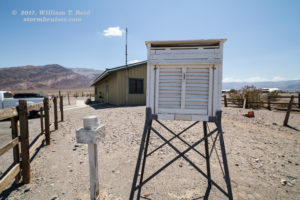
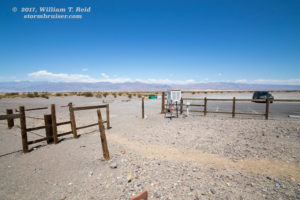
Figures 5 to 10 (above): A thermometer shelter still stands near the NPS ranger station at Stovepipe Wells (elevation +5 feet), but it is not in use, apparently. The shelter may be moved in the near future to an exhibit in Lone Pine, according to the National Park Service. In Figure 5, the maximum and minimum thermometers are still in place inside of the shelter. Figures 6, 7 and 8 show a decent exposure for the instrumentation, above very bare ground. The views are to the south, north-northeast, and west, respectively. Figure 9 is a look at the Stovepipe Wells general store, with numerous visitors enjoying the 120F temperatures in the shade.
I continued on 190 towards Furnace Creek, and measured 119F again along the Devils Cornfield, near the Mesquite Sand Dunes. The time was 1:59 p.m. PDT.
Here are some of the regional temperatures at 2 p.m. PDT:
Lancaster 101F/SW 21 mph
Edwards 104F/SW 17
Daggett 108F/NW 8 mph
China Lake 109F/SE 10 mph
Death Valley 119F/Calm
Bishop 102F/S 13 mph
Death Valley/Furnace Creek area
It is only a half-hour drive from Stovepipe Wells to Furnace Creek along 190, and most of it is at elevations a little below sea level. Furnace Creek Ranch is at an elevation of about -180 feet. Near the salt flats of Cottonball Basin, at 2:18 p.m., I measured 120F. This was about three miles north of Cow Creek, where the National Park Service has facilities and where a cooperative weather station operated from 1934 to 1961. Between Cow Creek and Furnace Creek Ranch at 2:26 p.m. PDT, at Harmony Borax Works, I measured 118F and the wind was very light. Two minutes later at the same location the temperature was 119F. At 2:33 p.m. I measured 119F as I passed slowly in front of the fuel station in Furnace Creek.
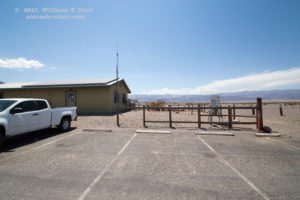
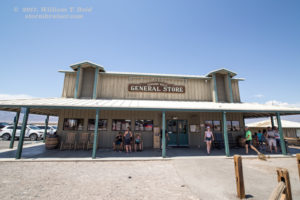
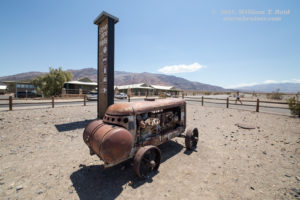
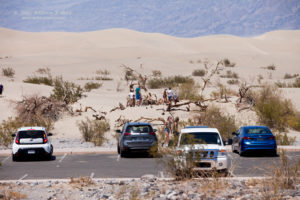
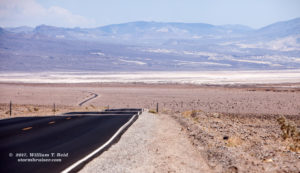
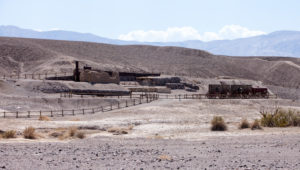
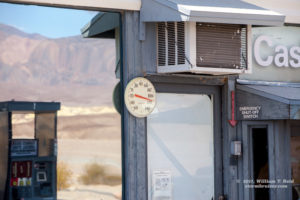
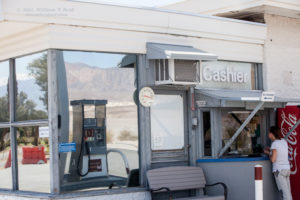
Figures 11 to 15 (above): Figure 11 shows visitors at the Mesquite Sand Dunes parking area along Highway 190. It was about 120F at the time, and it was somewhat of a relief that I did not see anyone headed towards the dunes in the background. Figure 12 shows the salty playa of Death Valley between Stovepipe Wells and Furnace Creek. The view is to the southwest. The ruins of the Harmony Borax Works are in Figure 13. The last two images are at the fuel and service station in Furnace Creek. A round thermometer showed a temperature of 111F, which was surprisingly low given the readings near 120F at Furnace Creek at the time AND the air conditioning unit right above it!
The next stop was the Death Valley National Park Service Visitors Center. This area is on the north side of the “ranch,” on the west side of the highway, northeast of a golf course, and south and east of generally open and undeveloped and barren desert. An area for camping and RVs is just northwest of the Visitors Center, but it is generally empty in summer.
I measured 120F along 190 near the Visitors Center at 2:40 p.m., and then 120F at 2:42 p.m. around the fenced weather station “corral” (which is perhaps 120 feet NNW of the main building of the Visitors Center). The official elevation for the weather station is -194 feet. About eight minutes later, at 2:50 p.m. PDT, I was measuring temperatures averaging 121F to 122F at the weather station site. The wind at this time was fairly light, from the south at about 3 to 6 mph.
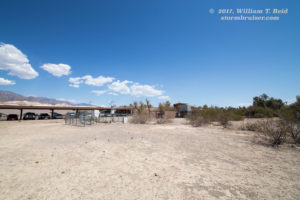
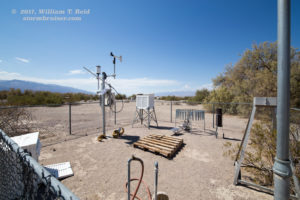
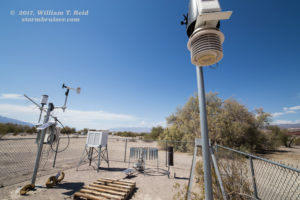
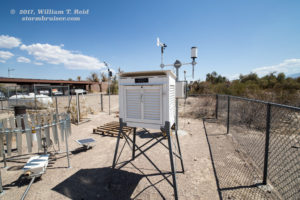
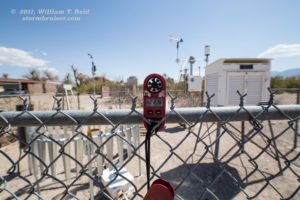
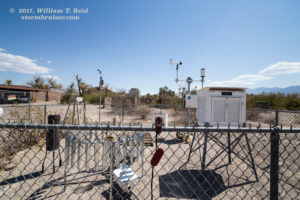
Figures 16 to 22 (above): The official National Weather Service and National Park Service cooperative weather station at Furnace Creek in Death Valley, July 23, 2017. (The station name is “Death Valley.”) The instruments are above bare ground and are approximately 40-50 meters NNW of the visitor center buildings. A covered parking area is only 15 to 20 meters to the east.
Figure 16 is a look to the southeast, towards the visitors center. The mostly bare ground near and around the weather station promotes hotter temperatures on sunny afternoons. Since the wind on summer afternoons is usually from the south, the brush and the trees and the structures to the southwest, south, and southeast of the station would cause poorer ventilation through the weather station and would also promote higher temperatures there on sunny afternoons.
Figure 17 is the view from the southeast corner of the fenced enclosure, looking to the northwest. The old CRS (cotton region shelter) is the louvered wooden box in the far (northwest) corner of the fenced enclosure (aka the weather station “corral”). Just to the south of the shelter, on the tall pole, is the newer National Weather Service instrumentation. This instrumentation measures (electronically) rainfall, wind, and temperature/humidity; it provides the “official” temperatures (the daily maximums and minimums) for the station. Visible in this view (and other views here), and associated with this electronic instrumentation are the rain gage, the wind vane and anemometer, the thermometer radiation shield, and a solar panel and a transmitting antenna. The current data are transmitted to a satellite and then to the NWS in Las Vegas. The Park Service staff (still) take daily max and min temperature readings at about 8 a.m. every day from the thermometers inside of the shelter. According to the Park Service, the temperature readings between the newer electronic station and the older CRS instrumentation are close; they notify the NWS in Las Vegas if they notice any unusual variance. To the east of the CRS is an automatic rain gage that is surrounded by a ring of silver “slats” which help to reduce the wind around the gage, in order to promote a better and more accurate catch of any rainfall. This rain gage instrumentation was set up recently by a hydrologist to compare rainfall catches between it and the standard 8-inch rain gage (the dark brown gage right next to it). Also visible in Figure 17 is a wooden pallet, flat on the ground in the middle of the corral. Large evaporation pans, to measure evaporation loss, would rest on a pallet such as this, but the evaporation pan which was in use for decades is no longer here. On the extreme left side of Figure 17 is another cotton region thermometer shelter, on the ground and not in use. In the foreground is a garden hose and faucet, presumably for re-filling the evaporation pan when it was in use.
In Figure 18 the view is to the NNW from the south side of the weather station corral. A Davis Vantage Pro 2 weather station is in the foreground at the top of the image. The data from this station are sent electronically to a display in the nearby visitors center. I operate several of these weather stations, and have found the temperature measurements from them to be quite accurate and reliable.
The view in Figure 19 is from the north side of the corral, looking to the SSE. The “front” of the CRS is in the foreground. The shelter door opens on this side, and it is always facing to the north. In the far corner of the corral is the Davis station. On the left side of this image is the nearby covered parking area for the Park Service employees, and a white energy storage tank.
Figure 20 shows my handheld Kestrel instrument which I was using for temperature measurement this day. View to the south.
Figure 21 is a better view of the station and the vegetation and structures to its south.
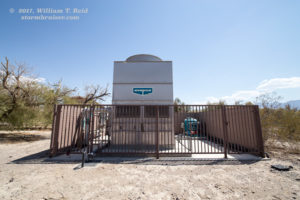
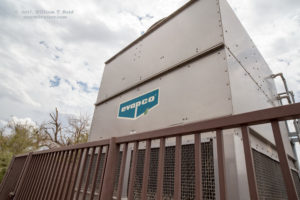
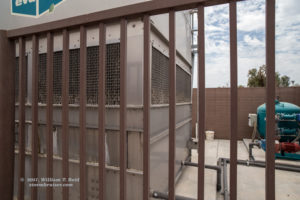
And the last of the images above, Figure 22, shows some air conditioning/cooling equipment, presumably. This machine is also visible in the background of the previous photo. The brick wall around the ‘Evapco” equipment is between 6 and 7 feet high, and no doubt helps to diminish the strength of southerly breezes through the weather station area. Does this equipment emit hot air when it is functioning? I do not know.
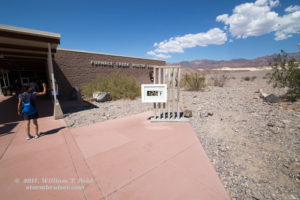
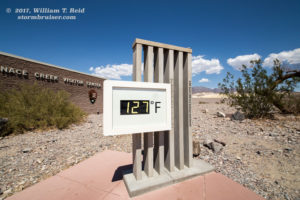
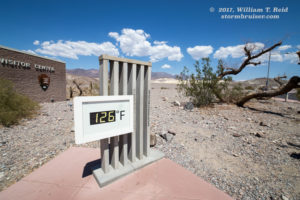
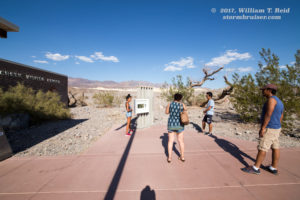
My Kestrel indicated 120F above the sidewalk on the south side of the Visitors Center, along the public parking area. At the same time, the digital thermometer that the Park Service has near the front entrance of the Visitors Center building showed 127F. This relatively new digital thermometer display is generally a “photo op” provided for Death Valley tourists. It read 126F to 127F at 2:41 p.m. and 127F at 2:57 p.m., or an easy 5-to-7 degrees higher than the temperatures that I was getting off of my Kestrel. This was in bright sunshine above bare ground with light wind.
Figures 23-25 (above): This digital temperature display is along the short pathway which connects the parking area to the visitors center. Every visitor to the visitor’s center walks right by this relatively new addition to the center! Graphics on the metal display provide the elevation here (-190 feet) and a scale to convert Fahrenheit to Celsius. A representative for the Park Service told me that she was aware that this exhibit showed hotter temperatures than the official instruments (in the corral behind the visitors center), but that “the tourists love it!” The display’s sensor is somewhere inside of this metal housing, so it is not surprising that the temperatures provided are on the hot side when the thing is in bright sunshine.
Regional Temperatures at 3 p.m. PDT:
Lancaster 101F/SW 21 mph
Edwards 104F/SW 17
Daggett 109F/NW 9 mph
China Lake 109F/SE 15 mph
Death Valley 120F/SE 5
Bishop 101F/SW 8 mph
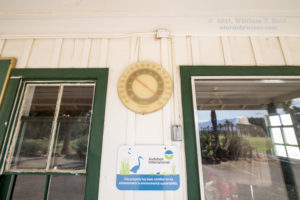
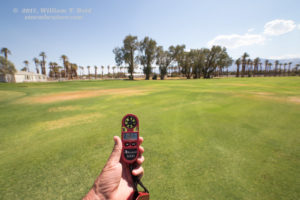
It was nearing the hottest part of the afternoon. In summer at Furnace Creek, daytime high temperatures generally occur between about 4 and 5 p.m. PDT (or between 3 and 4 p.m. PST). The temperature is typically within a couple of degrees of the day’s maximum temperature from about 2:30 to 6:30 p.m PDT (or from about 1:30 to 5:30 p.m. PST). I wanted to compare Kestrel readings above different ground surfaces at the ranch, so I parked by the Death Valley golf course store. This is on the northeast corner of the golf course. I measured 118F adjacent to the golf course store, near some shady areas by some trees. On the golf course itself, on the grassy fairway some 20 yards or so from the golf course store, the temperature was about 116F to 117F. These readings were taken in the sun around 3:02 to 3:07 p.m. PDT. The wind was light, but as is the case on most summer afternoons, was out of the south. Thus, the air had been moving over the moist and grassy golf course for a little while and had cooled due to evaporative cooling effects. The temperature above the fairway in the northeast corner of the golf course was about 3 to 5 degrees cooler than that around the Visitors Center, only 100 meters or so to the north. The round thermometer on the wall of the golf course store, in the shade, read 123F.
Figures 26-30 (above): Figure 26 is looking SSE at the golf course store. The next image shows the round thermometer on the west-side wall, under the eave. It was reading about 5 degrees warmer than the temperatures I was seeing off of the Kestrel in front of the store (perhaps due to the nearby hot pavement and poor ventilation as the sun was coming around to the west, and/or perhaps because this household instrument was poorly calibrated). Figures 28 (to the southwest) and 29 (view to the east) show a pole with weather instruments on the southeast corner of the golf course store. I spoke with an employee at the store, and we determined that the station failed a year or two ago, and the weather display console which was behind the cash register desk was removed. Someone had been called to try to fix the station, but that someone never got around to looking into the problem. It would be interesting to compare readings from a station such as this to the data from the official weather station at the visitors center. In Figure 30, the Kestrel shows a temperature of 116.6F above the nearby grassy fairway. This view is to the southwest.
At 3:10 p.m. the temperature along 190 at the entrance to the ranch was 119F. A little farther to the south, at the road to the Indian village, it was 120F. At 3:12 p.m. the temperature averaged about 121F along Indian Village Road, south of the ranch. There is little or no evaporative cooling effects here, south of the ranch, and the temperature on the Kestrel briefly showed 124F. At 3:15 p.m., back at the entrance to the ranch, the temperature was averaging about 118.5F. The round thermometer on the sign at the ranch entrance showed 111F. It was in the shade. Another round thermometer, under the eave of the nearby general store, showed 117F. My Kestrel showed the same in this shady area. I parked the vehicle and walked around the roadways and buildings in the main Furnace Creek ranch/motel area. Here are the times and temperatures:
3:20 p.m./120F parking area in front of post office
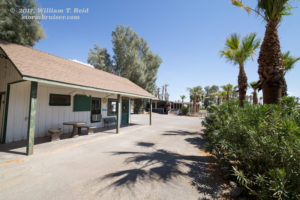
3:22 p.m./120F in front of office buildings just SW of Borax Museum (Taylor Digital thermometer on outside office wall, north side, showed 127F)
3:30 p.m./119F to 121F ranch swimming pool area
3:35 p.m./120F parking lot in open area
Inside the public restroom adjacent to a parking area, the “cold” water out of the sink faucet was 104F.
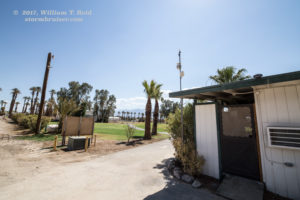
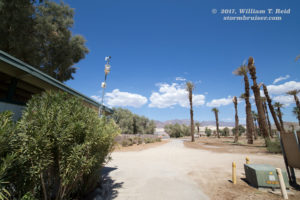
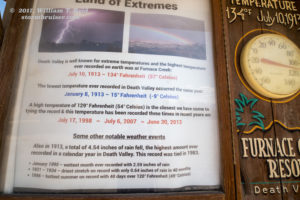
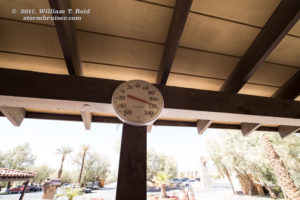
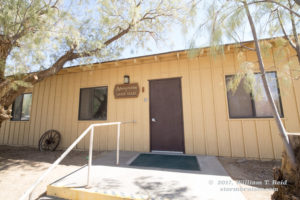
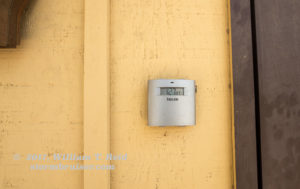
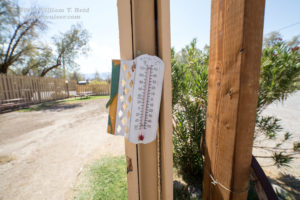
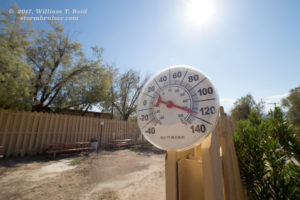
Figures 31 to 37 (above): The top two photos are of the display near the front entrance to Furnace Creek Ranch, near the general store. This thermometer read 111F around 3:15 p.m. PDT. A couple of hours later the sun had come around more to the west and the display was in full sunshine. This thermometer was showing a reading close to 130F at that time. The third photo in the group above shows the thermometer that was under the eave of the general store, and well protected from the effects of direct sunlight, at least at this time (3:15 p.m.). It was showing a very reasonable temperature! Images 4 and 5 show the north side of an office building along the road to the ranch motel rooms. A Taylor digital thermometer that was attached to the wall indicated a temperature of 127.9F, even though it was in the shade. This was seven degrees or more hotter than the temperature of the ambient air. The final two images show two of my personal household thermometers, brought to Death Valley for this trip. I placed each on a fence post near a parking lot at the ranch. Even though the sensors of the instruments were shaded from direct sunlight, the instruments showed temperatures well above the actual air temperature by 5 to 10 degrees (F).
I took a break from the heat and spent nearly an hour in the nice air-conditioned eatery at the ranch. I was back outside with my Kestrel at 4:40 p.m. This was very close to the hottest part of the afternoon. Here are the temperatures that I measured:
4:40 p.m./121F along 190 at entrance to Furnace Creek Ranch
4:43 p.m./117F to 120F along north-south road on east side of golf course
4:44 p.m./122F on Highway 190 at entrance to NP Visitors Center.
4:45 p.m./120F sidewalk area in front of entrance area to Visitors Center (digital temperature sign showed 127-128F)
4:47 p.m./121.5F just west of Visitors Center buildings and south of weather station by about 40 yards
4:48 p.m./121.5F just south of weather station (several steps away from the fenced area)
4:49 p.m./120F at weather station
4:50 p.m./122.5F just west of weather station
4:51 p.m./122.3F just northeast of weather station
4:52 p.m./120F over NPS employee parking lot area, east of weather station
4:55 p.m./122F just west and southwest of weather station
5:00 p.m./122F sidewalk area in front of entrance to Visitors Center (digital sign showed 128F)
5:05 p.m./122F driving past Furnace Creek Ranch entrance along 190
5:05 p.m./123F Highway 190 and road to Indian Village, just south of the ranch
Figure 38 (above): Park visitors enjoy a photo op by the digital thermometer at the visitors center around 5 p.m. It read 128F, but the official maximum temperature at the nearby weather station for the day was only 123F.
My observations suggest that the weather station area is among the warmest spots in and around the Furnace Creek Ranch area, though the open and barren area towards the Indian village may be a degree or so hotter still. The ranch area itself, around the buildings and parking areas, was generally a degree or two cooler than the readings I was getting near the official weather station. I attribute this to the nearby golf course and irrigated trees and vegetation in the developed “ranch” area. The weather station is rather close to the cooling effects of the golf course, but the typical breeze from the south through the weather station area skirts by the golf course on the east side. So, the golf course probably has little effect on the official station on most afternoons. It seemed that the areas above pavement at the ranch were no warmer than the barren areas just outside of the ranch, despite the darker nature of the pavement/asphalt.
The well-watered golf course area (on the fairway) was a good 3-to-5 degrees cooler than the weather station readings. Household-type thermometers in the ranch area varied quite a bit in their readings, from about 8 degrees (F) too cool to about 8 degrees (F) too warm. The readings that I took off of the Kestrel near the Death Valley weather station matched closely to the hourly readings from the NWS instruments. As would be expected, heavily shaded areas at the ranch were cooler by a few degrees compared to areas in bright sunshine.
It should be obvious (hopefully!) that local mid-afternoon desert temperatures are affected to a significant degree by the presence of structures and differences in ground cover, in an oasis settlement such as Furnace Creek. This is, in large part, because the very dry desert air reacts quickly and significantly to changes in radiation and moist surfaces. Well-irrigated areas, such as golf courses and grassy fields, are typically several degrees cooler than nearby open areas with a natural (mostly barren) surface. Also, trees, shrubs, fences, vehicles and structures can slow the wind and reduce low-level mixing locally, allowing some spots downwind (that are above barren ground) to be up to a few degrees hotter in the afternoon sunshine comparably.
When siting a weather station in a desert area or in a desert town, an area with good ventilation and exposure to the wind, as far from buildings as possible, is important. Presuming that we want to be able to compare weather records over time without having to adjust or note for changes in exposure and land use and ground cover, it is best to locate weather stations over natural ground cover, and in an area not likely to experience significant changes in ground cover in the foreseeable future.
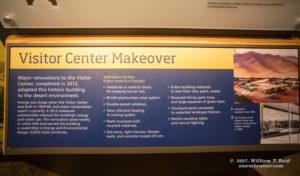
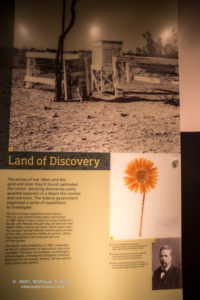
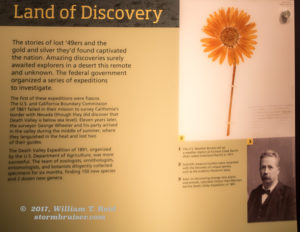
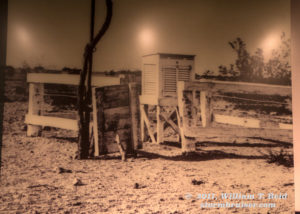
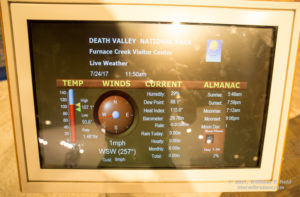
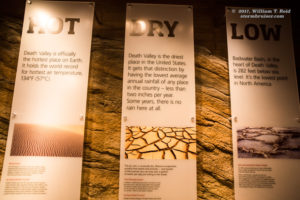
The images above (Figures 39 to 44) are of exhibits inside of the visitors center. These are relatively new, as the visitors center was remodeled and expanded around 2012-13. The weather data display shows current conditions from the Davis Vantage Pro 2 station in the weather station corral behind the visitors center (see Figure 18). Interestingly, the first exhibit in this group (Figure 39) notes that “large expanses of lawn” were removed with the renovations in 2012. This would decidedly promote a change to warmer maximums at the official Death Valley weather station. I noted in my Master’s Thesis (back in the 1980s) that the “well-watered” lawn of the visitors center likely kept summer maximums down slightly.
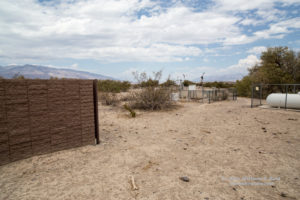
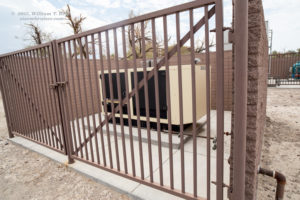
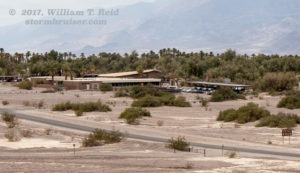
Figures 44-50 (above) show the Death Valley weather station area. Summer afternoon winds through the station are usually from the south, and development and vegetation growth through the years have slowed the wind and ventilation through the weather station, likely resulting in some increase in measured maximum temperatures. There are two new pieces of equipment that are less than 25 meters south of the weather station. A brick wall has been built on the east, south, and west sides of each one. These may be part of the air conditioning system for the visitors center. In Figure 44, the weather station is visible in this view to the NNW, from the east side of the northern-most “cage.” Figure 45 is a look inside this cage from its north side. Figures 46 and 47 are looks inside the southern-most cage, again on the north side (see also Figures 21 and 22). The final three images above are looks at the Visitors Center from a small hill, looking southwest. The final two are cropped versions of the wide-angle view, showing the Visitors Center area and the nearby vegetation. The weather station instruments are hidden by trees (below).
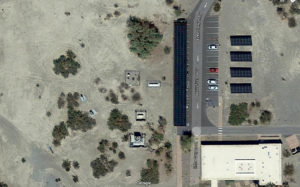
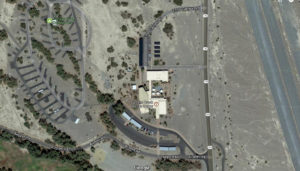
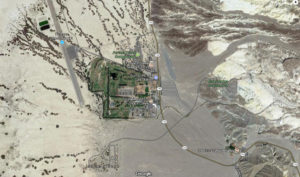
The final three images above (Figures 52-54) are satellite images of the Furnace Creek area, with zoomed-in looks of the weather station area (Figure 52) and the Visitors Center area (Figure 53). In Figure 52, the weather instruments are visible near the center of the image, to the left of that white gas tank. The two brick-walled “cage” areas are visible just to the south (below) of the weather station.
Weather Data for July 23, 2017
Soundings and sounding data at Las Vegas (VEF) and Reno (REV) at 12Z and 00Z
VEF Sounding Analysis Page – 07:23:2017 12 UTC
VEF Sounding Analysis Page – 07:24:2017 00 UTC
The sounding at Las Vegas on the afternoon of the 23rd (00Z on the 24th) showed full mixing nearly up to the 600-millibar level, which is typical for summer. The sounding also shows the super-adiabatic layer in the lowest 20 millibars, or the lowest 200 meters or so.
NWS Max/Min Temperature lists for the region
NV – Las Vegas CWA Maximum and Minimum Temperature
CA – San Joaquin Valley:Hanford CWA Maximum and Minimum Temperature
Death Valley region hourly data
Regional Airport observations
Tonopah AP Las Vegas AP Desert Rock Daggett
China Lake Bishop AP Bicycle Lake
Other regional hourly data
Keeler Trona Tonopah CEMP Tecopa CEMP Shoshone
Sarcobatus North Las Vegas Independence Hunter Mt RAWS
Goldfield CEMP Fort Independence Eureka Valley RAWS
Beatty CEMP Baker MAP Amargosa Vly CEMP Death Valley Junction



Leave a Reply
You must be logged in to post a comment.