PART 4A— HISTORIC HEAT WAVES IN THE DEATH VALLEY REGION 1931 to 1960
Part 4 became quite large, quite unwieldy. So, I decided to break it up some. For now, I will break it up into three parts, or sections:
Part 4A 1931 to 1960 (last 30 years of the Greenland Ranch record—you are now on this part!)
Part 4B 1961 to present (Death Valley NPS Visitors Center station site)
Part 4C 1911 to 1930 (first 20 years of the Greenland Ranch record).
I think that it is prudent to investigate the post-1930 record first, because much of the first twenty years of the Greenland Ranch record is problematic. An in-depth analysis of the regional temperature patterns with the relatively good Death Valley data should provide a good foundation, or a good sense of “normal.” From there, we are better informed when scrutinizing the early years with the not-so-good data.
For your convenience, here are links to the other parts of this study:
Part One is here Introduction/Background/Meteorology/Previous Studies
Part Two is here Early Greenland Ranch Climate Record
Part Three is here Comparing Hot Maximums
Part Five is here Supplemental Tables For Early Heat Waves
Part Six is here Greenland Ranch and Oscar Denton History
More than one hundred summers of temperature data are in the record books. Since 1911, the Mojave Desert and Death Valley regions have endured dozens and dozens of hot spells, long and short. The hottest of the hottest hot spells are examined in this section. We will learn that the “hot spell” in July 1913 was only a “run-of-the-mill” stretch of hot days in the region, and that numerous other summers have had hotter heat waves. Why were maximum temperatures of 130F and higher recorded in July of 1913 in Death Valley, while no years since have been able to muster a 130F reading?
Heat waves from 1931 to the present will be investigated first, followed by the period from 1911 to 1930. It will be shown that daily maximum temperatures behave in a fairly predictable manner, that elevation is the primary determinant of maximum temperatures in the region, and that exceptionally hot spells are never extremely localized. In addition, much of the first 20 years of record at Greenland Ranch is not trustworthy, so it is prudent to first scrutinize the period of record which appears less problematic.
About two dozen significant summertime heat waves are investigated. The Climatological Data issues for California and Nevada for the months of occurrence are provided, as are the original monthly cooperative observer forms for stations in and around Death Valley. Charts were made to show how maximum temperatures behaved daily during the heat wave at the stations operating at the time. And, average and extreme maximum temperatures were plotted against elevation for each station. On each “temperature versus elevation” chart, a line with the same slope is drawn, beginning at the value for Greenland Ranch (1911-1960) or Death Valley (1961-2013). The slope is 4.5 degrees (F) per one thousand feet in elevation, which closely approximates the rate at which average daily maximum temperatures in July decrease with elevation for stations in the Death Valley region.
The heat waves selected were generally those where the extreme maximum temperature at a Furnace Creek-area station was 125F or hotter. After about 1985, this threshold was bumped up to about 127F as maximums of 125F or more have become much more commonplace.
The determination of the heat-wave duration was rather arbitrary, but generally the timeframe incorporated was from the day before the first 120F maximum to the day after the last 120F maximum at the Furnace Creek-area station.
Greenland Ranch was established in June, 1911. The hottest spells during the summers from 1911 to 1915 were also included in order to show how Greenland Ranch maximums compared to those at surrounding stations prior-to and shortly-after the record-setting month of July 1913.
Stations incorporated here are generally within about 110 miles of Furnace Creek. Here is a key to the station abbreviations on the charts:
DV Death Valley CA/1961-present/ -194’/at the NP Visitor’s Center on the north edge of Furnace Creek/NPS
GR Greenland Ranch CA/1911-1960/ -178’/near the north-south highway in Furnace Creek, about a quarter-mile south of the current DV station/Pacific Coast Borax Company
CC Cow Creek CA/1935-1960/ -152’/3 mi N of Furnace Creek/NPS
AF Amargosa Farms NV/1966-2014/2450’/25 mi ENE of FC/Amargosa Ranches
BAD Badwater CA/1934 and 1959-1961/-280’/17 mi SSE of FC/NPS
BAG Bagdad CA/1903-1926/784’/139 mi SSE of FC/Santa Fe Railroad
BAK Baker CA/1971-2013/940’/93 mi SSE of FC/private residences–William Locke
BAK9 Baker 9NNW/1954-1970/1045’/84 mi SSE of FC/Los Angeles Dept. of Water and Power
BAR Barstow CA/1903-1979/2142’/108 mi S of FC/Southern California Water Company
BE Beatty NV/1918-1972/3300’/32 mi N of FC/US Weather Bureau
B8 and BE8 Beatty 8N/1973-2007/3550’/40 mi N of FC/private ranch–Effie Spicer
BI Bishop CA/1895-1918/4450’/107 mi NW/W.A. Chalfont
BIH Bishop AP CA/1944-present/4102’/103 mi NW of FC/NWS ASOS
CL or CCY Clay City NV/1926-1936/2185’/27 mi E of FC/General Clay Company
CO Columbia NV (see Goldfield)
DAG/Daggett AP CA/1948-present/1922’/110 mi S of FC/NWS ASOS
DY Dyer and Dyer 4SE NV/1903-1918 and 1950-present/4900’/106 mi NW of FC/McAfee’s Ranch
DRA Desert Rock AP NV (Mercury)/1978-present/3230’/48 mi ENE of FC/NWS ASOS
DS Deep Springs CA/1948-2007/5225’/89 mi NW of FC/Deep Springs College
HA Haiwee CA/1923-2000/3825’/65 mi WSW of FC/Los Angeles Dept. of Water & Power
GO Goldfield NV/1906-2010/5690’/90 mi NNW of FC/Esmeralda County Sheriff
IN Independence CA/1893-present/3950’/78 mi WNW of FC/Los Angeles Dept. of Water & Power
IK Inyokern CA/1949-2009/2440’/77 mi SW od FC/Fire Department
IS Indian Springs/1913-1919 and 1939-1964/3136’/75 mi E of FC/Ira McFarland
JE Jean NV/1907-1915/2864’/100 mi SE of FC/Salt Lake Route
LAS Las Vegas AP NV/1940-present/2162’/99 mi ESE of FC/NWS – FAA
LV Las Vegas NV/1895-1956/2033’/99 mi ESE of FC/C.P. Squires
LI Lida NV/1912-1917 and 1942/6037’/78 mi NNW of FC/L.F. Detwiler
LP Lone Pine CA/1904-1920/3728’/67 mi W of FC/G.F. Marsh
LW Lathrop Wells/1942-1962/2665’/29 mi ENE of FC/State Highway Department
LW16 Lathrop Wells 16SSE/1971-1977/2176’/30 mi E of FC/Farm Land Co.
NE Needles CA/1893-1940/477’/170 mi SE of FC/Santa Fe Company
OR Oasis Ranch NV/1912-1919/5106’/90 mi NW of FC/Arthur Stewart
PA Pahrump NV/1914-1925 and 1949-present/2670’/52 mi ESE of FC/private residences
RA Randsburg CA/1938-present/3570’/87 mi SW of FC/Fire Department
RH Rhyolite NV/1914-1916/3680’/31 mi N of FC/Secretary School Board
SA Sarcobatus NV/1941-1961/4020’/58 mi N of FC/State Highway Department
SH Shoshone CA/2007-2010/1546’/47 mi SE of FC/Caltrans
SL Silver Lake AP/1940-1953/918’/87 mi SSE of FC/U.S. Airways Observers
SP Silverpeak NV/1895-1903 and 1968-present/4263’/100 mi NNW of FC/Foote Mineral Co.
TO Tonopah NV/1902-1954 and 2012-present/6090’/111 mi N of FC/U.S. Weather Bureau
TPH Tonopah AP NV/1954-present/5395’/111 mi N of FC/NWS ASOS
TR Trona CA/1920-present/1695’/56 mi SW of FC/Searles Valley Minerals
WR Wildrose RS CA/1967-1999/4100’/22 mi SW of FC/NPS
YG Yucca Grove CA/1931-1954/3951’/100 mi SE of FC/C.A. Anderson
Heat waves index:
1930s to present
Jul 1931/Jul 1933/Aug 1933/Jul 1936/Aug 1936/Jul 1942/Jul 1945/Jul 1949/Jul 1959
Jul 1960/Jun 1961/Jul 1961/Jul 1972/Jul 1988/Jul 1989/Jun-Jul 1994/Jul 1998
Jul 2002/Jul 2005/Jul 2007/Jun-Jul 2013
Early years, 1911 – 1927
Jun 1911/Jul 1911/Aug 1911/May-Jun 1912/Jul 1912/Aug 1912/May 1913/Jun 1913
Jul 1913/Aug 1913/Jun-Jul 1914/Jul 1915/Aug 1915/Jul 1916/Jul 1917/Jul 1922/Jul 1927
July 1931
July 16 to July 28 heat wave
“July, 1931, was the warmest month of record in Nevada,” is how meteorologist George Sager introduced the summary for the month in Climatological Data for Nevada.
The period of hot weather that affected the Mojave Desert and Death Valley regions during the last half of July, 1931, was one of the greatest heat waves of the 20th Century in the United States. Here are the Climatological Data issues and cooperative station climate forms for the month at area stations:
1931 July GR 1931 July Las 1931 July Clay 1931 July Ton 1931 July Gold
1931 Jul Baker 1931 Jul Inde 1931 Jul Beat 1931 Jul Haiw 1931 Jul Need
And below are the daily maximum temperatures from July 16 to 28 at area stations, and charts comparing the average maximum and extreme maximum temperature for the period versus station elevation:
(As mentioned above, the line drawn through Greenland Ranch has a slope of about 4.5 degrees (F) per 1000 feet, which closely approximates the behavior of summer maximums in the region.)
The first question that should be asked is: “Do the Greenland Ranch data appear trustworthy or not?” The form is signed by Ross Boswell, in his second summer as observer at Greenland Ranch. The maximum and minimum temperatures do not appear to be unreasonable.
At Greenland Ranch in Death Valley for July, 1931, twenty days reached at least 120F and the average daily maximum temperature was a healthy 120.6F. All of the maximums were warmer than Greenland Ranch’s long-term average maximum of 115.5F for July, except for 115F on the 30th and 115F on the 31st. The only months with a warmer average daily maximum (at Greenland Ranch and Death Valley) were July, 1917 (with 121.9F), and July, 2009 (121.3F). The Julys of 2002, 2003 and 2006 were also 120.6F. The maximums at Greenland Ranch in July, 1917, are not trustworthy (far too warm during the last week); and, the Death Valley instrument location during the last 10-20 years has warmed somewhat, due, presumably, to poorer ventilation. Summer maximums at the current instrument site are likely a couple of degrees warmer than they would be if measured under the conditions at the Greenland Ranch instrument site in 1931. I would argue that the 31 afternoons of July, 1931, were the hottest for any July in Death Valley since 1911. The average daily maximums that have surpassed 120F in Julys since the year 2000 would probably be about 117F to 119F if measured at the old Greenland Ranch shelter location (which was adjacent to or above irrigated alfalfa fields and with better exposure to wind).
The list below provides the average maximum and average minimum and the monthly mean temperature for stations in the region for July 1931, plus the extreme maximum and minimum for the month:
Greenland Ranch 120.6/84.2/102.4 126/70 0.00″ (-178′, observer Ross Boswell)
Clay City, NV* 110.7/74.9/92.8 116/61 0.00″ (2185′)
Tonopah 91.6/65.6/78.6 98/52 0.10″ (6090′)
Goldfield 93.8/62.3/78.0 103/51 0.01″ (5690′)
Las Vegas 111.5/75.1/93.0 118/64 0.02″ (2033′)
Independence 100.7/68.7/84.7 106/58 0.00″ (3950′)
Beatty 104.2/65.3/84.8 110/56 Tr (3300′)
Haiwee 100.5/72.1/86.3 104/62 0.00″ (3825′)
Needles 111.9/85.9/98.9 118/78 Tr (477′)
Trona est. 110.9/est. 76.9/93.9 116/64 0.02″ (1695′)
*Clay City was a small community near the CA/NV border, south of Amargosa Valley and north of Death Valley Junction, at an elevation of 2185 feet. Weather records here run from 1926 to 1937.
Unfortunately, there are no temperature data for July, 1931, from some stations with lengthy records in the region, such as Barstow and Daggett, Randsburg, Bishop, and Pahrump. The first July temperature observations at Cow Creek (3 miles north of Greenland Ranch) were in 1935. California’s Climatological Data in July 1931 gives 93.9F as the average for Trona (and a monthly maximum of 116F), but the average maximum and average minimum temperatures are not provided. Unfortunately, the NCDC web site is apparently missing all of Trona’s original records for 1931, though all of the other years are available since 1920. Trona’s mean temperature of 93.9F for July, 1931, is 5 to 6 degrees warmer than average. It is estimated that Trona had an average maximum of 110.9F and an average minimum of 76.9F in July, 1931.
Below is the departure from long-term July averages for the average daily maximums of July 1931:
Greenland Ranch +5.1 (based on an average July daily maximum of 115.5F from 1911 to 1960 at GR)
Clay City, NV est. +5.7 (estimated average daily maximum of 105.0F)
Tonopah +4.2 (based on an average daily maximum of 87.4F from 1906-1953)
Goldfield +4.2 (based on an average daily maximum of 89.6F from 1907-1997)
Las Vegas +6.9 (based on an average of 104.6F at the town co-op station from 1908 to 1953)
Independence +4.8 (based on an average July daily maximum of 95.9F from 1925 to 1944)
Beatty +4.4 (based on an average of 99.8F from 1918 to 1972)
Haiwee +5.5 (based on an average of 95.0F from 1923 to 2000)
Needles +4.2 (based on an average daily maximum of 107.7F for 28 Julys through 1930)
Trona est. +5.4 (estimated average maximum of 110.9F for July 1931, compared to the long-term average of 105.5F for July through 1952)
Departures were mostly four to six degrees warmer than average for July 1931 in the region. Generally speaking, for stations in the Death Valley region and the Mojave Desert, it is very unusual for summer months to average in excess of five degrees above the long-term average (or above the 30-year normal) on maximum temperature.
At Tonopah, the average maximum of 91.6F in July, 1931, was the highest for any July (and for all months) until July, 1953, which averaged 93.3F. Only four Julys had an average maximum of 90F or hotter in the town of Tonopah from 1909 to 1953.
At the cooperative station in Las Vegas, with good records from 1908 to 1953, the average maximum of 111.5F in July, 1931, is the hottest for any July and for any month. (The original climate form for Las Vegas and the Nevada Climatological Data for July, 1931, both show an average maximum of 110.9F. A recalculation of the 31 maximums gives 111.5F. The Western Region Climate Center web site shows 111.5F for Las Vegas COOP for July, 1931.) At the Las Vegas Airport station, the hottest average daily maximum for any month is 107.9F for July, 1959. July records began at the airport in 1949. Second hottest month at Las Vegas on average maximum is July, 1933, with 108.8F, but six days are missing for that month.
Official temperature records at Independence go back to 1892, at least. When waters from the Owens River were diverted south from the Owens Valley to Los Angeles beginning in 1913, a general drying commenced in the basin. This, unsurprisingly and predictably, resulted in higher maximum temperatures during the summer. The Climatic Summary of the United States published in 1933 (for data through 1930) shows an average daily maximum of 93.6F for July for Independence. The supplement for 1931 to 1952 shows an average daily maximum of 95.7F at Independence for July (for 14 Julys, 1931 to 1944) . For July, the 30-year “normal” average daily maximum at Independence was 97.7F from 1961 to 1990. It jumped up to 99.8F for 1981 to 2010. In the past century, average summer maximums have increased by about six degrees at Independence. (In addition to the drying of the basin, the warmer summer maximums at Independence during the most recent several decades are also likely due to instrument siting in warmer locales in town.) The average maximum at Independence for July, 1931, was 100.7F. Though most Julys since 2000 have average maximums of 100F or hotter, July of 1931 was the only month at Independence to have an average daily maximum of 100F or hotter from the 1890s through 1950. The average daily maximum for July from 1925 to 1944 was 95.9F, so maximums in July, 1931, averaged about five degrees above average.
The average daily maximum of 104.2F at Beatty, NV, for July, 1931, is the hottest for all of the Julys for its period of record from 1918 to 1972. In second place and third place, respectively, are July, 1959 (103.3F) and July, 1960 (103.2F). In August, 1923, an average daily maximum of 103.3F was observed at Beatty, which is about 5.5 degrees above normal. Surrounding stations were below normal on average maximum, however, and this average maximum for August, 1923, at Beatty is not trustworthy.
Temperature records began at Haiwee, CA, in 1923. Its average daily maximum of 100.5F in July, 1931, was the highest for any month here until 2002. (Note: seven Julys from 2002 to 2014 had average maximums of 101F or hotter, so it appears that a significant change in environment around the Haiwee temperature instruments occurred which promotes significantly hotter summer maximums comparably. The recent temperature record at Haiwee since about 2000 cannot be compared directly and fairly to the older records without a better understanding of any changes in instrument siting and/or equipment.)
The average daily maximum of 111.9F at Needles in July, 1931, is the hottest reliable average daily maximum for the cooperative station in town. Temperature records in town began around 1896, though they were somewhat intermittent for the first ten years. Official temperatures are from the airport station from 1941 to the present. The hottest average maximum for any month at Needles Airport is 114.5F, in July of 2005. Other Julys which reached at least 111F at the airport were in 1959 (111.4F), 1994 (111.0F), 2006 (112.8F) and 2009 (111.8F). At the cooperative station in town, an average maximum of 113.7F was recorded in July of 1925. However, the maximum temperature data for this month at Needles appear too high and may be problematic. Some departures from normal for Needles and other stations in July, 1925:
Needles 113.7 (+6.0) versus averages through 1930
Las Vegas 102.2 (-0.1) versus averages from 1908 to 1953
Parker 109.1 (+0.8) versus averages from 1894 to 2014
Blythe 108.9 (+1.6) versus averages through 1930
Kingman 94.3 (-3.5) versus averages from 1901 to 1967
The hottest afternoons in Death Valley during July, 1931, were from the 2nd to the 11th (ten Greenland Ranch maximums ranged from 120F to 123F, averaging 121.2F) and from the 17th to 26th (ten maximums from 121F to 126F, averaging 123.4F). The coolest days were the 30th and 31st, both with a high temperature of 115F. Minimums for the month at Greenland Ranch ranged from 70F to 100F and averaged 84.2F. The average daily range for the month was 36.4 degrees, which is several degrees wider than average for the station in its first few decades of operation.
Not surprisingly, the month was dry and clear for the most part. Greenland Ranch recorded zero precipitation, five cloudy days and 26 clear days. Tonopah observed the most rain, just 0.10″, all of it on the 30th. Beatty, Goldfield, Las Vegas and Needles had a handful of very light amounts during the last half of July, 1931. Interestingly, an official station at Baker was in operation from mid-July to mid-August in 1931. A little rainfall fell at Baker on the 13th, and a sandstorm was observed on July 20th. Beatty reported hazy conditions on the 14th and smoky conditions on the 15th.
As mentioned, the second half of July, 1931, was particularly and persistently hot. Here are the range of maximums and the average maximums for the 13 days from the 16th to the 28th:
Greenland Ranch 117-126, 122.3
Baker 112-120, 115.8
Las Vegas 105-117, 112.5
Clay City 107-118, 112.8
Beatty 100-109, 104.6
Haiwee 96-104, 101.8
Independence 98-106, 102.1
Goldfield 88-103, 96.2
Tonopah 87-98, 94.4
And, narrowing down to the hottest 9-day stretch, here are the departures from the normal July daily maximum for the period from July 18th to 26th, 1931 (with the average daily maximum for these nine days also provided):
+8.2 -178 ft Greenland Ranch/123.7
+8.0 940 ft Baker/117.2
+8.8 2033 ft Las Vegas/113.4
+8.6 2100 ft Clay City/113.6
+6.4 3309 ft Beatty/106.2
+7.9 3800 ft Haiwee/102.9
+7.5 3957 ft Independence/103.4
+7.7 5690 ft Goldfield/97.3
+8.4 6090 ft Tonopah/95.8
The nine-day period from July 18 to July 26, 1931, was one of the hottest 9-day periods in the region’s temperature-record history. All but one of these departures for this 9-day period is within one degree of eight degrees (F) above average. This is very noteworthy! Consider the large area involved and the wide range of station elevations. This record-setting heat wave began on about July 16th, when Greenland Ranch hit 117F. The maximums for the next 11 days were from 120F to 126F. The 28th reached only 119F. The daily maximum temperature charts above show how maximum temperatures behaved from the 16th to the 28th at Greenland Ranch and surrounding stations.
The one maximum which appears somewhat anomalous is the 100F at Beatty on the 21st. Beatty showed a trace of rain on this date, and Greenland Ranch and surrounding stations reported cloudy skies. Beatty observations were at 9 a.m., and maximum and minimum temperatures were “entered on correct dates,” according to the original form (i.e., the maximum temperatures were entered on the dates they actually occurred). Given that observation time at Greenland Ranch was at 5 p.m., which is relatively close to the hottest time of the day in midsummer, it is possible that its reported maximum of 123F on the 21st was a “carryover” from the 20th when the instruments were reset, and that the “actual” daytime high temperature was not as hot as 123F. The observer did not provide the “set max” temperatures this month at Greenland Ranch.
The charts below compare the average and extreme maximum temperatures in Death Valley and surrounding areas versus station elevation for the 13-day period from July 16th to July 28th.
(Needles was not plotted on most of these charts as it is outside of the region.)
The first chart again shows the excellent correlation between average maximum temperature and elevation for the nine stations for this 13-day period. A line drawn through the plots for Tonopah (highest at 6090 feet) and Greenland Ranch would have a slope of 4.45 degrees F/1000 feet. The second chart shows the extreme maximums versus station elevation for July 16-28, 1931. The station plots show a bit more scatter, but generally run through the points
100F @ 6000′
104F @ 5000′
108F @ 4000′
112F @ 3000′
116F @ 2000′
120F@ 1000′
125F @ sea level
Greenland Ranch reached 126F on three separate days: the 19th, 20th and 26th. During the 50 years of record at Greenland Ranch (1911 to 1960), only six summers had a day with 126F or hotter (if 1913 maximums are dismissed). Its most reliable maximum of 127F was attained in July, 1916, and in both July and August of 1933.
At the cooperative weather station in Las Vegas, 118F was recorded on the 26th, and 117F was attained on the 20th and 24th. On four days this July, the maximum thermometer read 116F, including on the 2nd and 3rd. All of these readings are important, because this station had never been warmer than 115F prior to 1931. In fact, from 1916 to 1927, the hottest temperature at Las Vegas was only 112F. After 1927 and until the mid-1940s, annual maximums were mostly from 112F to 115F. At Las Vegas Airport, annual maximums from 1949 to 2014 ranged from 109F to 117F with an average of 113F. The reading of 118F on July 26, 1931, is the hottest official temperature observed in Las Vegas.
Is the 118F maximum at Las Vegas in July, 1931, a trustworthy figure? The observer at the Las Vegas cooperative station was C.P. Squires for decades — from about 1913 to 1956. The reports from this station appear relatively consistent and reliable, and July, 1931, maximums are supported by surrounding stations. It would be interesting to know how conditions around the station changed through the 1920s, 1930s and 1940s. Based on the increase in annual maximums beginning around the late 1920s, perhaps a station relocation or a ground cover change (from moist to dry) took place.
There does indeed appear to be a general trend towards hotter maximums in summer at long-term desert weather stations. This is especially true for stations in “towns” versus those at airports or at remote and locations. During the first several decades of the 20th century, is was considered important to site the temperature instruments above grassy surfaces. This was in order to maintain consistency among all temperature stations across the United States and to allow “fair” temperature comparisons among all stations. By placing the thermometer shelter above a grassy surface, this effectively prevented any unwanted reflection of solar radiation onto the thermometer shelter, which could effect the thermometers and the measurements. It also effectively disallowed a very localized build-up of heat around the shelter, which might occur if it were sited above bare and dry ground. The cotton-region thermometer shelters in use from the late 1800s to around 2000 do tend to promote hotter readings of the ambient air temperature when wind is light and the sun is high in the sky and shining brightly. By the middle of the 20th century, the old idea of requiring siting of instruments above grassy surfaces was fading, at least for desert stations. Of course, grass is not natural in most desert locales. It may not be possible to maintain a nice and lush grassy area around a desert station year-in and year-out. Thus, maximums at stations where the surface changed from grassy to natural (or mostly bare) might go up a few degrees in summer, comparably. For stations in towns or small and developed areas, such as at the oasis area of Greenland Ranch, it is the norm for wind movement around the instruments to decrease with time as the local area develops. Structures near the station become more numerous, trees are planted and nurtured and get taller and taller, bushes and fences appear nearby, and eventually a station that had excellent exposure to the wind is a station with somewhat poor exposure to the wind. Poorer ventilation through a cotton region shelter that is above bare ground will always promote hotter maximum temperature readings. Such may be the case at the cooperative weather station in Las Vegas during the first half of the 20th century.
Annual maximums at Tonopah from 1906 to 1953 ranged from 91F to 99F (except for 88F in 1907). The station was in town during this period and the observer was (primarily) the United States Weather Bureau. In July, 1931, Tonopah reached 98F on the 19th and 97F on the 26th. Greenland Ranch reported 126F on both of these days. (On July 10, 1913, when Greenland Ranch reported 134F, Tonopah reached only 89F.)
Independence reached 106F on July 19, 1931. This was the hottest on record for the town, tying the 106F readings on July 13 and 14, 1925. On July 10, 1913, Independence had a maximum of 103F. Only 1934 (with 109F) had a maximum greater than 106F at Independence through 1944.
It is a little surprising that Beatty only reached 109F during the last half of July, 1931. It had 110F on the 3rd of July, 1931, and was as warm as 112F in 1918, 1923 and 1925.
Trona reached 116F on the 20th and other dates, two shy of its all-time maximum of 118F (reached numerous times).
Goldfield is 90 miles north-northwest of Furnace Creek, and temperature records began in 1906. (The station was named “Columbia” and was one mile north of Goldfield from 1906 to 1916.) Six days in about 95 summers of record have reached 103F on the maximum thermometer here. These were during July 1928, July 1931, August 1934, July 1937 and July 2002. Three other days in the Columbia/Goldfield record had even hotter maximum temperature reports, but these are extremely suspect: a high temperature of 108F was recorded on July 20, 1906, and on June 9 and June 14 of 1935.
Let’s compare maximum temperatures at Columbia/Goldfield, Tonopah and Greenland Ranch/Death Valley on the dates with 103 and 108F:
July 20, 1906 Columbia 108F Tonopah 87F
July 26, 1928 Goldfield 103F Tonopah 94F Greenland Ranch 124F
July 27, 1928 Goldfield 103F Tonopah 94F Greenland Ranch 125F
July 19, 1931 Goldfield 103F Tonopah 98F Greenland Ranch 126F
August 16, 1934 Goldfield 103F Tonopah 89F Greenland Ranch 118F
June 9, 1935 Goldfield 108F Tonopah 84F Greenland Ranch 114F
June 14, 1935 Goldfield 108F Tonopah 80F Greenland Ranch 108F
July 9, 2002 Goldfield 103F Tonopah AP 103F Death Valley 128F
Goldfield’s maximums of 103F in 1931 and 2002 appear legitimate, as they are well supported by the maximums at Tonopah and in Death Valley. These two days are among the very hottest in the region since the 1890s.
The two 103F maximums at Goldfield on consecutive days in July, 1928, are only weakly supported, as nearby Tonopah was nine degrees cooler on both days. At an elevation 400 feet lower than Tonopah, Goldfield has a two-degree advantage on summertime maximums. Better exposure and ventilation through the ridge-top town of Tonopah would promote somewhat cooler maximums (by a degree or two?) there on sunny afternoons compared to Goldfield, which is on a flat and gently sloping plain. In July 1928, the average maximum was 87.0F at Tonopah and 90.3F at Goldfield, both close to average for July. But the Goldfield maximums during the last week of July, 1928, appear to be several degrees too warm. Goldfield had 102F on both the 23rd and 24th, when Tonopah showed 91F and 92F. These daily differences of about ten degrees are anomalous and the maximums at Goldfield should be regarded as suspect. Why, if indeed the 102F and 103F maximums in July, 1928, are not authentic, would these incorrect reports occur? Was a substitute observer taking the observations while the primary observer was away? Did the alternate observer know how to properly read and reset the instruments? Was he or she artificially “inflating” the maximum temperature readings for some reason?
In June, 1935, both Clay City and Las Vegas had monthly highs of 110F on the 20th. Goldfield shows a maximum of 94F on the 20th, which is entirely reasonable. But how did Goldfield manage maximums of 108F on both the 9th and 14th in June of 1935? Tonopah is only a few hundred feet higher than Goldfield and only 20 miles to its north, yet maximums there were 24 and 28 degrees cooler!
The maximums of 103F in 1928 and 1934 and the 108F maximums in June, 1935, at Goldfield are not supported by the maximums at Tonopah, Greenland Ranch and surrounding stations. The Goldfield forms are signed by the same employee (Albert Higinbotham) of the Nevada-California Power Company from the summer of 1928 to the summer of 1945. The first form signed by Higinbotham was the one for June of 1928, and a month later were those rather dubious 103F maximums. Given the handful of untrustworthy maximums at Goldfield described here, the entire Goldfield climate record while A. Higinbotham served as the observer might be described as “less than solid” and requiring extra scrutiny and a healthy dose of skepticism, especially for any data that might seem problematic.
The 108F maximum at Goldfield in 1906 (during its first summer of operation) and its two 108s in June 1935 should be discarded as the values are not supported by surrounding stations. Its own long record reveals that the very hottest days at Goldfield are only able to reach 100 to 103F. Goldfield’s most reliable extreme maximum of 103F for its nearly 100 years of record fits nicely onto the graph of extreme maximums for each station versus elevation.
Is it not interesting that, like Greenland Ranch, the Goldfield record contains a handful of very doubtful record maximum temperatures which are a full five degrees warmer than the most reliable record maximum temperature for the station? And is it not interesting that, as at Greenland Ranch, these doubtful reports were very early in the station history and/or by observers which worked for a company which operated the station? Is it possible that, at Goldfield, an inexperienced (or perhaps a “super-motivated”) observer was somewhat less-than-impressed by the maximum temperatures indicated by the thermometer in the station shelter, and recorded inflated and totally bogus values which better reflected what he or she “thought” the real high temperature was, based on other thermometers in town or near the station?
—-
The month of July, 1931, was one of the hottest on record in the Death Valley and Mojave Desert regions. The 3rd and 4th weeks were exceptionally warm, with all stations setting, or flirting with, their all-time record maximum temperature up to that point in time. There is a very close and solid correlation between elevation and average maximum temperature among all of the stations in the region, and between elevation and highest maximum temperature for the July 16 to 28 time frame, as shown in the charts above. Most stations are within a couple of degrees of a line with a slope of 4.5 degrees (F)/1000 feet from the plot for Greenland Ranch. Stations to the left of the line may be generally cooler for their elevation due to better instrument exposure, and/or are in a cooler desert environment (such as those in the Owens Valley); stations to the right of the line may be generally a little warmer for their elevation due to exposure and/or ground cover reasons. Or, it is possible that some of the differences (left or right of the line) could be due in part to other factors, such as time of observation or proximity to the average center of the regional heat wave.
The thermometer at Greenland Ranch reached 126F during July, 1931, well short of the five maximums that ranged from 129F to 134F during July, 1913. If Greenland Ranch could not even attain a temperature of 129F during July, 1931, one of the hottest months on record; then how to explain the ultra-high maximum temperatures there in July, 1913, when the regional heat wave was not as pronounced?
July 1933
July 11 to July 29 heat wave
Similar to July, 1931, the Death Valley region endured a lengthy and quite pronounced heat wave during July, 1933. Here are the Climatological Data issues and cooperative station climate forms for the month at area stations:
1933 July CA CD 1933 July NV CD
1933 July Needles 1933 July Trona 1933 July Haiwee 1933 July Inde 1933 July GR
1933 July Tonopah 1933 July Las Vegas 1933 July Goldfield 1933 July Clay City 1933 July Beatty
In Climatological Data for Nevada, the summary for July, 1933, begins: “The month rates as the second warmest in Nevada during 45 years of record, the mean temperature recorded having been exceeded only in 1931.”
The mean temperature at Greenland Ranch in July, 1933, was 106.6F, but the minimums for the first seven days of the month (which was the coolest week of the month) were missing. The average maximum of 119.9F was slightly cooler than that for July, 1931, but only because the first ten days of the month averaged a degree or two below average. Beginning on July 11th, the maximums began a remarkable run on the hot side, averaging 123.2F for 19 days. All but one maximum was 120F or higher from the 11th through the 29th, culminating with 127F on both the 26th and 27th. These 127F readings are the highest reliable temperature observations at Greenland Ranch during its run from 1911 to 1960. Hot nights were common, with a dozen minimums ranging from 97F to 102F. Ross Boswell was the observer this month, and the Greenland Ranch observations appear trustworthy.
During the very hot spell from the 11th through the 29th, all but four days were recorded as “clear” by the observer at Greenland Ranch. Strangely, perhaps, the only day marked as “cloudy” was the 27th, which had a maximum of 127F and 0.01″ of precipitation. Since the “set max” temperatures were not provided, and since the time of observation (5 p.m.) was close to the hottest part of the afternoon, it is possible that the maximum of 127F for the 27th actually occurred around observation time on the previous day (which had a high temperature of 127F). At nearby Clay City, NV, however, the maximum temperatures on the 26th and 27th (115F and 114F, respectively) support both 127F maximums at Greenland Ranch. Clay City had 0.03″ of precipitation on the 26th and none on the 27th. The time of observation at Clay City is not recorded on its form for July, 1933. “Generally cloudy” conditions were in the remarks column for Clay City on the 26th and 27th. Up the road at Beatty, the maximums of 110F and 111F on the 26th and 27th also support the 127F maximums at Greenland Ranch. Partly cloudy skies were reported at Beatty on these dates, and 0.02″ was measured in the gage around 9 a.m. on the 28th.
The averages and extremes for stations in the region, July 1933:
Greenland Ranch 119.9/93.2*/106.6* 127/68* 0.01″ (observer Ross Boswell)
Needles 109.3/82.3/95.8 116/65 0.08″
Trona 108.7/75.1/91.9 115/60 0.02″
Las Vegas 108.7/74.5/91.6 115/64 Tr.
Yucca Grove, CA 98.8/65.9/82.4 106/49 0.20″
Clay City, NV 109.5/72.6/91.0 116/56 0.03″
Beatty 101.0/61.3/81.2 111/45 0.02″
Haiwee** 100.0/82.4/91.2 105/74 0.03″
Independence 98.3/65.4/81.8 104/54 Tr.
Goldfield 94.0/58.7/76.4 102/47 0.10″
Tonopah 89.3/66.4/77.8 97/56 0.03″
* — seven minimums missing at Greenland Ranch (1st-7th), estimated average minimum for 31 days is 89.5F
** — Haiwee temperature data very suspect: minimums appear much too warm and daily ranges too small
The charts above show the change of maximum temperatures with elevation (the average maximum for the 19 days from July 11 – 29 on the chart on the left and the highest maximum for those 19 days on the right). The slope for the average maximums (for a line drawn from Greenland Ranch and splits Tonopah and Goldfield) is about 4.5 degrees F/1000 feet. There is a good correlation between temperature and elevation among all of the stations: the maximum temperatures at each station support the maximum temperature reports at the other stations in the region.
Let’s take a look at how the average maximums for July 11 – 29 at regional stations compared to the long-term average daily maximum for July (those values utilized in the section for July, 1931):
Greenland Ranch, 123.2F/+7.7
Clay City, NV 112.7F/+7.7
Tonopah 93.1F/+5.6
Goldfield 97.7F/+8.1
Las Vegas* 109.5F/+4.9
Independence 101.4F/+5.5
Beatty 104.5F/+4.7
Haiwee 102.7F/+7.7
Needles 110.4F/+2.7
Trona 112.2F/+5.8
*two maximums missing at Las Vegas
For this 19-day period, the average maximums in the Death Valley region ran about 5 to 8 degrees above the long-term averages for July.
Greenland Ranch and the Death Valley region endured three separate “very hot” spells during this month. Maximums from July 12 – 16 were 124, 124, 125, 124 and 126F. Maximums from the 19th to 21st were 122, 123 and 124F, respectively; and maximums from the 24th to the 28th were 122, 125, 127, 127 and 124F. Although Greenland Ranch had its hottest maximum during the third of these hot spells, several of the nearest stations were hotter during the first hot spell. Here are the hottest maximums at regional stations for each of the hot spells of July 12-16, July 19-21, and July 24-28, 1933:
Greenland Ranch 126, 124, 127
Tonopah 97, 94, 95
Goldfield 102, 101, 99
Beatty 109, 106, 111
Clay City 116, 114, 115
Independence 104, 103, 103
Trona 115, 113, 115
Haiwee 105, 105, 105
Yucca Grove 106, 103, 104
Las Vegas 114, 112, 110
Needles 116, 114, 111
The hottest temperature of the month at Las Vegas was 115F on the 4th, but that figure is not well-supported by the maximums on the 4th at the above stations (e.g., only 87F at Tonopah, 106F at Clay City and 108F at Needles).
Stations well to the southeast of Death Valley (Las Vegas and Needles) were not as hot during the “third” hot spell. It is not uncommon for monsoon moisture to effect areas south and east of Interstate 15 towards the latter half of July and into August and September. As the humidity increases, high temperatures usually moderate some, and that may explain some of the lower maximums during the last week of July, 1933.
Yucca Grove’s average maximum of 98.8F is the hottest average maximum for any month for its period of record from 1932 to 1954. This station was near Halloran Summit northeast of Baker, along (now) Interstate 15, at an elevation of 3951 feet.
Tonopah managed a 97F in July 1933, on the 14th. This is two degrees short of its all-time record maximum of 99F. When Greenland Ranch reached 127F on the 26th and 27th, Tonopah observed maximums of 95F and 94F. (Maximums in the mid-to-upper 90s at Tonopah support Death Valley maximums of around 124F to 128F.) In July, 1913, Tonopah reached only 92F (on the 6th and 12th), and had a maximum temperature of only 89F on the 10th, when Greenland Ranch showed 134F. ALL of the maximums at Tonopah were 90F or warmer from July 11 to July 29, 1933, and eleven days during this stretch were hotter than 92F. If the maximums at Greenland Ranch in July, 1913, are authentic (with five maximums ranging from 129F to 134F), then, given the reports at Tonopah, why was July, 1933, only as warm as 127F at Greenland Ranch? The air in the region at altitudes of about 6000 feet was clearly warmer during much of July, 1933, compared to July, 1913, based on the maximums at Tonopah.
At Independence, the maximum temperature this July (104F) was about the same as for July, 1913 (103F, on the 10th). Independence had TEN maximums of 102F to 104F during July of 1933. Despite the plethora of exceptionally hot days this month in the Owens Valley and Death Valley regions, Greenland Ranch (with 127F) fell well short of the highest maximums recorded there during July, 1913. (Keep in mind that Independence and the Owens Valley may have been slightly drier and warmer in 1933 versus 1913 as Owens River flow was diverted to Los Angeles beginning in 1913.)
Goldfield’s average maximum of 94.0F for July, 1933, is the second hottest for any July there from 1907 to 2009. (Eight Julys were missing at Goldfield for this timeframe, primarily in the 1950s). This is five degrees above Goldfield’s average, or “normal,” daily maximum of 89F. The hottest reliable average maximum for any month is 94.6F in July, 1917. July, 1906, came in with an average maximum of 97.1F at Goldfield (including one day with 108F), but these maximums appear much too warm, are not supported by other stations, and may have been due to poor instrument exposure. August, 1934, shows an average maximum of 94.2F, about seven degrees above the long-term average for August. This would be the second hottest average maximum on record for any month at Goldfield, but it is also rather dubious, given the average maximum of only 86.4F at nearby Tonopah for August, 1934 (which is only one or two degrees warmer than its August long-term average maximum temperature). The next three hottest months at Goldfield (with reliable average maximums) are 93.8F in July, 1931; 93.7F in July, 1942; and 93.6F in July, 1959. Discounting the very dubious (or unrepresentative?) reports of 108F in July of 1906 and in June of 1935, the hottest temperature recorded at Goldfield is 103F. Temperatures of 102F and/or 103F have been attained in eight Julys and two Augusts since 1907. In July, 1933, Goldfield reached 102F on the 14th (when Greenland Ranch reported 125F). On the 26th and 27th, when Greenland Ranch had 127F, Goldfield reached 99F and 95F, respectively.
For its period of record from 1923 to 1995, the average maximum of 100.0F at Haiwee for July, 1933, was second only (for any month) to July, 1931 (which had 100.5F). (Haiwee data after about 1995 is problematic.) Though temperatures reached 106F to 110F in about two dozen separate months from 1923 to 1995 at Haiwee, the station reached only 104F in July, 1931, and only 105F in July, 1933. The temperature record for Haiwee in July, 1933, may not be trustworthy. Minimums appear too warm and daily ranges appear too small during most of the month. Minimums failed to drop below 82F from the 11th through the 29th. This seems very unlikely, given the station elevation of 3800 feet and siting near a reservoir, in the bottom of a river valley. Long-term average daily temperature ranges for July at Haiwee is near 34 degrees, but the daily range in July, 1933, was only 17.6 degrees. Also, the monthly high of 105F was attained on eight dates, including five in a row from the 17th to the 21st. This rather unusual “pattern” casts additional doubt upon the record, and all of the temperature reports from Haiwee for July, 1933, should be regarded as suspect.
August 1933
August 9 to August 15 heat wave
1933 Aug GR 1933 Aug Independence 1933 Aug Yucca Grove 1933 Aug Trona
1933 Aug Haiwee 1933 Aug Needles 1933 Aug Goldfield 1933 Aug Clay City 1933 Aug Beatty
1933 Aug Las Vegas 1933 Aug Tonopah
An intense heat wave enveloped the Mojave Desert and Death Valley regions during the second week of August, 1933. This event occurred two weeks after the three-week period of exceptionally hot weather from mid-to-late July, 1933. Maximum temperatures reached all-time record levels from the 12th to the 14th at most of the stations in the region! A heat event as prominent as this one is rather unusual, in that it occurred close to mid-August, more than seven weeks after the summer solstice.
Let’s take a look at some of the very high maximums!
At Greenland Ranch, observer Ross Boswell recorded five consecutive days with maximums of 123F to 127F. Maximums from the 11th to the 13th were 126F, 127F and 125F. Minimums were near 90F each day, suggesting that humidity levels were not high. Skies were “partly cloudy” from the 11th to the 13th.
For the 50 Augusts from 1911 to 1960 at Greenland Ranch, monthly maximums ranged from 115F to 127F and averaged 121.6F. Below is the frequency distribution of August maximums from 1911 to 1960:
115 1
116 0
117 1
118 3
119 2
120 7
121 12
122 7
123 5
124 8
125 1
126 2
127 1
At Death Valley, from 1961 to 2015, August monthly maximums have ranged from 116F to 127F, averaging 122.2F.
The 127F maximum at Greenland Ranch on August 12, 1933, is the hottest August maximum of record for Greenland Ranch/Death Valley (1911-2015). The record was tied when 127F was attained on August 2, 1993.
The maximum of 127F at Greenland Ranch on August 12, 1933, also ties for hottest temperature on record at Greenland Ranch, if its dubious reports for July, 1913, are discarded. The Greenland Ranch observer recorded a 127F maximum on July 23, 1916; and again on both July 26 and July 27 of 1933. After 1933, 39 years elapsed before the next authentic 127F temperature occurrence at a Furnace Creek-area station. July 14 and 15 of 1972 both reached 128F at Death Valley. Greenland Ranch showed a report of 129F in July, 1960, but nearby Cow Creek only had 124F on the date in question. The maximum of 129F at Greenland Ranch in 1959 is very suspect.
The station closest to Furnace Creek that was operating in August, 1933, was Clay City. This station was on the flatlands of the Amargosa Valley, about 27 miles east of Furnace Creek. It was a couple of miles east of where (now) California Route 127 and Nevada Route 373 meet at the state line, near Ash Meadows. Clay City records are available in full for only seven full summers. Annual maximums ranged from 114F to 118F. Elevation here is 2185 feet. Clay City reported 118F on July 29, 1927, but that figure is not supported by surrounding maximums. The station had 117F on July 27, 1934; and, its most reliable reading of 118F on August 13, 1933. As at Greenland Ranch this August, the 11th, 12th and 13th were absolute scorchers, with 116F, 117F, and 118F at Clay City.
Beatty, about 32 miles north of Furnace Creek, had consecutive maximums of 110F, 112F and 113F. These entries were for August 12, 13 and 14. The time of observation here was at 9 a.m., so the actual maximums likely occurred on the previous afternoons. The observer form indicates that the max and mins were “entered on correct dates,” i.e., on the dates that these maximums actually occurred. But the maximums at Greenland Ranch and Clay City suggest perhaps that was not the case. The 113F maximum at Beatty, reached on the 13th or 14th, is the hottest temperature in Beatty’s record from 1918 to 1959. Annual maximums of 112F were recorded at Beatty in three different summers from 1918 to 1925, and these seem to be a little on the high side. Perhaps the shelter location was not ideal (or was above bare ground!). Beatty’s 112F maximum on August 18, 1939, appears rather doubtful (Greenland Ranch had 119F on that date), and the station reached as high as “only” 110F during all of the 1940s and 1950s. New record maximums of 114F and 115F were set at Beatty in 1960 and 1961. Its 113F reading in August, 1933, is Beatty’s all-time maximum for all Augusts from 1918 to 1972. A few Augusts were missing.
Well to the southeast of Clay City and Furnace Creek, at Las Vegas, this August heat wave was not nearly as impressive. Las Vegas had maximums of 110F on the 11th, 12th and 14th. These were three to seven degrees cooler than those at Clay City, which is/was just 150 feet higher in elevation. On August 13, 1933, though, when Clay City hit its record maximum of 118F, the maximum and minimums at Las Vegas were marked as missing.
A new station was established by the Southern Sierra Power Company in the higher terrain between Baker and Las Vegas in 1931. “Yucca Grove” was at 3951′ elevation, near Halloran Summit, along what is now Interstate 15. The exposure for this station was undoubtedly excellent, as the nearest community is many miles distant! Yucca Grove reached 106F in July, 1933, which, along with a couple of other 106F readings from 1931 to 1954, was the hottest temperature on record…except for the maximum of 108F on August 12, 1933! This record of 108F for Yucca Grove was preceded by a 106F on August 11th and followed by a 106F on August 13th. Unfortunately, it appears there was no official station operating down the road in the Baker area during the summer of 1933. Baker, about 3000 feet lower than Yucca Grove, may have been as hot as 122 to 123F on August 12 and 13, 1933.
In the Owens Valley, at a similar elevation as Yucca Grove, Independence tied its all-time record (up to that point in time) with 106F on August 14, 1933. Maximums of 104F were recorded on each of the previous three days. The sky condition was marked as “cloudy” on the 13th and “partly cloudy” on the 12th and 14th, so it is possible that some afternoon cloud cover could have held maximums down a little here. The observer at Independence was the U.S. Weather Bureau. Reliable summertime temperature records commenced at Independence in 1893. Prior to August, 1933, 106F had been attained in only July of 1925 and July of 1931. The thermometer hit 105F in late July of 1898 and 103F in July of 1913, when Greenland Ranch reported 134F. All but four annual maximums at Independence were within three degrees of 100F from 1893 to 1930. Data for the summers of 1896 and 1897 are not available.
Down the road at Haiwee, minimum temperatures appear to be too high again in August, 1933. But, the maximums look okay, and the 106F maximums on the 12th and 13th are likely trustworthy. Both of these days were “cloudy” at Haiwee, according to the observer for the Los Angeles Aqueduct. From 1923 through 1971, the hottest temperature at Haiwee was 107F, on several dates.
Up at Goldfield and Tonopah, maximums on the 12th and 13th flirted with all-time records up to that point in time. Goldfield reached 102F on both the 12th and 13th, one degree shy of its most reliable maximum for its entire period of record. Tonopah hit 96F on both the 12th and 13th, two degrees short of the record 98F reports in July of 1922 and July of 1931. Tonopah later reached 99F in 1942 and 1953. These two 96F readings at Tonopah in August, 1933, tie for the record hottest at Tonopah for all Augusts from 1902 to 1953. (The official Tonopah weather station moved to the airport, 700 feet lower in elevation, in 1954.)
Finally, at Trona, an impressive run of maximums of 116F, 117F, and 118F was recorded from August 11 to 13, 1933. The 118F reading on August 13th was the hottest yet recorded at Trona since the station opened in 1920, and it has yet to be exceeded! Seven other months in Trona’s long period of record have had high temperatures of 118F. Trona will hit 120F eventually, and it is a little surprising that it has not yet. Given the station location in town, at a chemical plant, 95 summers of record, at an elevation (1695′) well under 2000 feet near the bottom of Searles Basin, it is just a matter of time! In between Trona and Furnace Creek, at Ballarat in Panamint Valley, it is probable that a dozen years at least have been as hot as 120F since 1920, though no official weather stations have been established in the Panamint Valley. Ballarat is at 1079′ elevation and the bottom of Panamint Valley is about forty feet lower.
July 1934
1934 July Greenland Ranch 1934 July Tonopah 1934 July Goldfield
1934 July Clay City 1934 July Beatty 1934 July Yucca Grove
1934 July Independence 1934 July Haiwee 1934 July Trona
The early-to-mid 1930s were the Dust Bowl years for the Great Plains of the United States, and the large and hot upper-level highs over the middle of the nation occasionally expanded over the western states. Exceptionally hot weather for the deserts of California and Nevada resulted. In July, 1934, two short but intense heat waves impacted Death Valley and the Mojave Desert. The thermometer in Greenland Ranch’s instrument shelter reached 125F on the 12th and on the 27th. On July 28th, a maximum of 124F was recorded, and observer Earl Boswell was treated to a “cloudburst and electrical storm” from 10 p.m. to 10:45 p.m., with 0.64″ rain in the station rain gage. A handful of stations in the region flirted with all-time record maximums this month, primarily with the second heat wave. Independence trounced its previous record of 106F with a 109F reading on July 27.
Below are listed the maximums at area stations for each of the two hot events, with the dates of occurrence:
Greenland Ranch 125 (12) and 125 (27)
Beatty 107 (13) and msg
Clay City 116 (12) and 117 (27)
Goldfield 99 (12) and 101 (27)
Tonopah 94 (11 and 12) and 96 (27 and 28)
Independence 104 (12) and 109 (27)
Haiwee 104 (13) and 106 (27)
Las Vegas 113 (12) and 114 (27)
Yucca Grove 104 (12) and 105 (27)
Independence was the only station to set a new all-time maximum temperature record. Trona, Haiwee, and Clay City came up one degree short, at least for their records through July, 1934. This was one of thirteen Julys at Greenland Ranch to reach 125F, from 1911 to 1960. Skies were clear during both hot spells at area stations, and on the 13th, when the mercury hit 114F, the observer at Clay City remarked “hotter than hell.” He was able to cool off on the 29th in the Amargosa River, which was running due to the area thunderstorms on the night of the 28th.
July 1936
July 14 to July 25 heat wave
1936 Jul Greenland Ranch 1936 Jul Cow Creek 1936 Jul Haiwee 1936 Jul Independence
1936 Jul Yucca Grove 1936 Jul Tonopah 1936 Jul Goldfield 1936 Jul Las Vegas
1936 Jul Clay City 1936 Jul Trona
July, 1936, was another July with a temperature as high as 125F at Greenland Ranch. Both the 17th and 18th hit 125F, and perhaps even more impressive, all twelve days from July 14 to July 25 were 120F or hotter, according to the record. There were three other days with 120F or greater during the first week of July, 1936. However, the average maximum for the month was near normal (115.5F), thanks to a couple of “cool” and cloudy periods. Three days had maximums in the upper 90s. In addition, three minimums were 101F to 102F.
The new National Park Service station at Cow Creek, just three miles north of Greenland Ranch, hit 124F on the 16th, 17th and 18th. The time of observation here was 6 p.m., and the “set max” temperature on the 18th was 116F. The maximum temperature recorded on the 19th at Cow Creek was “only” 116F, which implies that the actual high temperature here during the day on the 19th might have been even lower than 116F. Greenland Ranch reported a maximum of 125F on the 18th, and its “set max” temperature at the time of observation (5 p.m.) was not provided on the observer’s official form. The maximum temperature recorded at Greenland Ranch for the 19th was 121F. Given the data available from nearby Cow Creek, it is very likely that the actual maximum temperature during the day on July 19th at Greenland Ranch was only 116F or less. The 121F temperature was from the previous afternoon. And, of course, this would mean that Greenland Ranch did not actually have 12 consecutive days with 120F or hotter. But since the time of observation is rather close to the hottest part of the day, it is not unusual to have “carry-over” maximums from the previous day, especially if there is a pronounced cool-down. The time of observation at Greenland Ranch was typically 4 p.m. or 5 p.m. during much its period of record. Since the “set max” temperature was not provided most of the time, it might be difficult-to-impossible to know if certain maximums are due to conditions around observation time on the previous day. Desert stations with mid-to-late afternoon observation times will occasionally have these “carry-over” maximums, which cause slightly inflated average daily maximum temperatures for the month. It is important to keep these possibilities in mind if comparing maximum temperatures among area stations day-to-day.
The following list provides the extreme maximum and average maximum temperatures for the period from July 14-25, 1936, plus the departure of this average maximum for the twelve days from the long-term average daily maximum for July.
Greenland Ranch 125/122.3/+6.8
Cow Creek 124/121.8/+5.8
Clay City 115/112.4/+7.4
Goldfield 102/96.8/+7.2
Tonopah 95/91.8/+4.4
Independence 104/99.8/+3.9
Haiwee 100/96.9/+1.9
Trona 115/111.2/+5.7
Yucca Grove 104/101.5/+5.9
Las Vegas 114/110.3/+5.7
Most stations were about six degrees hotter than the average daily maximum for July from the 14th to the 25th. Haiwee was somewhat suspiciously cool, reaching only 100F during the period. Were the instruments above a VERY well-watered lawn at Haiwee?
August 1936
August 1 to August 7 hot spell??
1936 Aug Cow Creek 1936 Aug Greenland Ranch 1936 Aug Independence
1936 Aug Haiwee 1936 Aug Yucca Grove 1936 Aug Tonopah 1936 Aug Goldfield
1936 Aug Las Vegas 1936 Aug Clay City 1936 Aug Trona
The first week of August, 1936, was very hot in Death Valley, according the record from Greenland Ranch. Greenland Ranch showed four maximums from 124F to 126F from the 2nd to the 6th. Cow Creek, however, reported just one very hot maximum, with 125F on the 4th. Oddly, the maximum at Greenland Ranch on the 4th was eleven degrees cooler, at 114F. The other Cow Creek maximums from the 2nd to the 6th were 118F and 116F, well below those reported at Greenland Ranch. What was going on this week?! For these two stations, just three miles apart, nearly all maximums on summer afternoons are within two degrees.
Whereas the maximums during this week at Greenland Ranch and Cow Creek both came to within one degree of the record maximum for their respective periods of record (126F for Cow Creek from 1934-60 and 127F for Greenland Ranch from 1911-60), other area stations fell well short. Trona reached only 110F, eight short of its record. Clay City was only 109 (nine degrees short), Independence was only 99F (ten degrees short), and Goldfield was only 96F (seven degrees short). It was the same story at Tonopah, Las Vegas, Yucca Grove, and Haiwee.
The Cow Creek maximums during the first week of August, 1936, match up decently with the other stations, if the 125F report on the 4th is dismissed. The very high maximums at Greenland Ranch appear to be too high and are very suspect. During the second two weeks of this August, the maximums at Greenland Ranch and Cow Creek match up closely, as would be expected, except for the 9th and 10th, when Greenland Ranch maximums were 8 and 6 degrees warmer than Cow Creek. The first one of these might be explained by a carry-over temperature. But it is apparent that a handful of Greenland Ranch maximums this month are very dubious. The Greenland Ranch form is signed by Ross Boswell, in his sixth summer here as observer. The best explanation for the bad maximums at Greenland Ranch may be that Mr. Boswell was not at the ranch for a period of time and some maximum temperature reports were “guessed” or “estimated.” As for the 125F maximum at Cow Creek, that also appears problematic as the other stations do not support such a hot temperature. The charts above comparing temperature to elevation for the first week of August, 1936, show station plots generally 4 to 8 degrees on the “cool” side of the line drawn from Greenland Ranch. When all stations deviate to such an extent, then it strongly suggests a problem with some temperature reports.
Looking into this “mess” a little further, it is indeed quite strange that both Greenland Ranch and Cow Creek reported nearly identical very hot maximums during the middle of that first week. Could these very hot monthly maximums really be legitimate, even if the other stations in the region provide little-to-no support? The observer at Cow Creek was an employee of the U.S. National Park Service, and this agency generally provides good, trustworthy data sets. A “Thomas J. Williams” signed the form for Cow Creek. Let’s assume for a moment that Cow Creek did indeed reach 125F on the 4th, and Greenland Ranch did indeed reach 126F around the same time. What might have happened? We’ll have to take a closer look at the data. For simplicity, we will compare daily maximums at stations in the region this week with their respective average daily maximums for July.
Daily departures (from the July average) for maximums from August 1 to 7, 1936:
Greenland Ranch (ave 115F) +1, +10, +9, -1, +10, +11, +3
Cow Creek (ave 116F) -4, +2, +2, +9, 0, 0, +3
Clay City (ave 105) +3, +4, +2, -1, -7, 0, +3
Trona (ave 106) +2, +4, +4, +1, -1, 0, +2
Tonopah (ave 86) -2, +2, +3, 0, -3, +2, +3
Independence (ave 96) 0, +2, +3, 0, -1, +1, +2
The Greenland Ranch departures on the 2nd and 3rd and 5th and 6th are very large compared to the other stations. At Cow Creek, the departures are generally similar to the other stations (ignoring Greenland Ranch) except for the 4th, the date with 125F there. Other stations were very close to normal on the 4th, while Cow Creek was nine degrees above average. Clay City was unusually cool compared to the other stations on the 5th, but it had rain on the 4th (0.06″) and may have been cloudy on the 5th. Trona showed clear skies on the first three days of August, and partly cloudy from the 4th to the 7th. A total of 0.35″ of rain had fallen by observation time on the 5th at Trona. Goldfield had a little rain on the 3rd (0.01″) and was “windy” on the 3rd and 4th.
The form for Greenland Ranch shows “clear” for the first four days of the month, “cloudy” for the 5th (even though the maximum jumped up from 114F on the 4th to 125F on the 5th!), and “clear” on the 6th and 7th. Minimums were in the low 90s for the first five days, and then 101F and 102F on the 6th and 7th, respectively. The column of minimum temperature readings on the Greenland Ranch form has a line drawn through it with the notation: “min thermometer found to be in error.”
On August 5th, the Greenland Ranch form indicates a “cloudburst.” Observer Ross Boswell noted that rain occurred from 9 p.m. to 11:45 p.m. An amount of 1.10″ was recorded on the 5th. If the storm was indeed during the late evening hours of the 5th, then the amount of 1.10″ should have been entered on the 6th. It is entirely possible that the storm was on the evening of the 4th, however, if Boswell’s entry of 1.10″ on the 5th is accurate. Does the Cow Creek form clear things up? Not really. It indicates a storm from 10 p.m. to “D.N.” on the 4th, with 0.34″ of rain entered on the 4th. With a time of observation of 6 p.m., the amount of 0.34″ at Cow Creek should have been entered on the 5th, if the rain was during the evening of the 4th. Of course, we are assuming that it was the same storm that affected both stations. It appears most likely that the storm was during the evening of August 4th. (Trona’s report of 0.35″ on the 5th also supports this timeframe.) The Cow Creek observer noted cloudbursts on three occasions in the nearby mountains this month, which washed out roads in the canyons and in Death Valley. And, he noted a “windstorm” on the 4th.
It is apparent that the atmosphere was moist and unstable in the Death Valley region on the 4th and 5th. If the maximum of 125F at Cow Creek on August 4th is legitimate, then perhaps it was due to a rather rare and dry convective downburst, or “heat burst.” A downburst could have caused air to descend from higher-than-normal altitudes of the troposphere in and around Furnace Creek. Recall that the Cow Creek observer noted a “windstorm” on the 4th, when 125F was measured.
The temperature at Tonopah is usually a decent indicator of the temperature about 6000 feet above Furnace Creek on summer afternoons. The high temperature at Tonopah was 86F on the 4th (down from 89F on the 3rd). (In normal situations, Tonopah is usually near 95F when Furnace Creek stations are near 125F.). If air at 86F at 6090 feet is forced to descend to an elevation of -152 feet (Cow Creek’s elevation), it will warm adiabatically (5.5 deg F/1000 feet) by about 35 degrees to a temperature of 121F. This is not TOO far from Cow Creek’s 125F reading. It might be that a nearby strong storm on the afternoon of the 4th (before the 6 p.m. observation of 125F at Cow Creek) dragged air down from an unusually high altitude to account for the localized and enhanced temperature increase at Furnace Creek. As was noted already, none of the surrounding stations support the 125F at Cow Creek on the 4th — other stations were close to average and Cow Creek was nine degrees above average. On typical sunny summer afternoons in the entire region, the troposphere mixes strongly to about 600mb, or to about 14,000 to 15,000 feet. In these instances, afternoon soundings from Desert Rock and Las Vegas show that temperature decreases at a rate very near the dry adiabatic lapse rate from the surface to about 600mb. If a strong storm were able to drag air down to the surface from even higher levels — from the 500mb level, perhaps — then it is indeed possible that locally higher maximums could be realized, even ten degrees higher compared to a typical afternoon maximum during “normal” conditions.
Here is a possible scenario. On August 4th, the typical afternoon (dry) convection under mostly sunny skies in and around Death Valley caused temperatures to rise to near-normal levels at area weather stations. Near Furnace Creek, the maximum thermometer at Cow Creek climbs to perhaps 117F around 3 or 4 p.m. following its morning minimum of 92F. It is a very typical summer day, temperature-wise, thus far. And, as often happens on August afternoons, deep, moist convection developed over the mountains on one or both sides of the basin. Usually the rain-cooled outflow from these thunderstorms results in cooler temperatures as the outflow boundary passes through Furnace Creek, but this time is different. The strong updrafts and downdrafts in the storm on this afternoon tap relatively dry air at 18,000 feet or higher, and this air makes it all of the way to the bottom of Death Valley as a dry or nearly dry downburst, or microburst. Since the associated moisture was limited and there was little cooling due to evaporation, the air arrives with even hotter temperatures as it sweeps through Furnace Creek. The thermometers at Cow Creek and Greenland Ranch jump up into the mid-120s, maybe for just 5 to 15 minutes. Quickly, the temperature comes back down below 120F as the storm outflow continues and subsides. This event occurred around 5 p.m., perhaps. At 6 p.m. or thereabouts, the Cow Creek observer checks the instruments and reads a maximum of 125F, and a “set max” temperature of 112F (as indicated on the Cow Creek form). The wind is still strong and dirt and dust are blowing around, and the observer notes “windstorm” for the 4th. The observer also enters “S” for a south wind, and “clear” for the “character of the day, sunrise to sunset.” At 10 p.m., a cloudburst occurs at Cow Creek, and the observer notes on the form the time of the storm and a rainfall amount of 0.34″. This amount was entered for the 4th instead of for the 5th on the Cow Creek form. The minimum temperature for the 5th is 78F, which may have occurred during the rain event on the evening of the 4th.
The preceding scenario explains the unusually high maximum tempoerature of 125F at Cow Creek on the 4th. Heat bursts due to thunderstorms are rare events, but it is not unusual to learn of one every year or two, on the Great Plains in particular, as the coverage of automatic weather stations increases. But how to explain the rather inexplicable maximums at Greenland Ranch? The maximums here were much higher compared to Cow Creek on the 2nd, 3rd, 5th, and 6th; and much lower than Cow Creek on the 4th. The 4th was the day with the windstorm and 125F at Cow Creek. This writer suspects that there was no observer, or no regular observations being made, at Greenland Ranch from the 2nd to the 6th. Such occasions seemed to occur from time-to-time in summer when Oscar Denton was the observer. The Greenland Ranch caretaker/weather observer might have retreated to higher elevations in order to get a break from the heat for a few days. Perhaps Ross Boswell made his way up to a mining camp or springs area around 5000 to 6000 feet in the Panamint Range, where the air was 25 degrees cooler than at Furnace Creek. When Boswell returned to Greenland Ranch late on the 6th or on the 7th, he observed a reading of 126F on the maximum thermometer. The 126F temperature was due to the brief heat burst on the 4th! (That is, of course, if the Cow Creek data are valid and the explanation provided here are accurate.) Boswell had maximum (and minimum) temperatures to fill in for the 2nd through the 6th on the observer form. Of course, these dates should be left blank if there were no observations and no re-setting of the instruments. But Boswell disregards this protocol because he has not been properly trained, or he just feels that his “estimates” will be “close enough.” Or, perhaps some questions will be raised that he would prefer not to have to answer if he is submitting forms with a bunch of missing data, so he feels compelled to write in bogus values based on the readings he observed following his 5-day absence. Since the maximum thermometer reads 126F, Boswell figured that most of the sunny and hot days during his absence made it well into the 120s. He entered “125” for the 2nd, “124” for the 3rd, “125” for the 5th, and “126” for the 6th. Obviously, it seems, he did not contact the Park Service to learn that Cow Creek was never warmer than 118F on these four dates. Since Boswell may have been in the nearby mountains during this timeframe, he could keep tabs on the daily weather over Death Valley and he likely witnessed firsthand the tremendous cloudburst and convective activity on the 4th. Boswell figured that the active weather day probably was associated with a daytime maximum temperature which was not nearly as warm as on the other days, so he “estimated” a high temperature of “114” for August 4. For the 5th, Boswell wrote in the starting and ending times of the storm (which occurred on the 4th) and he enters the rain gage reading of 1.10″. Boswell entered “99” for the minimum temperature on the 5th. This is much higher than the minimum of 78F at Cow Creek following the rainstorm, and it strongly suggests that the figure was just a wild guess! One would expect a dramatic temperature drop during such a heavy rainstorm, to well below 99F. On the 7th, a reasonable maximum of 118F is entered for Greenland Ranch, just one degree lower than Cow Creek’s maximum that day. Cow Creek’s minimums of 87F and 92F on the 6th and 7th cast considerable doubt upon the minimum temperature reports of 101F and 102F at Greenland Ranch for the 6th and 7th. Again, the form for Greenland Ranch notes that the minimum thermometer was not functioning as it should, so all of the minimums here this month are suspect.
Are these “possible” scenarios close to what actually happened during that week?! We will never know for sure, but the main message is that more than one observer at Greenland Ranch seemed to be okay with entering estimated values onto the climate form. Data on every Greenland Ranch form signed by Ross Boswell can not automatically be considered trustworthy, and each Greenland Ranch report requires careful inspection! By the summer of 1937, the Greenland Ranch forms were signed “Elvis Boswell.”
To summarize the unusual maximum temperature patterns from August 1 to August 7 in the Death Valley region: maximums at regional stations were generally within a few degrees of “average” for the period. The maximums at Cow Creek in Death Valley were a little warmer than normal and they were a very reasonable amount hotter than the readings at the closest, higher stations, such as at Trona, Clay City, and Independence (ignoring Greenland Ranch data, which were not reliable). There was one exception, though: on August 4th, the maximum at Cow Creek jumped up to 125F, compared to 118F on the 3rd. Interestingly, maximums at Trona, Clay City, Independence and Tonopah all decreased three degrees from the 3rd to the 4th. The maximum was also lower on the 4th at Yucca Grove, Las Vegas and Goldfield. Maximums decreased on all sides of Death Valley. Skies were marked as clear to partly cloudy at area stations for the 3rd and 4th, so there was plenty of mixing and afternoon temperatures should have reached very close to their maximum potential for the most part at each station on both days. The cooling trend from the 3rd to the 4th suggests that a slightly cooler airmass overspread the region. This might have been due to cooling aloft, in the layers from about 800 to 600mb, as upper-level high pressure weakened slightly. Or, the cooling could have been due to an influx of somewhat more humid air at low levels. Maybe outflow from a large complex of thunderstorms (well southeast of the region) overspread the Death Valley region and helped to moderate the low levels slightly, leading to the decrease in maximums and increasing low-level moisture. This could have occurred during the morning of the 4th. Whatever the reason for the regional cooling, the jump in maximum temperature at Cow Creek from 118F to 125F from the 3rd to the 4th appears dubious at first glance as it is not supported by the other stations. The observer at Cow Creek might have misread the maximum thermometer on the 4th, and entered “125” instead of “115.” The “set max” temperature at 6 p.m. was “112,” which would be entirely reasonable if the afternoon maximum were 115F. However, the Park Service observers at Cow Creek were and are generally very dependable and provide trustworthy observations. And, given that Greenland Ranch also showed a maximum of 126F during the same period (though not on the 4th), it is difficult to summarily dismiss the 125F report at Cow Creek. Since there was thunderstorm activity in and around Death Valley on the 4th and since the Cow Creek observer noted a “windstorm” on the 4th, the best explanation for the jump in maximum temperature at Cow Creek may be a local downburst (or heat burst) during the afternoon of the 4th. A convective event such as this might have affected just a small part of Death Valley, and the temperature jump in the Furnace Creek area might have lasted for a very short time, but it was strong enough to cause a windstorm. The unusual and short-lived increase in temperature would have been due to exceptional mixing of the airmass over Death Valley in the deep, moist convection associated with a nearby storm. Air between 15,000 and 20,000 feet, and possibly higher, was dragged down to the bottom of Death Valley and swept through Furnace Creek. Air above about 15,000 feet (0r about 600 mb) is typically above the level of mixing associated with the normal daytime convection above this desert region during the day.
The 120F-plus maximums at Greenland Ranch on the 2nd, 3rd, 5th and 6th of August, 1933, are not supported by the maximums at nearby Cow Creek and they are not supported by the maximums at surrounding stations. The reports appear to be nearly ten degrees warmer than one would expect, given the other reports. The minimum thermometer at Greenland Ranch was not functioning properly during the month, according to the observer’s form. But if we can assume that the maximum thermometer was in proper condition and read properly by the observer, the most logical explanation for the suspect maximums at Greenland Ranch is that the observer was not taking daily observations from the 2nd to the 6th. He read the 126F on the maximum thermometer (courtesy of the heat burst on the 4th) when he returned around the 7th, and he filled in the missing maximums from the 2nd to the 6th with estimates based on that value. Since he knew of the storm on the 4th which deposited more than an inch of rain in the station gage, he guessed a maximum of “only” 114F on the 4th. There is no reasonable physical explanation for the 120-plus readings at Greenland Ranch on the 2nd, 3rd, 5th and 6th. The entries on the Greenland Ranch form during the first week of August, 1936, are bogus and due to human error, or due to observer malpractice! One saving grace is that the Greenland Ranch maximum temperature report of 126F for the month may indeed be valid.
July 1942
July 20 to July 29 heat wave
1942 Jul Cow Creek 1942 Jul Greenland Ranch 1942 Jul Independence
1942 Jul Silver Lake AP 1942 Jul Tonopah 1942 Jul Goldfield
1942 Jul Las Vegas 1942 Jul Las Vegas AP 1942 Jul Lathrop Wells 1942 Jul Lida
1942 Jul Sarcobatus 1942 Jul Beatty 1942 Jul Indian Springs 1942 Jul Trona
Cow Creek reached its all-time record of 126F in four separate months (all Julys) during its 26 summers of record, and the first of these was in July, 1942. The chart above for July 20 to July 29, 1942, shows an excellent daily “march of maximums” between Cow Creek and Greenland Ranch, with Cow Creek generally a degree or two warmer. This was typical in summer while both stations operated. Though the instruments were above bare ground by the 1930s and 1940s, Greenland Ranch maximums were likely suppressed slightly by the cooling effects of nearby irrigation and vegetation at the Furnace Creek Ranch. The Cow Creek station was relatively free from such evaporative-cooling effects. The difference in elevation (less than 30 feet) between the two stations was insignificant with regard to temperature. The observer for the Pacific Coast Borax Company at Greenland Ranch this summer was Elvis Boswell, no doubt closely related to Ross Boswell, observer during most of the 1930s.
Maximums at other stations mimic the day-to-day trend in Death Valley reasonably well, with the hottest days the 23rd and 24th. Observations began at a new airport near Las Vegas, beginning in 1937. (Station elevation was 1876 feet according to Climatological Data; or, 1864 feet, according to the observer’s form. This airport was at or very near present day Nellis Air Force Base, northeast of downtown Las Vegas by seven miles.) On the 24th of July, 1942, the airport station hit 117F. On the same day, the Las Vegas cooperative station in town had a maximum of only 112F. The 24th was the hottest afternoon of the year for both stations. The two stations operated at the same time from 1937 to 1952. For the 16 years during this period, annual maximums at the town station ranged from 107F to 115F and averaged 111.3F. At the airport, annual maximums ranged from 111F to 117F and averaged 114.2. Annual maximums averaged three degrees warmer at the airport. The airport was about 160 feet lower than the town station, which would account for hotter readings by one degree (F) there. It is likely that the town instrumentation was at a relative cool spot, probably above a well-watered lawn, to account for most of the difference in maximum temperatures. It appears that the warm-season maximums at the Las Vegas cooperative station from 1913 to 1956, when C. “Pop” Squires was the observer, were consistently very conservative. Afternoon temperature readings on the thermometers here might have been consistently two-to-three degrees cooler than ambient air temperature at well-exposed locales above typical desert surfaces just outside of town.
On the 24th, Silver Lake Airport (just north of Baker) had a maximum of 120F, one short of its record maximum from 1940 to 1953. Trona came up one short of its all-time high with a 117F on the 23rd. Sarcobatus (1941-1961) came up two short of its all-time maximum, with 109F on the 23rd. With an average maximum of 100.9F, this was one of five Julys at Sarcobatus to average 100F or hotter. Hottest was 103.2F in July, 1959. Cow Creek’s average daily maximum of 118.3F in July, 1942, was second hottest for July for its 26 summers (hottest was July, 1959, with 120.2F). Greenland Ranch was about the same, 118.0F, a degree or two cooler than the average maximums for the Julys of 1931, 1933, 1959, and a few others from 1911 to 1929 which may or may not be reliable.
Most impressive, perhaps, was the 99F at Tonopah on the 23rd. The observer was the U.S. Weather Bureau at the airways station at 6087′ elevation. This appears to be one of only two days to officially reach 99F in Tonopah, where official observation were from 1902 to 1953. A new station in town opened in 2012. Tonopah had 99F on two days in July, 1953, but it appears that the instruments were at a different, and relatively warmer, location in town which resulted in higher maximums by several degrees comparably. This station, no longer with the U.S. Weather Bureau as observer and perhaps at a private residence in town, was closed before the following summer. A short-lived station at Lida, southwest of Tonopah and at about the same elevation, reported a high of 96F on the 23rd.
The “temperature versus elevation” charts for this month show most stations plotting within a couple of degrees of the sloping line through Greenland Ranch. Again, the slope of the line is 4.5 degrees/1000 feet, which is the how maximums behave with elevation on average in the region in July. Somewhat well to the right of the line, on the warm side by about six degrees, is Indian Springs. This station is in Clark County, NV, east of Furnace Creek and northwest of Las Vegas. Its warm readings relative to other stations suggests that the station exposure may have been somewhat inadequate. With 116F on July 23rd, Indian Springs was nearly as warm as Trona and Las Vegas Airport, two stations more than 1300 feet lower in elevation.
July 1945
July 20 to July 28 heat wave
1945 Jul Cow Creek 1945 Jul Greenland Ranch 1945 Jul Silver Lake AP
1945 Jul Daggett 1945 Jul Yucca Grove 1945 Jul Tonopah 1945 Jul Goldfield
1945 Jul Las Vegas 1945 Jul Las Vegas AP 1945 Jul Lathrop Wells
1945 Jul Sarcobatus 1945 Jul Beatty 1945 Jul Indian Springs
1945 Jul Trona 1945 Jul Randsburg 1945 Jul Haiwee
The heat wave during the fourth week of July, 1945, was similar to that of July, 1942. Several stations in the region tied their all-time maximum or came within a degree or two. Cow Creek, with 125F, was one degree short, while Greenland Ranch was several degrees short with 123F. Sarcobatus, at 4000 feet on the empty “Sarcobatus Flats” of Nye County, Nevada, reached 110F. This was that station’s hottest temperature from 1941 to 1958. It hit 111F in July, 1959. Trona had 118F on the 25th, tying for all-time hottest in 95 years of record. Tonopah came within one degree of its all-time maximum with 98F on the 26th. Haiwee’s 107F on the 25th tied for the hottest on record here from its opening in 1923 through 1971. The intense heat event of July 14 and 15, 1972, finally managed to beat that at Haiwee with a 110F.
The elevation-versus-temperture charts for this event indicate that the regional stations were relatively well-behaved. Most stations were within a couple of degrees of the sloping line through Greenland Ranch. There does seem to be a gradual trend of more station plots on the warm side of the line. In the 1930s, a greater percentage of the stations plotted on the left side of the line. This may indicate that the immediate area around the Greenland Ranch instruments was becoming slightly cooler, perhaps due to greater irrigation and watering of vegetation in the immediate vicinity. It is also possible that the notion was diminishing that a thermometer shelter in the desert needed to be placed above grass. It is likely that some of the newly-established stations were sited above natural desert surfaces during the 1940s and 1950s.
July 1949
July 9 to July 19, 1949
1949 Jul Greenland Ranch 1949 Jul Cow Creek
1949 Jul Independence 1949 Jul Silver Lake AP 1949 Jul Daggett AP
1949 Jul Yucca Grove 1949 Jul Tonopah 1949 Jul Goldfield
1949 Jul Las Vegas 1949 Jul Las Vegas AP
1949 Jul Pahrump 2N 1949 Jul Lathrop Wells
1949 Jul Sarcobatus 1949Jul Sarcobatus b
1949 Jul Beatty 1949 Jul Inyokern 1949 Jul Indian Springs 1949 Jul Trona
1949 Jul Randsburg Wk 0 1949 Jul Randsburg Wk 1
1949 Jul Randsburg Wk 2 1949 Jul Randsburg Wk 3
1949 Jul Randsburg Wk 4 1949 Jul Randsburg Wk 5
A quick check of the charts above for July, 1949, shows a number of new climate stations in the region since the early 1930s. Unfortunately, Greenland Ranch and Cow Creek are still the only stations within Death Valley proper. But, numerous stations, mostly 50 to 100 miles from Furnace Creek, began observations during the late 1930s and 1940s. These included Randsburg, Pahrump, Lathrop Wells (only 30 miles from Furnace Creek!), Sarcobatus, Inyokern, Daggett Airport, Bishop Airport, Las Vegas Airport, Silver Lake Airport, Deep Springs and Indian Springs.
The heat wave of mid-July, 1949, peaked from the 14th to the 17th. Regional stations reported maximums which were generally seven to eleven degrees above the average daily maximum for July during this four-day period. Greenland Ranch hit 125F on the 16th, and Cow Creek had 126F, tying its hottest on record from 1934 to 1960. The Cow Creek observer’s form shows a maximum of 128F on the 18th, but it is circled and lightly crossed out. The Weather Bureau investigated this report, and determined that it was not reliable and was likely five degrees too high (see discussion below). Cow Creek maximums typically ran a degree or two warmer than those at Greenland Ranch during the summer, so the maximum at Cow Creek for July 18, 1949, was adjusted downward to 123F. The most likely explanation for the incorrect 128F report, if it is indeed not authentic, is that the Cow Creek observer was not careful enough when reading the maximum thermometer, and mistook the “123” level of the liquid in the thermometer for “128.” The time of observation here was at 5 p.m., and the “set max” temperature reading was 122F on the 17th (following a maximum of 124F) and 119F on the 18th. Maximums at all other stations in the region decreased a few degrees from the 17th to 18th, except for Lathrop Wells, which showed a three-degree increase! In fact, Lathrop Wells’ maximum temperature report of 114F on the 18th was the hottest temperature here from 1942 to 1958, tying the 114F attained just three days earlier, on July 15, 1949. (A maximum temperature report of 115F at Lathrop Wells on September 3, 1950, is regarded as “suspect” or “somewhat unrepresentative” as the maximums on that date at the closest surrounding stations were about two-to-five degrees short of their all-time record maximums.)
Also noteworthy is the minimum temperature of 90F at Lathrop Wells on July 18. At an elevation of 2659 feet, a minimum as warm as 90F is exceptional. The Cow Creek record indicates “high winds” on July 18, and a minimum of 99F. The minimum temperature at Greenland Ranch was also 99F. Windy conditions likely persisted all night long on the night of July 17/18 in most of the region. This kept the low-levels well mixed and prevented surface-radiation-inversion formation. One thing to keep in mind is that very windy conditions could cause the instrument shelter to shake, which might result in some vibration of the minimum thermometer and a “shakedown” of the indicator inside of the liquid in glass. For instance, an authentic overnight minimum of 80F at a station, followed by an intense windstorm during the day, could result in the minimum thermometer’s indicator to “slide” up to a warmer reading due to vibration. It is impossible to know if this occurred or not on July 18, when Lathrop Wells had a low temperature of 90F. However, it is something to keep in mind when exceptionally warm overnight minimum temperatures are reported on dates with strong winds. Interestingly, the minimum of “85” for the 18th on the form for Inyokern is crossed out, and the day was marked as having “high winds.” The daily minimum temperature given for Inyokern on the 18th in Climatological Data is “75”! Apparently, the reviewer of the data did not believe the report, and he or she knocked it down ten degrees for the official publication. Given the other very warm minimums region-wide and the windy conditions, the 85F minimum at Inyokern and the 90F minimum at Lathrop Wells are likely authentic.
And, getting back to the Cow Creek maximum of 128F on the 18th…could it be valid? The maximum of 121F for the date at Greenland Ranch, just three miles distant, strongly suggests that it is NOT valid. The increase in maximum temperature at Lathrop Wells, from 111F on the 17th to 114F on the 18th, however, does help to support Cow Creek’s 128F on the 18th (up four degrees from a maximum of 124F on the 17th). The “high winds” reports in the region suggest a well-mixed lower troposphere: an environment NOT conducive to causing a difference of as much as seven degrees between two stations just three miles apart. Cow Creek and Lathrop Wells are only 30 miles apart, with an elevation difference of about 2800 feet. Air subsiding from 2659 feet to an elevation of -152 feet will warm adiabatically by about 15 degrees. Given a temperature of 114F at Lathrop Wells, this would support a maximum of 129F at Cow Creek. If the rate of the warming is 4.5 degrees (F) per 1000 feet, which is the “normal” rate of change for maximums with elevation in summer in the region, then a maximum of 127.5F would be expected at Cow Creek on a day with 114F at Lathrop Wells. There was no precipitation nearby on the 17th or 18th, though Tonopah had a “Trace” on the 18th. Thus, a localized convective downburst or heat burst for Lathrop Wells and Cow Creek, but not for Greenland Ranch, can be ruled out almost entirely as the cause of this discrepancy. It is possible that the Greenland Ranch maximum of 121F is incorrect, but this value is strongly supported by the maximums at all of the other stations in the region (outside of Cow Creek and Lathrop Wells), and it is supported by the “set max” temperature of 114F at 6:30 p.m. by observer William Shaw.
Fortunately for climatologists studying the highest temperature records in Death Valley, a thermograph was inside of the instrument shelter at Cow Creek in 1949! According to A. Court in the article “Duration of Very Hot Temperatures” (BAMS, April, 1952): “Since this (the 128F report at Cow Creek on July 18) was about 5 degrees higher than the thermograph record, which agreed with the 126F recorded two days earlier, and the maximum on the 18th was 121F at nearby Greenland Ranch, where temperatures ran about one degree lower, the 128F reading was corrected to 123F.” In fact, Court states that “several discrepancies between the readings of the thermograph and the thermometers, as reported by the observer, were resolved in conferences with Weather Bureau officials.” Human error is alive and well when it comes to weather observations! Past and present, at each and every station to some degree, bad data are hiding in the station records because of mistakes, carelessness, poor observing habits, and ill-advised procedures and decision-making! If the usually reliable Park Service is providing the occasional bad reports, then how bad, how trustworthy, are the reports from poorly-trained, poorly-motivated, inadequately-careful and inadequately-conscientious observers who are tasked to take the readings daily for a company at their place of work? If there were no thermograph instrument in the shelter at Cow Creek during July, 1949, and no other station in the Furnace Creek area, then the 128F report from Cow Creek would likely live on. Imagine how easy it would be to dismiss (or confirm) the maximum temperature readings at Greenland Ranch in July, 1913, if a thermograph were in operation in the Greenland Ranch shelter, and/or if a “Cow Creek” station had already been established nearby!
As mentioned, the hottest four days during this event were the 14th, 15th, 16th and 17th. An important trait to stress in this investigation and analysis is: when it comes to summertime maximums in the region, heat waves affect widespread areas, usually many states simultaneously, and daily high temperatures at stations in the region during a heat wave are typically at similar levels as compared to average. There are always the occasional exceptions, of course, as there might be some moisture influx affecting some parts or a batch of thick clouds that affect a station or two, causing cooler high temperatures. But for the hottest events, strong and widespread high pressure aloft keeps clouds and low-level moisture to a minimum in Death Valley and surrounding areas. The temperature aloft (at around 700 to 600mb) is typically very uniform across the region, and mixing between low levels and mid-levels (up to about 600mb) during the afternoons is excellent. During the summer, the hotter the air is aloft, the hotter the afternoon air temperatures at the area weather stations.
Below is a comparison of the average maximum temperature from July 14 to 17, 1949, to the “average” daily maximum for July. “Average” values used are for the period of record or for the 30-year “normal” period of 1951-1980, if available. Listed first is the departure from the July normal.
+7.6 Greenland Ranch* 123.0
+8.5 Cow Creek 124.5
+9.5 Lathrop Wells 112.3
+8.2 Beatty 108.0
+7.5 Sarcobatus 105.8
+8.6 Goldfield 96.8
+7.1 Tonopah 94.5
+8.5 Bishop AP* 106.0
+7.5 Independence est. 104.5 (one max msg and estimated, 1951-80 normal estimated at 97.0)
+6.6 Deep Springs 97.8
+8.4 Haiwee* 103.3
+8.4 Trona* 114.0
+7.7 Inyokern* 110.8
+7.7 Randsburg* 106.5
+6.4 Barstow 109.0
+7.0 Daggett AP* 111.0
+7.3 Needles AP* 116.0
+10.2 Silver Lake AP 119.3
+8.7 Yucca Grove 104.3
+5.8 Las Vegas (coop) 109.8
+8.2 Las Vegas AP 112.3
+10.9 Indian Springs 114.0
+8.4 Pahrump 109.5
As shown, the departures from average at the Furnace Creek stations in Death Valley were about +8 degrees (F). Of the 21 other stations on the list, 15 of these averaged 7 to 9 degrees above average for July. Three stations were about +9.5 to +10.9 (southeast and east of Death Valley), and Barstow and Deep Springs were about 6.5 degrees above average. The consistency of the departures across this large region is impressive, but not unexpected and not unusual!
The 1950s
In the Death Valley region, the summers of the 1950s saw a handful of very hot days (i.e., those that are about nine degrees hotter than the average daily maximum for July), but were generally free of exceptionally hot days (at least 11 degrees hotter than the average daily maximum for July). The hottest days at Greenland Ranch reached 124F, and the hottest at Cow Creek hit 125F. Below are the dates during the 1950s on which these temperatures were reached, with the daily extremes.
1950 June 30 CC 125/90 GR 121/82
1950 July 1 CC 125/90 GR 124/83
1950 July 2 CC 125/92 GR 123/87
1950 July 3 CC 125/93 GR 122/83
1951 July 18 CC 125/96 GR 123/99
1954 June 22 CC 125/89 GR 124/91
1956 June 28 CC 125/86 GR 124/98
1958 July 11 CC 125/97 GR 124/97
1958 July 12 CC 125/94 GR 121/93
1959 July 16 CC 122/94 GR 124/96
1959 July 17 CC 125/95 GR 123/100
At Greenland Ranch, the Pacific Coast Borax Company continued as observer until September, 1957. This ended 46 years and 3 months of daily weather observations by the company. The National Park Service took control of the closed station and resumed observations in March of 1958. The time of observation was 6 p.m. until about 1955. That was when the Borax Company observer changed from William Shaw to Raymond Goe, and the time of observation changed to mornings, around sunrise to 7:30 a.m. The time of observation changed back to 4 p.m. to 4:30 p.m. when the Park Service assumed observations at Greenland Ranch in early 1958. As mentioned earlier, there were a slew of observation issues at Greenland Ranch during the 1950s, and these are summarized by the NWS Las Vegas office online.
History of Weather Observations at Death Valley
Below is the discussion by the NWS for the 1950s timeframe at the station:
—-
In late October 1954, the Greenland Ranch station was moved to 310 feet north and east to an area with open ground below it and with the instrument shelter located three and a half feet above the ground. The station was located about 100 feet east of Highway 190 at this time in an area over bare ground in a fenced in enclosure with the shelter facing north. The area was located about 800 feet east of a date grove. The elevation at this point was listed as 168 feet below sea level.
During the early 1950s, problems began to develop with the weather observations taken at Greenland Ranch. After reviewing and comparing temperatures, officials from the Weather Bureau including the California State Climatologist came across a number of suspect temperatures that appeared inaccurate after consistency checks with the station at Cow Creek. In order to cross check observations more carefully, a thermograph was installed at the Greenland Ranch station on March 22, 1954. The thermograph could then be used to ensure the temperatures taken by the observers were accurate. One large source of the errors was found to be the observer at the time who had vision problems and needed eyeglasses to read the thermometers even in the daytime. The observer even opted to take observations at 7 PM in the dark. The weather bureau then recommended having the observations read during the evening before it became dark in March of 1954.
On May 1, 1955 further problems with the observers at Greenland Ranch began when the observer decided to change the time of observation to a morning reading. Upon a station inspection visit in March 1956, the Weather Bureau learned the longtime observer at the Greenland Ranch was to retire and a new observer would be taking over. The new observer informed the Weather Bureau representative that he was trained to log the observations on the observer form one day back. The new observer stated he was very suspicious of how the previous observer was recording the observations but complied because the previous observer had been there a long time. On March 11, 1956 the observation time was changed back to the evening.
It appeared hopeful for the United States Weather Bureau that the new observer would be enthusiastic in taking the observations, however this turned out not to be the case. By June 1, 1956 the new observer began taking the temperatures in the morning once again as this turned out to be a more convenient time for them. During a station visit on March 21, 1957 it was found the observer was recording the observations at Greenland Ranch but not sending the forms into the United States Weather Bureau. However, the new observer not only worked for Pacific Coast Borax Company but also the Fred Harvey Company which by that time had taken over running the Furnace Creek Ranch and also worked as a local sheriff. As a result of his many jobs, it became increasingly difficult for him to find time to take observations. A thermograph continued in operation to allow for a cross check of observations.
Observations continued to be taken by the observer from the Pacific Borax Company through the summer of 1957. However, by September of that year, the observer became “too busy” to take observations and stopped taking them. The observer at the time stated that when a new thermograph was installed and failed, he became disinterested in the observations and completely ceased taking them. This gap in observations lasted through the end of February of 1958. On March 1, 1958 the National Park Service took over observations at the Greenland Ranch site after the United States Weather Bureau convinced the park service to send staff to the area from their nearby office at Cow Creek in order to keep the records going. The National Park Service also was going to be relocating their visitor center from Cow Creek to Furnace Creek, which eventually was thought of as a new location for the weather station. The period from September 1, 1957 through February 28, 1958 marks the largest period without weather observations of any sort being taken in the Greenland Ranch area.
On April 1, 1961, the official weather station moved to the new Furnace Creek Visitor Center operated by the National Park Service.
—-
Though there were real problems with the temperature record at Greenland Ranch during the 1950s, the monthly maximums appear trustworthy. There were no excessively hot maximums which appeared suspect.
The time of observation at Greenland Ranch for nearly all of its 50 years from 1911 to 1961 was from 4 p.m. to 6 p.m. This is, quite frankly, a lousy time to check and reset the thermometers each day. At Furnace Creek and in Death Valley in general (especially on the east side of the basin), temperatures are highest on late-spring and summer days from approximately 3 to 4 p.m. Pacific Standard Time. Temperatures generally remain within a few degrees of the day’s maximum temperature some two-to-three hours before and two-to-three hours after the time that the maximum is attained. When the maximum thermometer is reset around 4 or 5 p.m. PST on a summer day in Furnace Creek, the “set max” temperature is usually very close to the day’s high temperature. There no doubt were occasions when the temperature went even higher after the observation, perhaps reaching and exceeding the recorded maximum for the day (reached before the time of observation). When cooler conditions prevail on the next day, the maximum thermometer is “stuck” on the higher temperature from around the time of observation on the previous day, and the current day receives a maximum temperature observation which reflects air temperature on the previous day. If the “set max” temperature is provided, then it can help to determine which days might have these “previous day” maximums. These unrepresentative “previous day” maximums might occur approximately 3 to 6 times or more per month, and could result in an average daily maximum for the month perhaps one degree higher compared to that which would occur with an observation time near or after sunset.
A similar situation can occur if the time of observation is close to sunrise, such as at 7 a.m. A re-set of the minimum thermometer on a chilly morning will leave the indicator near the morning’s low temperature. If the following night is warmer, the daily temperature record will not indicate that as the minimum thermometer will still show the chilly low temperature from the previous morning. The overnight minimum temperature on abnormally warm nights frequently go undetected (and unreported) where observations are taken close to sunrise.
On the very hot days listed above, the maximum temperature at Cow Creek was typically one-to-three degrees warmer than at Greenland Ranch. Cow Creek’s average maximum temperature in the summer months was about a degree warmer compared to Greenland Ranch. The slightly higher maximums at Cow Creek were likely due to the bare and natural ground cover in the vicinity of the instruments, compared to the grassy and perhaps irrigated cropland near the Greenland Ranch station site. The moister environment would promote somewhat cooler afternoon air temperatures. The elevation difference of about 20 to 25 feet between the two stations would favor higher maximums at Greenland Ranch by only one-tenth of a degree (F).
July 1959
July 9 to July 28 heat wave
1959 July GR 1959 Jul Cow Creek 1959 Jul Barstow 1959 Jul Independence
1959 Jul Baker 9NNW 1959 Jul Bishop AP 1959 Jul Deep Springs 1959 Jul Inyokern
1959 Jul Goldfield 1959 Jul Las Vegas AP a 1959 Jul Las Vegas AP b
1959 Jul Pahrump 1959 Jul Sarcobatus 1959 Jul Beatty
1959 Jul Indian Springs 1959 Jul Trona 1959 Jul Randsburg
1959 Jul Dyer4SE 1959 Jul Haiwee 1959 Jul Afton Canyon
The period from July 9 to July 28 was exceptionally hot in Death Valley and the Mojave Desert. Maximums for the 20-day period averaged 121.5F at Greenland Ranch and 122.4F at Cow Creek. A temporary, standardized climate station at Badwater showed an average daily maximum of nearly 125F. Summer maximums are hotter at Badwater primarily because of exposure differences: Low-level mixing is probably less at Badwater compared to the Furnace Creek area. Badwater is in a “notch” of sorts along the Black Mountains, and is protected somewhat from the prevailing southerly winds by terrain just to its south. Badwater’s proximity to the barren and steep west-facing slopes of the Black Mountains would also promote locally hotter mid-to-late afternoon temperatures. Badwater is 100 feet lower than Furnace Creek, so its elevation would provide about a half degree (F) temperature advantage comparably. Apparently, thermograph instruments were in each of the three instrument shelters (at Greenland Ranch, Cow Creek, and Badwater) and the minimum and maximum temperature observations by the observers were checked against the thermographs for accuracy.
The plot of average daily maximums versus elevation for about 20 stations in the region shows a close correlation. Nearly all stations plot within a couple of degrees of the “4.5 deg/1000 ft” line through Greenland Ranch. Monthly maximum temperatures were about one-to-three degrees short of all-time record maximums for the stations in operation during July, 1959. In Death Valley, there were three separate “hot spells” during which maximums reached 123F to 125F at the two Furnace Creek-area stations. These hot spells peaked around the 11th, the 17th, and the 26th. Listed below are the maximums attained during each “hot spell” in July, 1959, for area stations:
129/128/127 Badwater
124/125/124 Cow Creek
123/124/123 Greenland Ranch
119/117/120 Baker 9NNW
114/115/115 Trona
113/112/113 Daggett AP
116/115/113 Las Vegas AP
112/112/111 Barstow
112/113/111 Inyokern
112/112/110 Pahrump
110/109/106 Beatty
108/108/108 Randsburg
103/104/102 Haiwee
106/108/105 Independence
109/111/109 Sarcobatus
105/107/105 Bishop AP
102/103/101 Dyer 4SE
100/101/97 Deep Springs
101/103/99 Tonopah AP
98/100/97 Goldfield
Other regional stations
119/116/118 Palm Springs el. 411′
117/117/118 Needles AP el. 913′
116/115/117 Iron Mountain el. 922′
114/112/112 Indian Springs el. 3136′
101/101/98 Mountain Pass el. 4735′
75/76/72 White Mountain 1 el. 10150′
61/62/58 White Mountain 2 el. 12470′
The three heat waves were fairly similar with regard to the hottest temperature during each one at regional stations. The middle one, from the 16th to the 18th, was a bit more pronounced in the northern parts of the region. Tonopah Airport reached 103F on the 17th, just one short of its all-time record maximum of 104F (in July 1960) from 1954 to 2015. (The hottest reliable temperature on record for a Tonopah “town” station is 99F on July 23rd, 1942.) The station in Tonopah closed when Tonopah Airport opened in 1954. Summertime maximums at the airport, about seven miles east of town and 660 feet lower in the Ralston Valley, average about four degrees warmer than the station in town. Tonopah AP is at about 5400 feet on gently sloping terrain which bottoms out at a playa, 12 miles south of the airport and 200 feet lower in elevation.
Impressively warm average daily maximums for July, 1959, include 112.4F at Baker 9NNW. This was the hottest for any month at this station, and 4.2 degrees (F) above the average maximum of 17 Julys from 1954 to 1970. Baker 9NNW opened soon after Silver Lake Airport closed. The airport was 127 feet lower and three miles closer to Baker. The hottest average daily maximum at Silver Lake AP, 1940-1953, was 112.7F in July, 1942.
Only three months at Trona have had an average maximum of 110F or hotter (July 1931, July 1945 and July 1994). July, 1959, came very close, with 109.8F.
Cow Creek has 26 summers of record, from 1935 to 1960. The month with the hottest average maximum temperature was July, 1959, with 120.2F. The Julys of 1942 and 1945 averaged about two degrees (F) cooler on average maximum. It is unfortunate that Cow Creek was not operating in July of 1931, when Greenland Ranch had its hottest average maximum of 120.6F. The average maximum at Greenland Ranch in July, 1959, was 119.3F, third hottest in its 50 summers from 1911 to 1960. (The average maximum of 121.9F at Greenland Ranch in July, 1917, is not trustworthy as the maximums in the last week appear much too warm.)
Randsburg is southwest of Trona and southwest of Furnace Creek. Its record (beginning in 1937) appears to one of the more reliable, consistent, and trustworthy ones among non-airport stations in the region. Maximum temperature readings here suggest a well-exposed station siting with good ventilation. The month with the hottest average maximum temperature in its 78 summers is July, 1959, with 102.9F. This is about 4. 5 degrees above the average daily maximum for all Julys at Randsburg. Close behind July of 1959 are July, 1942, with 102.7F; and July, 1945, with 102.1F.
July of 1959 provided Sarcobatus with its hottest average maximum for any month, with 103.2F (4.9 degrees F above its average for 19 Julys from 1942 to 1960). The 111F on July 18, 1959, at Sarcobatus is its hottest on record. Authentic temperatures as hot as 110F are very rare above 4000 feet elevation in the region, if exposure and ventilation at the measuring site are good. Sarcobatus is/was at an elevation of 4020 feet, near Scottys Junction along U.S. 95, and the observer in 1959 was W. G. Robertson for Nevada’s State Highway Department. For a station on the empty and desolate Sarcobatus Flats, it is difficult to imagine that this weather station did not enjoy excellent exposure to winds from all directions. However, the summer maximums at Sarcobatus appear to be a degree or two warmer than what might be expected here. Sometimes instrument shelters in “highway yards” wind up a little too close to large machinery and trucks, and too close to big piles of dark road-making material. Nearby objects such as these could cause reduced ventilation around the thermometer shelter and very localized hotter spots under the high afternoon sun. Sometimes these yards have shade trees, which block the wind and cause local heating at spots just downwind in full sunshine. This is 100 percent conjecture for the old station at Sarcobatus! A CEMP station has been operating at Sarcobatus Flats since 2000, and a maximum of 109F has been reached in numerous Julys here. This station is at 4014 feet elevation, and is apparently quite close to where the old Sarcobatus station was — within a mile or two. The maximum temperature was 109F at the CEMP Sarcobatus Flats station on both June 30 and July 1 of 2013, when Death Valley had 129F. The CEMP stations feature an excellent radiation shield for the temperature sensors and are generally very well exposed. The cotton-region shelters in use during most of the 20th century have been found to run about a degree or two warmer on summer maximums in the desert compared to these high-quality and conservative electronic stations.
Just under 4000 feet elevation is Independence. The station here managed a 108F during the weekend of July 18/19, 1959. During most of the 1950s and 1960s, observations were not taken on the weekends at Independence. The 72-hour extremes were typically provided on the Monday observation, so monthly maximums and minimums for Independence are considered reliable. But, the average temperature data at Independence suffered greatly during these two decades. Nearly all months at Independence from 1948 to 1970 had 8 to 10 days of missing maximum and minimum temperatures.
Beatty’s average maximum of 103.3F in July, 1959, fell a degree short of the record 104.2F in July, 1931. Even though Beatty is 700 feet lower than Sarcobatus, just 30 miles up the road, its average daily maximum was almost exactly the same. Beatty is along the Amargosa River, so perhaps the vegetation and moister environment in and around Beatty causes locally cooler temperatures around the station.
July, 1959, with 106.0F, is the hottest on record (for average maximums for any month) at Pahrump: slightly hotter than the Julys of 1960 and 1961. However, five-to-six maximums are missing in all three of these hot months, likely leading to slightly higher average maximums. Still, these three Julys at Pahrump appear to be just as hot or hotter on average maximum than any of the 50-plus Julys on record since 1961.
A little farther to the southeast, July, 1959, still stands as the month with the hottest average maximum temperature at Las Vegas (McCarran) AP. The mean maximum of 107.9F this month was almost four degrees above the long-term average maximum for July. Four other Julys since 1948 at Las Vegas AP have reached 107F. Before Mccarran Airport opened, the airport at Las Vegas was near present-day Nellis AFB. The average maximum here, in July, 1942, was 109.4F. The cooperative station in Las Vegas had very impressive average maximums of 108.7F in July, 1933 (though five maximums were missing) and 110.9F in July, 1931. Summer maximums at this cooperative station generally ran a degree or two cooler than at Nellis. At Daggett AP, the average maximum of 107.3F in July, 1959, was the hottest from 1944 through 1988. Seven Julys since 1988 at Daggett AP have averaged from 107F to 108F. Hottest was July, 1994, with 108.0F.
Also with their hottest average maximum on record in July, 1959, is Inyokern with 107.0F. July, 1959, remains the hottest at Goldfield (93.6F) since 1933.
July 1960
July 13 to July 23 heat wave
1960 July Greenland Ranch 1960 July Cow Creek 1960 Jul Barstow 1960
Jul Independence 1960 Jul Baker 9NNW 1960 Jul Bishop AP 1960 Jul Deep Springs
1960 July Inyokern 1960 July Iron Mountain 1960 July Goldfield
1960 Jul Las Vegas AP a 1960 Jul Las Vegas AP b 1960 July Pahrump
1960 July Lathrop Wells 1960 July Sarcobatus 1960 July Beatty
1960 July Indian Springs 1960 July Dyer 1960 July Trona
1960 July Randsburg 1960 July Haiwee
The average daily maximums at area stations for July, 1960, were generally one-to-two degrees cooler than those for the previous July. But, the heat wave in the middle of July, 1960, measures up strongly against any other heat wave on record in the Death Valley region and surrounding areas. This was the final summer of operation for both Cow Creek and Greenland Ranch. A thermograph was inside of a temporary thermometer shelter at Badwater to provide hourly temperature data and daily extremes.
The form for Greenland Ranch for July, 1960, shows a maximum of 129F on July 18th. The entry appears to be erroneous when a comparison is made between Greenland Ranch and Cow Creek maximums on the other days this month. Cow Creek, only three miles up the road, routinely averaged a degree or so warmer than Greenland Ranch on July afternoons from 1935 to 1960. For July, 1960, the average maximum at Cow Creek was 119.5F, 1.4 degrees (F) warmer than the 118.1F at Greenland Ranch. Of the 31 days for July, 1960, the two stations had an identical maximum temperature on only one date. On 11 dates, Cow Creek was warmer by one degree (F), and on 13 dates, Cow Creek was warmer by two degrees. Cow Creek’s maximum was warmer than that at Greenland Ranch by three degrees on three days. Greenland Ranch reported a warmer maximum three times: twice by one degree, and once by three degrees. On the 18th, Greenland Ranch reported 129F and Cow Creek reported 126F.
The differences in maximum temperature between the two stations for the hot spell from the 13th to the 23rd: Cow Creek warmer by 1, 0, 1, 1, 2, -3, 2, 2, 2, 3, and 1.
Cow Creek maximums for the hottest period , from July 16 to 20:
125, 126, 126, 126, 126
and for Greenland Ranch for the same period:
124, 124, 129, 124, 124
Why would Greenland Ranch suddenly be the warmer station on the 18th, and by three degrees? It seems likely that the Greenland Ranch maximum thermometer was misread by the observer. The “set max” temperature here at about 4 p.m. on the 18th was 123F, which does little to support the 129F report. Usually the temperature at 4 p.m. is just a couple of degrees lower than the day’s maximum. At Cow Creek on the 18th, the maximum was 126F and the “set max” temperature at about 4 p.m. was 125F. Since the 129F at Greenland Ranch on the 18th this month is suspect, the maximum for this date is reduced to 124F, and the maximum for the month at Greenland Ranch is changed from 129F to 124F. The highest reliable maximum temperature at Greenland Ranch for its 50 summers from 1911 to 1960 remains at 127F.
EDIT: Thermographs were obtained for Greenland Ranch which cover this timeframe, and the one for the week of July 12-19 shows that the maximum temperature for July 18 is within a degree or so of the maximums reached on the previous two days, both which officially reached 124F. Therefore, the official reported maximum of 129F at Greenland Ranch for July 18, 1960, is not valid, is not authentic. A temperature of 129F on this date at Greenland Ranch is not supported by the maximum at Cow Creek, just three miles away, and is not supported by its own thermograph record. The thermograph instrument was in the same shelter as the maximum thermometer which was read by the observer. As was probably the case at Cow Creek on July 18, 1948, when a suspect maximum of 128F was recorded, the observer probably was not careful enough when reading the maximum thermometer. It isn’t too difficult to look quickly at the thermometer and to be off by five degrees. The ACTUAL maximum at Greenland Ranch on July 18, 1960, was almost certainly 124F or 125F, based on the thermograph record. See the actual thermograph chart below! Again, official maximums of 124F were recorded on the 16th and 17th, and the trace for the 18th goes about as high as it did on the 17th. END EDIT.
A handful of stations in the region flirted with all-time record maximums during this heat wave, but its hottest days were generally a couple of degrees cooler on a regional scale compared to some especially scorching summer days in the early 1930s and in July, 1972, for instance. Cow Creek, as shown above, had 126F on four consecutive days in July, 1960, which tied the all-time maximum here for its period-of-record for summers from 1935 to 1960. Greenland Ranch had a handful of 126F and 127F maximums during its 50 years from 1911 to 1960, and so its maximum in July, 1960, is not particularly impressive…assuming that it really was not 129F! Interestingly, Beatty, just 30 miles to the north, does lend some support to the 129F at Greenland Ranch. Beatty’s maximums from July 16 to July 20:
107, 110, 114, 110, 110
Skies were mostly sunny during the first part of the heat wave and some clouds and showers were around during the second half, but these were apparently very widely scattered as there was no measurable rainfall at stations in the region during this 5-day stretch. The 114F for Beatty on the 18th set an all-time record maximum for the town, where records began in 1918. The previous record was 113F in August, 1933; the 114F record only lasted for a year as 115F was observed at Beatty on July 11, 1961. It appears that the Beatty instruments moved around several times for its period of record from 1918 to 1972. In the 1940s the station boasted a “U.S. Weather Bureau” observer and later an “airways observer.” This would suggest a station with excellent exposure and conservative maximums. In the 1920s and 1930s a handful of private citizens signed the forms, so the instruments were likely in town with perhaps a variety of exposures. By the late 1950s to 1972, the observer was the Nevada State Highway Department. And, as discussed above for Sarcobatus, these highway yards are sometimes local hotspots in the afternoon sunshine due to nearby equipment, bare ground cover, and less-than-optimal ventilation. Perhaps the 114F and 115F maximums at Beatty in 1960 and 1961 are slightly inflated, comparably, due to the instrument siting. It is unfortunate that it is often difficult to fairly compare extreme maximum temperatures year-to-year, decade-to decade, etc., due to changes in station location.
A climate station was at Lathrop Wells, NV, from 1942 to 1962, with a few periods of no data. This location is near present-day Amargosa Valley, near the junction of U.S. 95 and State Route 373, and is only 29 miles ENE of Furnace Creek. The highest maximum on record at Lathrop Wells is 115F, set on July 18, 1960. There was a 115F in September, 1950, but that is somewhat dubious. A reliable maximum of 114F was recorded in July, 1949. Lathrop Wells maximums from July 16 to July 20:
111, 113, 115, 111, 113
Though the maximums at nearby Cow Creek do NOT strongly support the 129F observation at Greenland Ranch on July 18, those at Beatty and Lathrop Wells do, as do those at Pahrump!
Pahrump maximums, July 16 to 21, 9 a.m. time of observation:
109, msg, 115, 113, 105, 108
(EDIT — the thermograph record for Greenland Ranch for July 18, 1960 shows a maximum of about 124F, and NOT 129F. The report of 129F is not valid.)
Pahrump is southeast of Lathrop Wells and is at a similar elevation (2830′ in 1960). It, too, hit 115F in July, 1960; the observer (Frances Turner) entered this value on the 18th. Since the time of observation at Pahrump was at 9 a.m. and since the observation for the 17th was missed, 115F probably occurred on the afternoon of the 16th or 17th—more likely on the 17th. Sometimes, at stations where the instruments are checked only in the morning, the observers (erroneously) enter the maximum temperature on the previous date, i.e., on the actual date it occurred. So, it is possible that Pahrump’s 115F this July did indeed occur on the 18th. This is the highest temperature at Pahrump from 1949 to 2015. It was equaled, not surprisingly, in the Julys of 1961 and 1972. A station in Pahrump from 1914 to 1925 had a 117F report on July 1, 1924, but the surrounding station data suggest that this figure is several degrees too high. Perhaps the station was not well-exposed in 1924.
Even farther southeast, at Las Vegas Airport, the heat wave was not quite as extreme. Though more than 500 feet lower than Lathrop Wells and Pahrump, the maximum here was only 113F. Not too far away, though, at North Las Vegas Doxarm (between downtown Las Vegas and Nellis AFB at 1820 feet elevation), the maximum on July 17 was 121F. It goes without saying that the instrument siting, exposure, ground cover and nearby environments were probably not very similar between the stations at Las Vegas AP and North Las Vegas Doxarm.
Well-exposed on a low ridge at 1045 feet, Baker 9NNW had 120F on the 17th and 121F on the 18th. These were the hottest days on record here for the 17 summers from 1954 through 1970, except perhaps for a couple of very dubious (and unsupported) 120-plus reports in July and August, 1969. Needles Airport, just under 1000 feet, had 120F on the 16th, followed by daily maximums of 118F, 116F, 113F, and 114F. It seemed that the “core” of the hot weather migrated from southeast to northwest through the region from the 16th to the 18th. Oftentimes, when Death Valley is near record levels on maximum temperatures, surface low pressure (the “thermal low”) is centered near the basin and slightly moister and milder air is drawn up from the south. Stations near and southeast of Interstate 15 will get a little relief with lower maximums, but higher humidities and higher overnight minimums might be the price one pays for that.
Note that these well-exposed stations near 1000 feet elevation typically “max-out” close to 120F during an impressive heat wave. The 2 or 3 hottest days every 50-100 years will reach 122F or 123F at this elevation.
South and southwest of Death Valley, stations were a little short of their all-time maximums by a degree or two, for the most part: Daggett hit 115F, hottest since it opened in 1944, but surpassed by several 117F and 118F days from 1961 to 2015. Trona had 117F, one short of its several days with 118F in more than 90 years of record. Inyokern’s 115F in July, 1960, was its hottest reading from 1948 to 1971. This record was smashed by the 119F there in July, 1972. Lancaster, in the Antelope Valley, had 114F on the 18th and 19th. This was the hottest on record for the town station from 1945 to 1972, and remained the hottest until 2013 at Fox Field Airport nearby. The big heat wave of late June and early July of 2013 pushed the temperature up to 115F at Lancaster. Randsburg recorded 111F for the first time (on the 17th). This reading has been equaled but not exceeded in five different years since 1960. Randsburg’s first summer of observations was in 1938.
In the Owens Valley, Independence had 108F, its highest reliable maximum until 110F in June, 1961. Bishop had three afternoons with 107F. Above 5000 feet, Deep Springs had 103F, Goldfield 99F, and Tonopah AP an all-time record maximum of 104F! No other day at Tonopah AP from 1954 to 2015 has been hotter than 103F.
So, let’s go back to the suspect 129F reading at Greenland Ranch on July 18, 1960. Is it authentic? The reading is two degrees hotter than the next-hottest trustworthy maximum temperature for the station during its period of record from 1911 to 1960. If there were no Cow Creek station operating concurrently, it would be very, very difficult to discount Greenland Ranch’s 129F report. Very hot, record-setting temperatures were observed at Tonopah (104F), Beatty (114F), Lathrop Wells (115F) and Pahrump (115F). Air descending from 2800 feet (Lathrop Wells’ elevation) to Furnace Creek will warm about 15 degrees adiabatically. The more-typical slope for summer maximums of 4.5 degrees/1000 feet would support a 12-to-13 degree increase in temperature due to compression, or a maximum of 127F to 128F at Furnace Creek.
Trona (117F) was just one degree short of its all-time highest temperature. At an elevation 1850 feet higher than Furnace Creek, Trona’s maximum supports about 125F to 126F at Furnace Creek. Sarcobatus (110F), Independence (108F), Haiwee (106F) and Bishop (107F) were very close to all-time maximums, as was Baker 9NNW (121F). Mitchell Caverns, on the slopes of the Providence Mountains between Essex and Kelso, recorded a 106F maximum on the 17th. This ties this station’s all-time record high for its period of record from 1958 to 2010 (if the very suspect report of 110F in July, 1980, is discarded). Even Cow Creek tied its hottest temperature on record, with 126F, on four consecutive days! But since Greenland Ranch was only 124F on the other three days on which Cow Creek was 126F, and since the two stations are separated by only three miles, and since Cow Creek is typically and consistently a degree or two warmer on summer afternoons: the 129F at Greenland Ranch on the 18th is, at least, questionable. And, there is one more station which casts doubt upon the reading. The temporary station at Badwater had maximums of 127, 128, 128, 127.5, and 126F from July 16 to July 20. These readings are very consistent with those at Cow Creek for the five days (125, 126, 126, 126 and 126F). Greenland Ranch, in between Cow Creek and Badwater, reported 124, 124, 129, 124 and 124F. The 129F report for Greenland Ranch on the 18th, hotter than even Badwater, is difficult to explain and is likely not valid. It is not entirely credible. Someone said that thermographs were running in all three of the Death Valley stations in 1960, and these should resolve the issue. I need to find those thermographs.
(EDIT — the thermographs for Greenland Ranch were indeed located, and they do NOT support the maximum of 129F on July 18, 1960!)
For the 11-day period from July 13 to July 23, 1960, average daily maximums correlated well with elevation in the region. Most stations plot within a degree or two of the 4.5 deg/1000′-sloped line through Greenland Ranch. There is a head-scratcher or two. For instance, why is Indian Springs warmer than Daggett Airport, despite its higher elevation by 1200 feet? Daggett Airport instruments are very-well exposed. The siting for the instruments at Indian Springs may be less than optimal, or less than adequate.
For this month, let’s compare the average maximums for the hottest 5-day stretch (July 16-20, 1960), with each station’s normal daily maximum for July. The 1951-1980 normal is used here, or the station’s period-of-record if the 30-year normal is not available. Listed below is the departure from normal for the 5-day period, followed by the station and the average of its five maximums from July 16 to 20:
+9.8 Cow Creek 125.8F
+8.6 Greenland Ranch 124.0
+9.8 Baker 9NNW 118.0
+9.6 Trona 115.2
+8.6 Daggett AP 112.4
+7.7 Las Vegas AP 111.8
+9.4 Barstow 112.0
+8.1 Inyokern 111.2
+9.8 Lathrop Wells 112.6
+10.4 Beatty 110.2
+10.0 Randsburg 108.8
+8.7 Haiwee 103.6
+10.1 Sarcobatus 108.4
+8.7 Bishop 106.2
+9.6 Dyer 102.8
+7.8 Deep Springs 99.0
+9.5 Tonopah AP 101.0
+10.4 Goldfield 98.6
Again, not surprisingly, all stations in the region were about 8 to 10 degrees (F) above their long-term average daily maximum temperature for July. It is “the norm” for desert station maximums to behave “in lockstep” like this during hot summer weather. There are no stations here that “stick out like a sore thumb,” so to speak, with regard to their departure-from-normal compared to the surrounding climate stations. Of course, this point is heavily stressed in this analysis, as this typical pattern was violated in the first half of July, 1913, by the Greenland Ranch maximums.

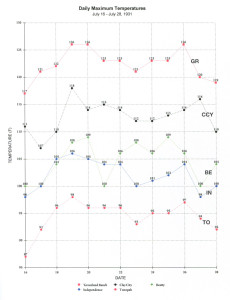
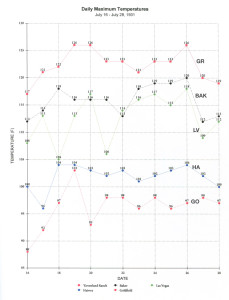
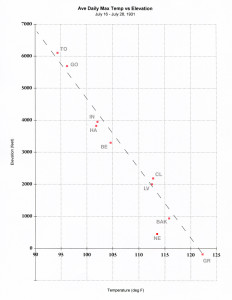
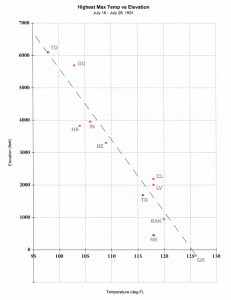
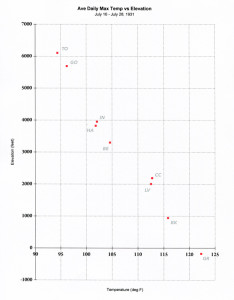
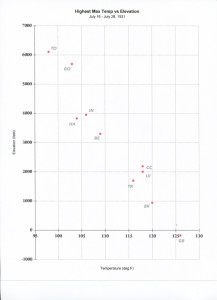
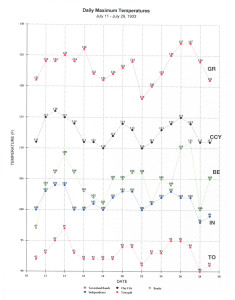
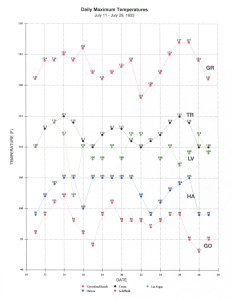
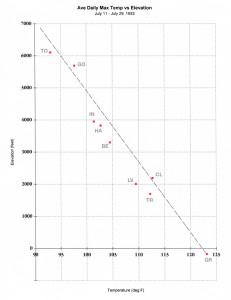
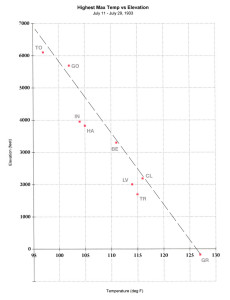
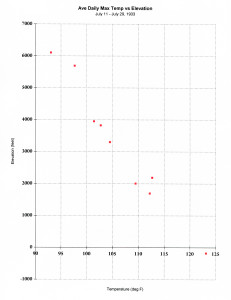
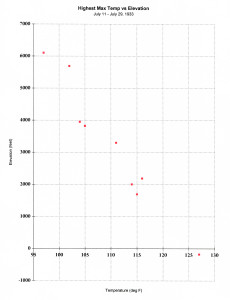
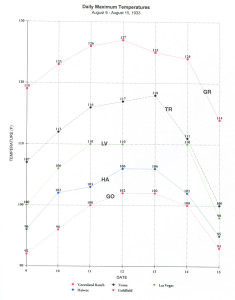
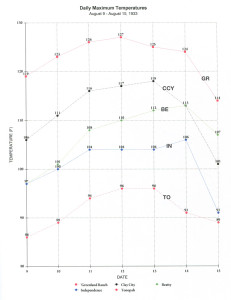
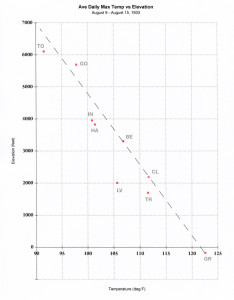
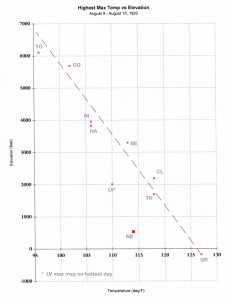
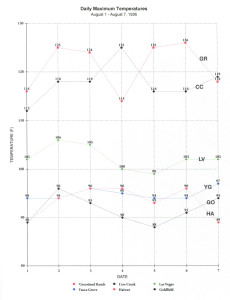
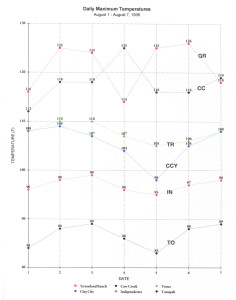
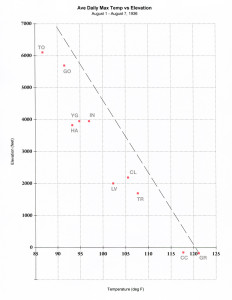
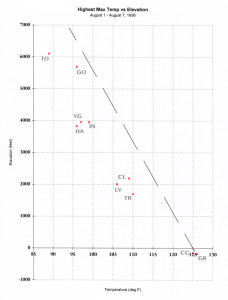
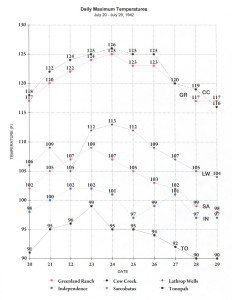
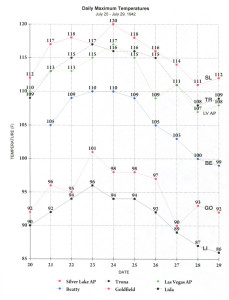
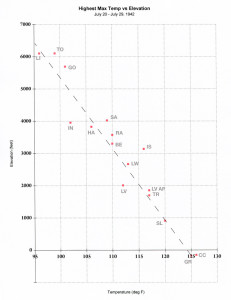
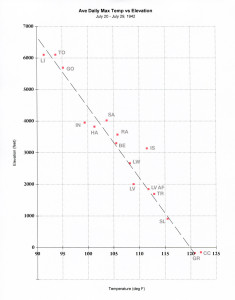
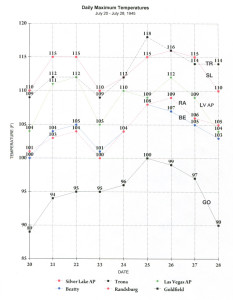
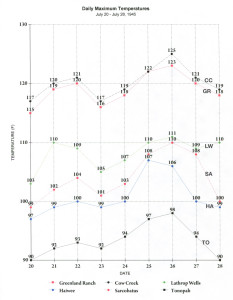
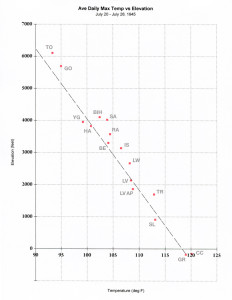
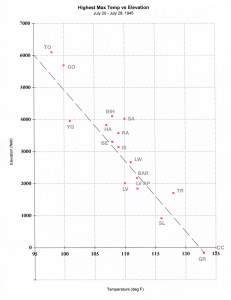
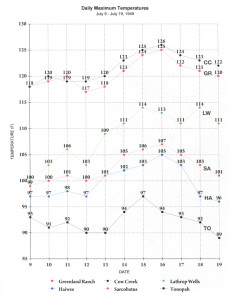
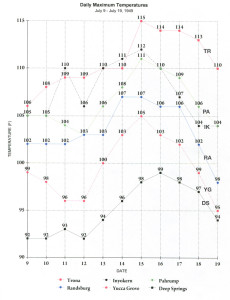
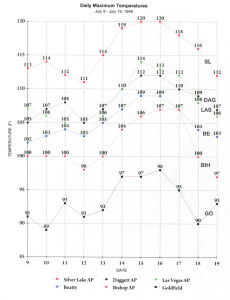
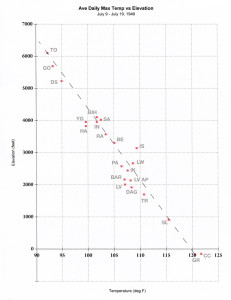
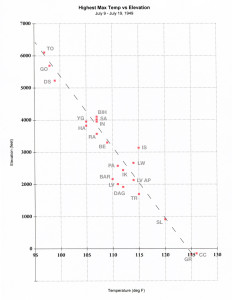
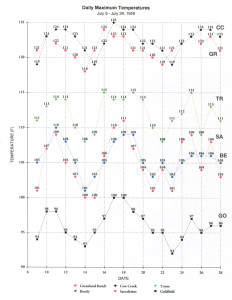
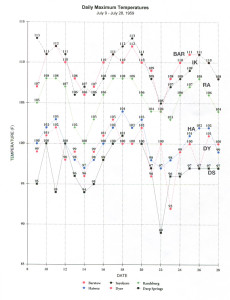
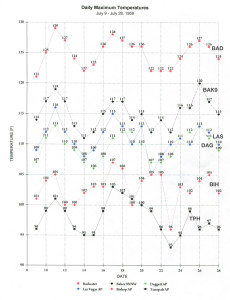
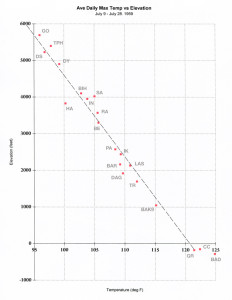
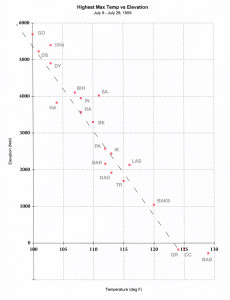
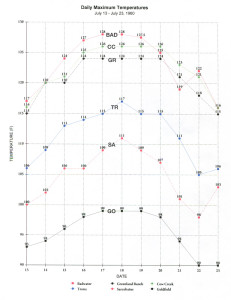
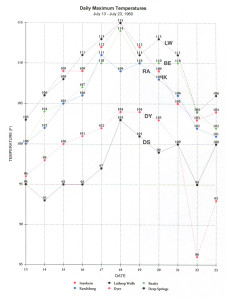
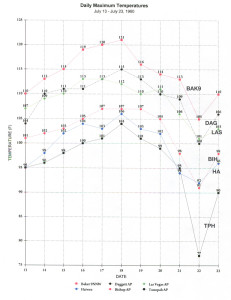
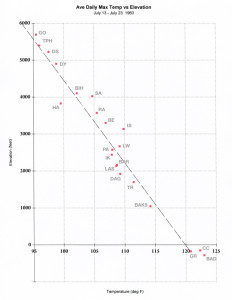
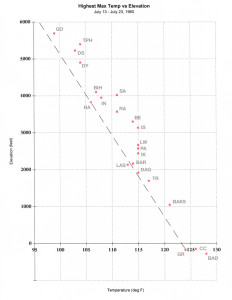
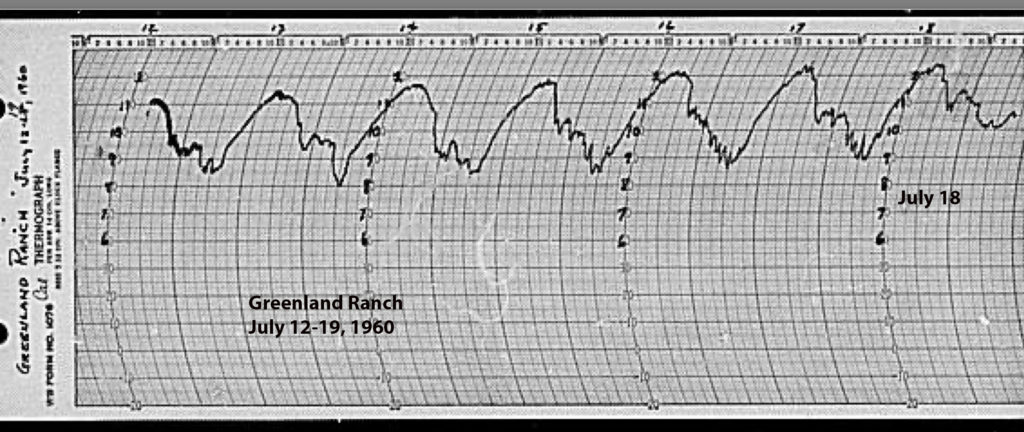
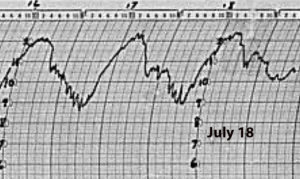
Leave a Reply
You must be logged in to post a comment.