
As a climatologist and researcher of temperature records for Death Valley in California, I was intrigued, but not amazed, to learn that July, 2018, was its hottest month on record. Death Valley’s official climate record began in 1911 at Greenland Ranch. (And, an official USWB station operated during the summer months of 1891.) Wow—the hottest month ever recorded—that is impressive! This blog entry investigates the record and the daily details of July 2018.
Link to Archived Weather Maps and Upper Level Data for July 2018
Note for August 8 — I have additional stations to add, plus all of the daily maps, plus some graphs! But I will go ahead and post this in the meantime.

Summer temperatures have been on the increase, seemingly, in recent years at Death Valley’s weather station. I visited the weather station and surroundings on July 23 last year (2017), and compared afternoon temperatures around Furnace Creek with a handheld thermometer. I determined that the station is in a relatively hot area now. The natural and bare ground cover around the station, and the presence of vegetation and buildings to its south which diminish ventilation, combine for the measurement of relatively hotter official afternoon maximum temperatures. When this “Death Valley” station at the Visitors Center was established in 1961, the ventilation through it was better due to fewer nearby buildings and less-extensive and shorter vegetation. Also, in 2012, the well-watered lawn area in front of the Visitors Center was replaced with a more natural (i.e., barren) desert surface. Since most summer afternoon winds are from the south here, the cooling effects of the lawn might have contributed to somewhat more conservative summer maximums prior to 2012.
For July of 2018 I decided to archive a bunch of daily weather maps and hourly temperatures. The primary purpose for this was to compare the maximums at Furnace Creek with those at other stations and with the upper air temperatures, and to see if I could show an obvious warm bias at today’s official Death Valley weather station. Scroll down for the daily maps and data.
Some preliminary info and articles on the July 2018 temperature record at Death Valley:
Daily Maximums at Death Valley/Furnace Creek, July 2018 (dates of the 5th, 10th, 15th, etc. in bold)
July 1-10) 118 119 117 113 117 121 121 126 121 114
July 11-20) 113 115 114 120 120 124 123 120 121 120
July 21-31) 115 120 125 127 127 127 127 124 124 123 120
Daily Minimums at Death Valley/Furnace Creek, July 2018
July 1-10) 89 96 94 90 89 82 94 96 102 94
July 11-20) 95 95 86 96 99 96 102 103 101 93
July 21-31) 96 93 96 95 102 100 94 101 100 103 103
For July 2018 at Death Valley:
Average daily maximum temperature: 120.5F (+4.0)
Average daily minimum temperature: 96.0F (+8.0)
Average: 108.24F (+6.0)
(departures based on 1981-2010 normals of 116.5/88.0/102.2)
Greatest Daily Range: 39 degrees
Smallest Daily Range: 17 degrees
Average Daily Range: 24.5 degrees
Extreme maximum: 127F
Extreme minimum: 82F
Lowest maximum: 113F
Highest minimum: 103F
Number of days with a maximum of 120F and higher: 21 days
Number of days with a minimum of 100F and higher: 10 days
Note: The daily temperatures were taken from the daily temperature and precipitation (RTP) lists compiled and disseminated by the National Weather Service office in Las Vegas, Nevada. Maximum temperatures were taken from the (following) morning product, as occasionally the high temperature figure provided in the afternoon product is exceeded. These figures should not be considered as official.
As shown above, Death Valley’s average daily maximum of 120.5F in July 2018 is 4.0 degrees warmer than its latest 30-year normal average daily maximum of 116.5F. Until the past 20 years or so, an average daily maximum as warm as 120F in July (or any month) was extremely rare. At Greenland Ranch (POR/1911 to 1960), July 1917 had 121.9F, but the last week of maximums reported by observer Oscar Denton this month appear too warm as they are not supported by the maximums at surrounding stations. Also at Greenland Ranch, July 1931 had 120.6F and July 1933 had 119.9F. At Death Valley (POR/1961 to 2018), hottest are July 1996 (120.0F), 2002 and 2003 (120.6F for both), 2005 (120.5F), 2006 (120.6F), and 2009 (121.3F). Only one July had an average daily maximum as warm as 120.0F from 1911 through 1995 (if July 1917 is tossed), but it has occurred seven times since 1995.
Death Valley’s average daily minimum of 96.0F in July 2018 is a full 8.0 degrees warmer than its 1981-2010 normal of 88.0F. The record book shows an average daily minimum of 96.3F in July 1915, but a somewhat rigorous investigation of the daily temperatures at Greenland Ranch for the summer of 1915 strongly suggests that the July 1915 minimum temperature reports are too warm and are not trustworthy. The next-highest average daily minimum is 95.1F for July 2017. Thus, the 96.0F average minimum for July 2018 is the highest reliable record. The warmest average daily minimum for any month at Greenland Ranch was 93.3 for July 1959. Prior to 2017, the warmest at Death Valley was 93.6F in July 2006.
As mentioned in the articles linked above, the average temperature of 108.2F for Death Valley in July of 2018 is the hottest on record for Death Valley, and it rivals the hottest for any month for any station on the planet. It beat the 107.4F for July 2017 at Death Valley. Earlier Death Valley records include 107.0F for July 2006, and 106.3F for July 1959 at Greenland Ranch. I have not checked the veracity of the 106.7F for July 1929 at Greenland Ranch.
By the way, a temporary and standardized weather instrument shelter, with a thermograph enclosed, was at Badwater for the Julys of 1959, 1960 and 1961. In July of 1959, the average daily extremes at this Badwater station were 122.4F and 93.8F, for a monthly average of 108.1F.
Airport ASOS Averages for July 2018
The NWS offices in California and Nevada provide monthly means for automatic weather stations at airfields in or relatively close to the Death Valley region (and three California stations in the southern deserts). These are preliminary figures and should not be considered official. The first list will provide the averages and extremes and precipitation for July 2018, and the second list will provide the departures from the 1981-2010 normals.
Death Valley 120.5/96.0/108.2 127/82
Bishop AP 101.1/62.5/81.8 106/51 1.52″
Daggett AP 107.7/78.9/93.3 114/68 0.11″
Desert Rock AP 104.5/76.3/90.4 110/66 0.05″
Las Vegas AP 106.9/84.6/95.8 115/73 0.78″
N. Las Vegas AP 106.0/82.4/94.2 113/71 0.01″
Needles AP 112.4/88.5/100.4 122/80 0.93″
Tonopah AP 95.5/63.9/79.7 100/53 1.12″
Blythe AP 109.5/84.7/97.1 120/74 0.10″
Palm Springs AP 109.8/84.8/97.3 121/75 1.11″
Thermal AP 111.6/82.6/97.1 122/68 Tr.
Departures from 30-year normal (1981-2010) for ave max/ave min/monthly ave for July 2018
(all figures are above normal)
Death Valley 4.0/8.0/6.0
Bishop AP 2.7/6.3/4.5
Daggett AP 3.5/5.6/4.6
Desert Rock AP 4.9/6.1/5.5*
Las Vegas AP 2.7/3.7/3.3
N. Las Vegas AP —/—/2.9
Needles AP 3.6/4.2/3.8
Tonopah AP 3.6/6.4/5.0
Blythe AP 1.3/4.4/2.9
Palm Springs AP 2.5/7.5/5.0
Thermal AP 4.7/6.3/5.5**
* five days missing mid-month at Desert Rock AP
** Thermal data are compared to its averages for POR 1950-2018
Among these stations, Death Valley had the greatest departures from normal for both average maximum and average minimum, except for Thermal, and if Desert Rock data are tossed due to its five missing days.
Hottest Month on Record through July 2018
The month of July 2018 was the hottest on record, or nearly the hottest, at most of these airport/ASOS stations in the Death Valley region and in California’s southern deserts.
Death Valley 108.2 in July 2018/old record 107.4 in July 2017
Bishop AP 81.8 in July 2018/old record 80.8 in July 2017
Daggett AP 93.3 in July 2018/old record 93.0 in July 2006
Desert Rock AP 90.4 in July 2018 (5 days msg)/old record 90.1 in July 1996
Las Vegas AP 96.2 in July 2010/95.8 in July 2018
Needles AP 100.9 in July 2006/100.4 in July 2018
Tonopah AP 79.7 in July 2018/old record 78.9 in July 2017
Blythe AP 98.2 in July 1980/97.1 in July 2018
Palm Springs AP 97.3 in July 2018/old record 97.2 in July 2006 (at the PS Fire Station)
Thermal AP 97.1 in July 2018/old record 94.9 in July 2006
CEMP stations
Numerous automatic weather stations have been established around the Nevada National Security Site. Many of these are not too far from Death Valley, and the temperature data provided are generally excellent! Station data are archived back to 1999 for many of the stations. The program is called “CEMP,” for “Community Environmental Monitoring Program.”
Here are the averages and the ranges of the maximums and minimums at selected CEMP stations (for example, at Rachel, all of the daily maximums were from 85 to 101F, and all of the daily minimums were fro 52 to 71F).
Rachel 4854′ 96.1/63.3/79.7 maximums 85-101/minimums 52-71
Tonopah 6180″ 90.9/64.5/77.7 maximums 84-95/minimums 59-70
Goldfield 5590′ 93.9/64.8/79.4 maximums 85-100/minimums 59-74
Sarcobatus Flats 4014′ 100.6/68.1/84.4 maximums 93-106/minimums 54-78
Beatty 3311′ 102.6/73.7/88.2 maximums 96-108/minimums 61-82
Amargosa Valley 2424′ 105.7/78.6/92.2 maximums 99-112/minimums 67-87
Pahrump 2639′ 105.5/79.5/92.5 maximums 94-112/minimums 67-88
Tecopa 1337′ 112.3/81.4/96.9 maximums 103-119/minimums 62-91
Indian Springs 3156′ 102.7/75.3/90.3 maximums 94-110/minimums 68-83
Las Vegas 2025′ 109.5/84.2/96.4 maximums 97-117/minimums 73-92
HOURLY WEATHER DATA
Daily and Hourly weather data were saved for the Death Valley region and for other select desert stations in California and Nevada, and even some Colorado River stations in Arizona. For the stations below, 30-day archives of the available hourly (and for some stations, even more frequent) data were made on August 5th, 2018. This covers the period from July 7th to August 5th. At a handful of stations (primarily those in and close to Death Valley) there are also links to 7-day periods covering the first week of July, 2018. The stations aren’t in perfect alphabetical order, so you might have to spend some time scrolling to find a particular station. For instance, the CARB (California Air Resources Board) station near Furnace Creek in Death Valley will be found in the “C” section, because the station code is CQ162.
A23AA Mercury 30-day 05 Aug AHAKHAV PRESERVE 30-day
Amargosa Valley CEMP 30-day 05 Aug Amargosa Valley Gate 510 30-day 05 Aug
ASH MEADOWS 30-day 05 Aug BAKER (P618) CA 30-day 05 Aug
BALCH 30-day 05 Aug Beatty CEMP BENTON RAWS 30-day 05 Aug
Big Pine-CA 30-day Air Now 30-day 05 Aug Bishop, Bishop Airport 30-day 05 Aug
Boulder City SW 30-day 05 Aug BUDDY ADAMS Beatty NE 30-day 05 Aug
CALNEVARI 30-day 05 Aug CIMA 30-day 05 Aug
COTTONWOOD COVE 30-day 05 Aug CQ162 Death Valley Natl Park 30 day
CQ245 CARB Dirty Sox 30-day 05 Aug CQ250 CARB Owens Lake Shell Cut 30-day 05 Aug
CQ252 CARB Olancha 25-day 05 Aug CW9143 Pahrump 30-day 05 Aug
DEATH VALLEY JCT 7-day 20 Jul Deep Springs 30-day 05 Aug
DUNN UPR 30-day 05 Aug DYER – WALLACE FARMS 30-day 05 Aug
Essex SCAN 30-day 05 Aug EUREKA VALLEY RAWS 30-day 05 Aug
Eureka Vly 7day 07 Jul EW9946 Palm Desert 30-day
Fort Independence Met1-CA 30-day 05 Aug Frenchman Flat Well 5B 30-day 05 Aug
Furnace Creek 7day 07 Jul Furnace Creek 30-day Aug 5 Frn Cr hourlies July 5
Goldfield CEMP 30-day 05 Aug GOODSPRINGS 30-day 05 Aug
HAVASU RAWS 30-day 05 Aug HORSE THIEF SPRINGS RAWS 30-day 05 Aug
HUNTER MOUNTAIN 30-day 05 Aug INDEPENDENCE CA map 30-day 05 Aug
Indian Springs CEMP 30-day 05 Aug Jackass Flat Area 25 East 30-day 05 Aug
JEAN 30-day 05 Aug Jean AIRNOW 30-day 05 Aug
Jean SE 3 30-day 05 Aug KATHERINES LANDING HADS 30-day 05 Aug
KBLH Blythe AP 30-day KBVU Boulder City AP 30 day KBYS Bicycle Lake AP 30-day
KDAG Daggett 30-day 05 Aug KDRA Mercury AP 30-day 05 Aug
KEED Needles 30-day 05 Aug Keeler-Cerro Gordo Road CARB 30-day 05 Aug
KELSO UPR 30-day 05 Aug KHII Havasu City Airport 30-day 05 Aug
KIFP Bullhead City 30-day 05 Aug KINS Indian Springs AP 30-day 05 Aug
KLAS Las Vegas KLSV Nellis AFB 30-day 05 Aug
KNID China Lake 30-day 05 Aug KPSP Palm Springs 30-day
KTRM Thermal AP KVGT N Las Vegas AP 30-day 05 Aug
LAKE HAVASU CITY 30-day 05 Aug Las Vegas CEMP 30-day
LAURAL MOUNTAIN RAWS 30-day 05 Aug
Lizard Tail-NE Shoreline Owens Lake CQ248 30-day 05 Aug
Lone Pine Air Now-CA 30-day 05 Aug Lone Pine Sewer Ponds CARB 30-day 05 Aug
MID HILLS RAWS 30-day 05 Aug MOORE UPR 30-day 05 Aug
OAK CREEK RAWS 30-day OPAL MOUNTAIN RAWS 30-day 05 Aug
Owens Lake-ENE Shoreline 30-day CARB OX Ranch RAWS 30-day 05 Aug
Pahrump CEMP Primm 30-day 05 Aug
Rachel CEMP 30-day 05 Aug RICE VALLEY 30-day 05 Aug
Saratoga Springs Spgs 7day 07 Jul Saratoga Spgs 30-day aug 05
Sarcobatus Flats CEMP SEARCHLIGHT 30-day 05 Aug
Shadow Mountains (Mountain Pass) 30-day 05 AUg
SQUAW SPRINGS RAWS 30-day 05 Aug
Stovepipe Wells hourlies July 5 Stovepipe Wells 7-day 07 Jul
Stovepipe Wells 30-day 05 Aug Tecopa 7-day 07 Jul
Tecopa/Shoshone CEMP 30-day Tonopah CEMP 30-day 05 Aug
TPH, Tonopah Airport 30-day 05 Aug US95 Goldfield Summit 30-day 05 Aug
WHITE MTN SUMMIT STN 30-day 05 Aug
Yucca Flat Rebound MEDA (South) 30-day 05 Aug
Data for Stations in Death Valley
In July, 2018, four automatic stations provided online temperature data at least hourly: Death Valley/Furnace Creek, the Death Valley CARB station (CQ162), Stovepipe Wells 1SW, and Saratoga Spring.
1 —- The official NWS Death Valley station in the “weather station corral” near the Visitors Center at Furnace Creek, at an elevation of -193 feet. In this view (below) towards the NNW in July of 2017, the old thermometer shelter is in the center, and just to the left of center is the official (Campbell Scientific) automatic instrumentation. The station is labeled online as
VISITORS CENTER AT FURNACE CREEK DEATH VALLEY, CA. DEVC1 (HADS)
“HADS” stands for “Hydrometeorological Automated Data System” and these stations are operated by the NWS Office of Dissemination. Personnel at the NWS office in Las Vegas are ultimately responsible for this station, and the National Park Service (NPS) is the official “observer,” though everything is automated now. Data are transmitted at least once per hour to the NWS, and these near real-time data are provided and available online. The official daily max and min temperatures and rainfall for Death Valley are from this HADS station. NPS personnel take readings off of the max and min thermometers in the shelter each morning, and are instructed to inform the NWS if the readings vary by more than a degree or two from the automated HADS readings.
We will refer to this station as “Death Valley/HADS”

2 —- The Death Valley CARB station, just east of the Cow Creek/Park Village, about three miles NNE of the Furnace Creek Visitors Center weather station. This automatic station is a California Air Resources Board (CARB) station, and is very well exposed at an elevation of 410 feet. The station’s Mesowest Number is CQ162.
Hourly temperatures are available, and the CARB website indicates that the temperature provided for each hour is the “hourly max ambient temperature.”
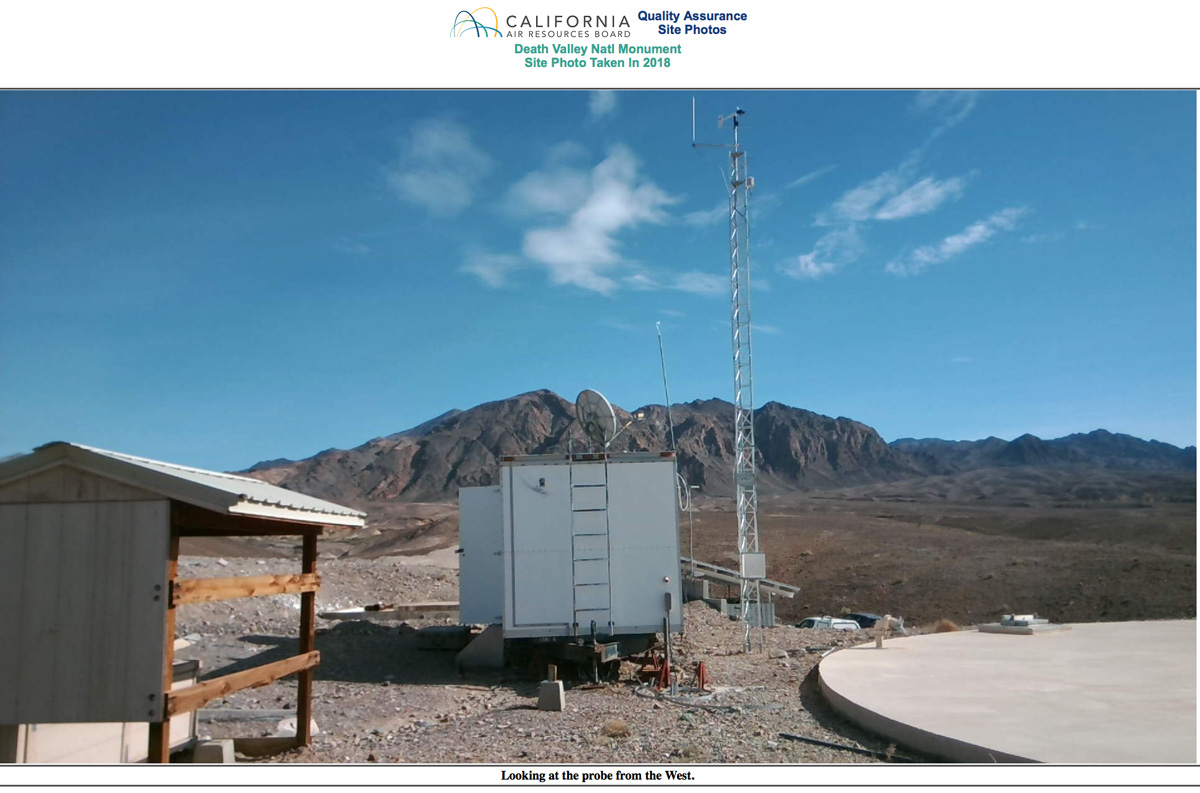
The CARB photo above is a view towards the east, and shows the thermometer sensor radiation shield near the top of a 10-meter (?) pole. We will refer to this station as “Death Valley/CARB.”
3 —- The USCRN station near Stovepipe Wells, also called Stovepipe Wells 1SW and ISWC1.
This is a United States Climate Reference Station (USCRN). Temperature data are updated every 5 minutes online.
The locator map for this station shows that it is about one-fourth mile south of the Stovepipe Wells store and motel on Highway 190. The elevation is given as 80 feet, which is about 75 feet above the village area of Stovepipe Wells. I don’t have a picture of this station yet, but it is in an area with excellent exposure to the elements. It will be called “Stovepipe Wells” here.
4 —- The RAWS (Remote Automated Weather Station) station at Saratoga Spring (near the southern end of Death Valley, also called TOGC1). Elevation is 198 feet, and online data are hourly only at 38 minutes after the top of the hour. I have no images of this station. The temperature sensor/radiation shield is from 4 to 8 feet above the ground at a RAWS station, and the hourly temperature provided is the instantaneous temperature at the time of observation.
Let’s compare the average and extreme temperature data for these four stations for July 2018. The “official” Death Valley/HADS station at Furnace Creek had
120.5/96.0/108.2 127/82
and, based only on the hourly temperatures available online, these figures change to
118.7/96.8/107.8 125/85
It is noteworthy that the official average maximum temperature at Death Valley/HADS is nearly two full degrees (F) higher than the average of all of the highest hourly measurements. Typically, the daily maximum temperature (at a desert station on a typical sunny day in summer) is zero, one, or occasionally two degrees warmer than the temperature reading for the hottest hourly temperature measurement. This is especially the case at airport ASOS stations, where temperature is updated every minute and each “one-minute temperature” value is an average of the previous five-minute temperatures. At Death Valley/HADS in July, 2018, the official high temperature for the day was the same as the hottest hourly temperature on 4 days, it was one degree higher on 9 days, two degrees higher on 9 days, three degrees higher on 7 days, four degrees higher on 1 day, and five degrees higher on 1 day. Here are the highest hourly temperature readings on the hottest days in July 2018 (official high and highest hourly and the difference):
July 8) 126 highest hourly 123, diff 3
July 16) 124 highest hourly 121, diff 3
July 23) 125 highest hourly 121, diff 4
July 24) 127 highest hourly 124, diff 3
July 25) 127 highest hourly 125, diff 2
July 26) 127 highest hourly 124, diff 3
July 27) 127 highest hourly 124, diff 3
July 28) 124 highest hourly 123, diff 1
July 29) 124 highest hourly 121, diff 3
On these nine days, all with official maximums from 124 to 127F, the official maximum temperature averaged nearly three degrees warmer than the highest hourly temperature. This strongly suggests that this Death Valley station bases its daily maximum temperature on a relatively short-term period of measurement (e.g. one second or maybe one minute) and/or that the station temperature sensor is relatively very sensitive. It is likely that if temperature at Death Valley/HADS were based on 5-minute average temperature measurements only, that the average maximum for the month would be at least one degree lower.
At Stovepipe Wells, the average difference between the highest hourly temperature reading (taken at the top of the hour) and the highest 5-minute reading is quite a bit less, just 0.7 degrees:
Stovepipe Wells, July 2018 based on hourly temperatures
117.6/96.0/106.8 123/84
and Stovepipe Wells, based on 5-minute temperatures
118.3/95.0/106.7 123/83
So, let’s try to compare apples-to-apples as closely as possible: here are the averages and extremes for the four stations in Death Valley for July, 2018, based only on hourly temperature readings:
July 2018
Death Valley/HADS (elev. -193) 118.7/96.8/107.8 125/85
Death Valley/CARB (elev. 410′) 113.8/98.2/106.0 120/89
Stovepipe Wells (elev. 80′) 117.6/96.0/106.8 123/84
Saratoga Spring (elev. 198′) 115.1/90.4/102.8 121/79
One factor to keep in mind is that the hourly temperature provided at the Death Valley/CARB station (three miles NNE of Furnace Creek) is the highest temperature measured during the previous hour. This could have a profound influence on the daily minimum temperatures. But, since the temperature sensor at this station is well above the ground, and since the station is very well exposed on a desert slope, this peculiarity of sorts is probably not of great consequence. It would be much more of a factor at a more poorly-exposed station with a sensor at a typical level about five feet above the ground.
Leave a Reply
You must be logged in to post a comment.