
Part 2 is here/data and maps for July 16-31
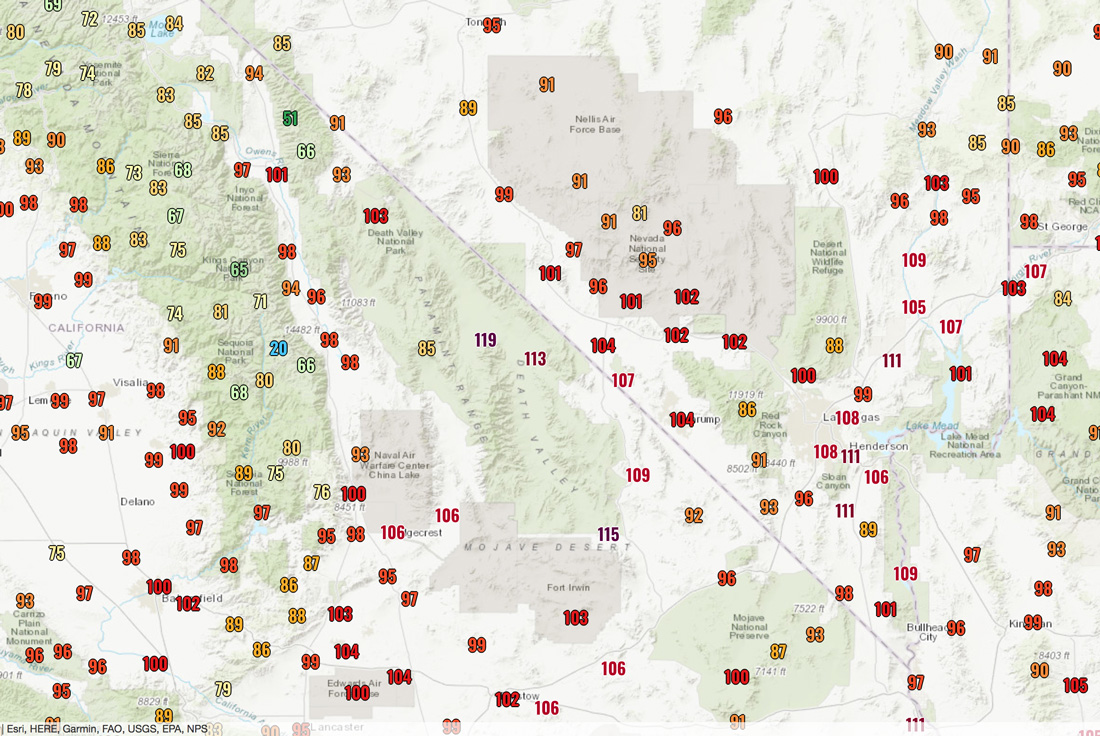
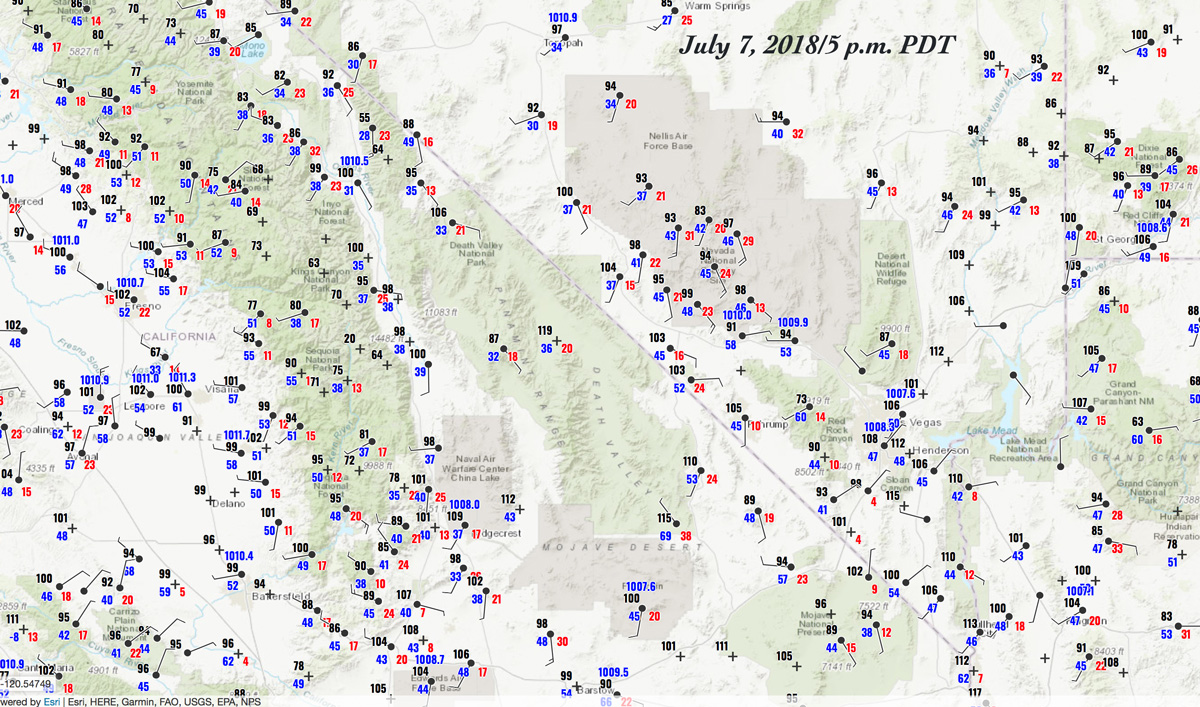
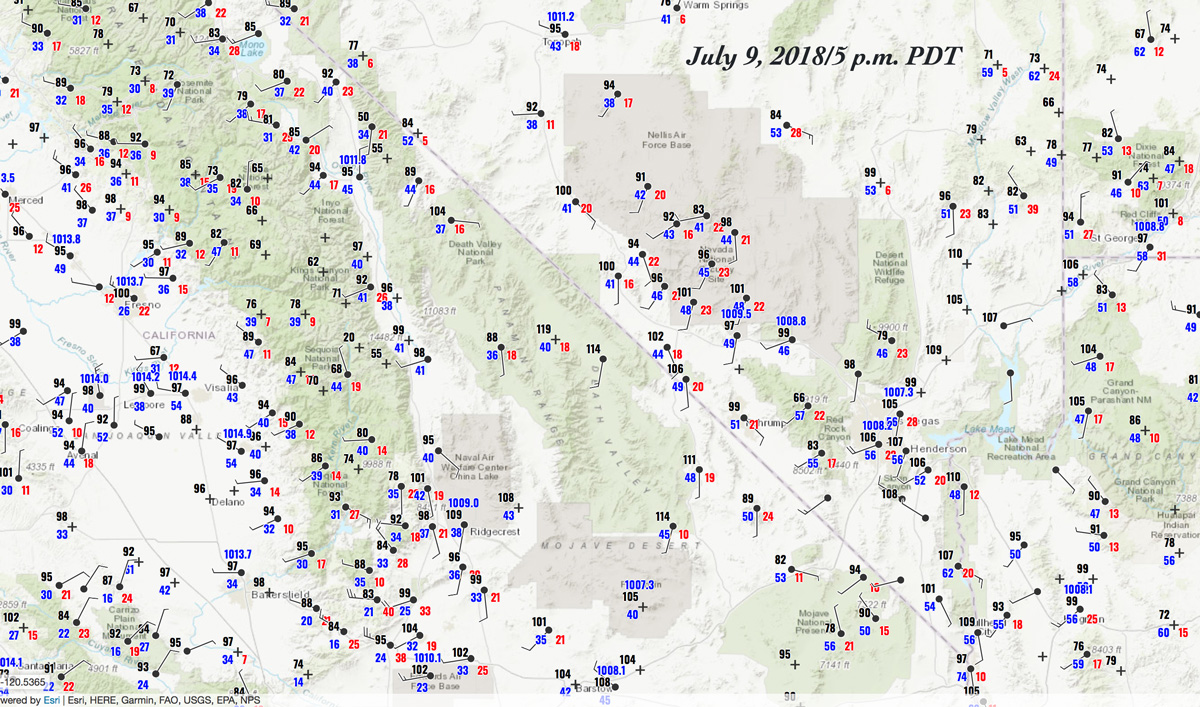
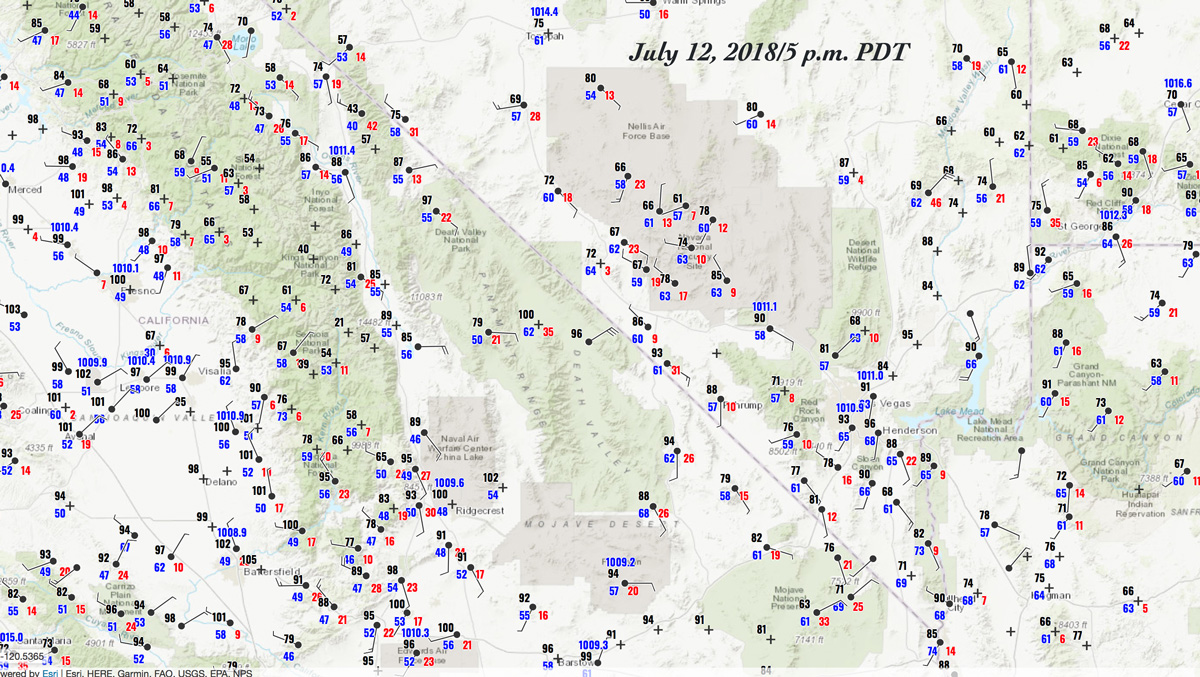
July 2018 was very hot in desert areas of California, Nevada, and Arizona. Some stations in the Death Valley region recorded their warmest month ever. At Furnace Creek in Death Valley, the average maximum was four degrees above normal, and the average minimum was eight degrees above normal.
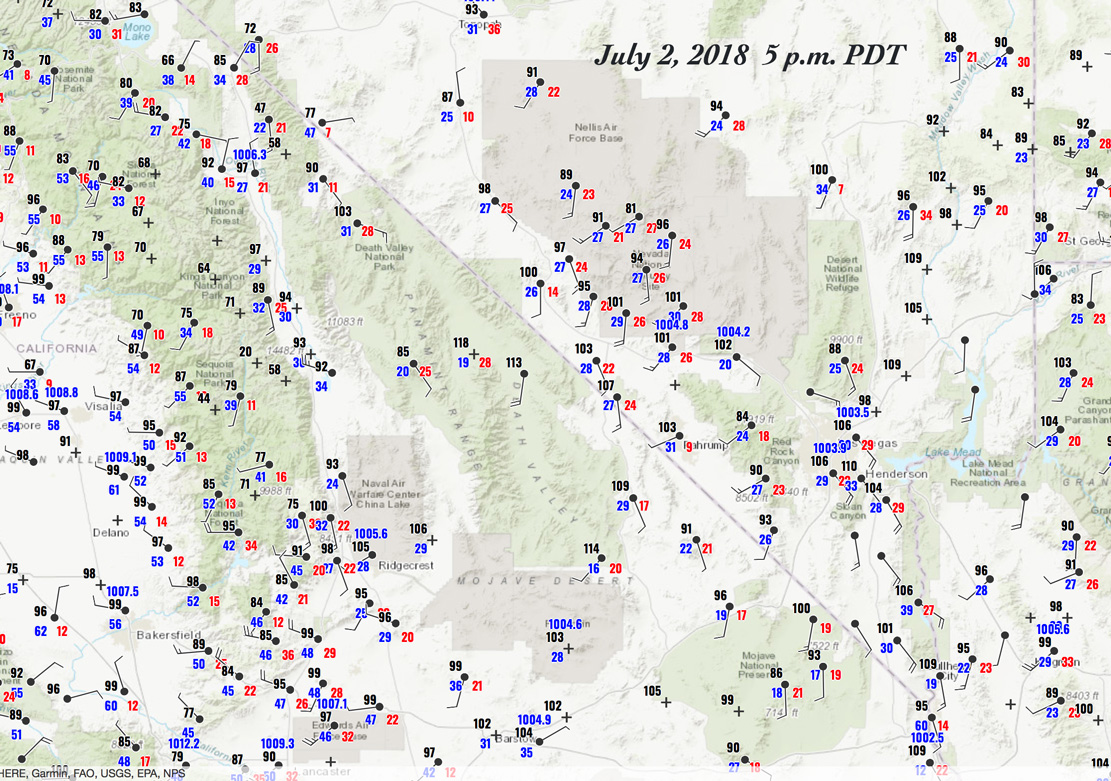
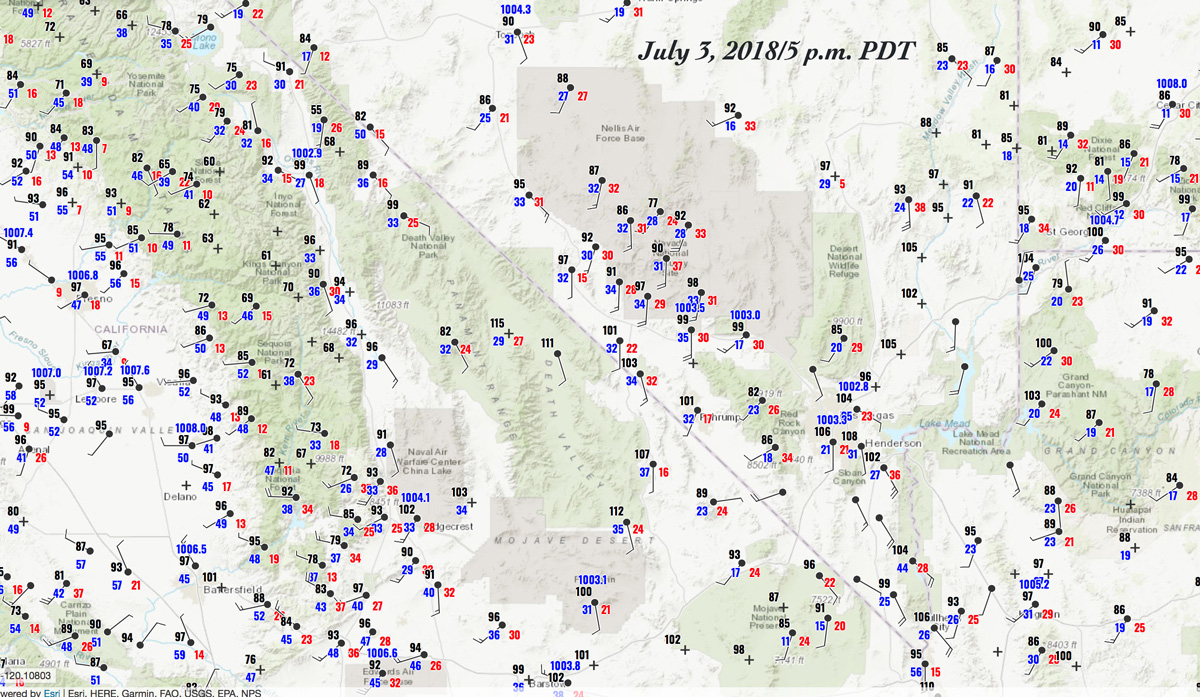
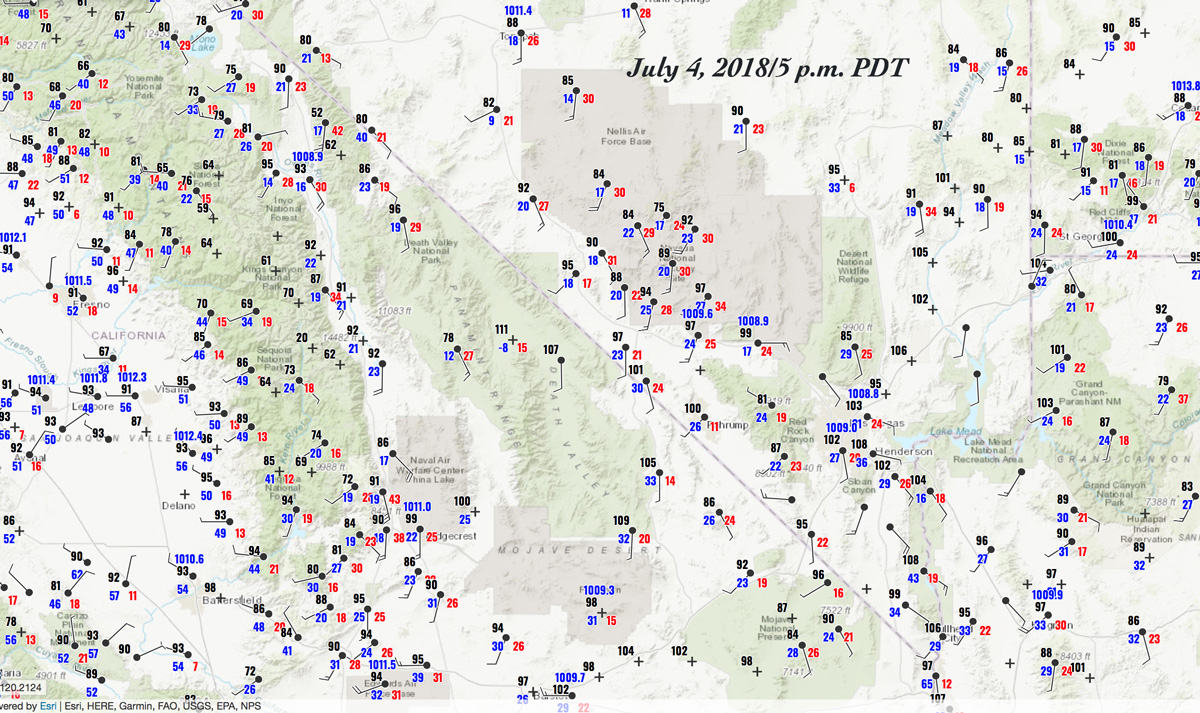
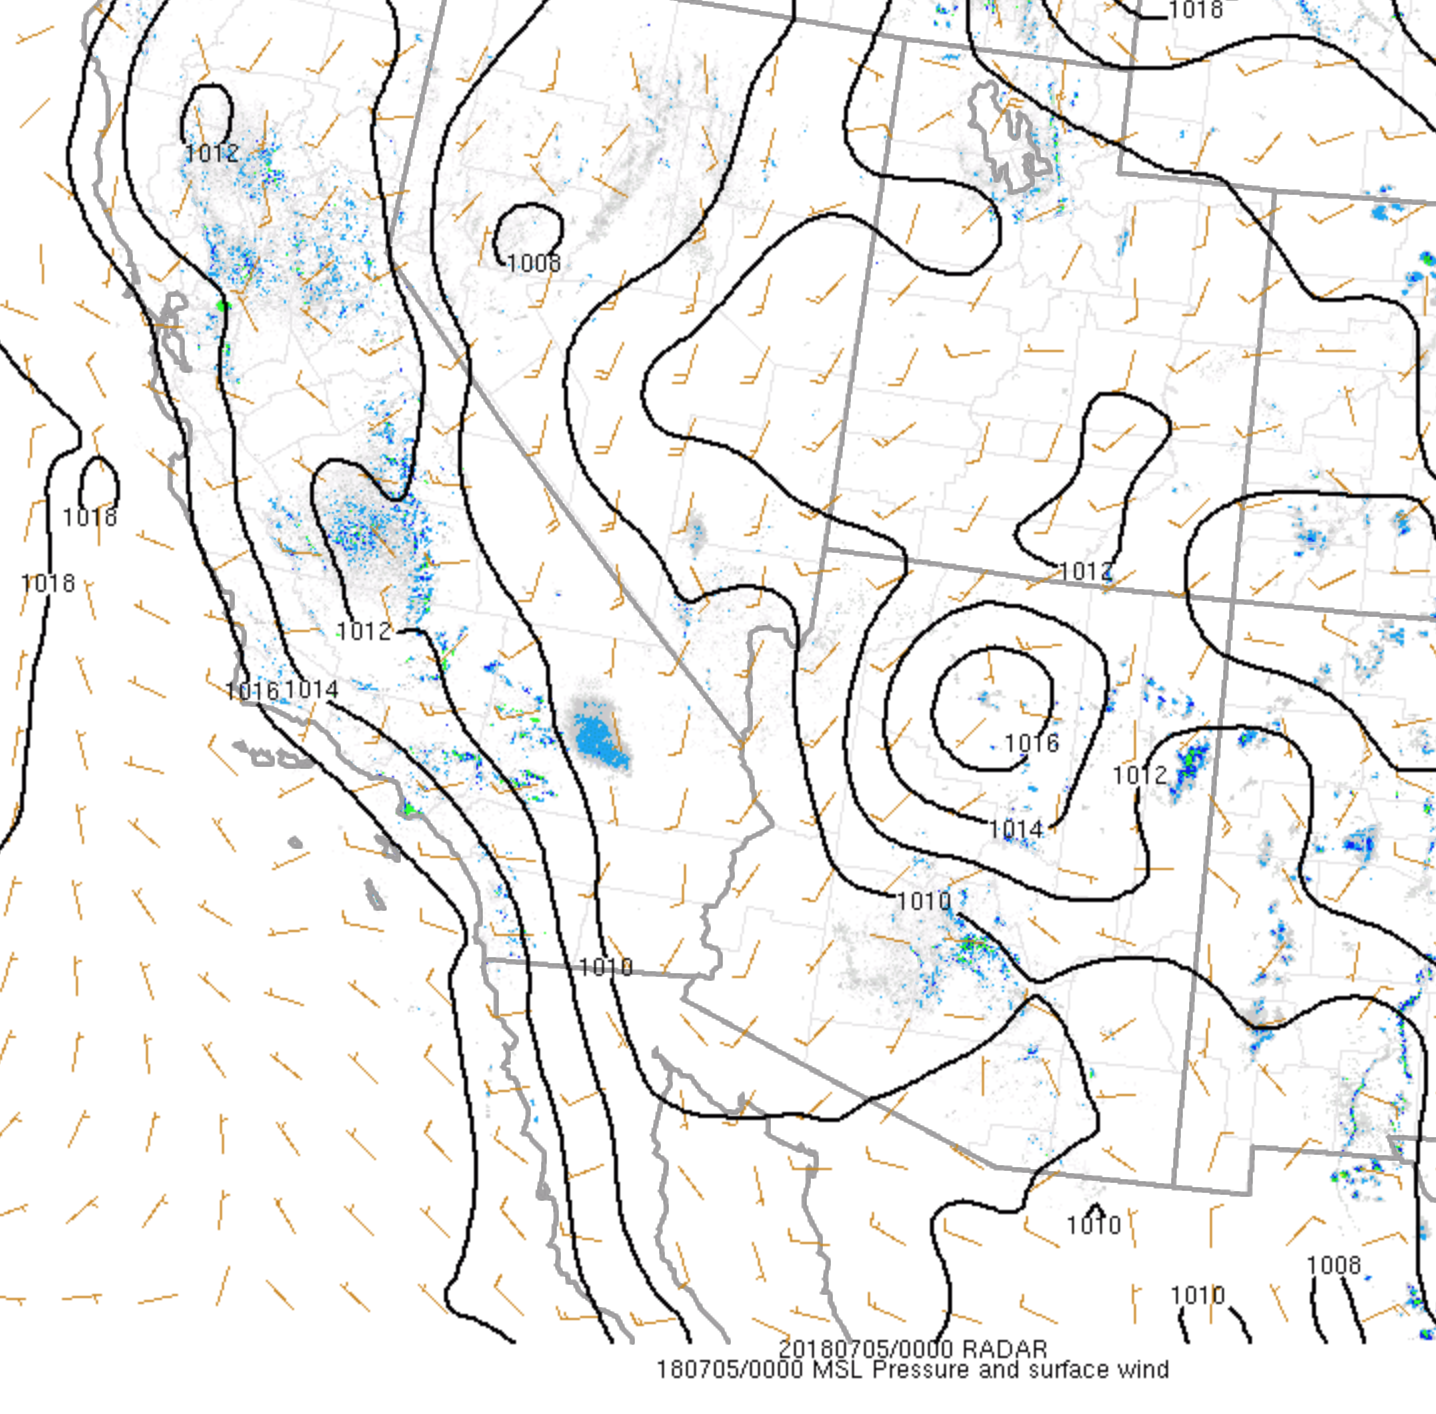
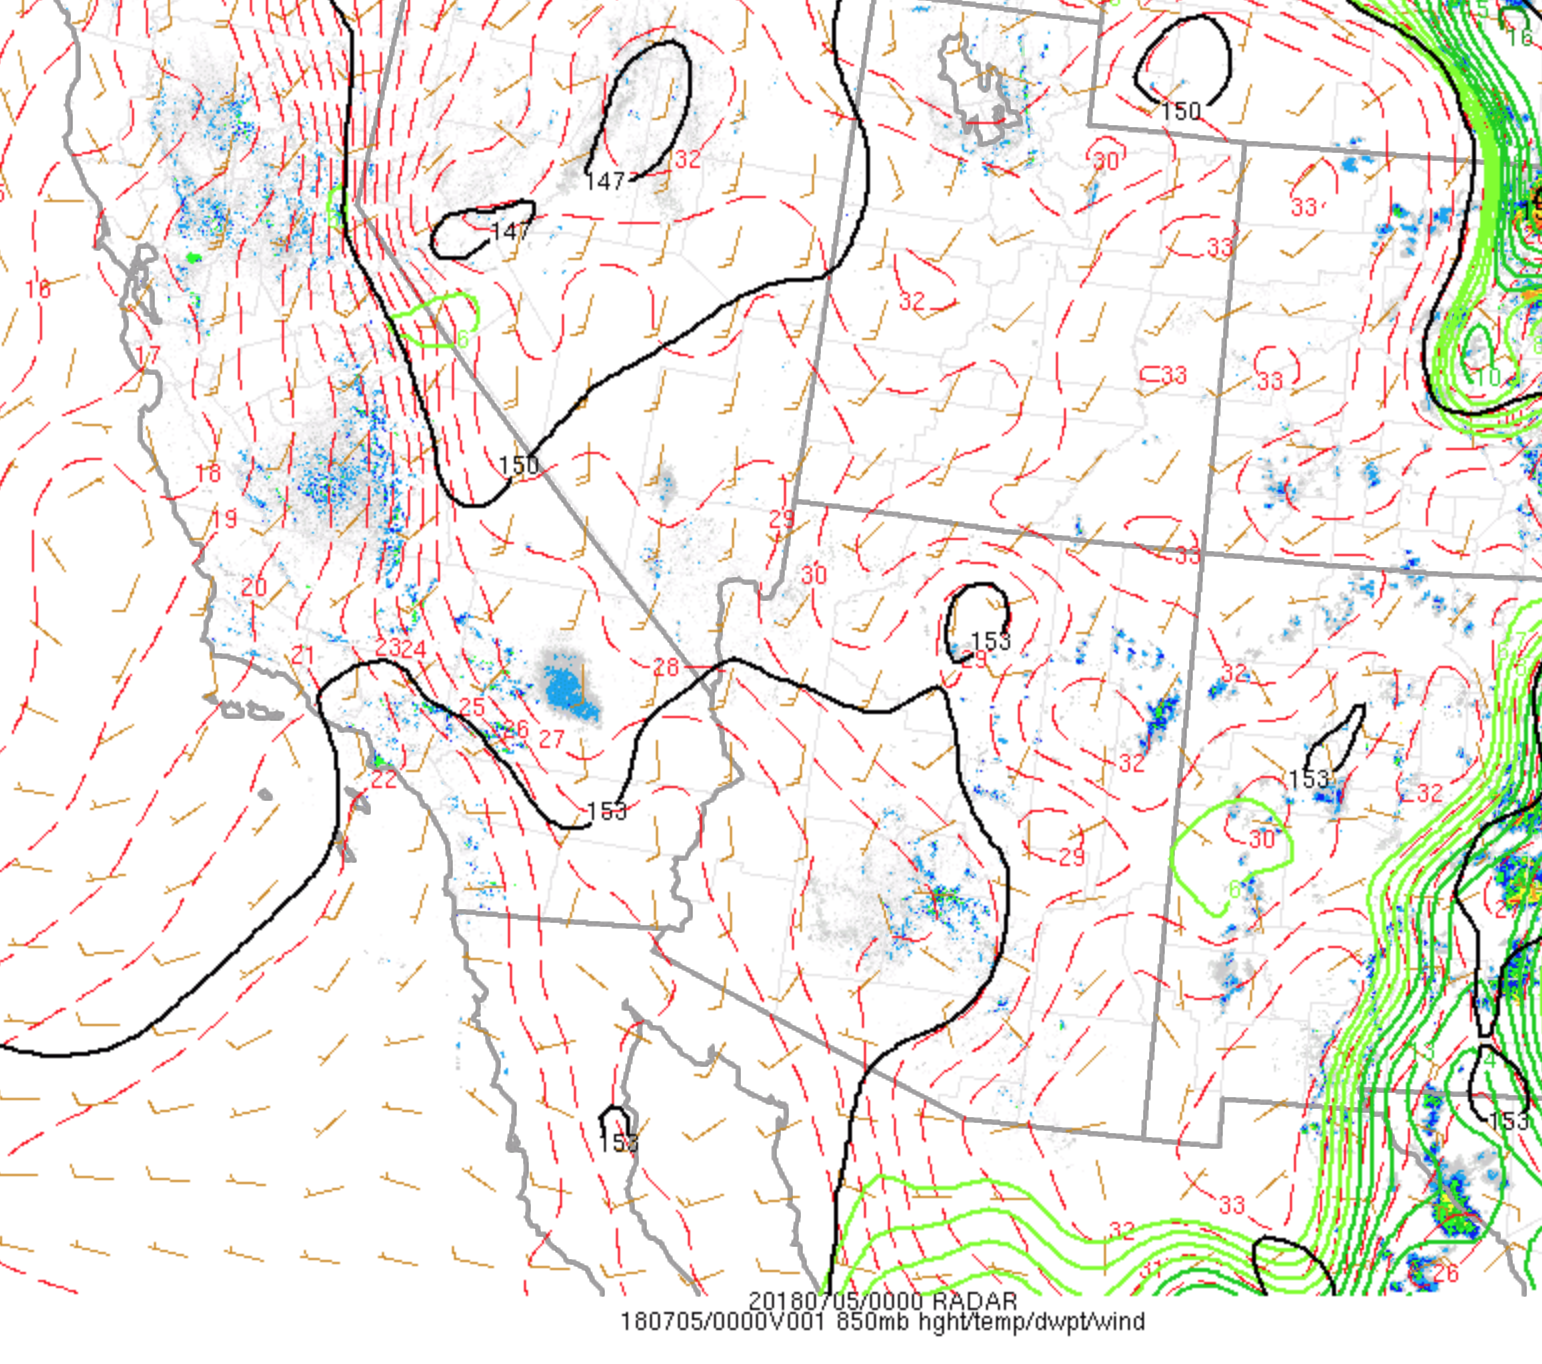
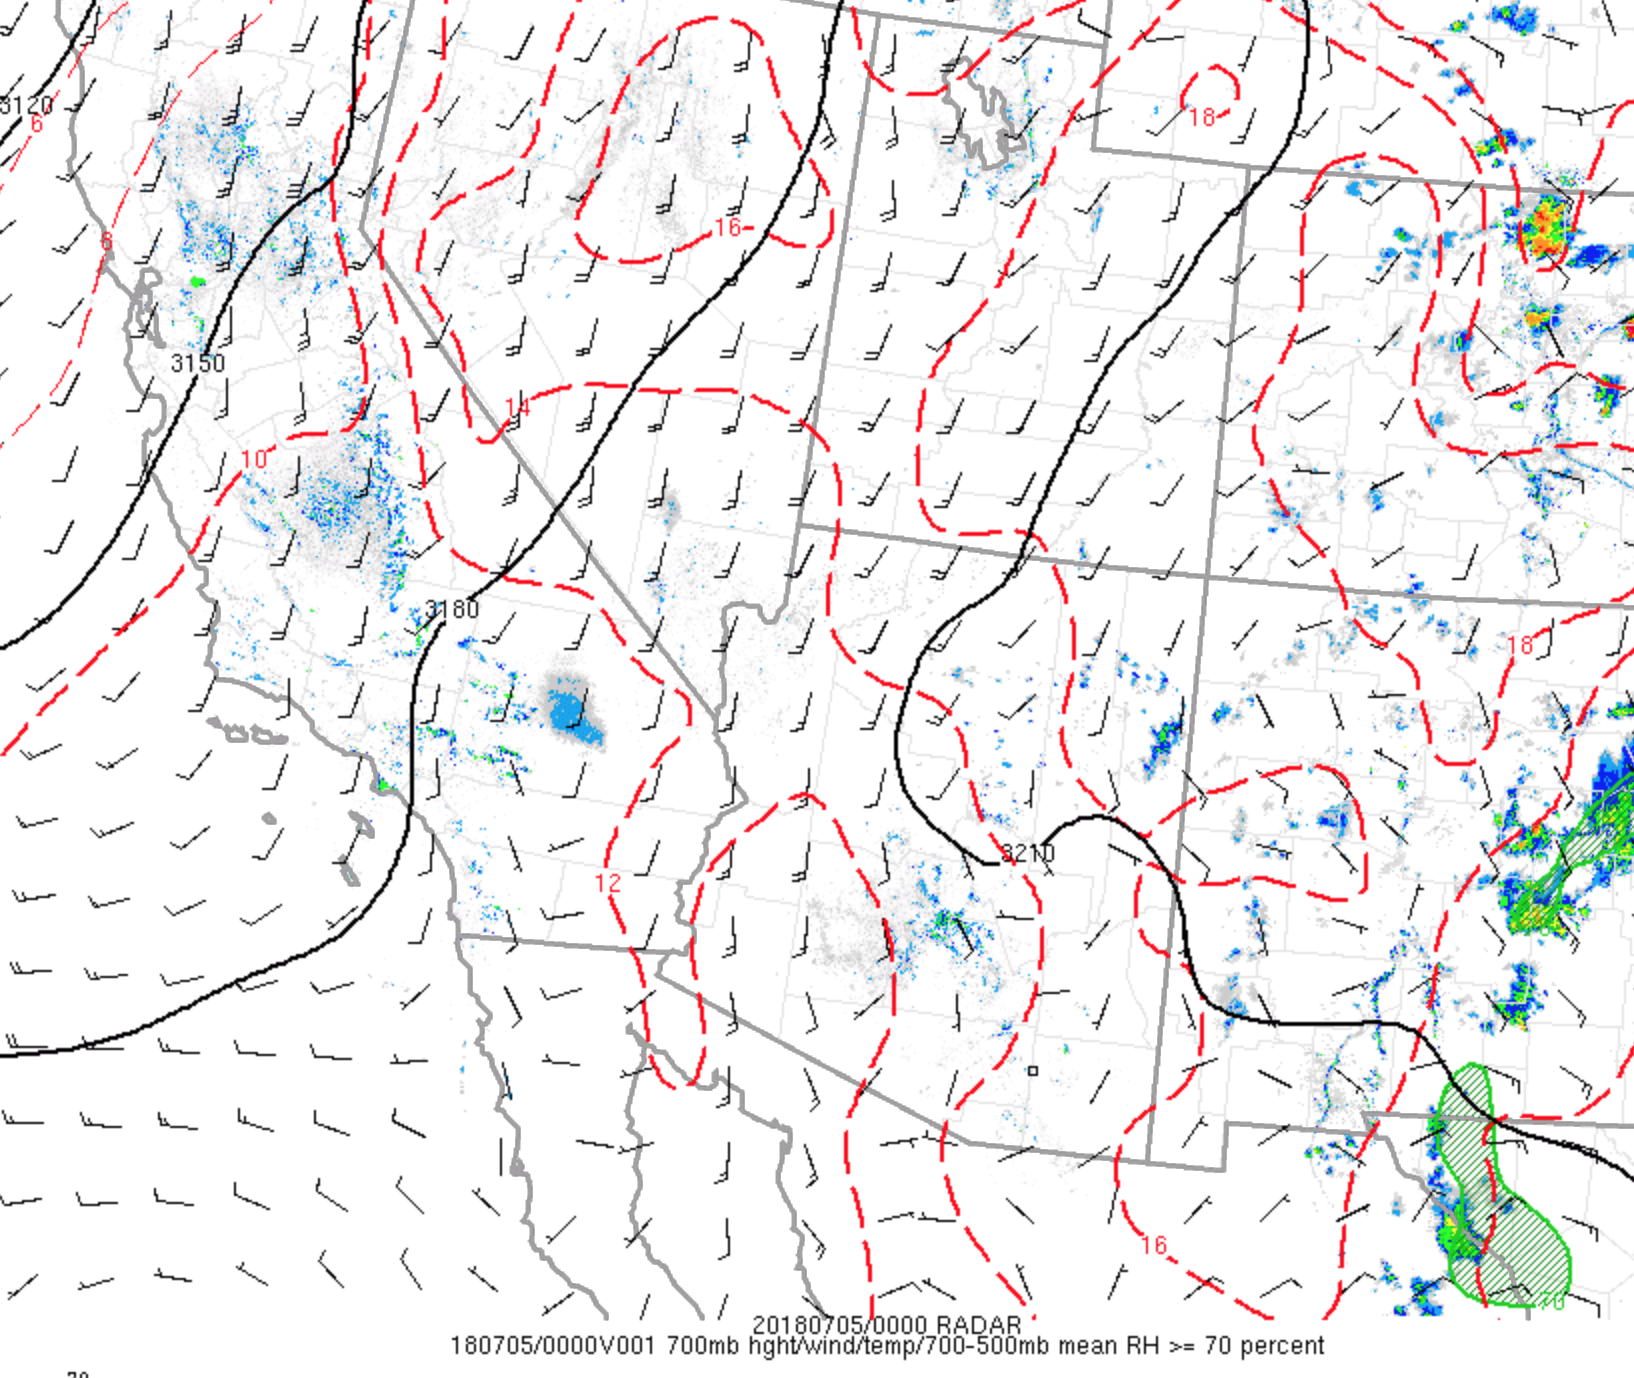
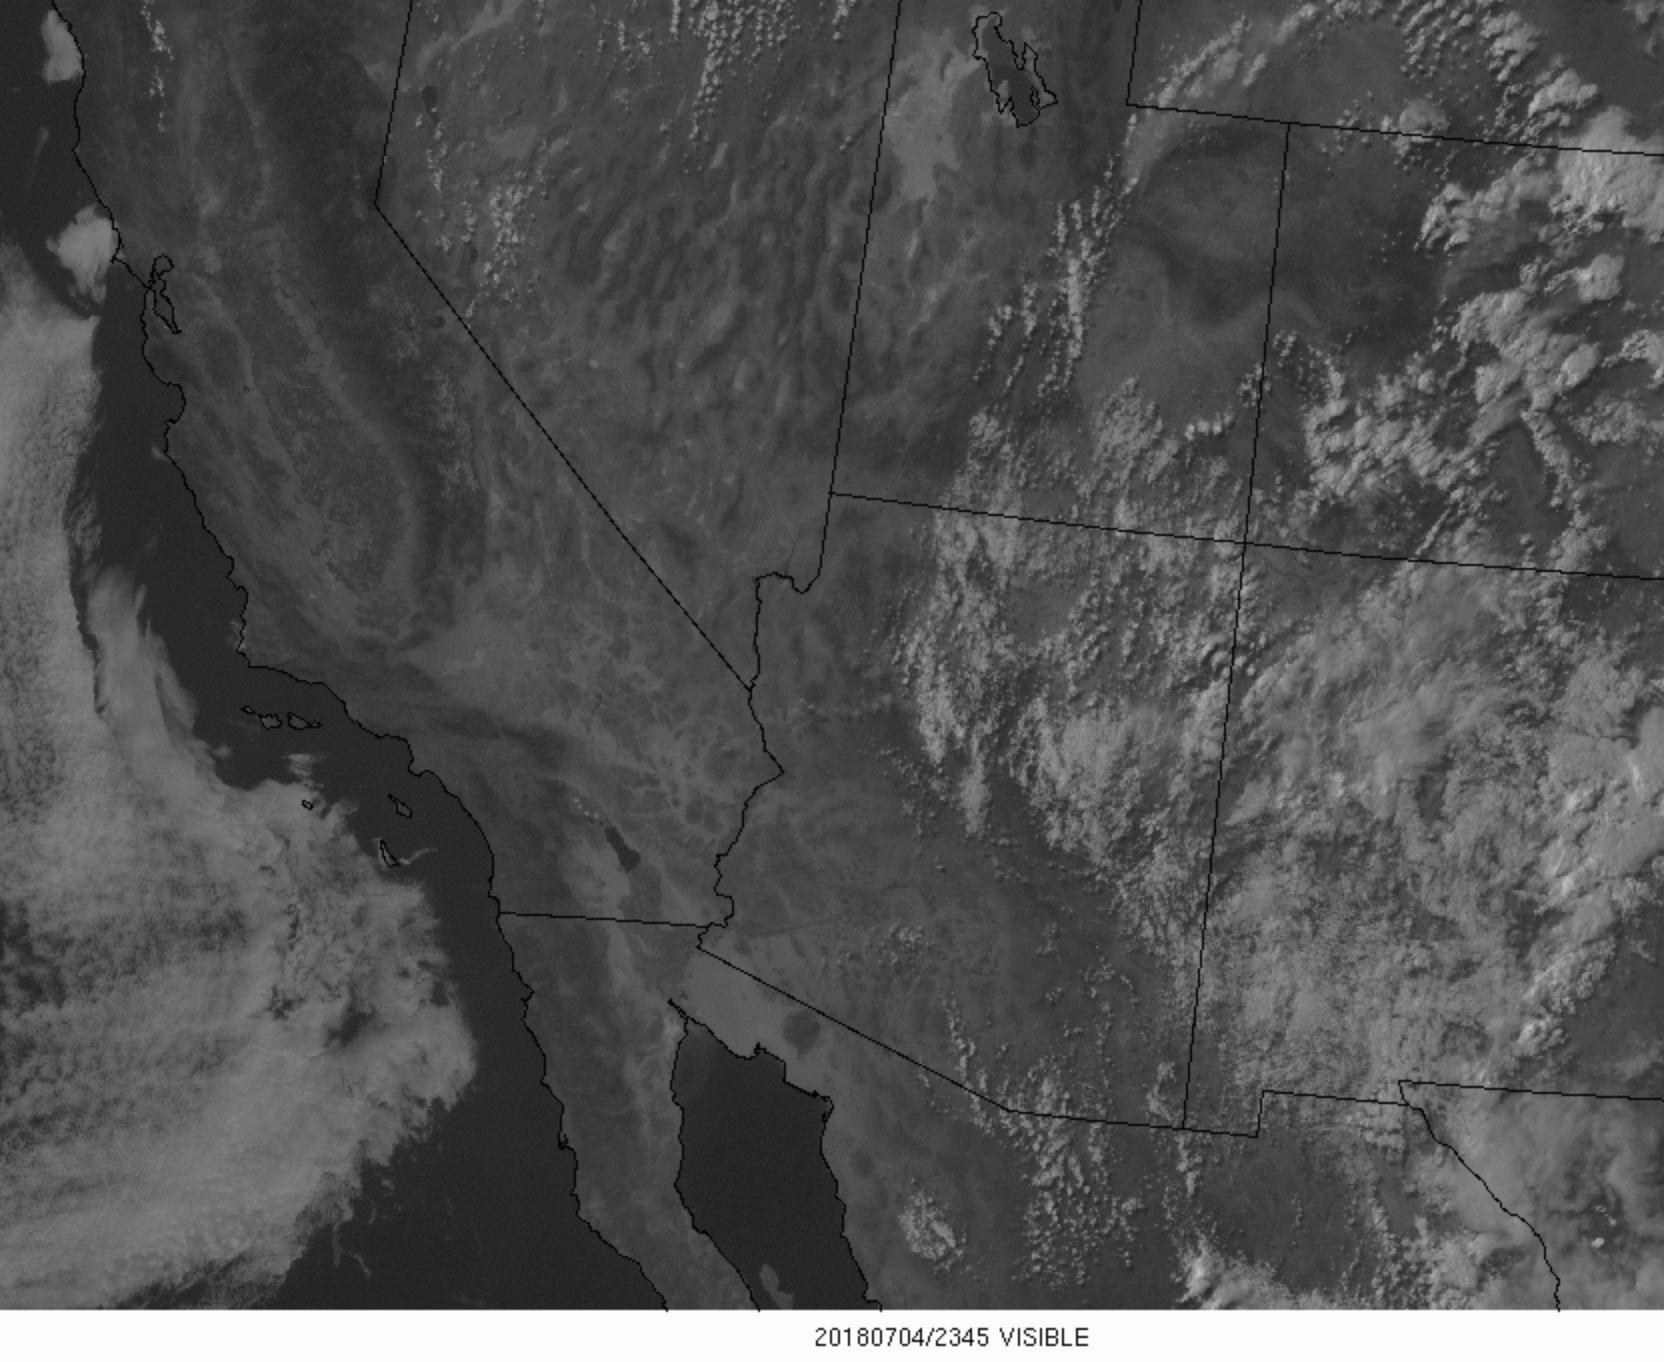
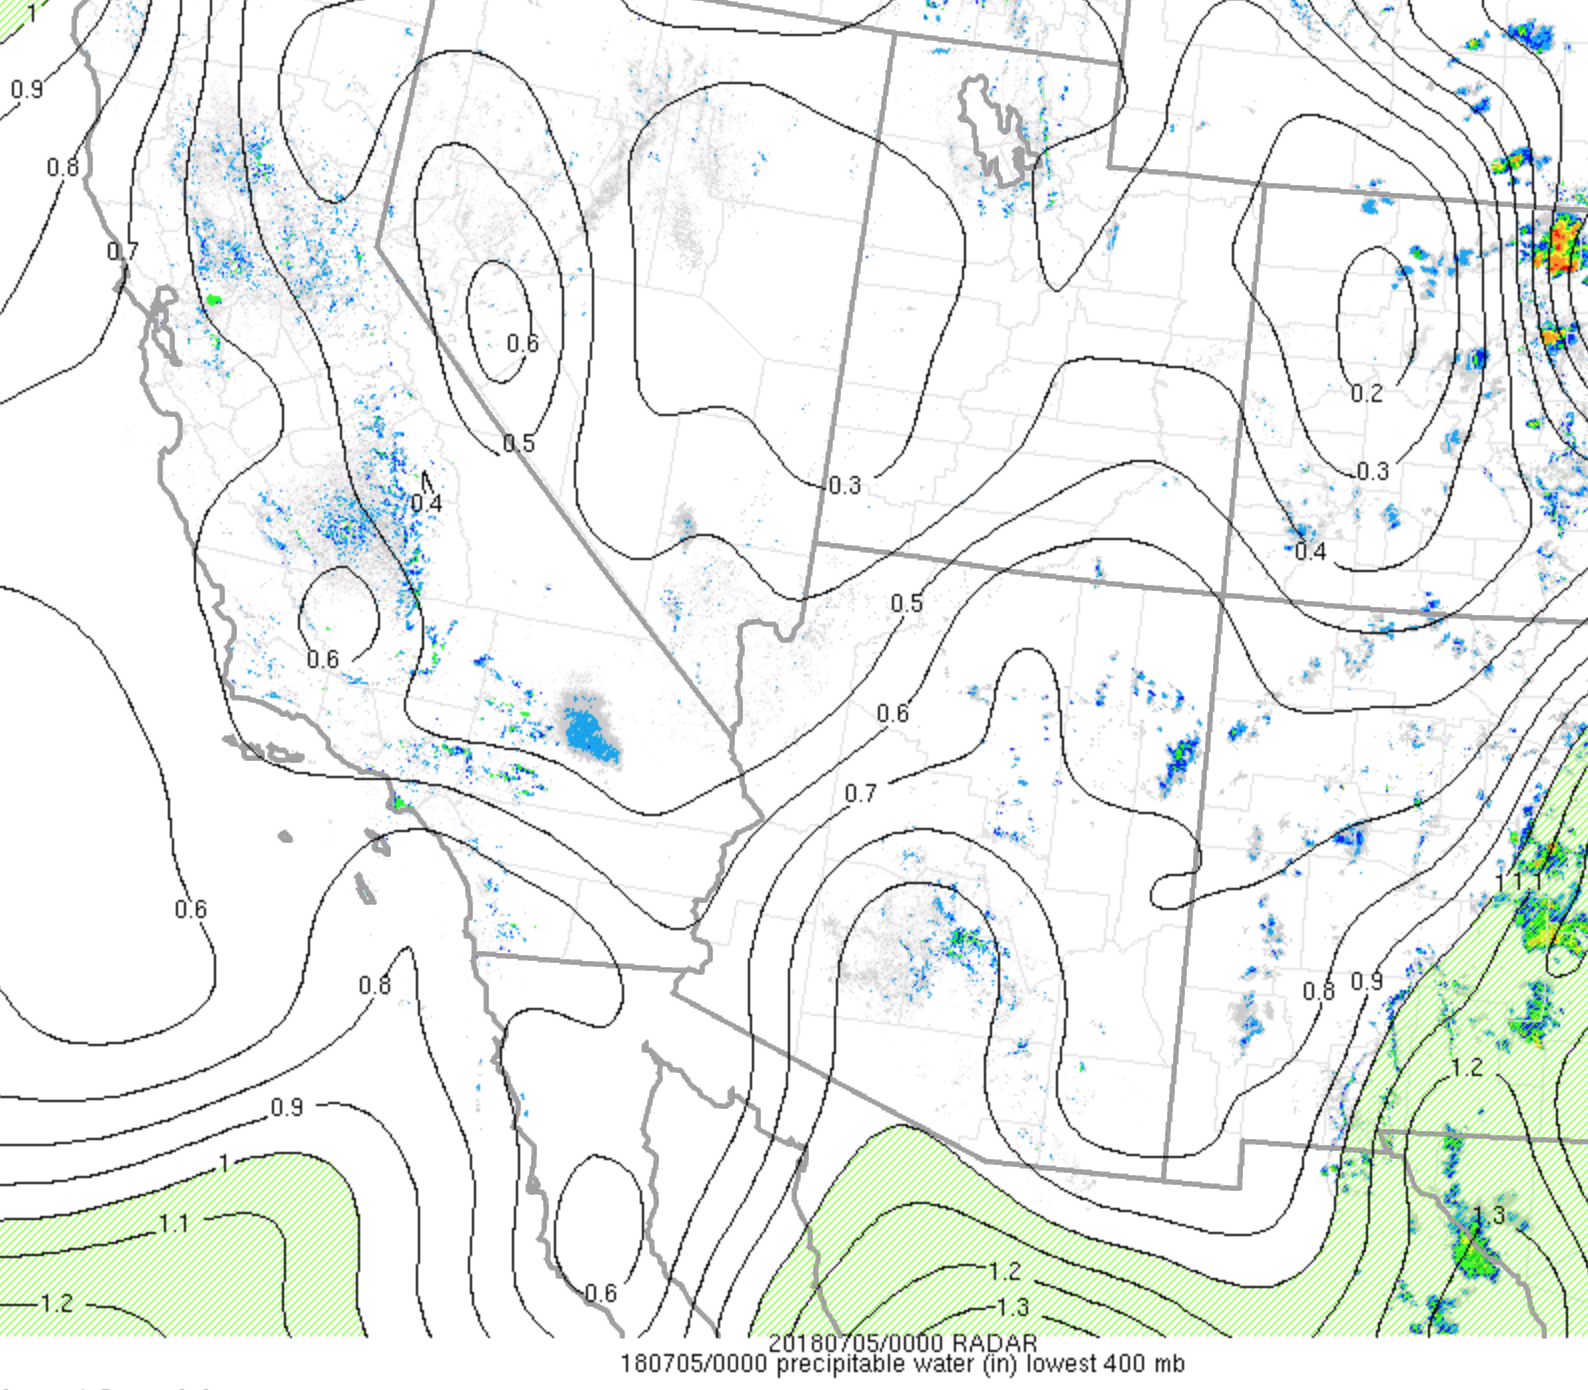
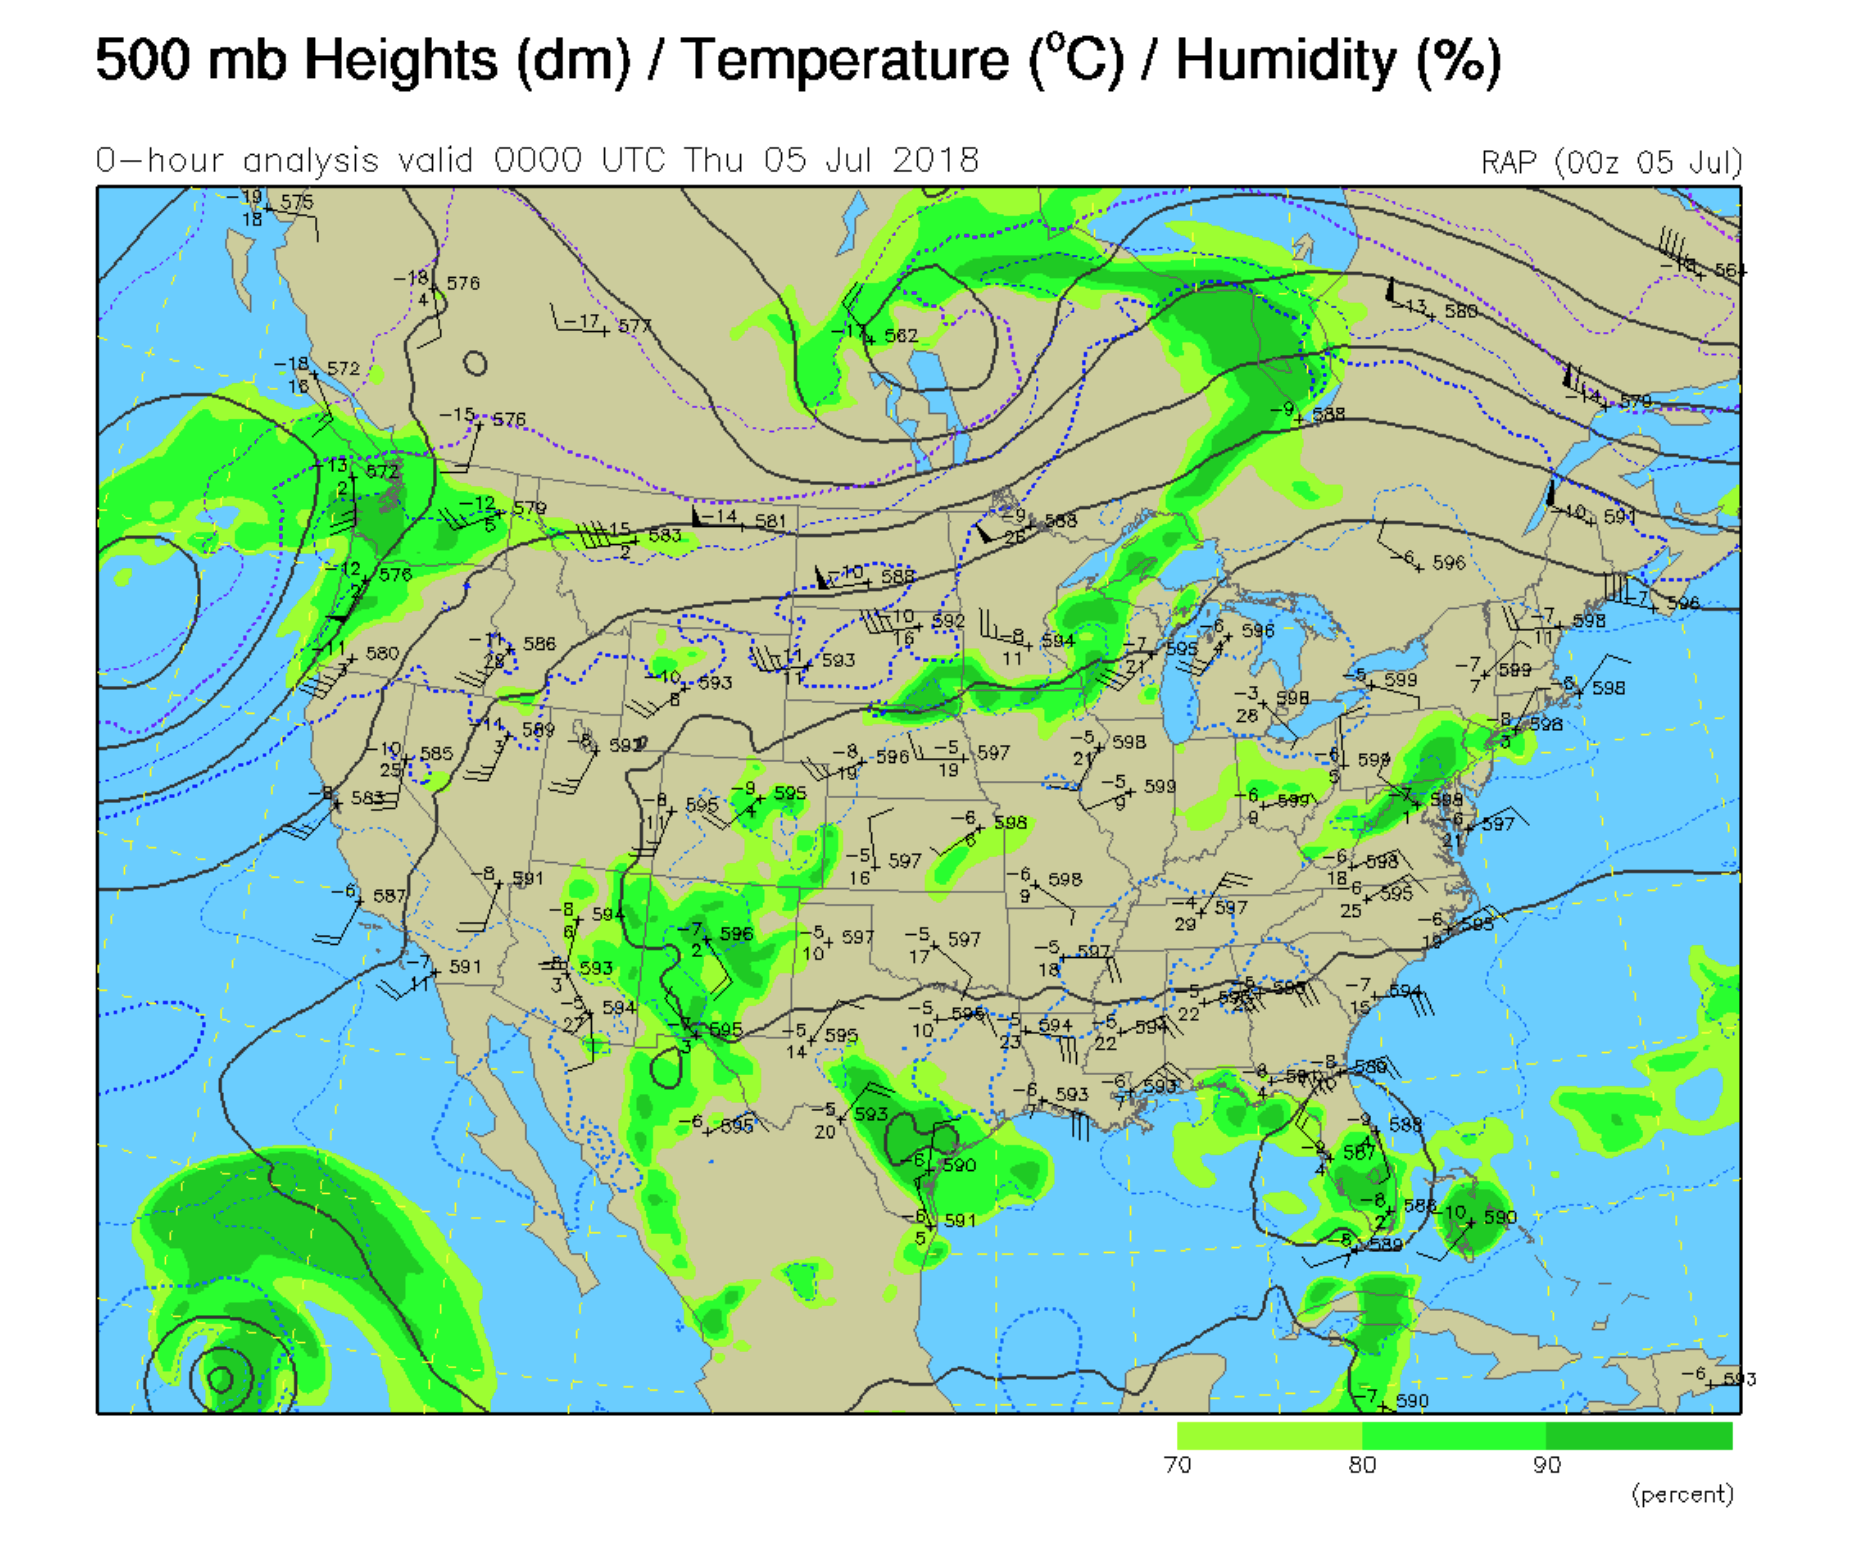
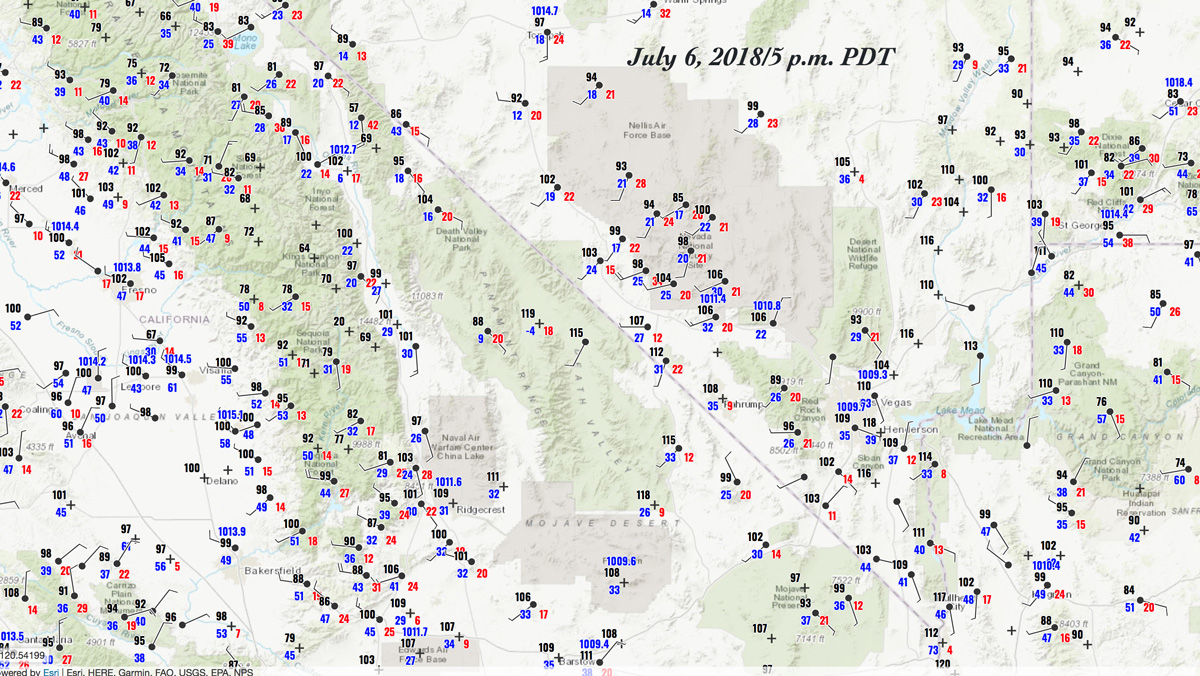
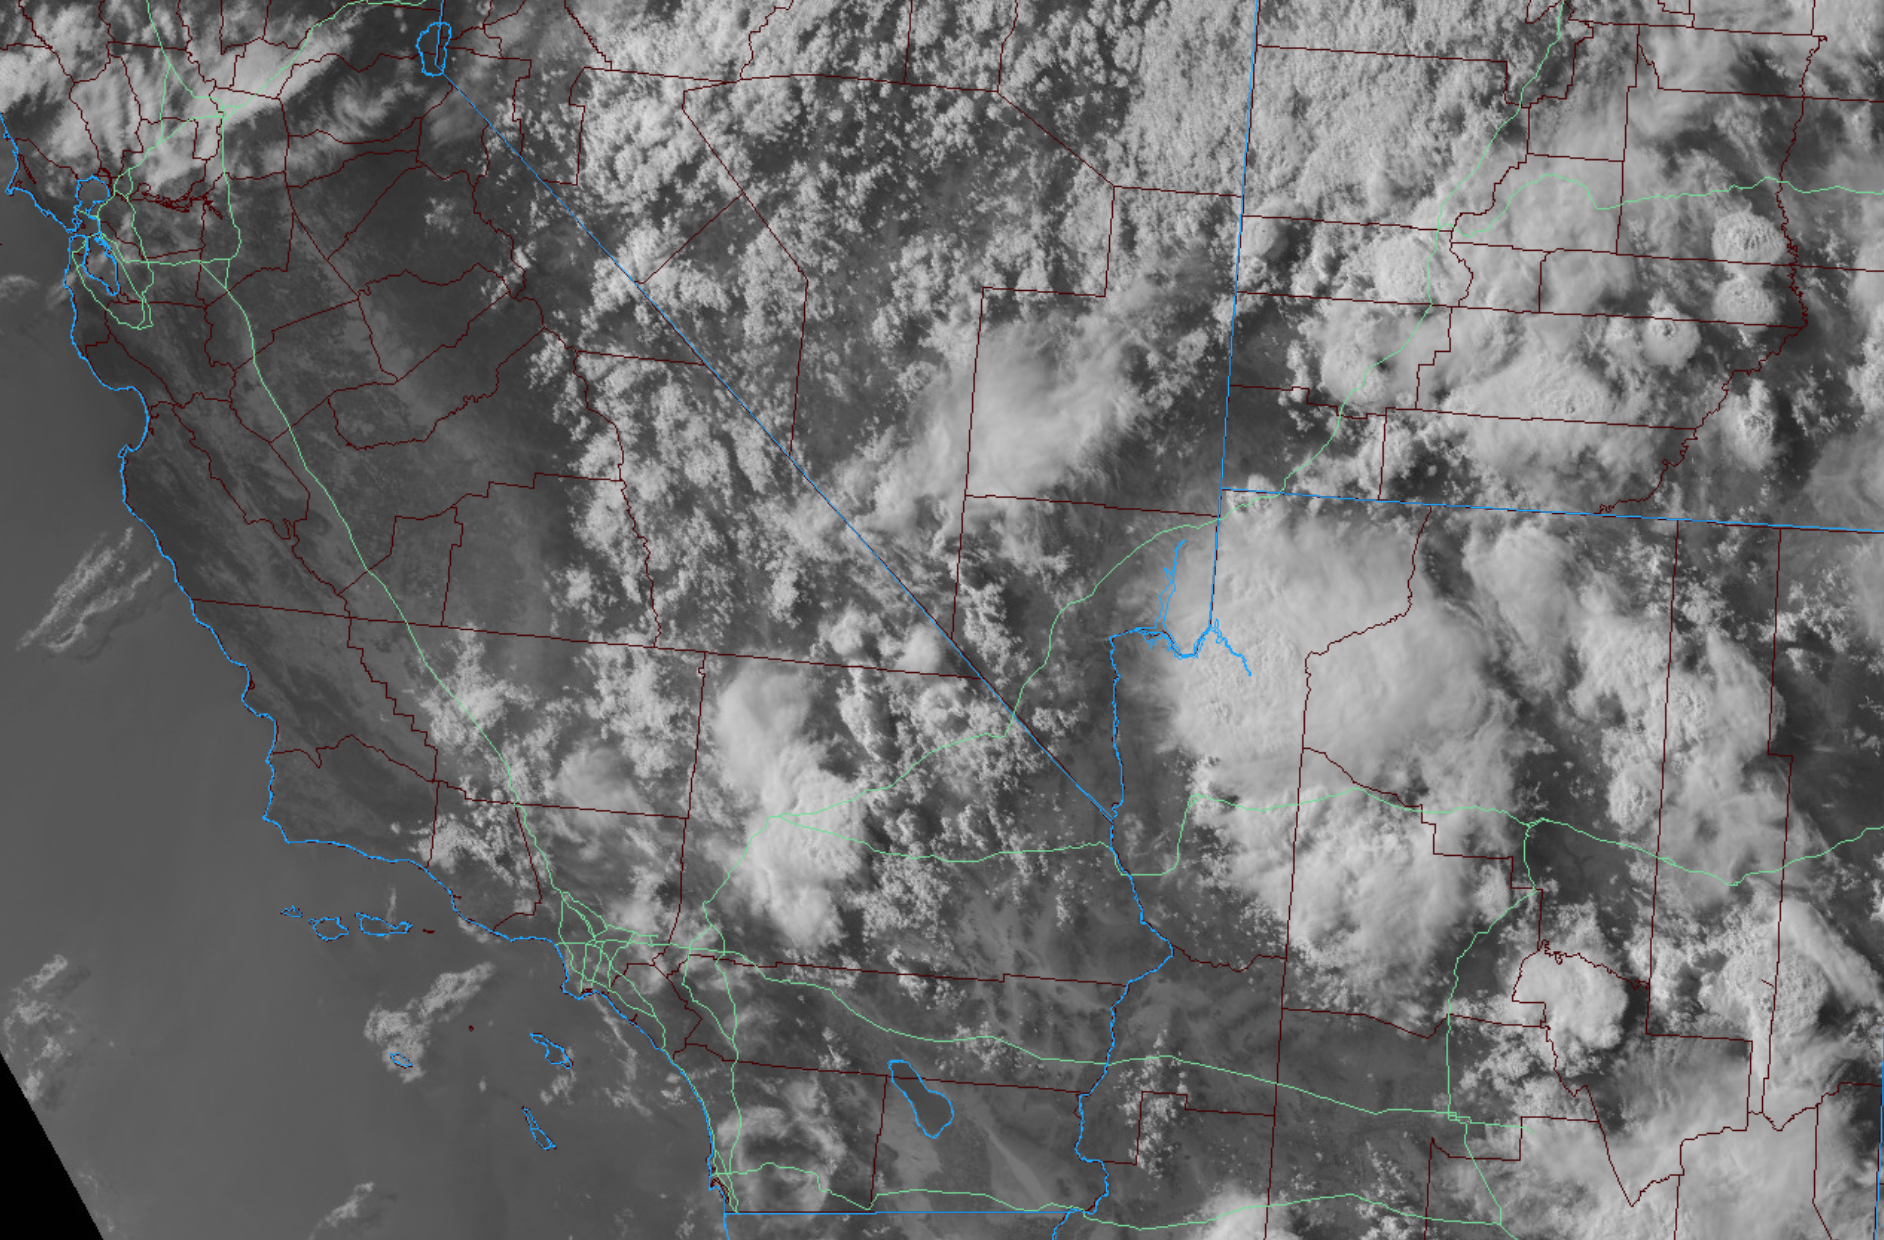
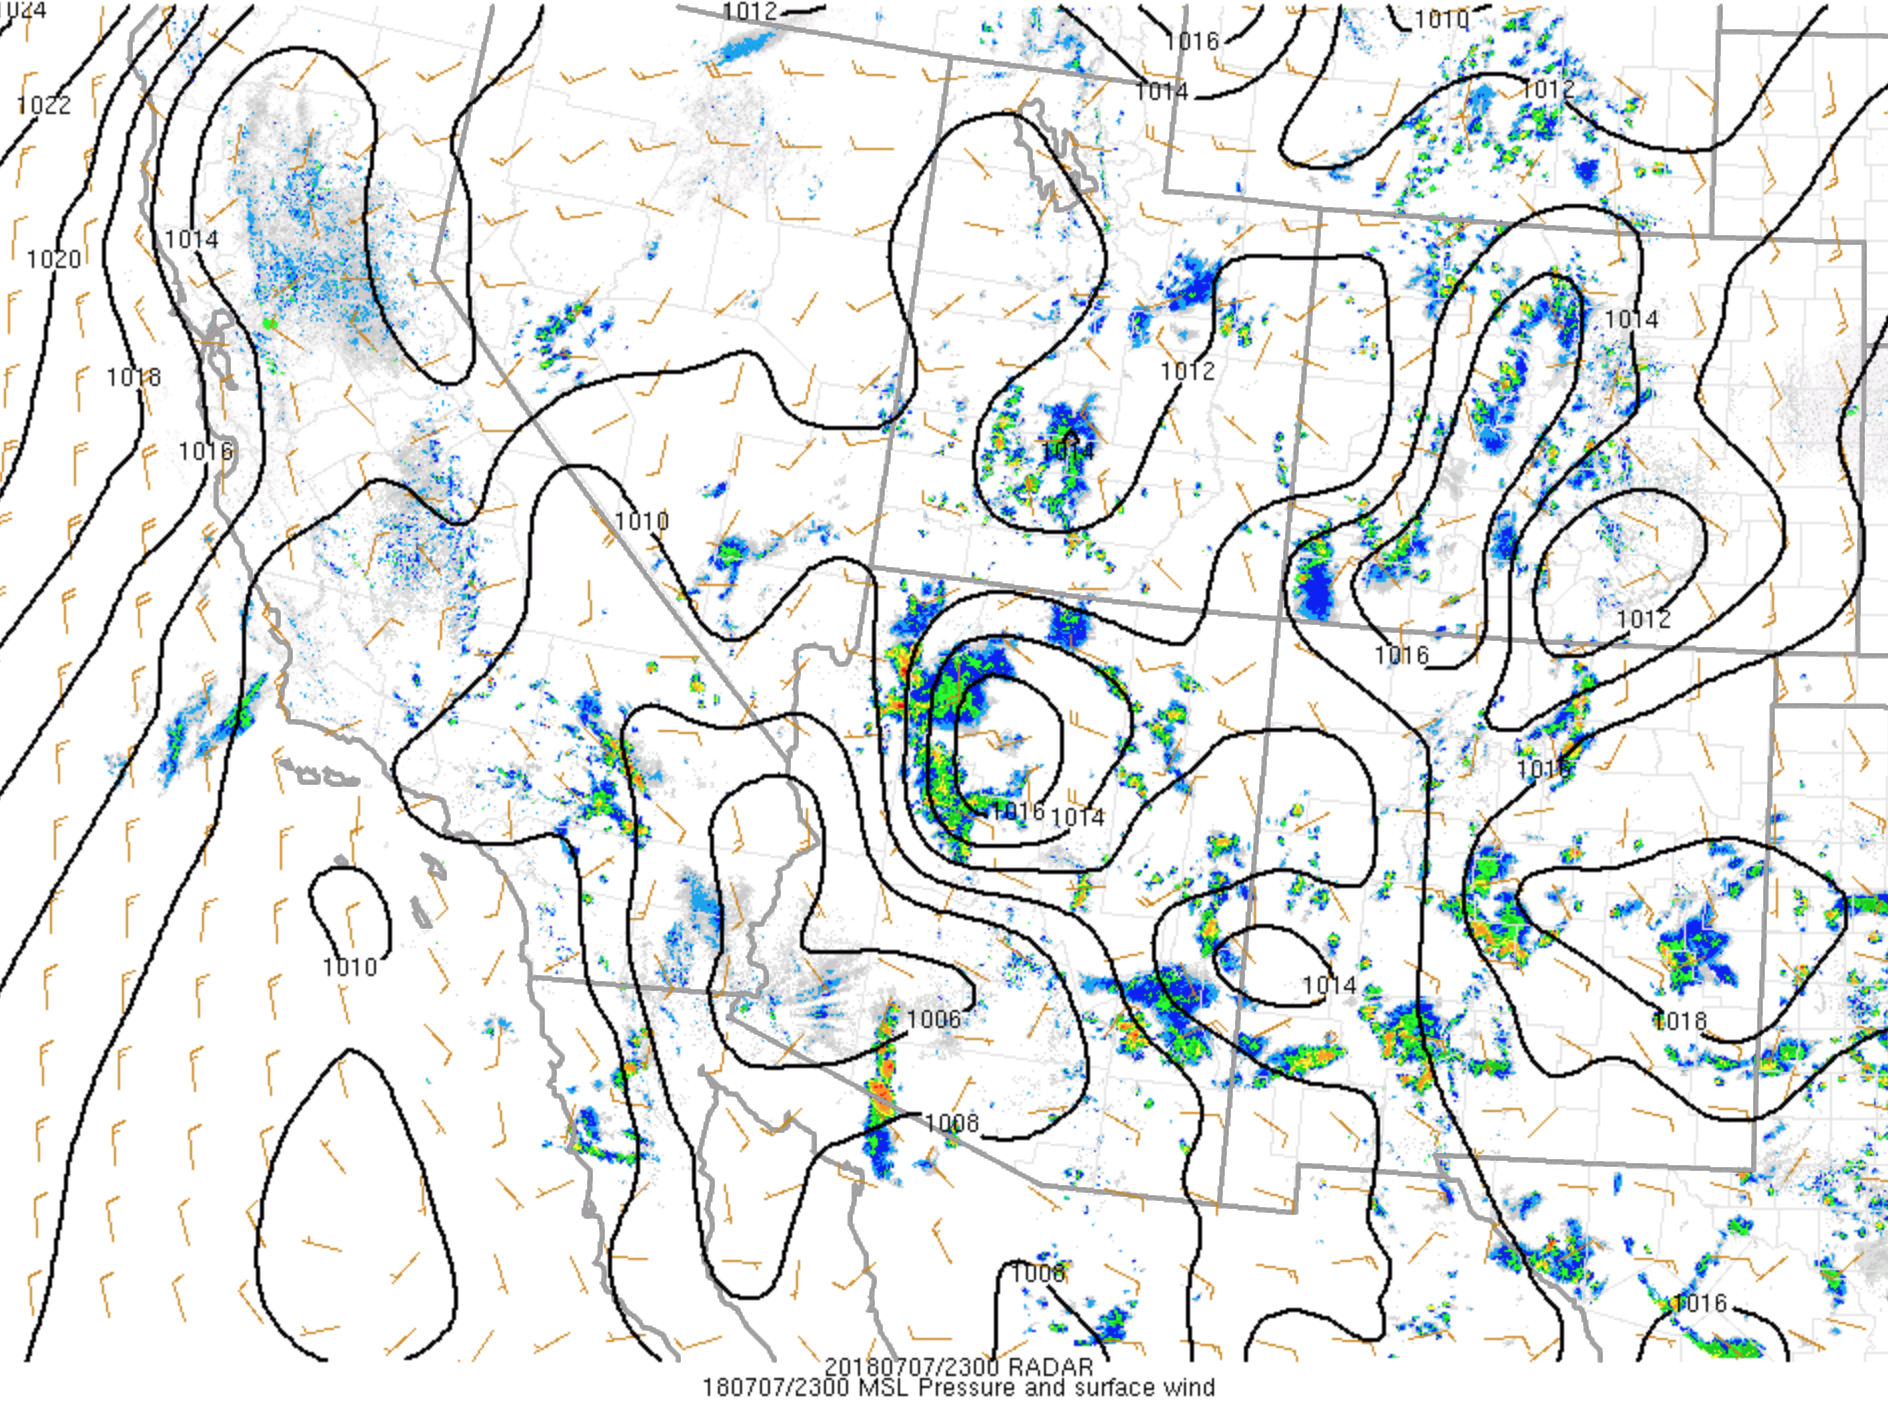
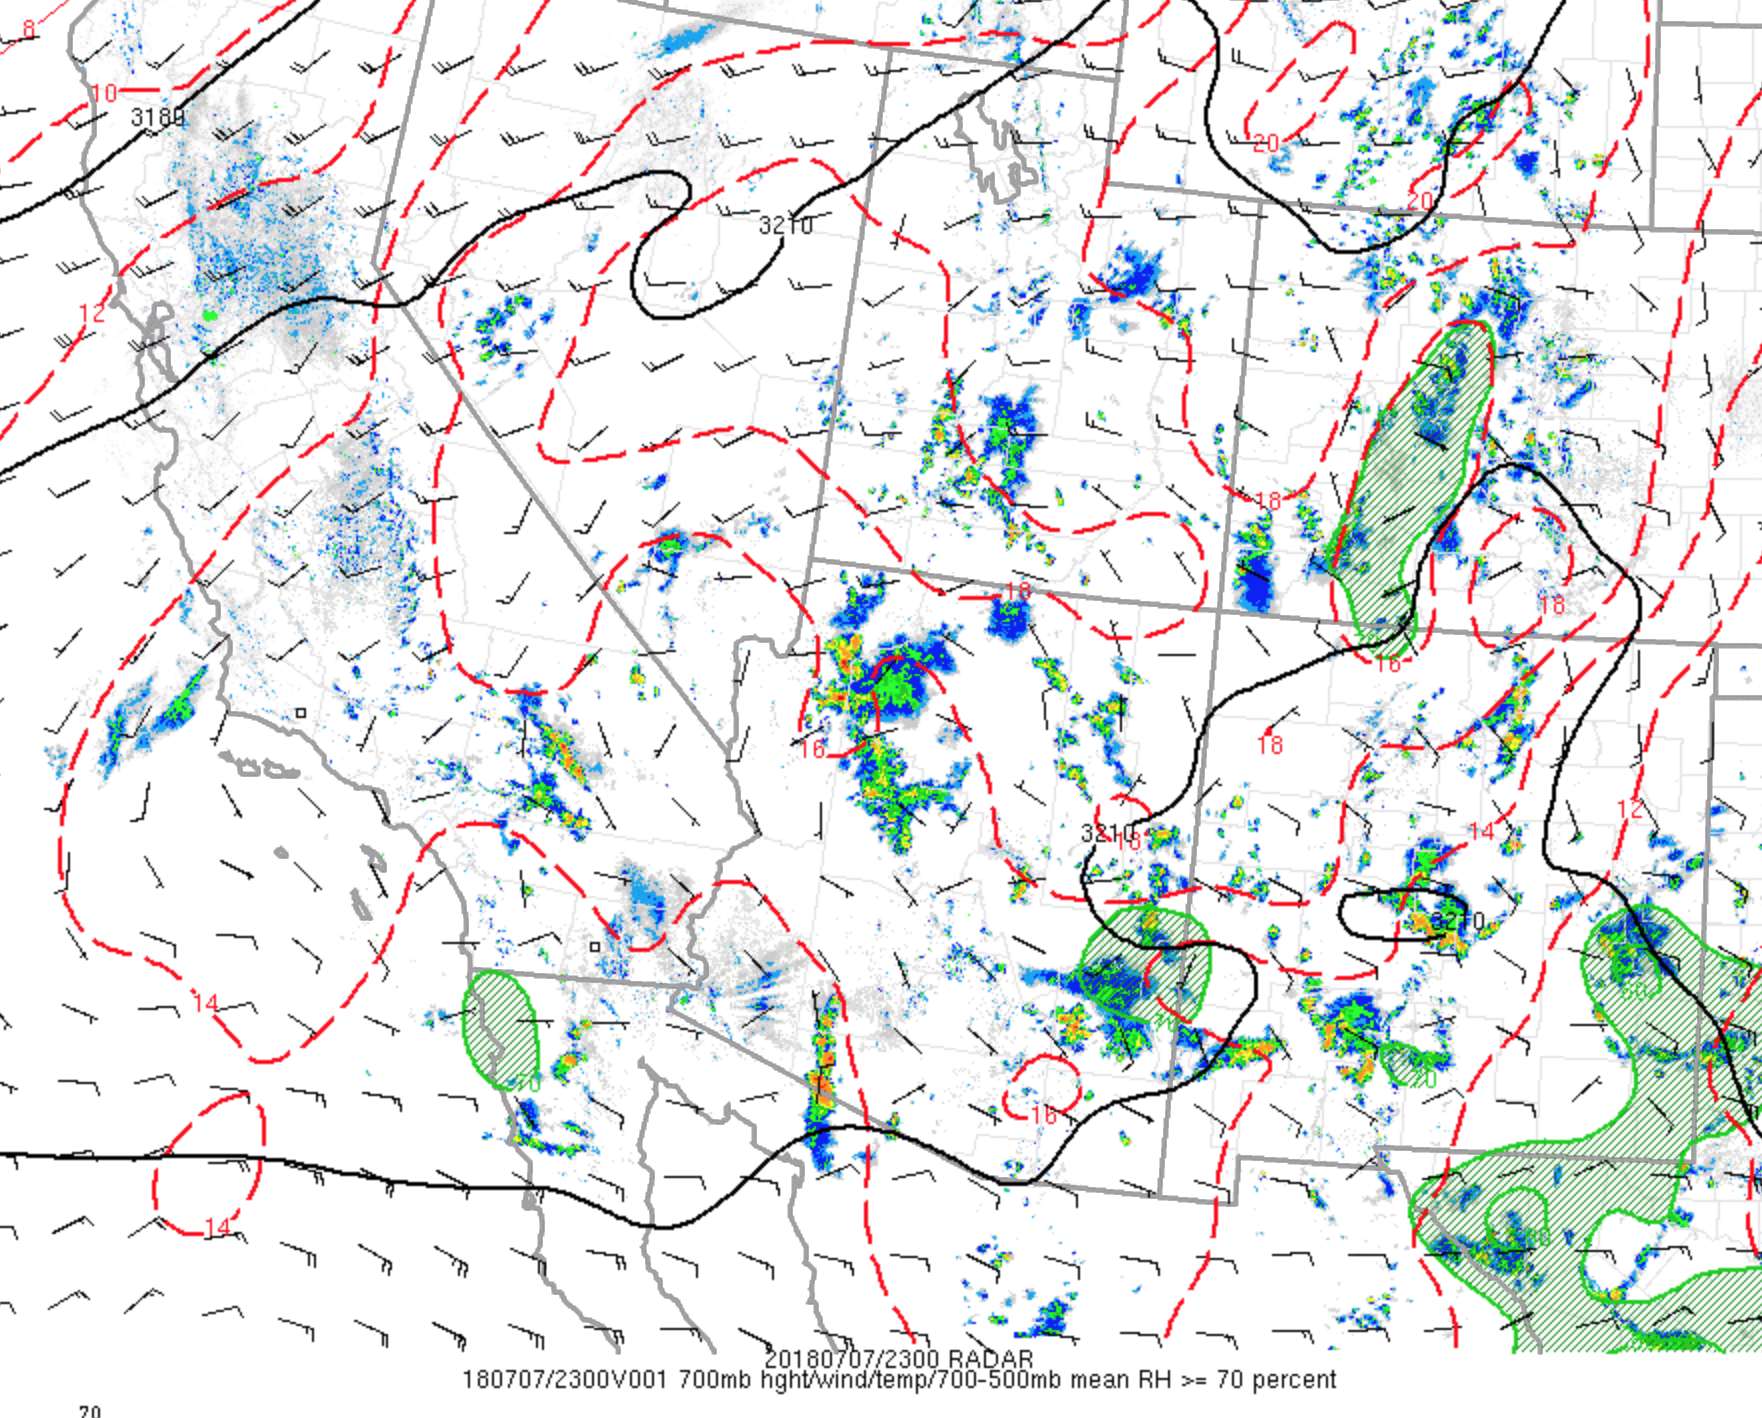
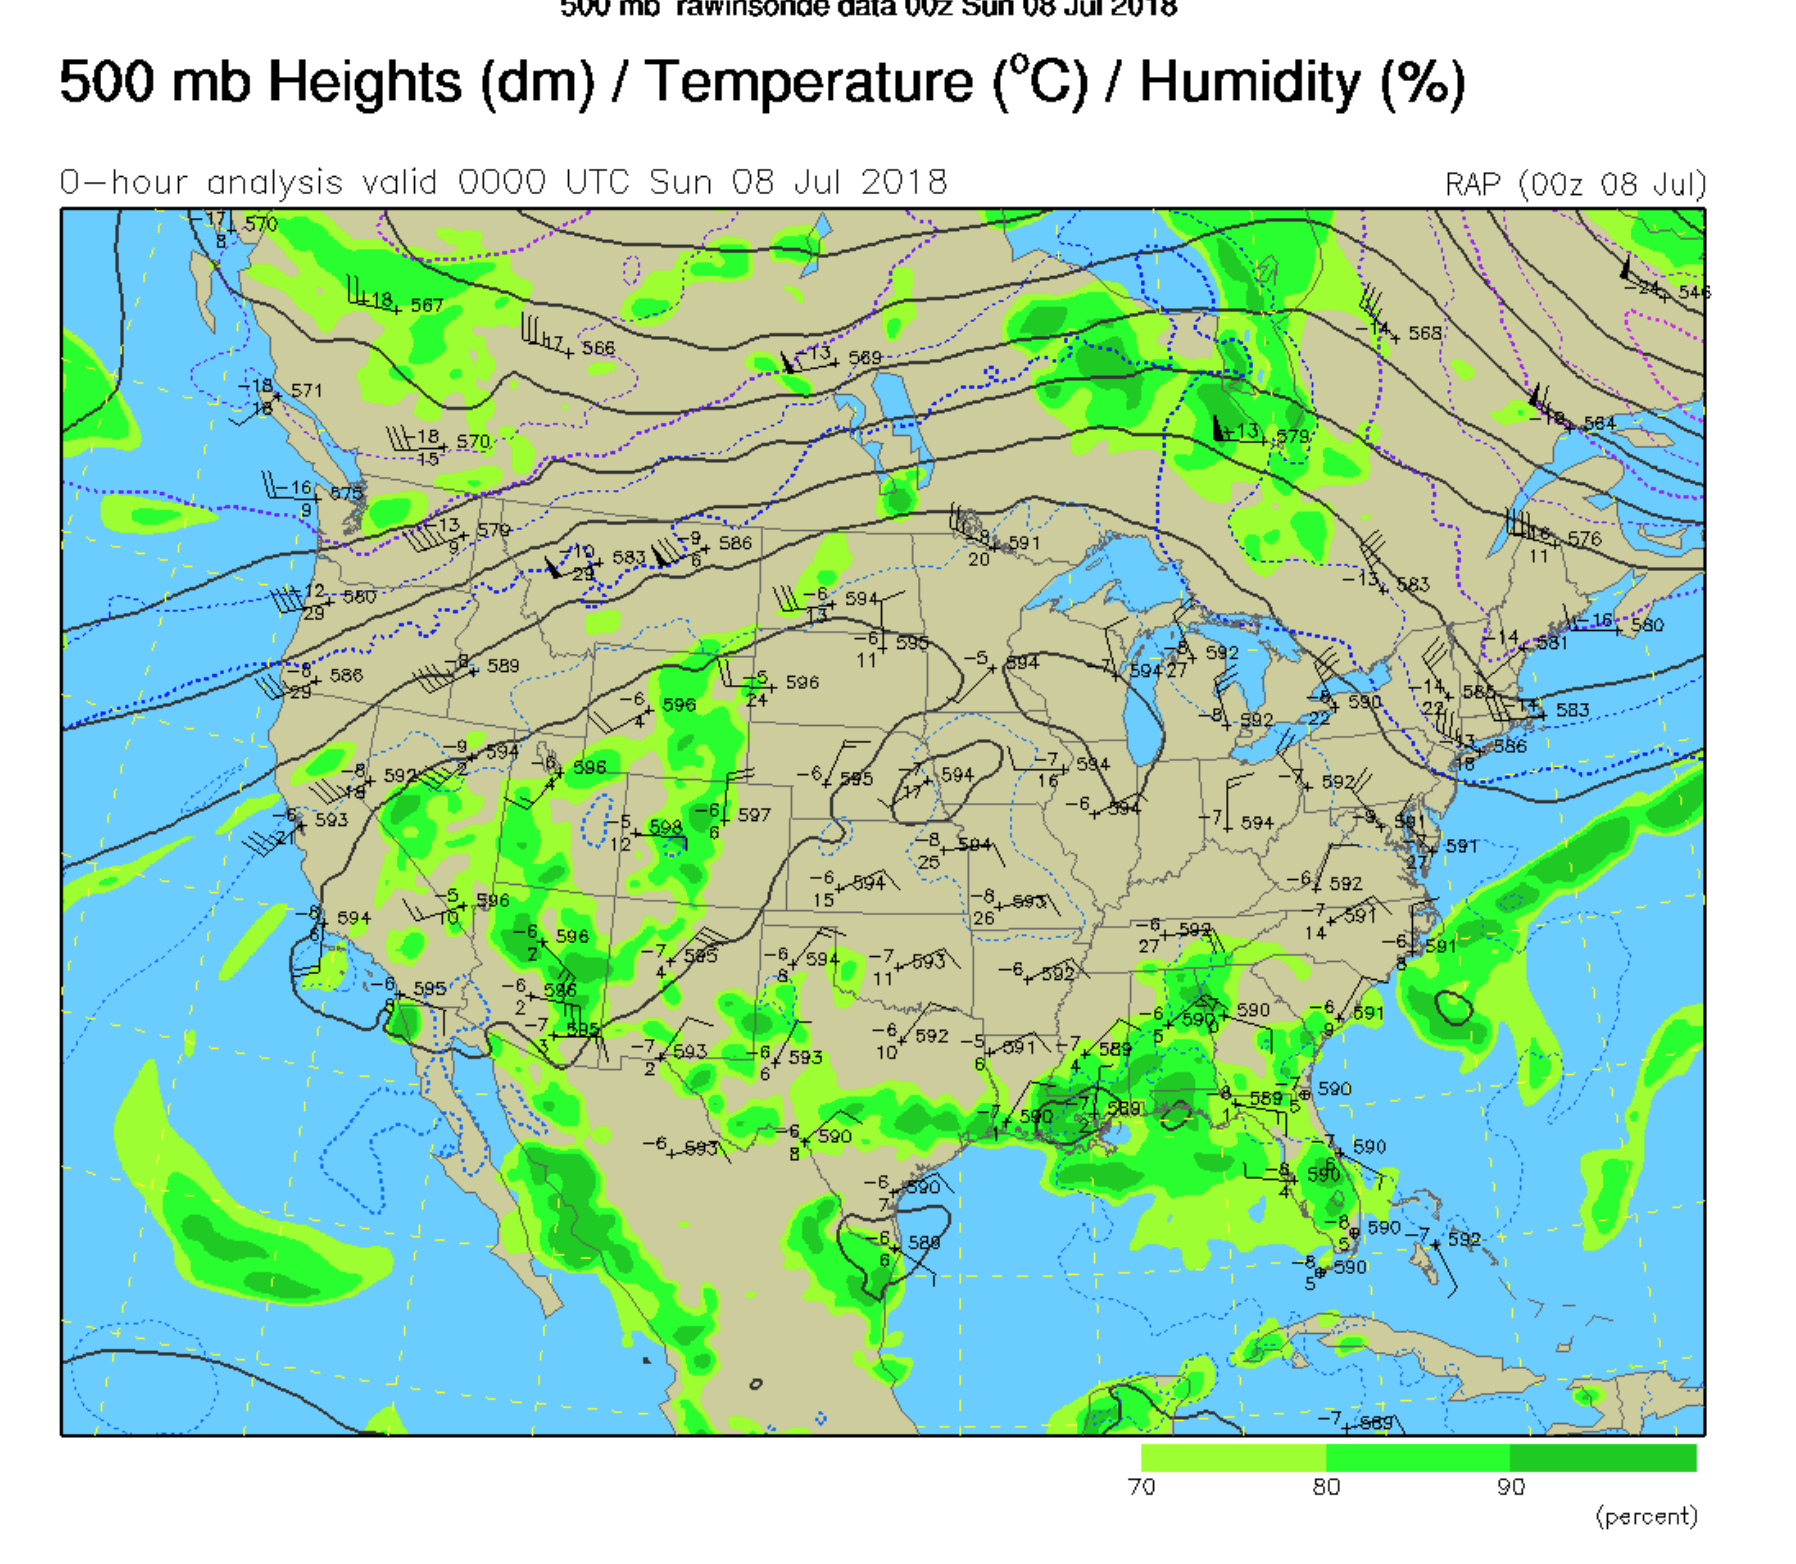
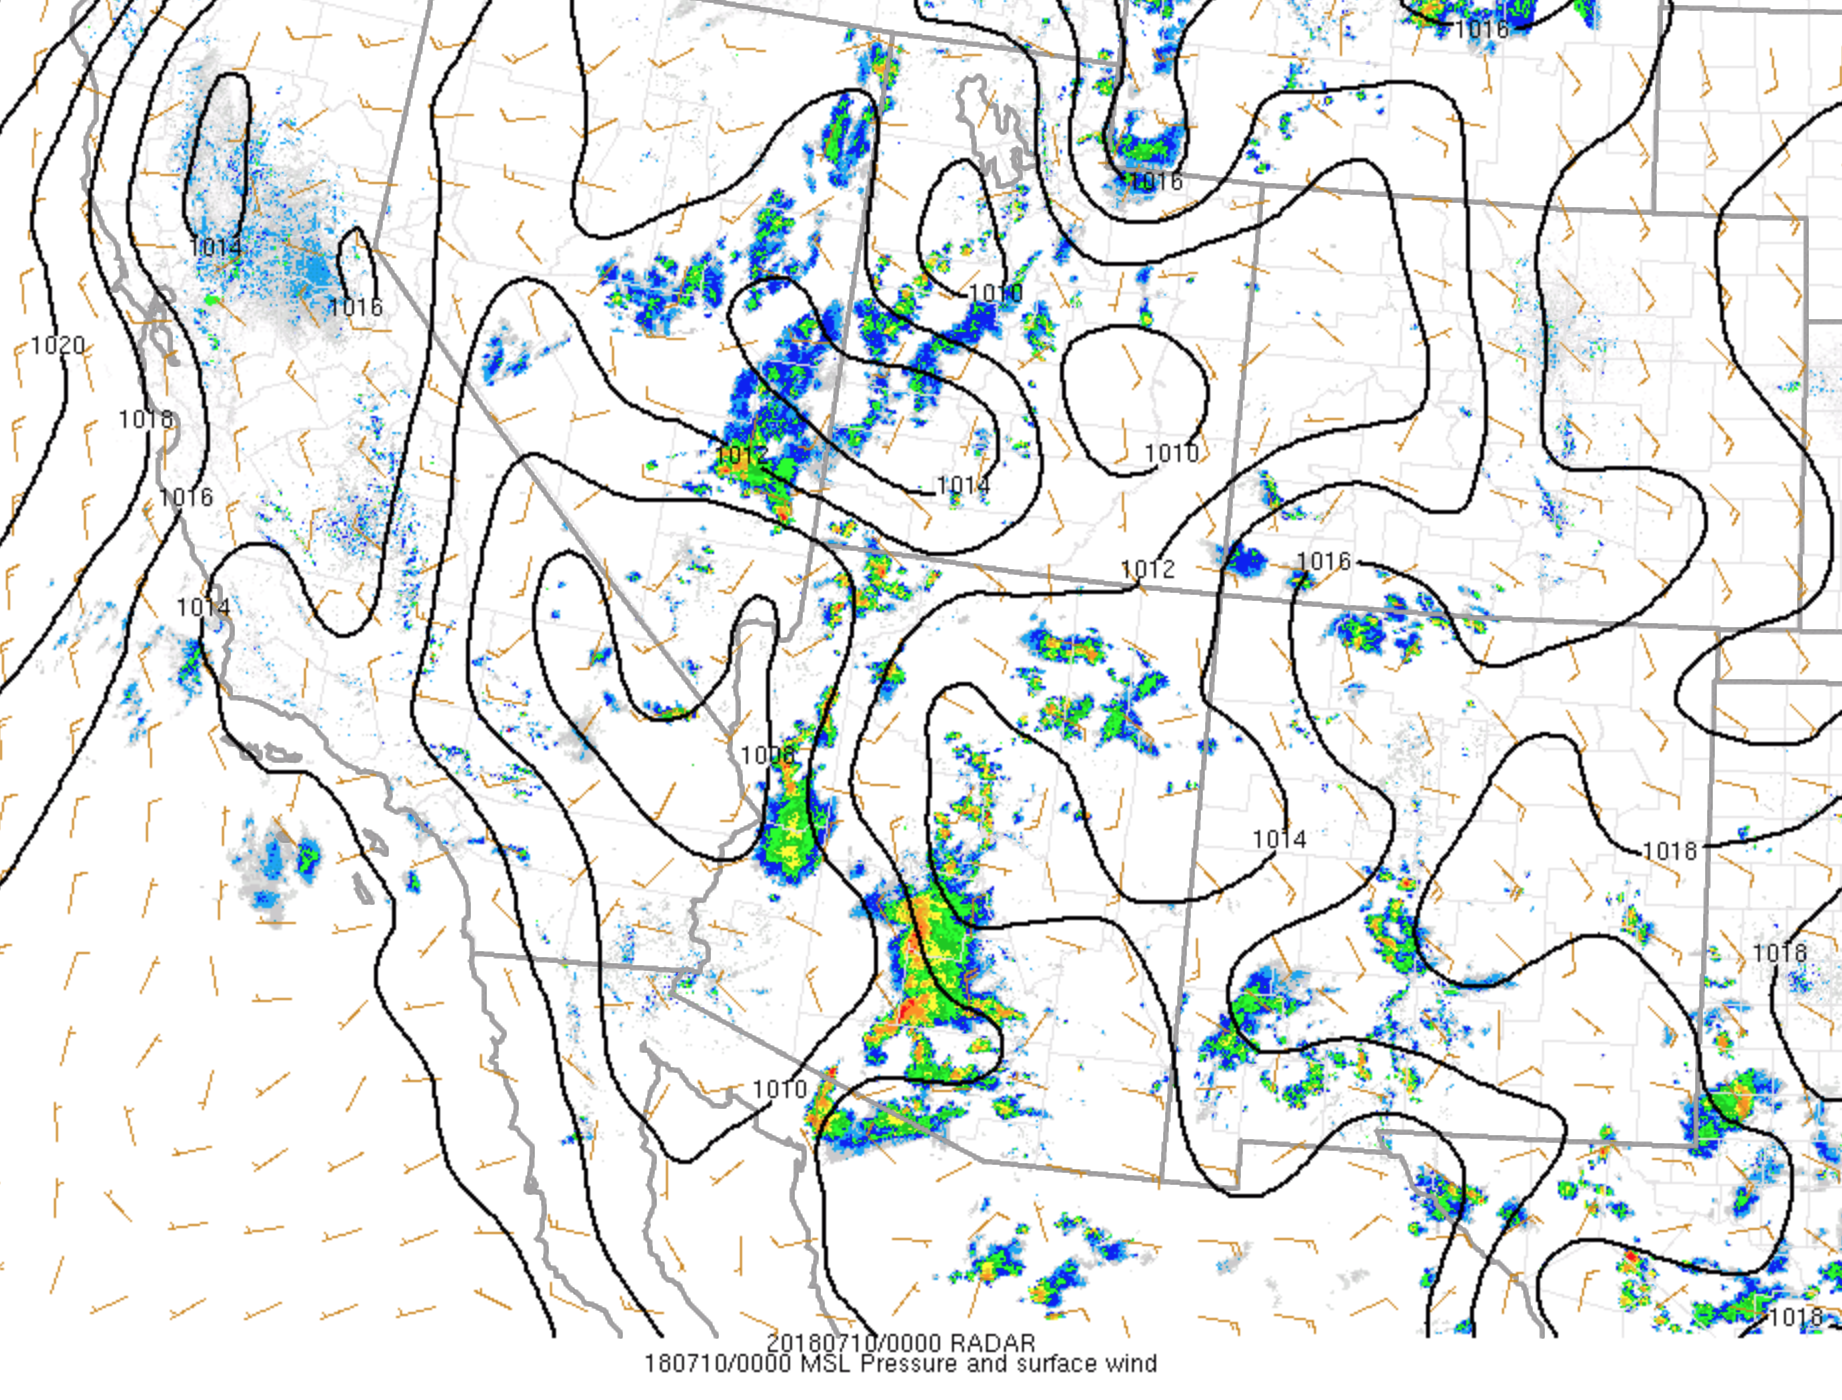
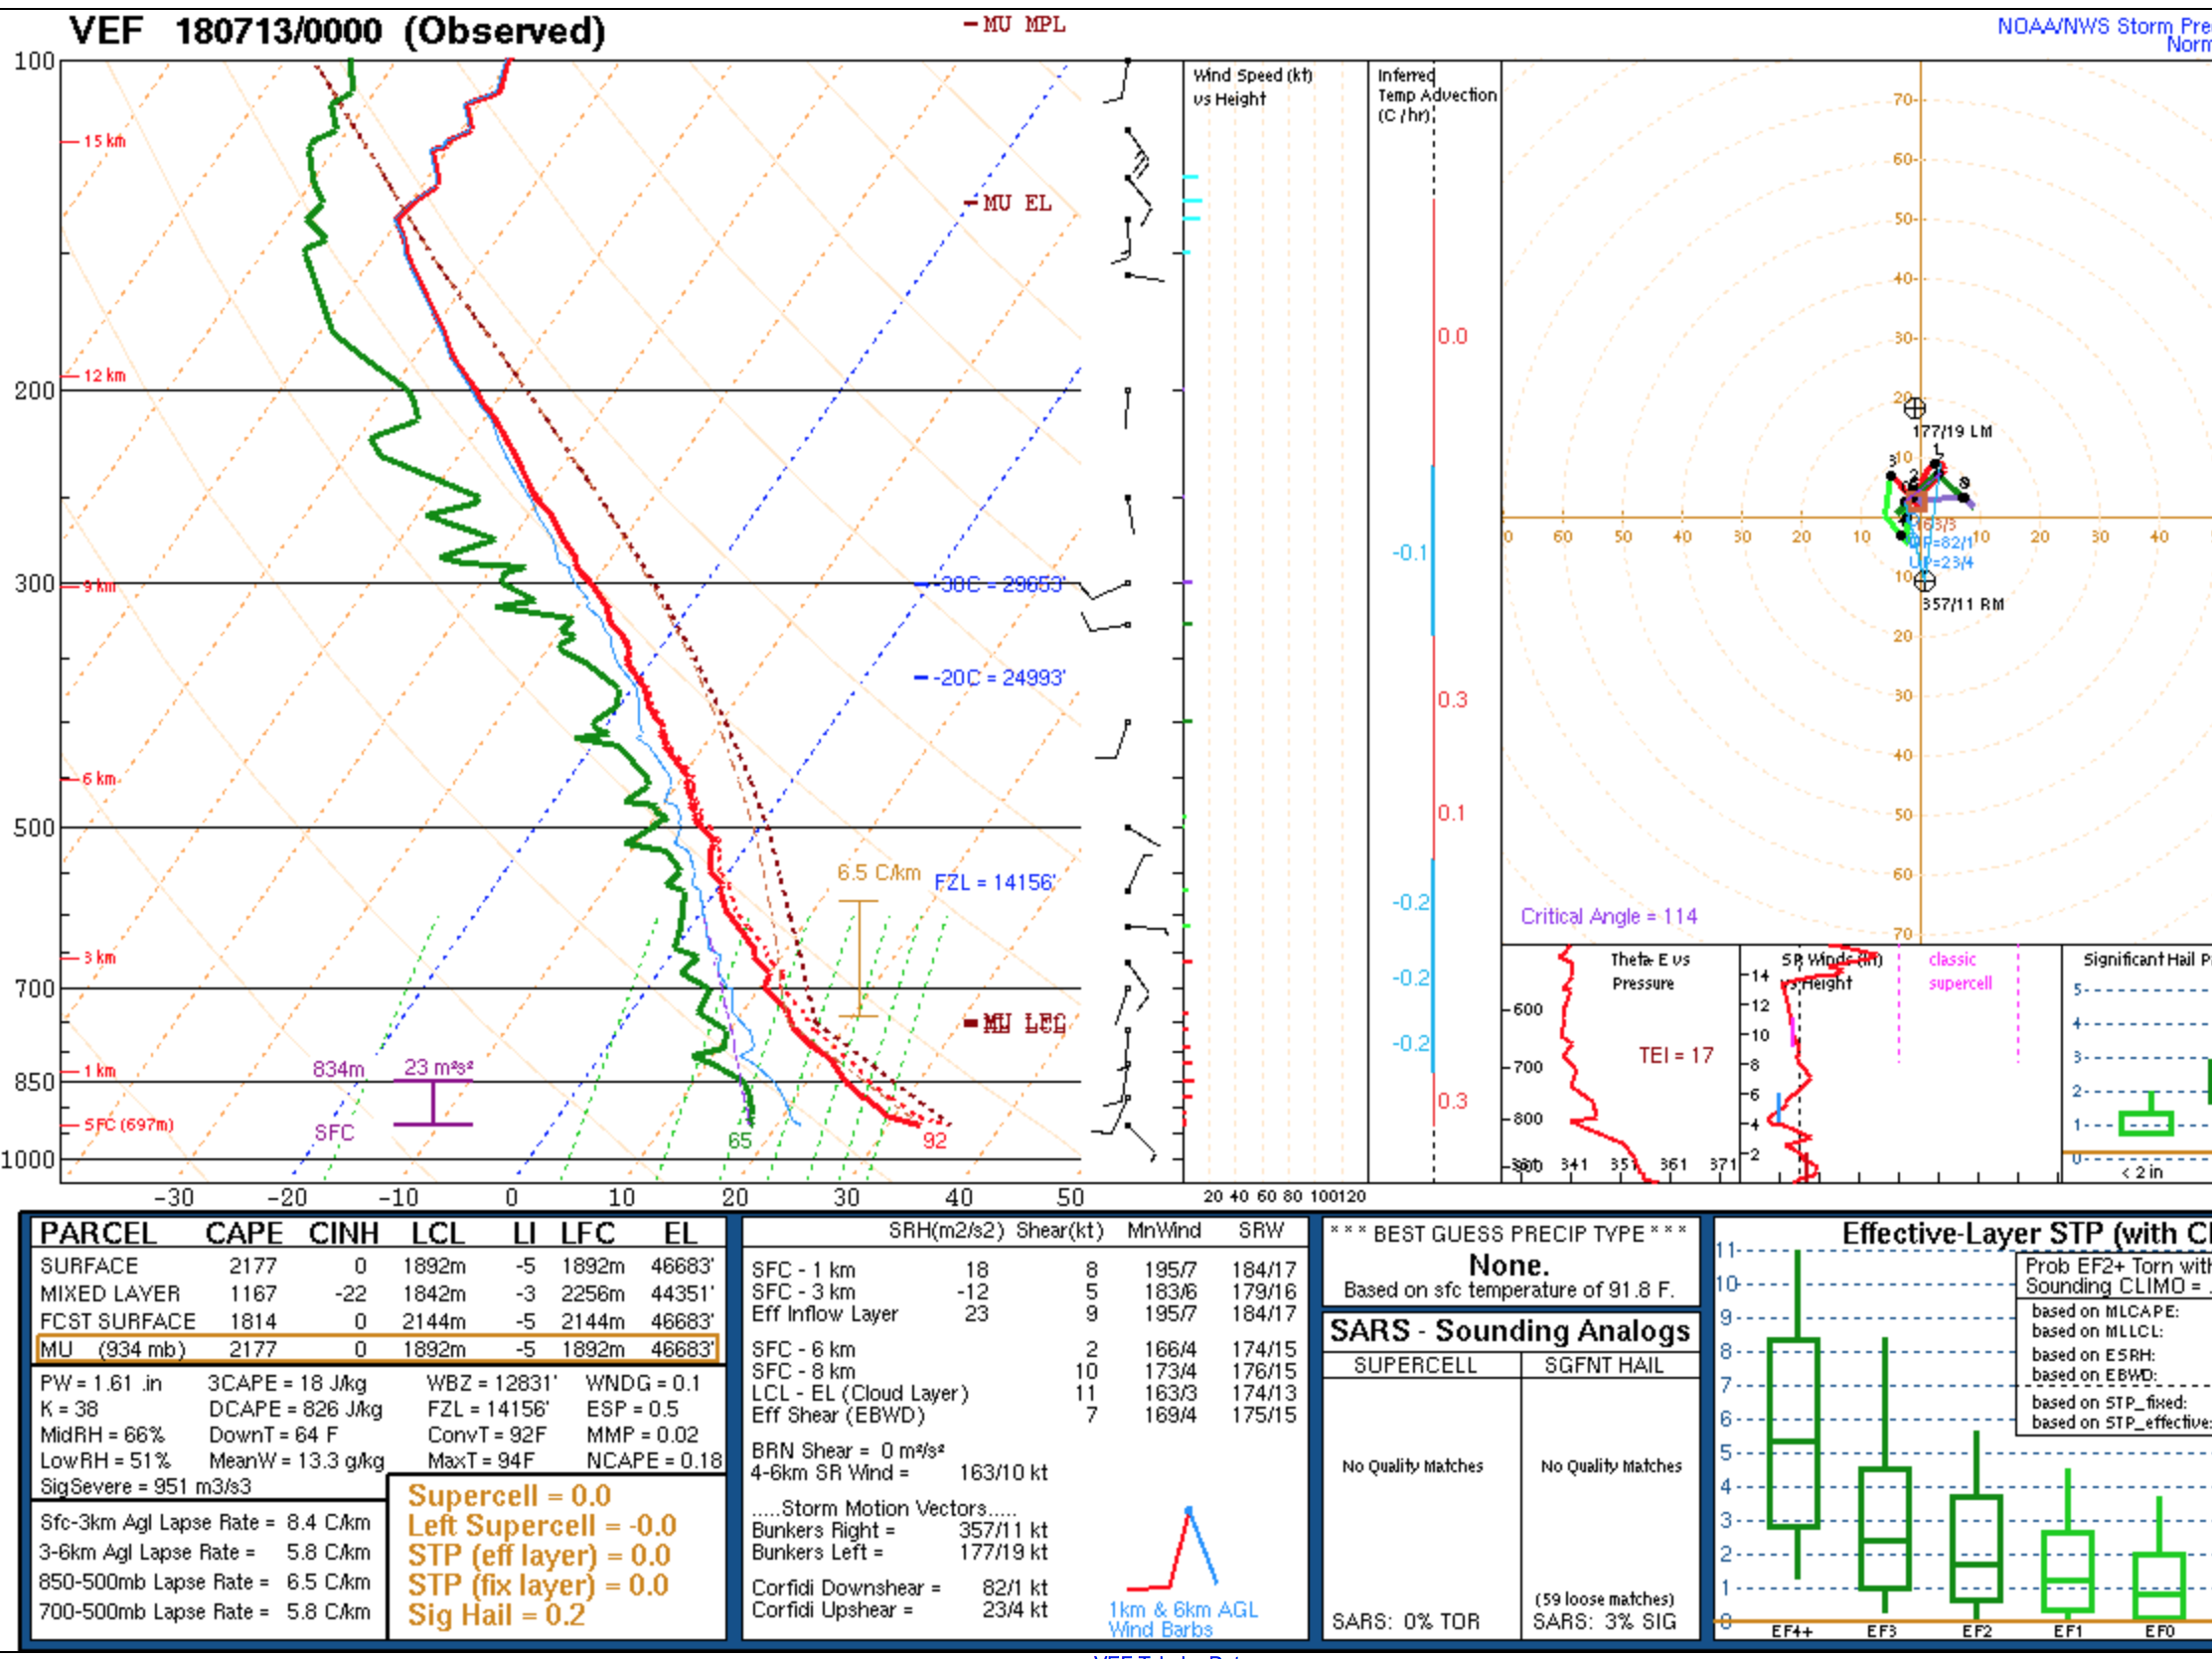
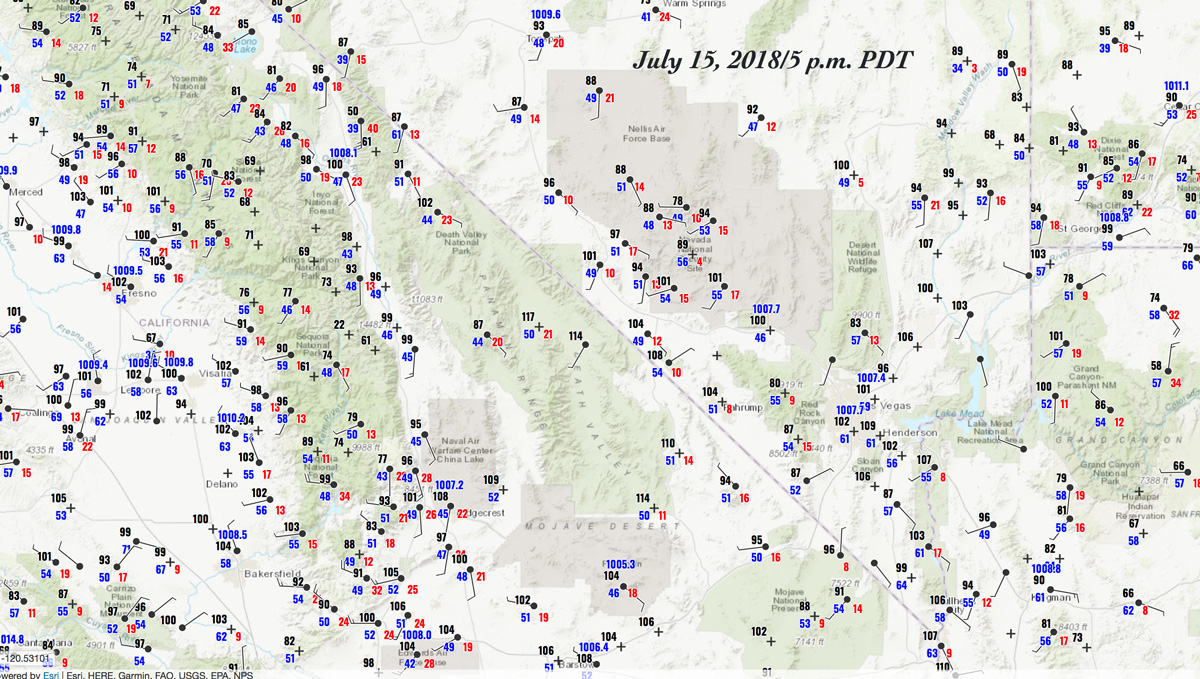
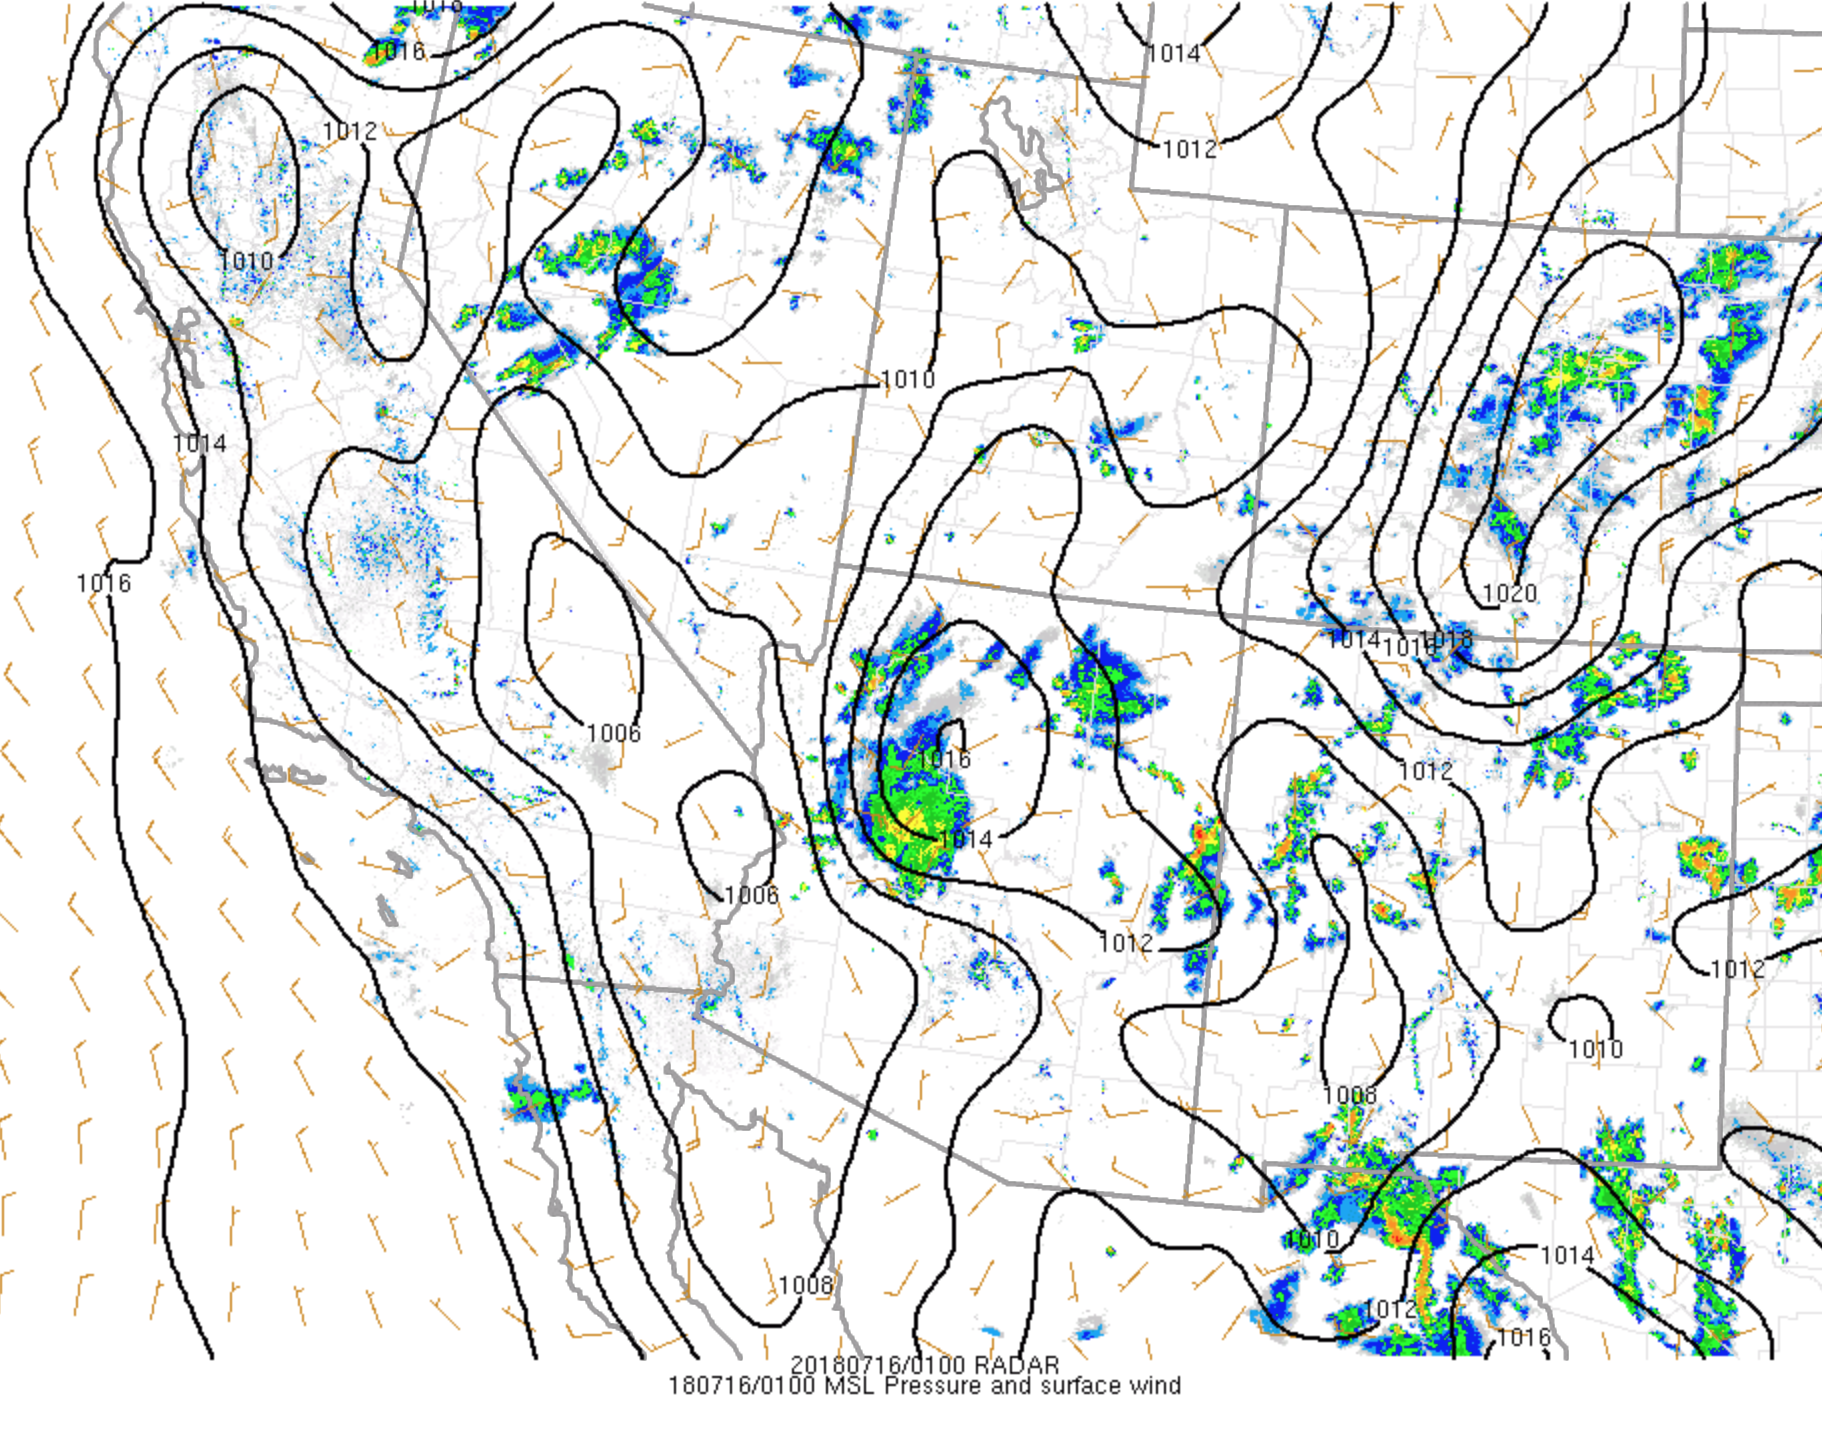
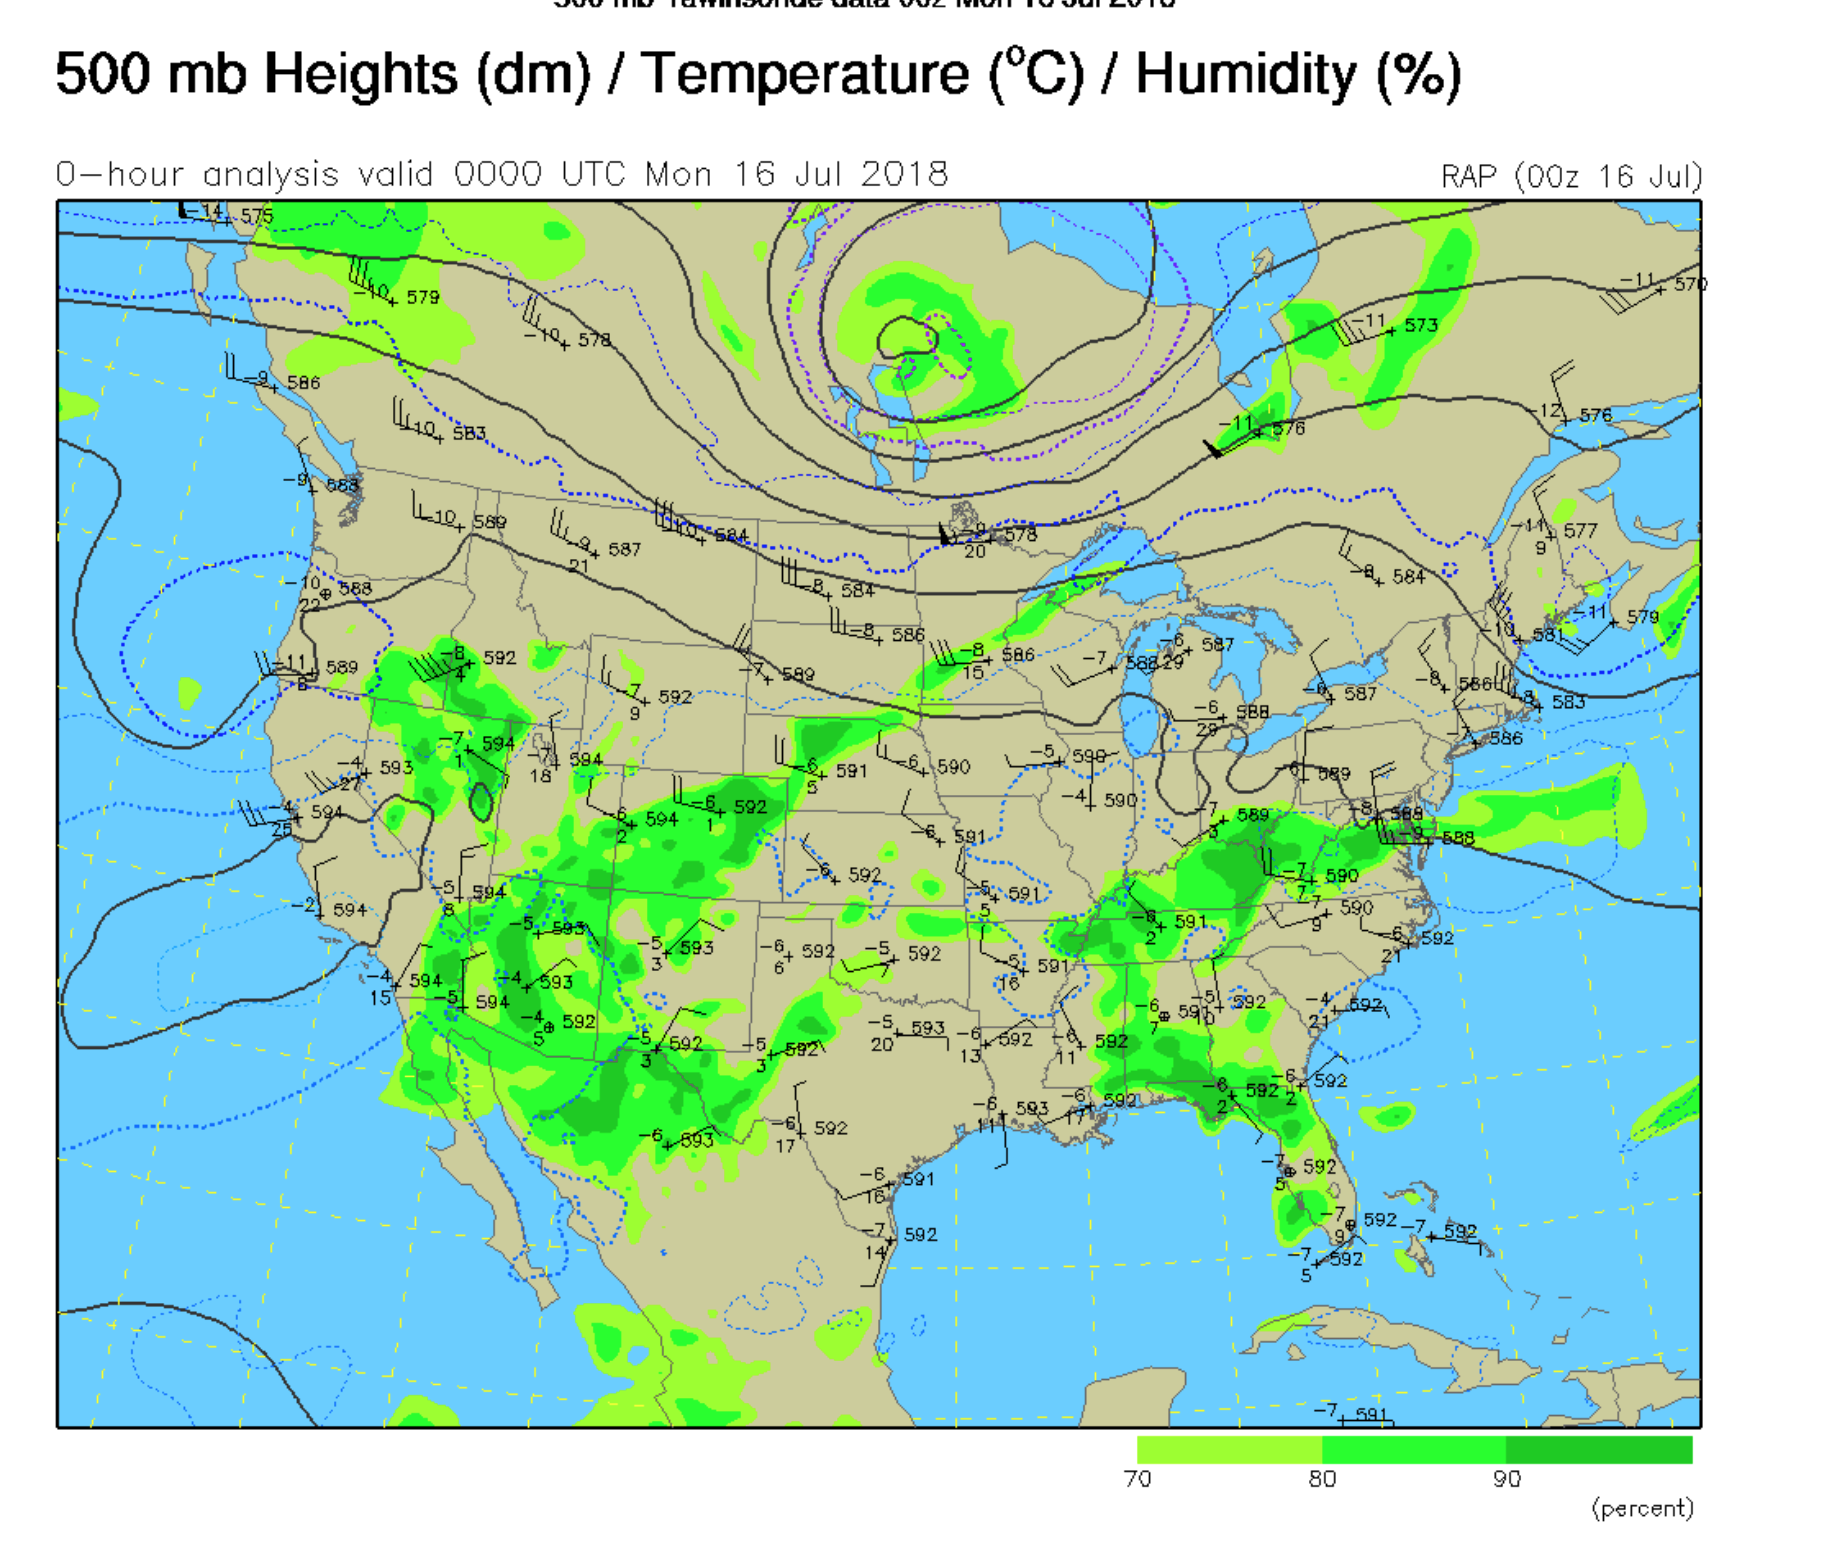
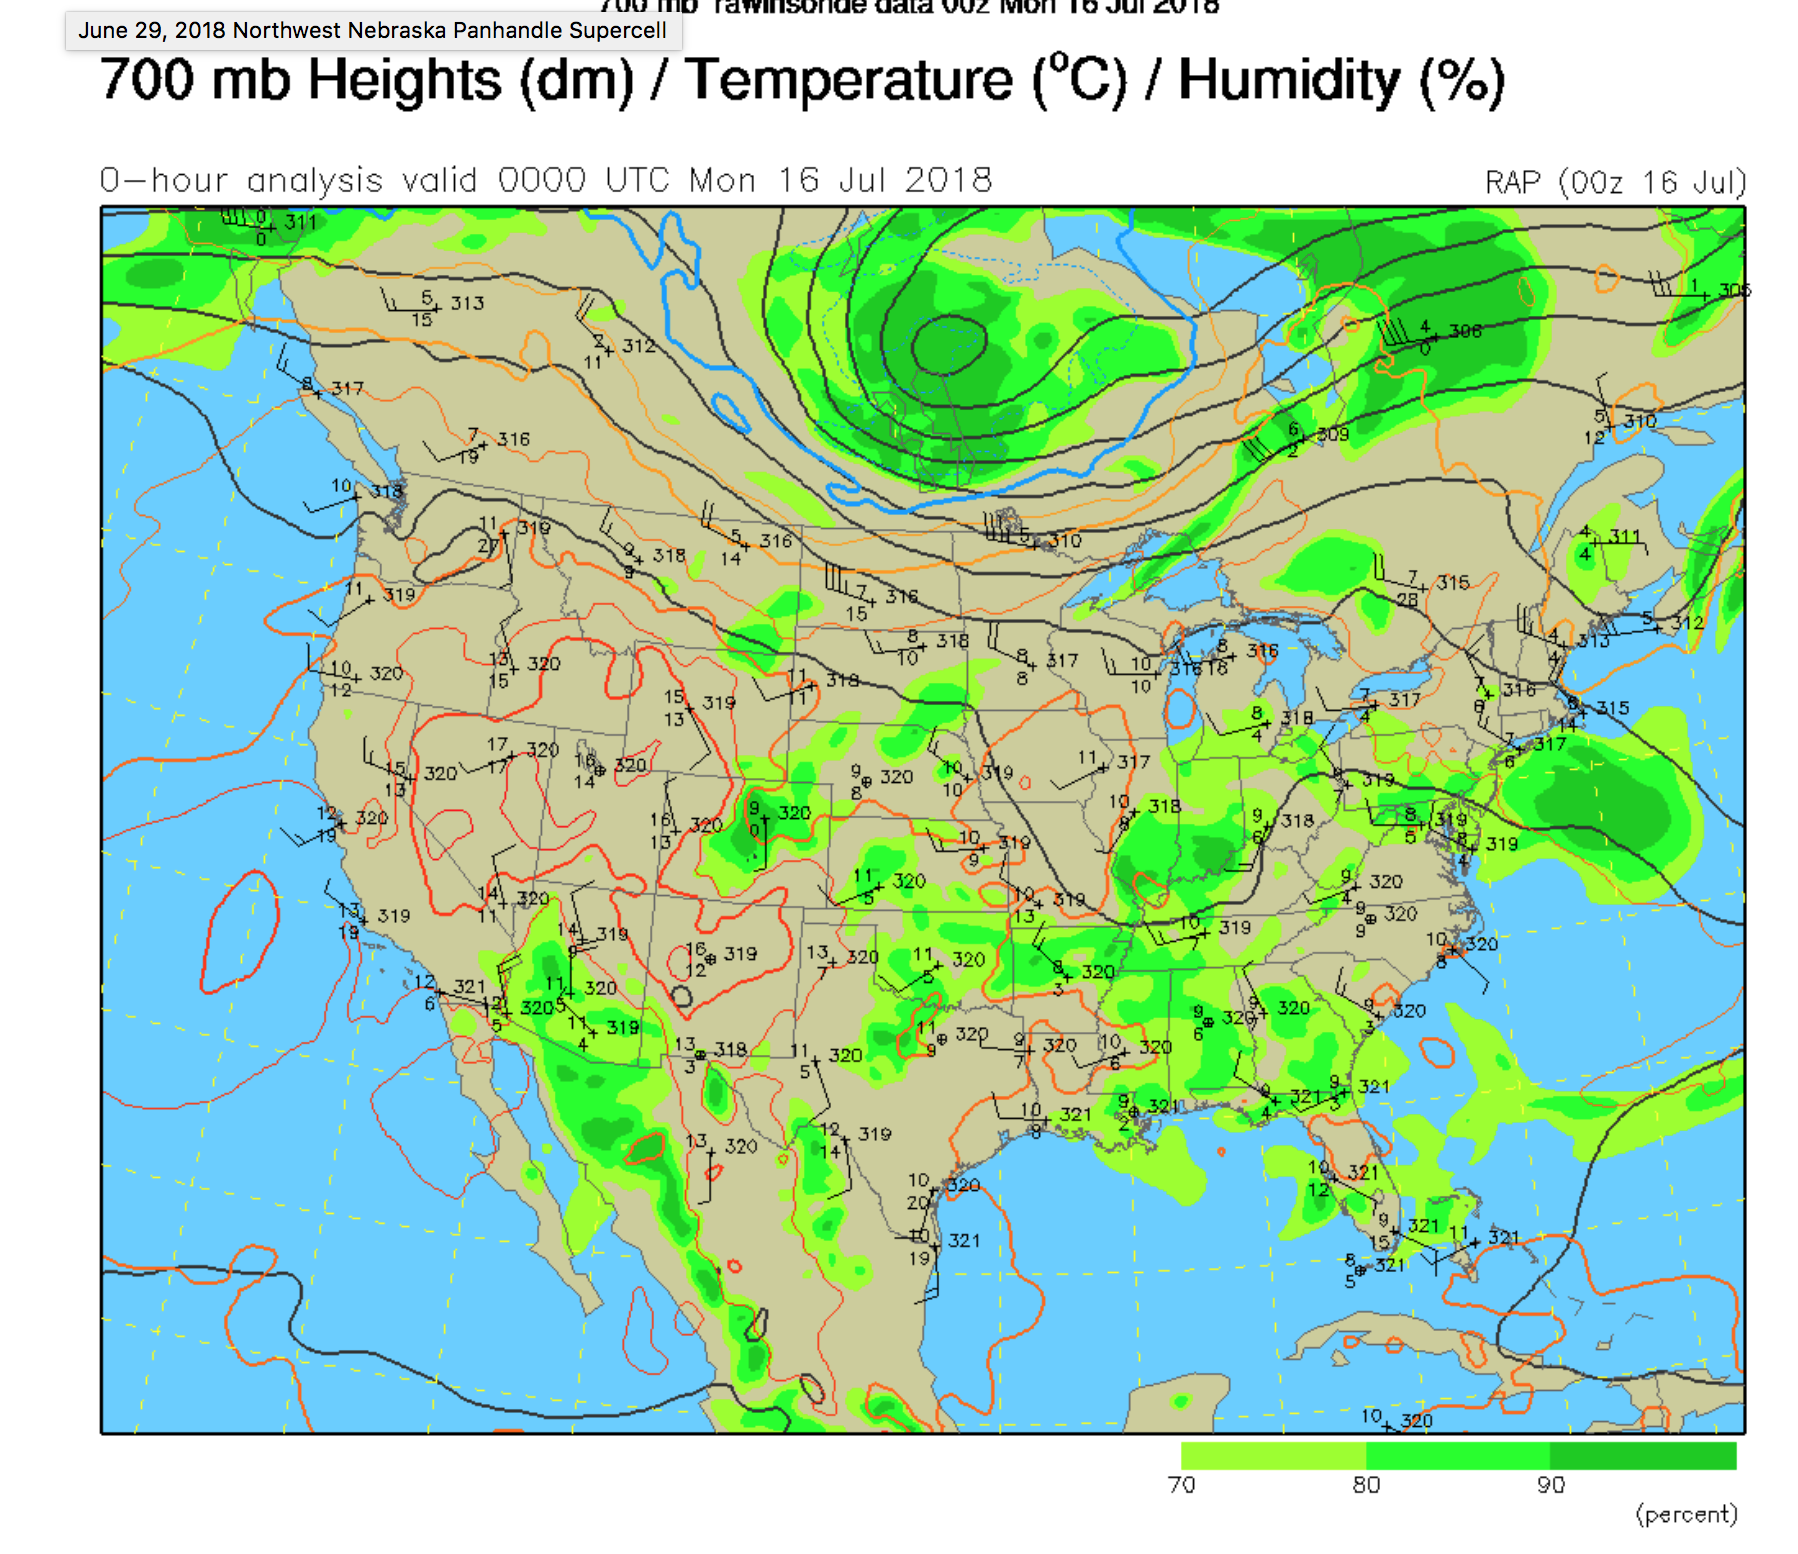
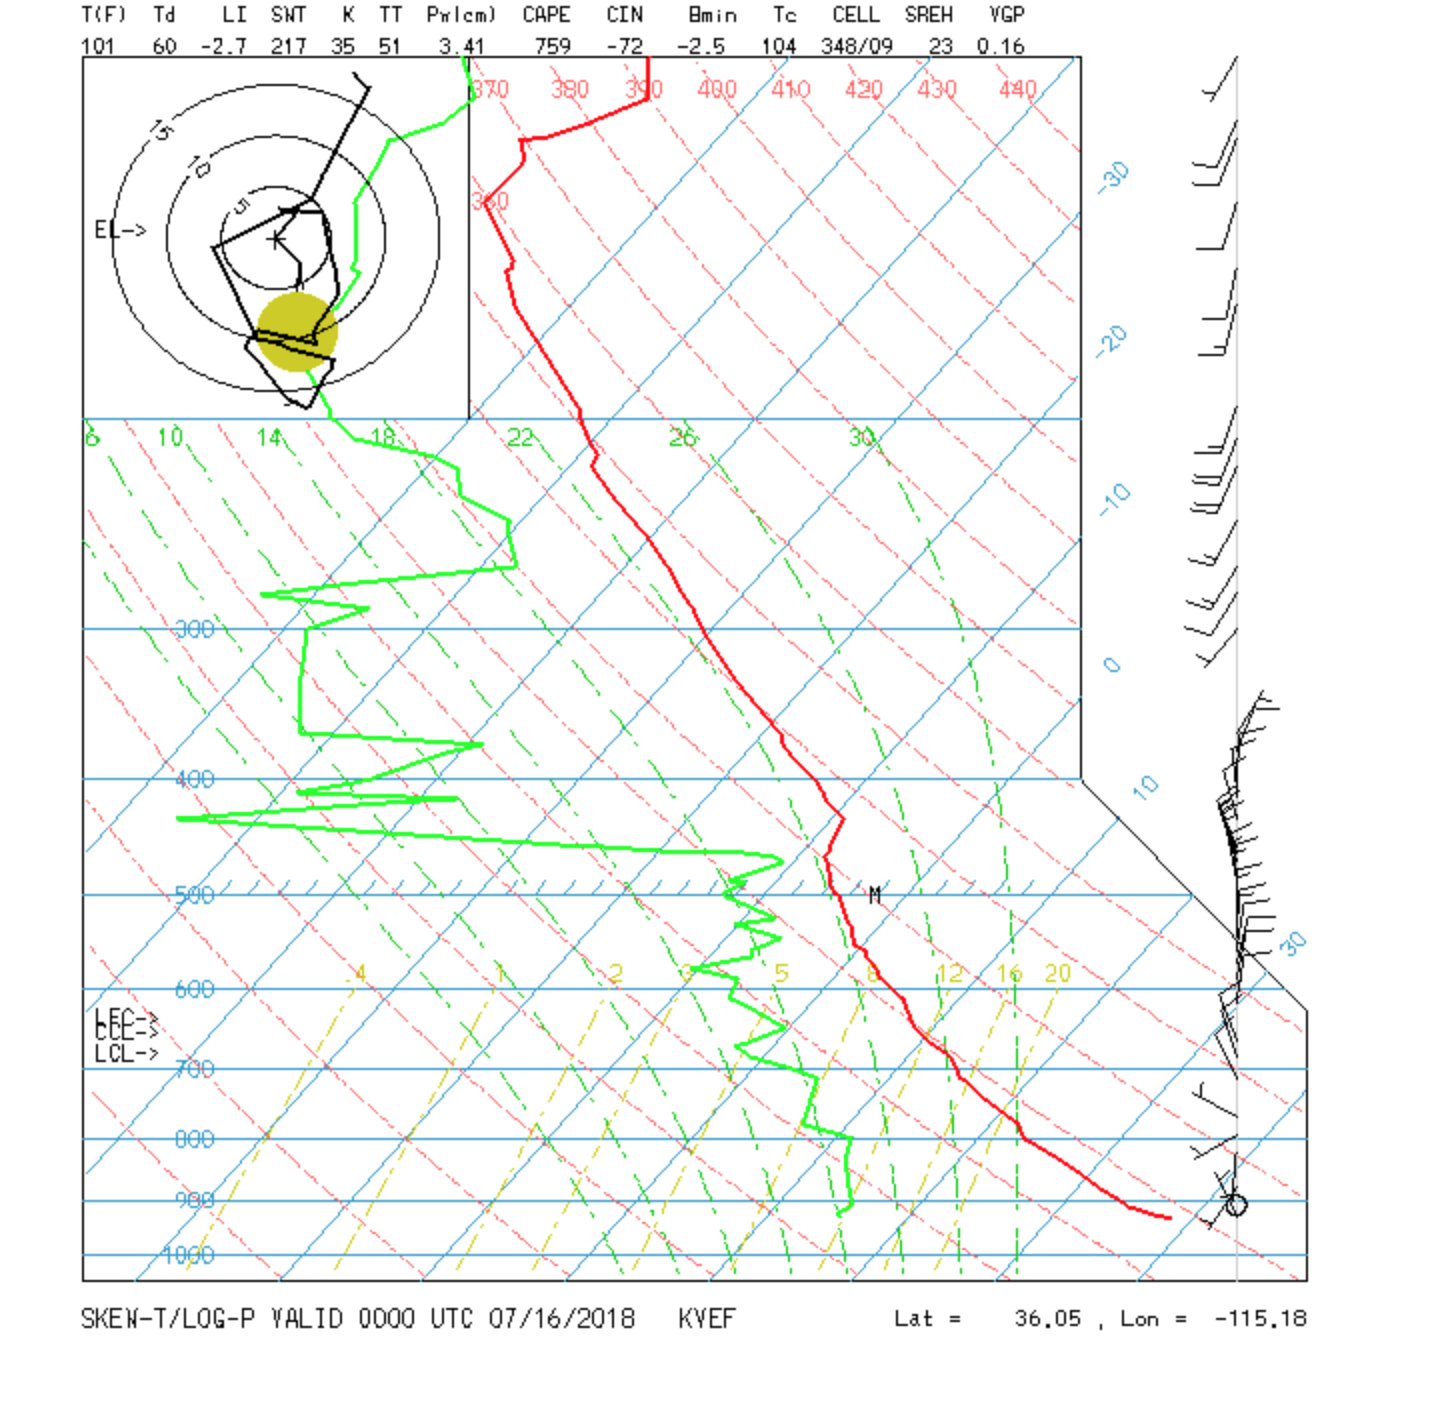
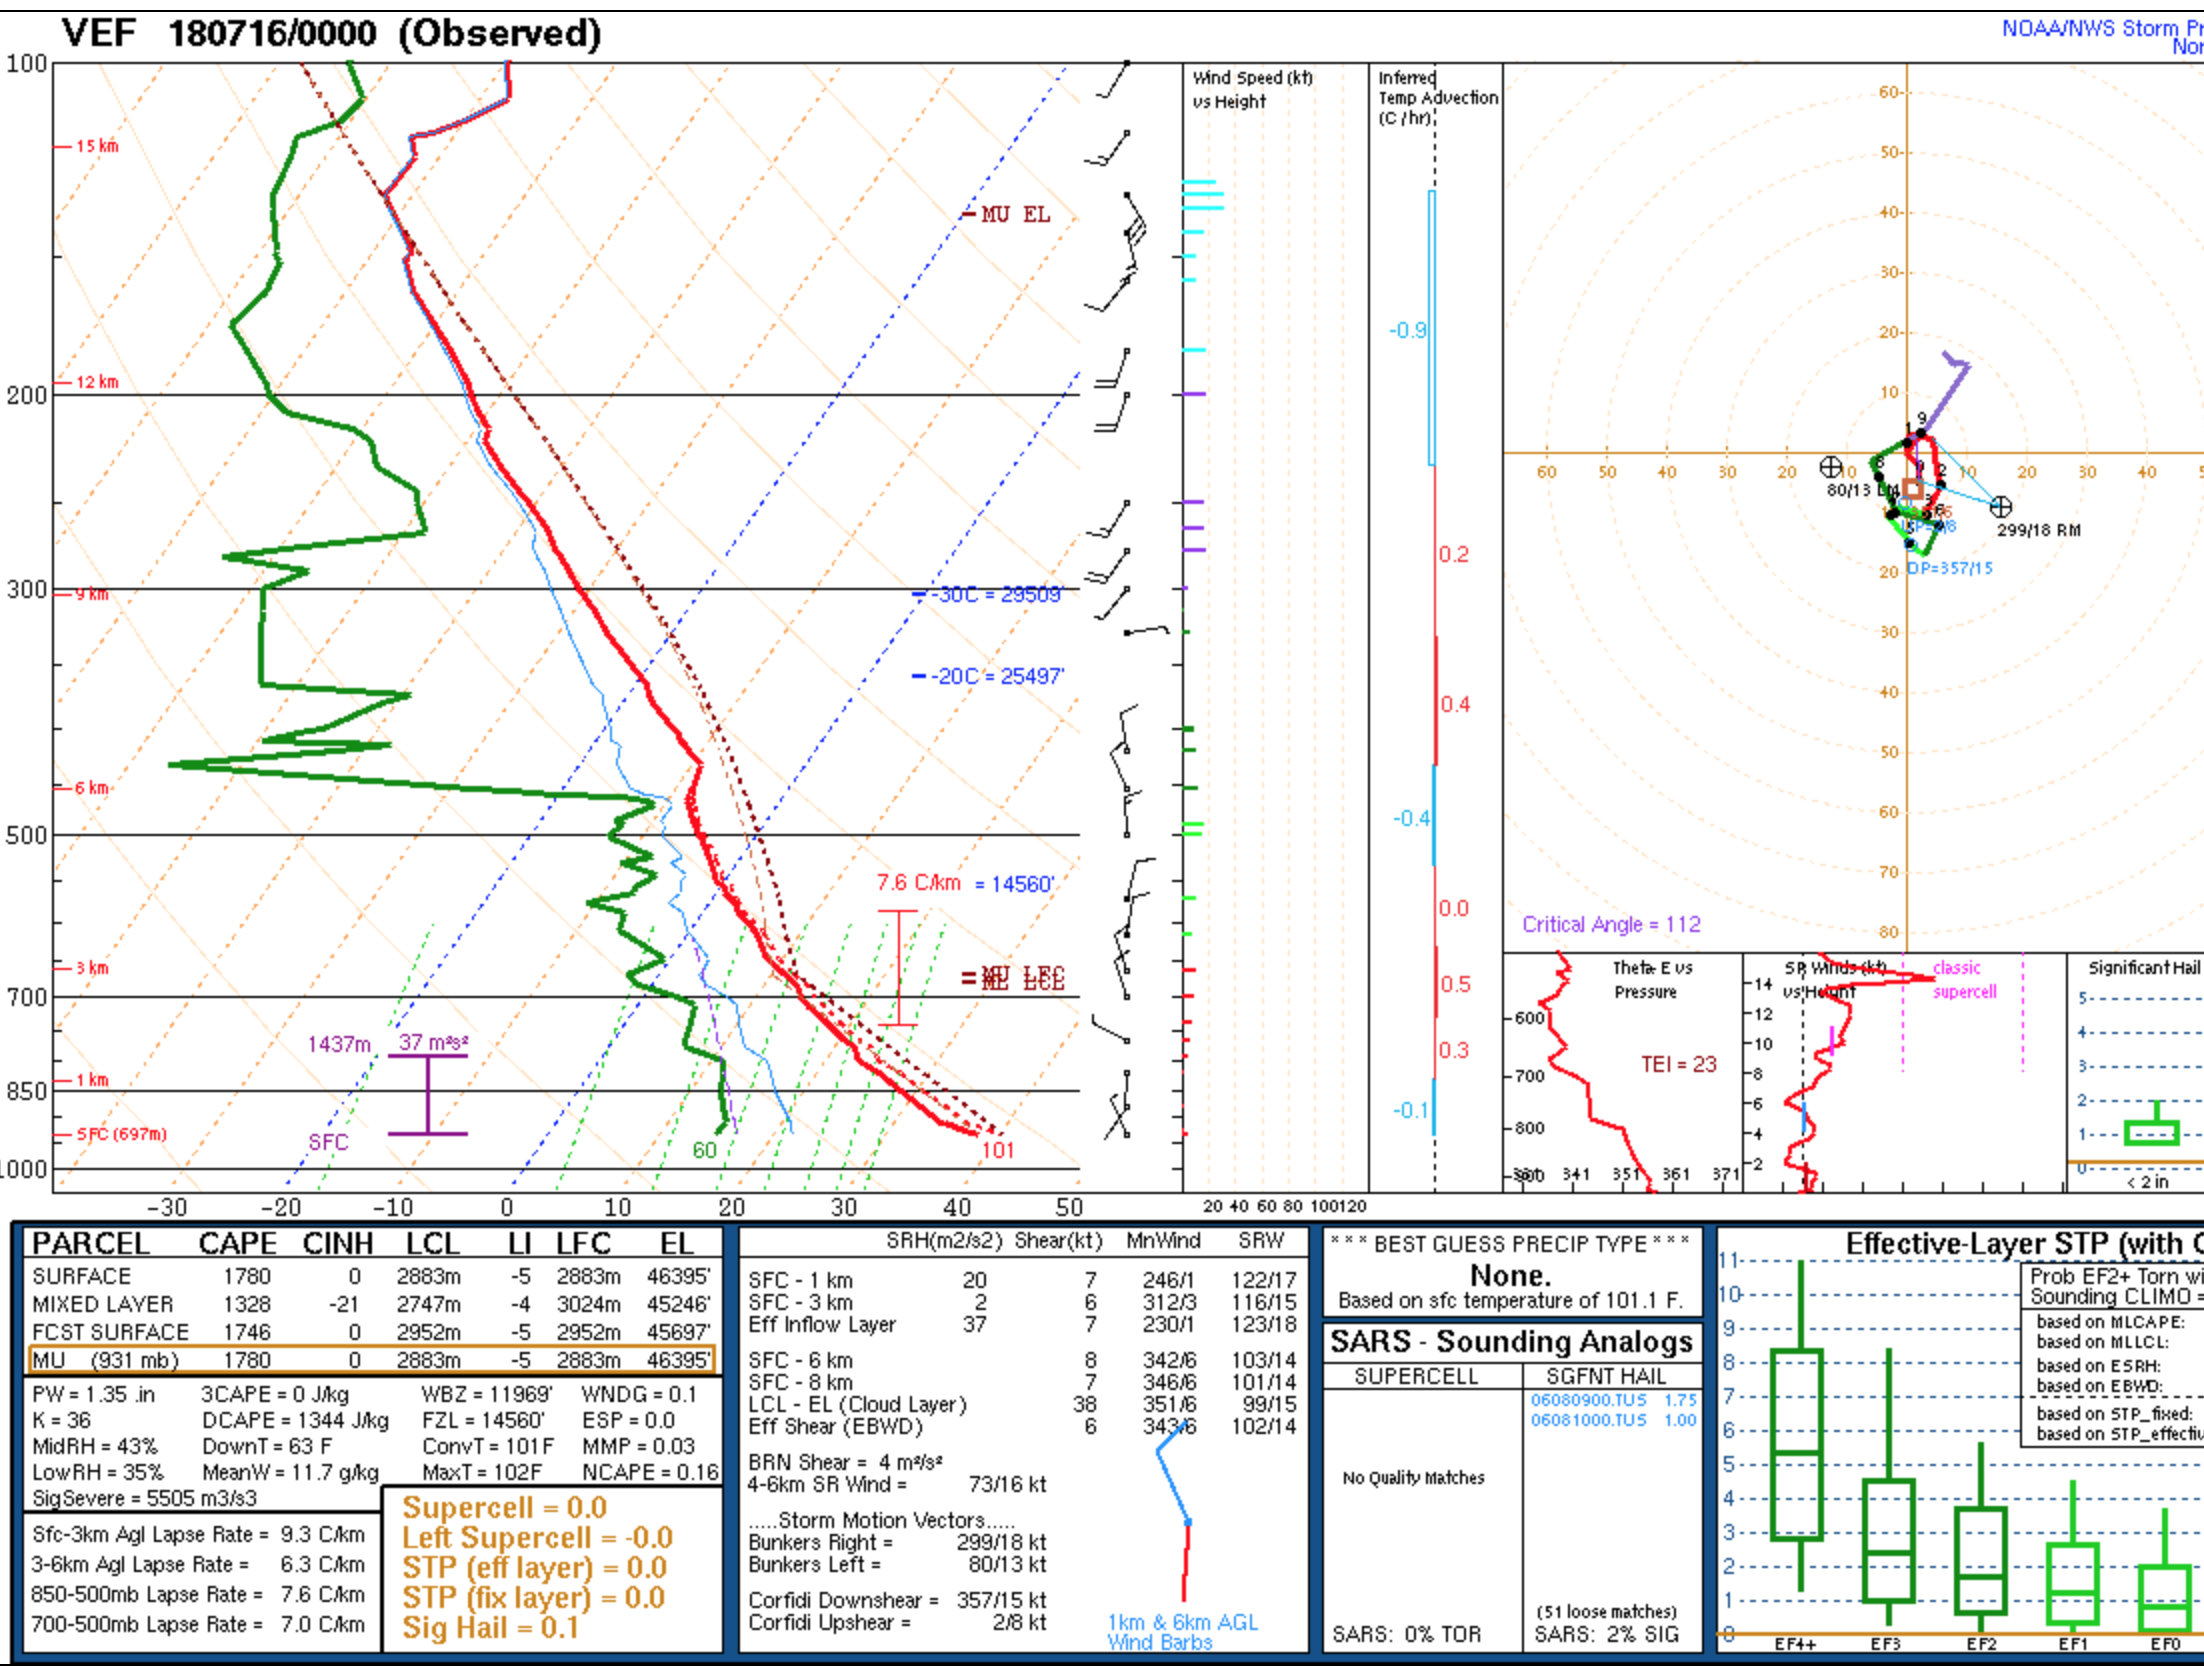
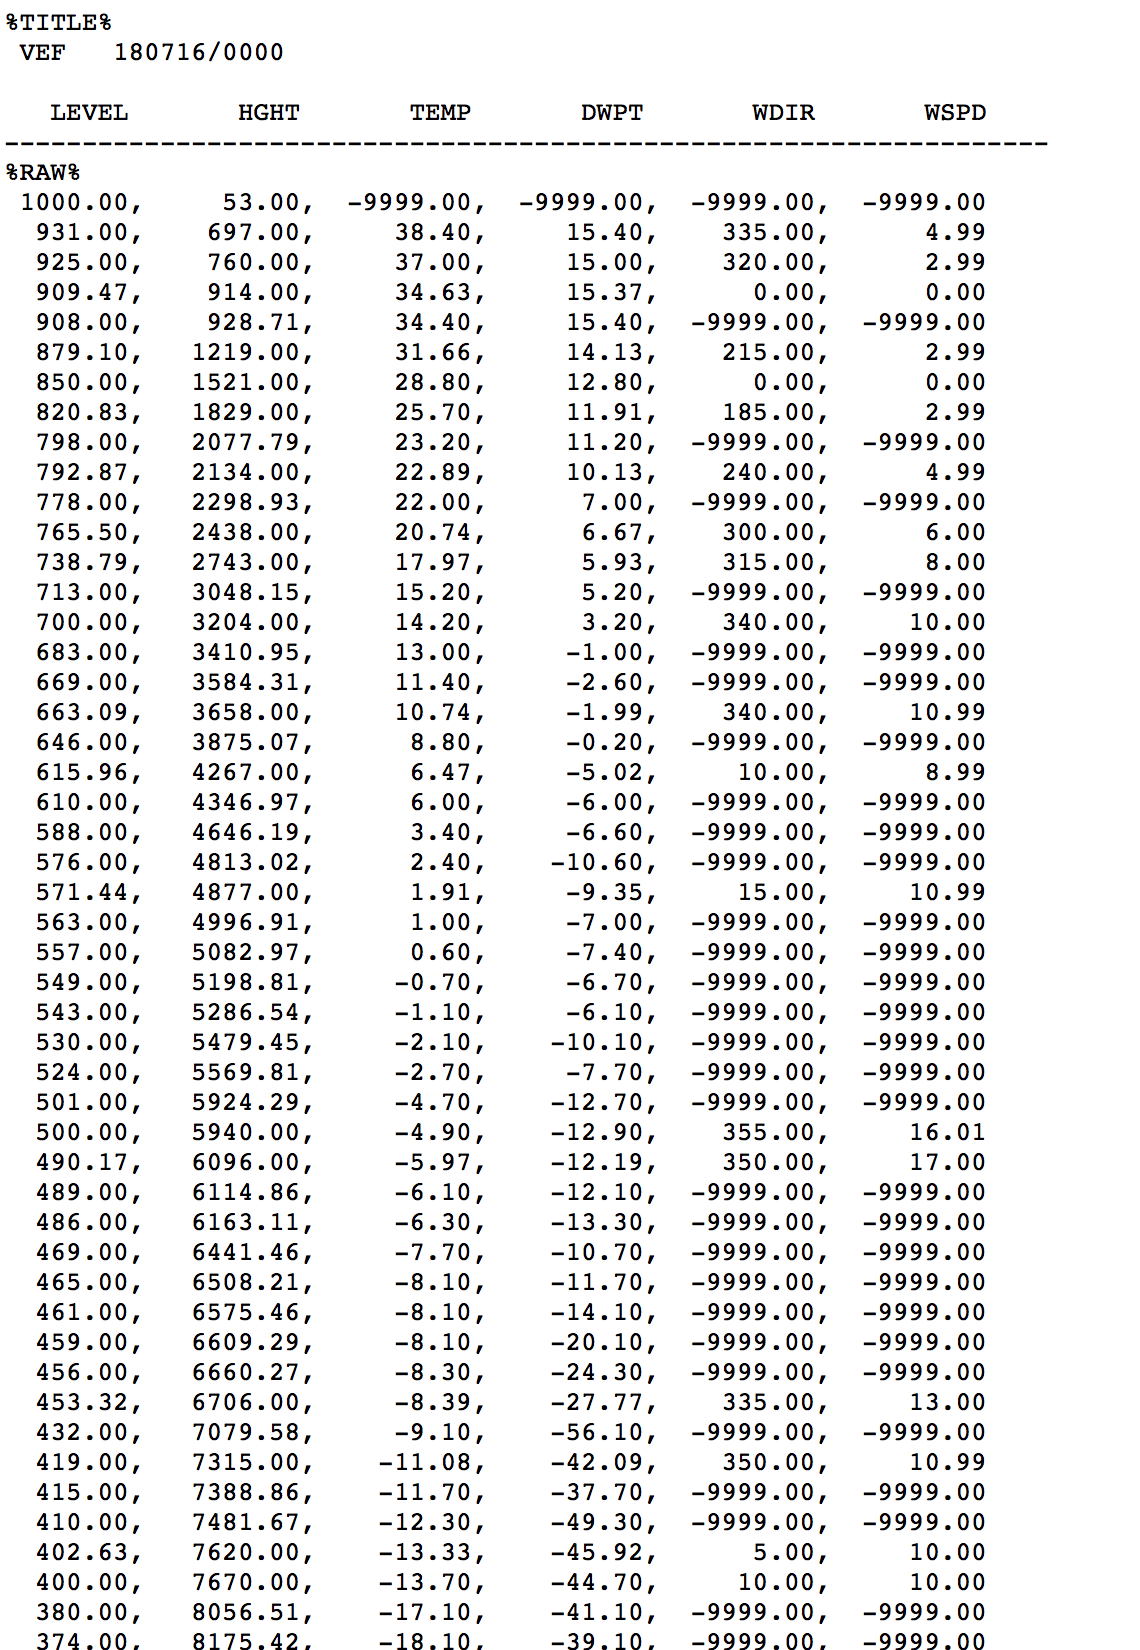
On each evening during this July, I saved selected weather maps for the southwestern United States from the Storm Prediction Center’s “mesoanalysis” page. Also saved were upper air maps from the NCAR site, sounding data from Las Vegas from the NCAR site and SPC “forecast tools” page. Most maps are fairly close to the time of 00Z, but might be an hour or two later. “00Z” is 5 p.m. PDT, which is close to the hottest time of the afternoon for most stations in the Death Valley region.
The images are large and perhaps slow to load, so I broke this into two parts.
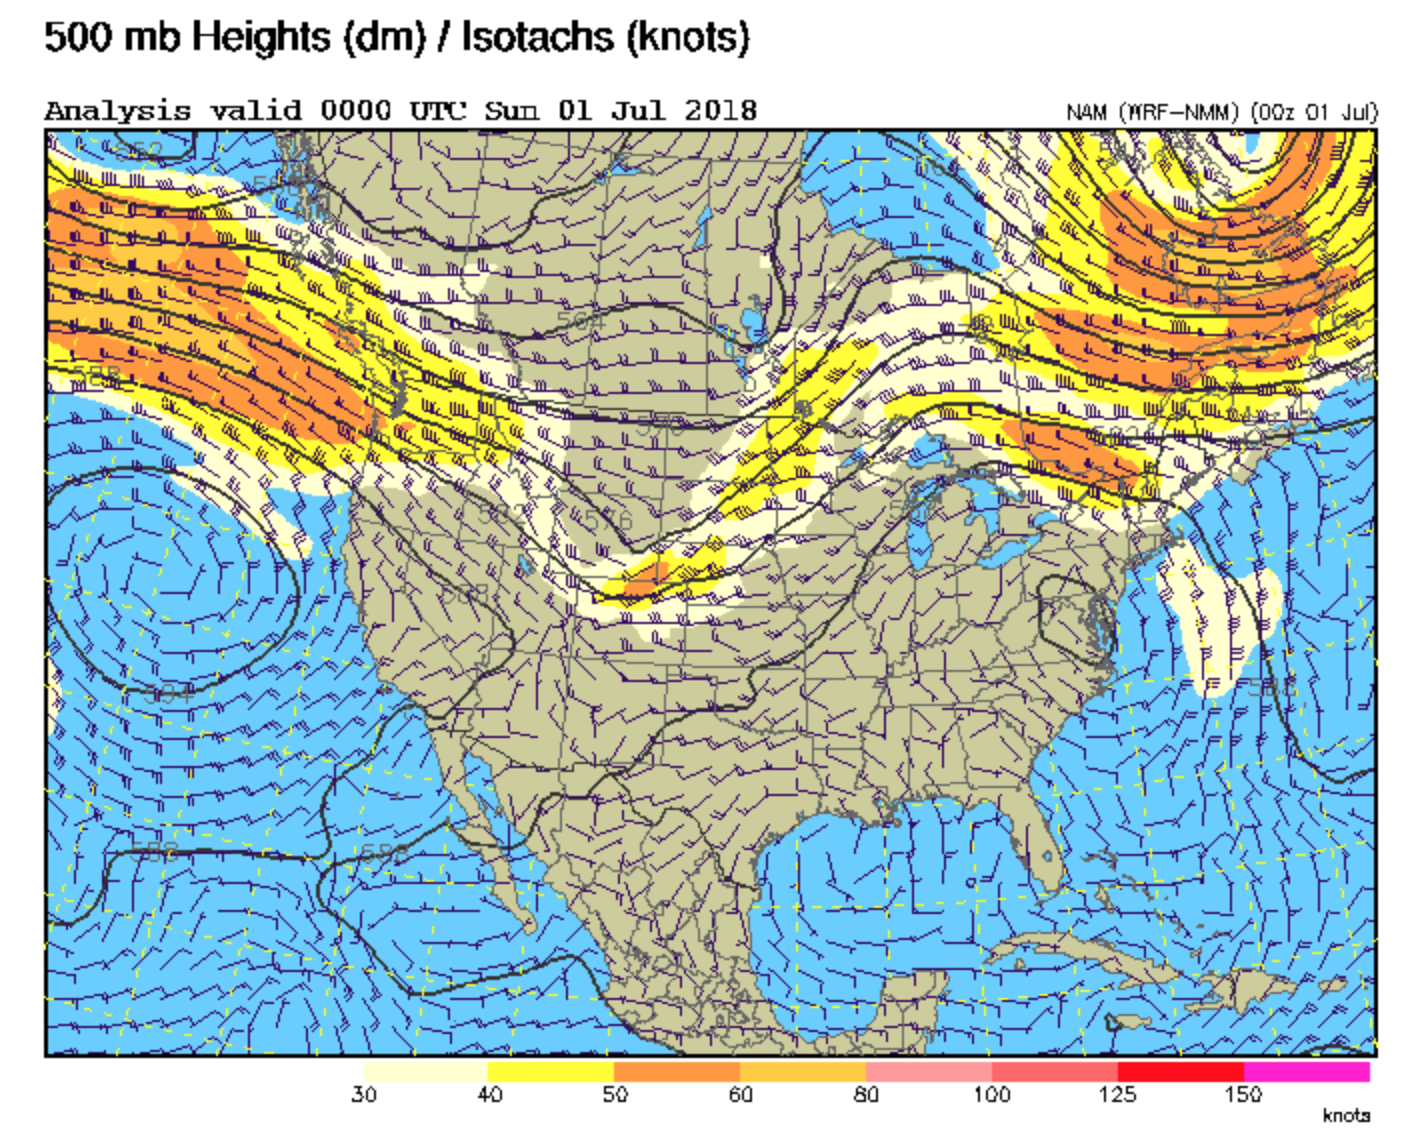
July 1
(note that one of the 500 mb maps is valid at 00Z on July 1, which is 5 p.m. on June 30)
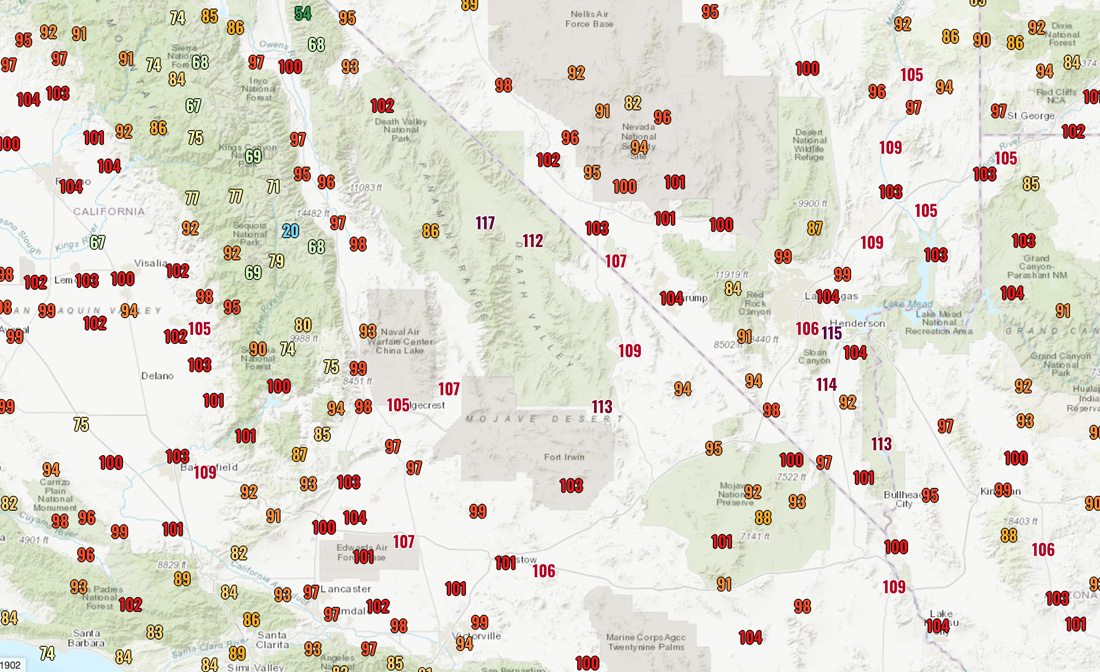
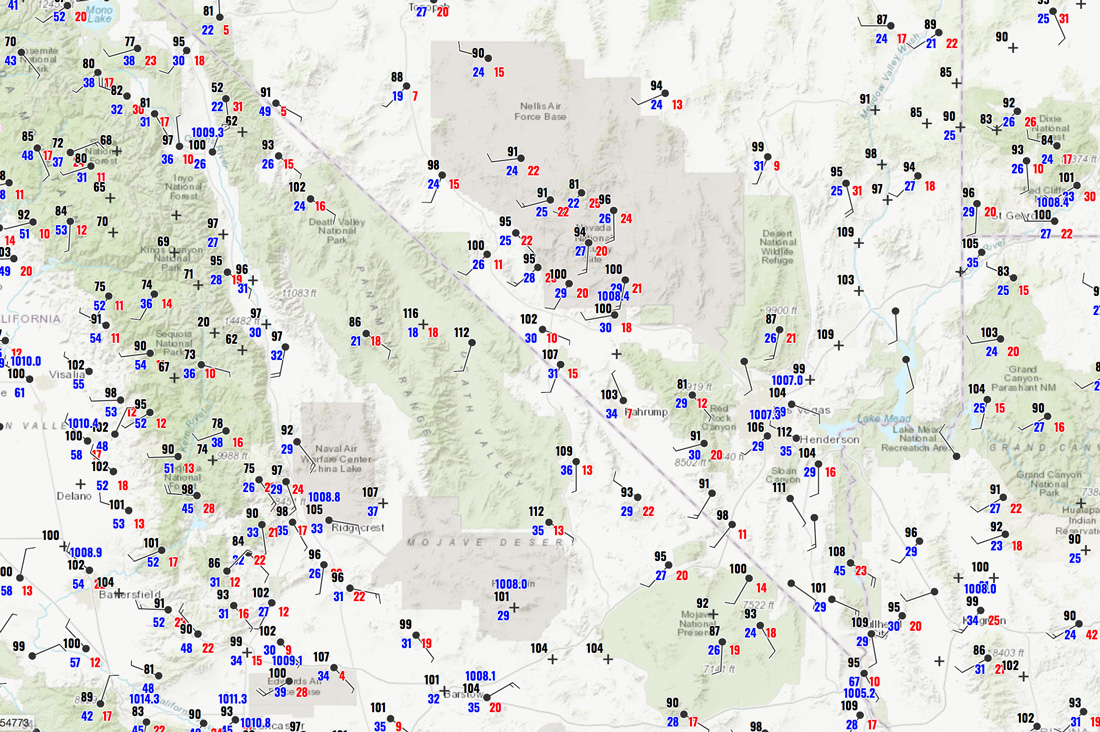
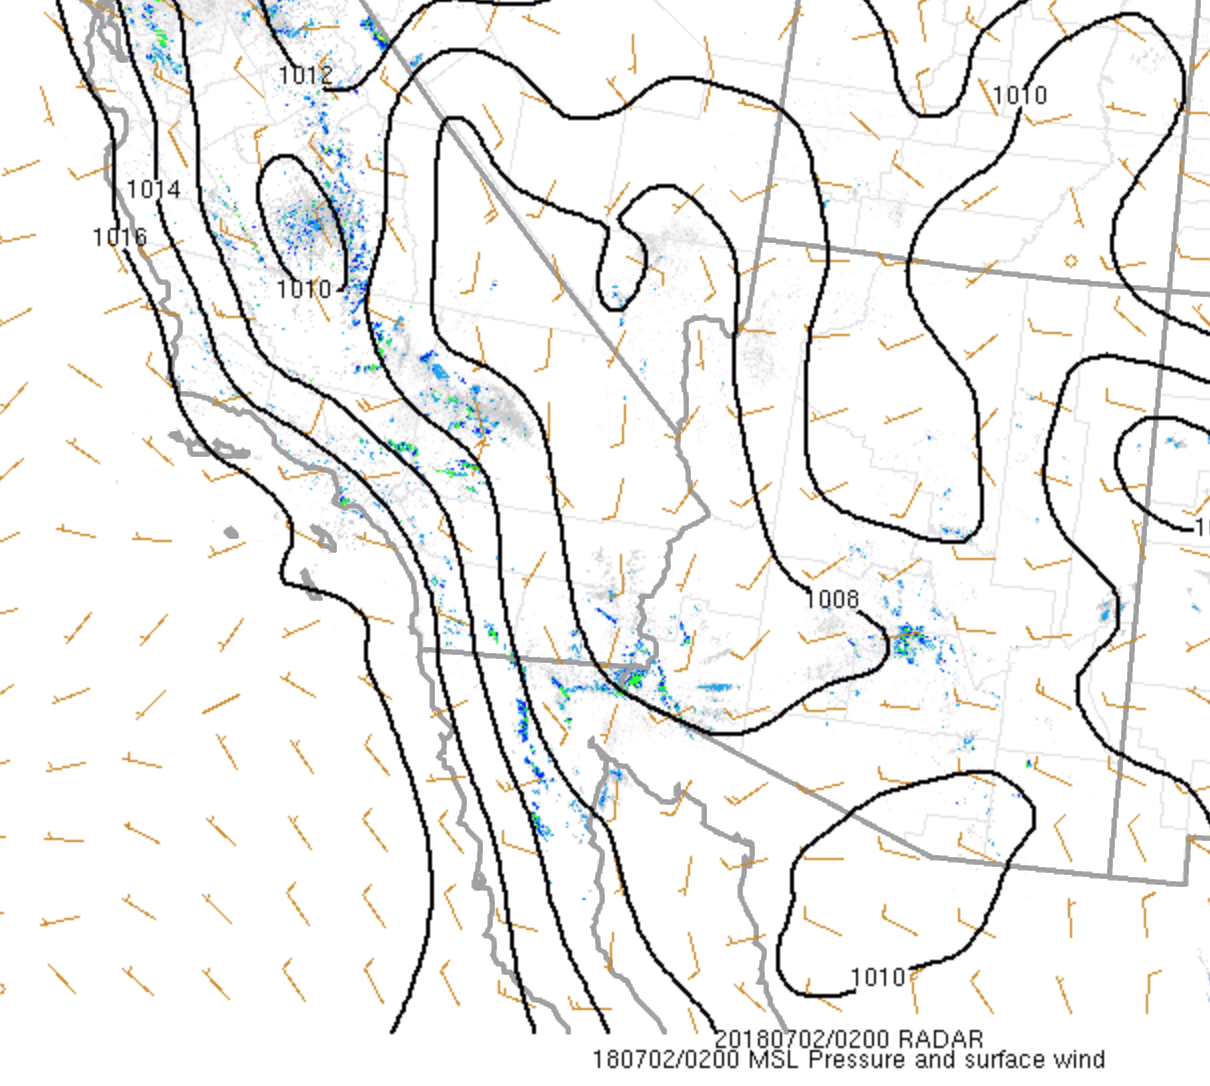
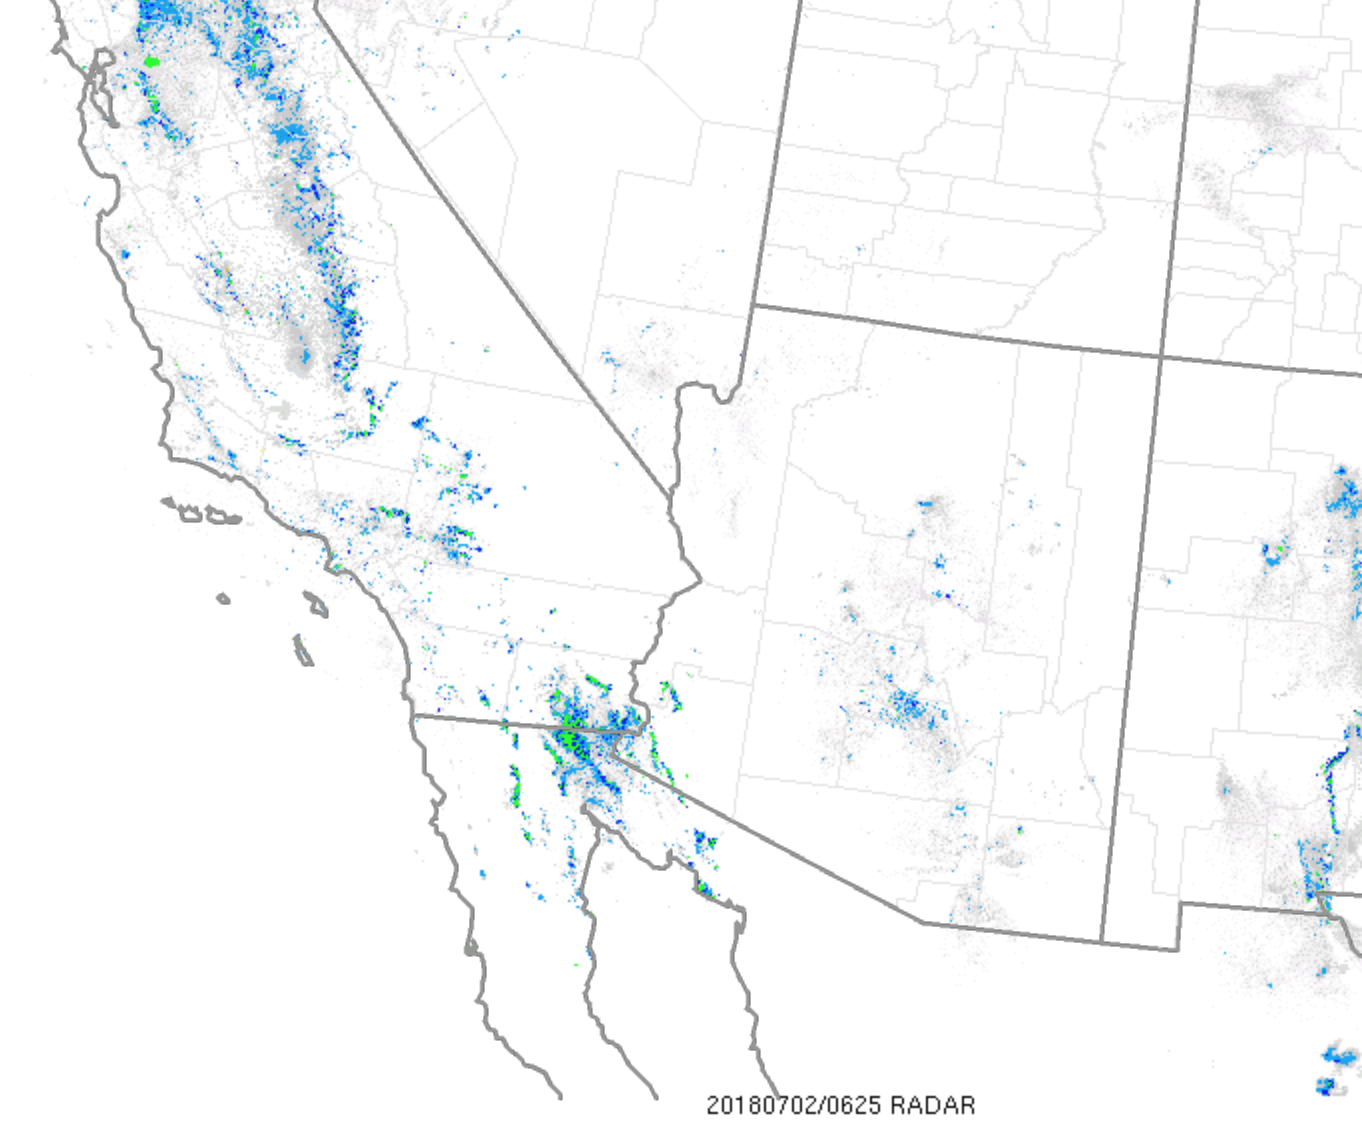
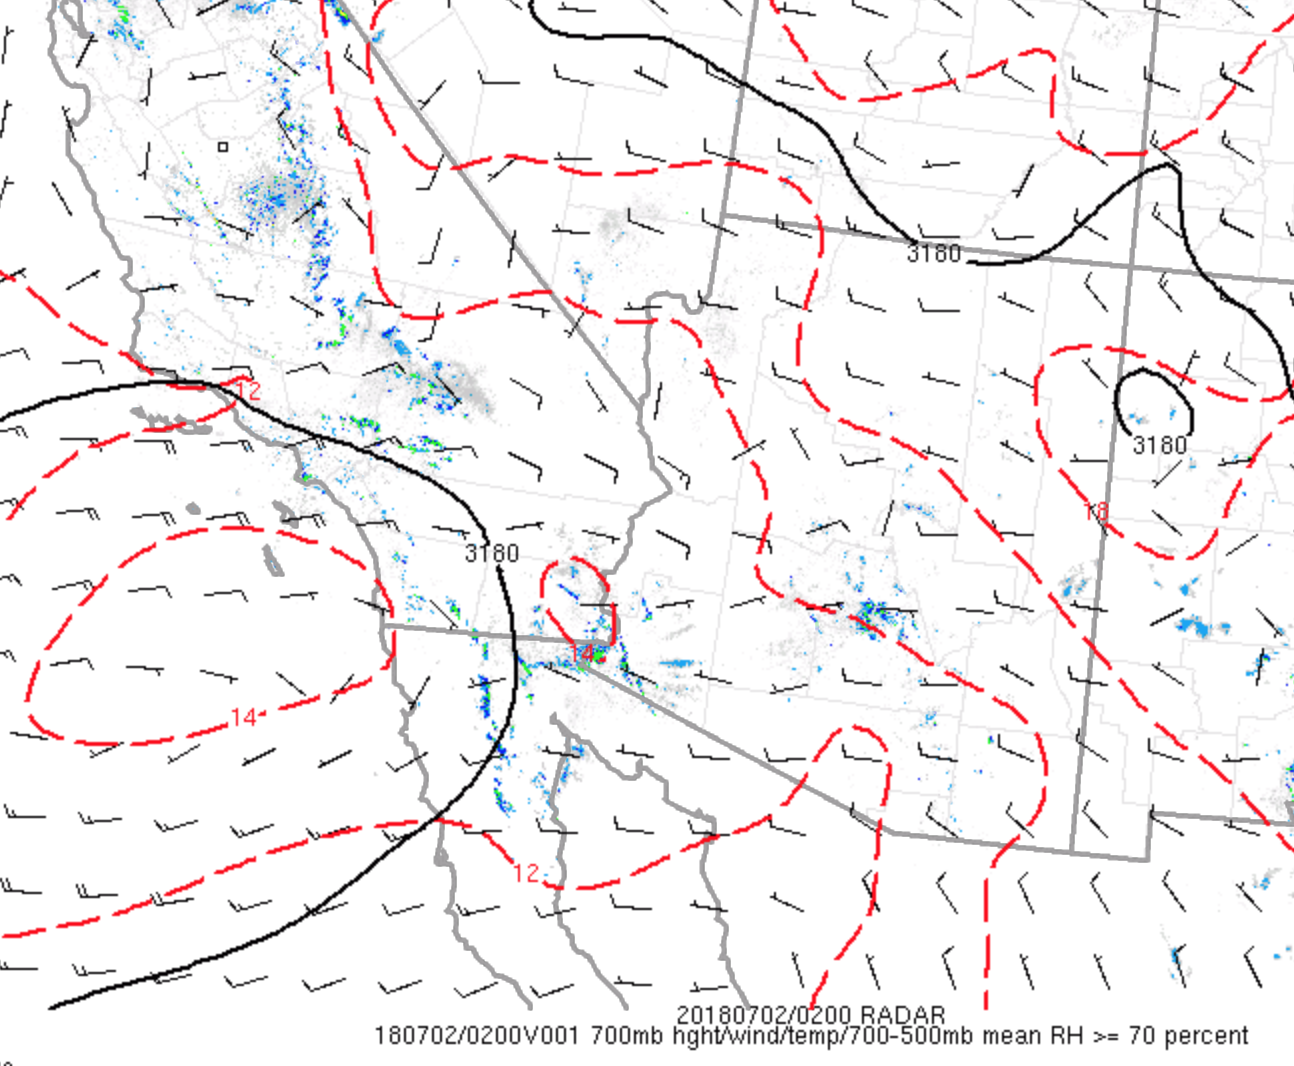
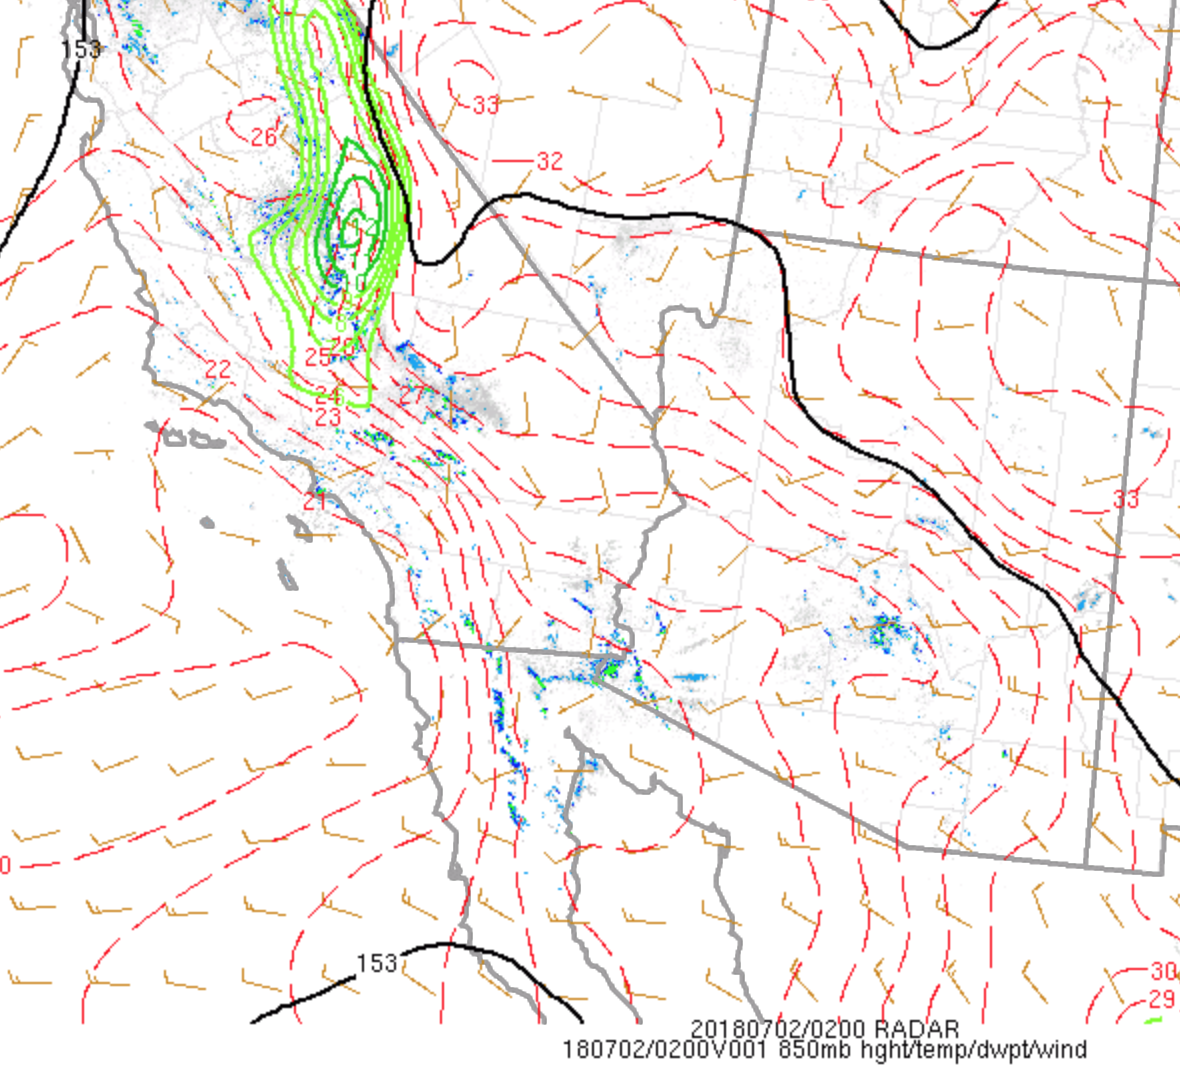
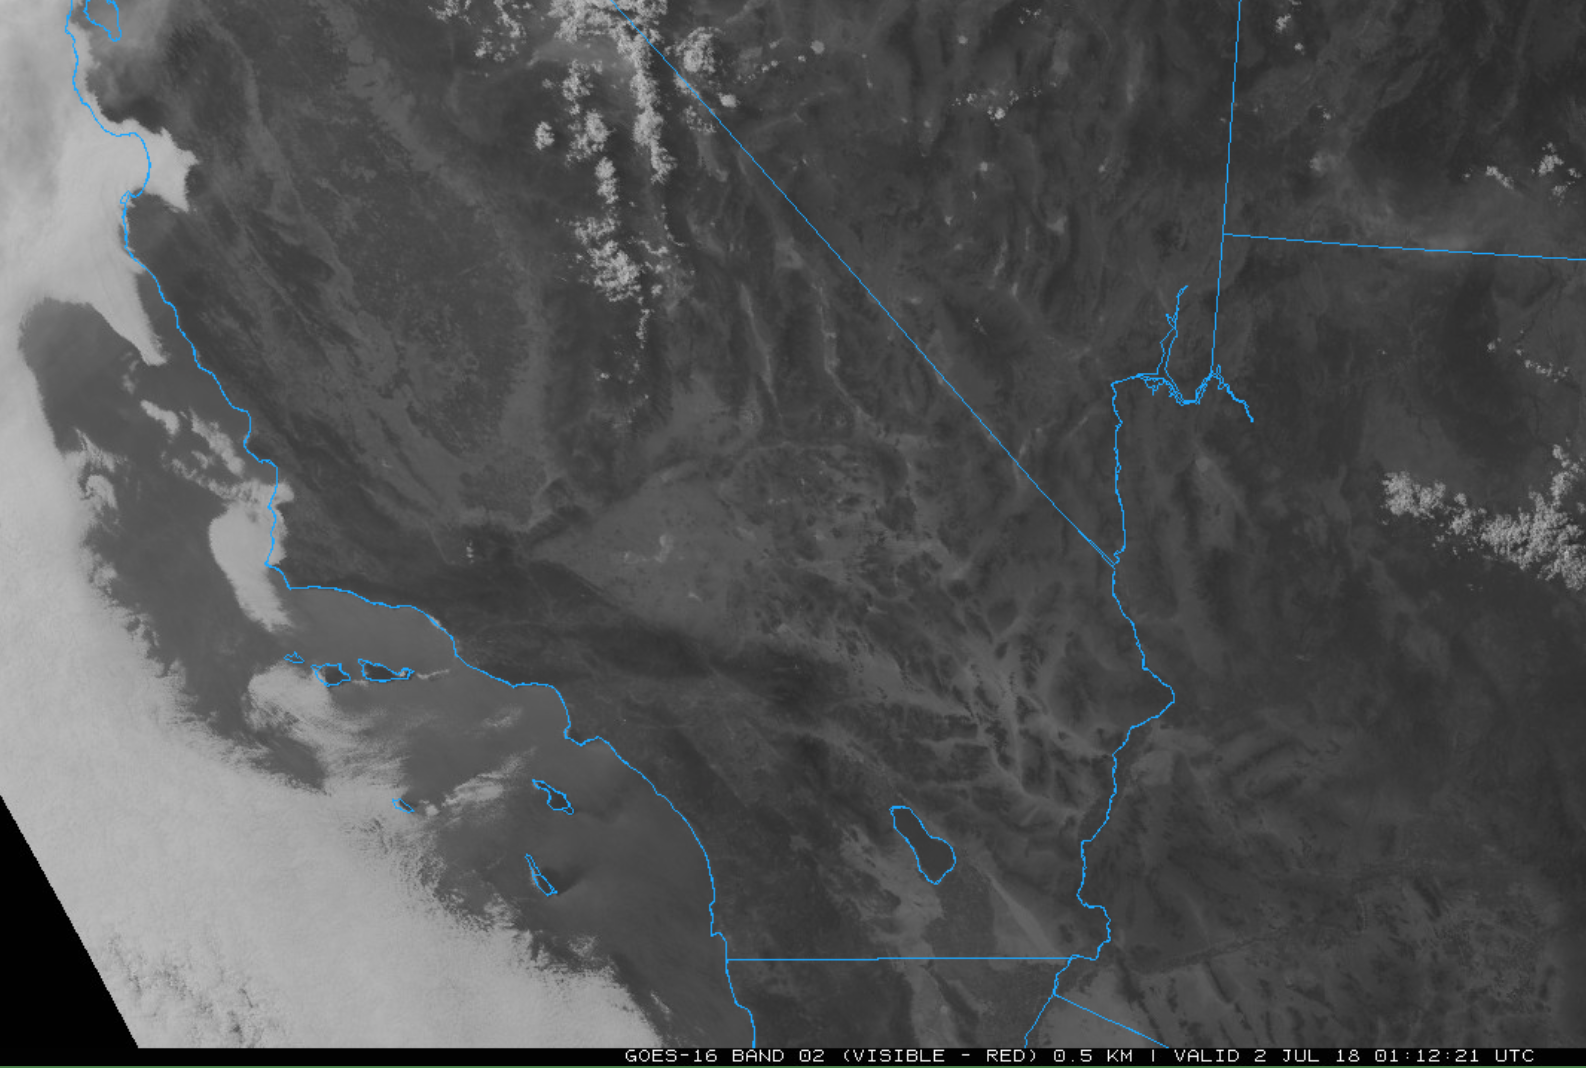
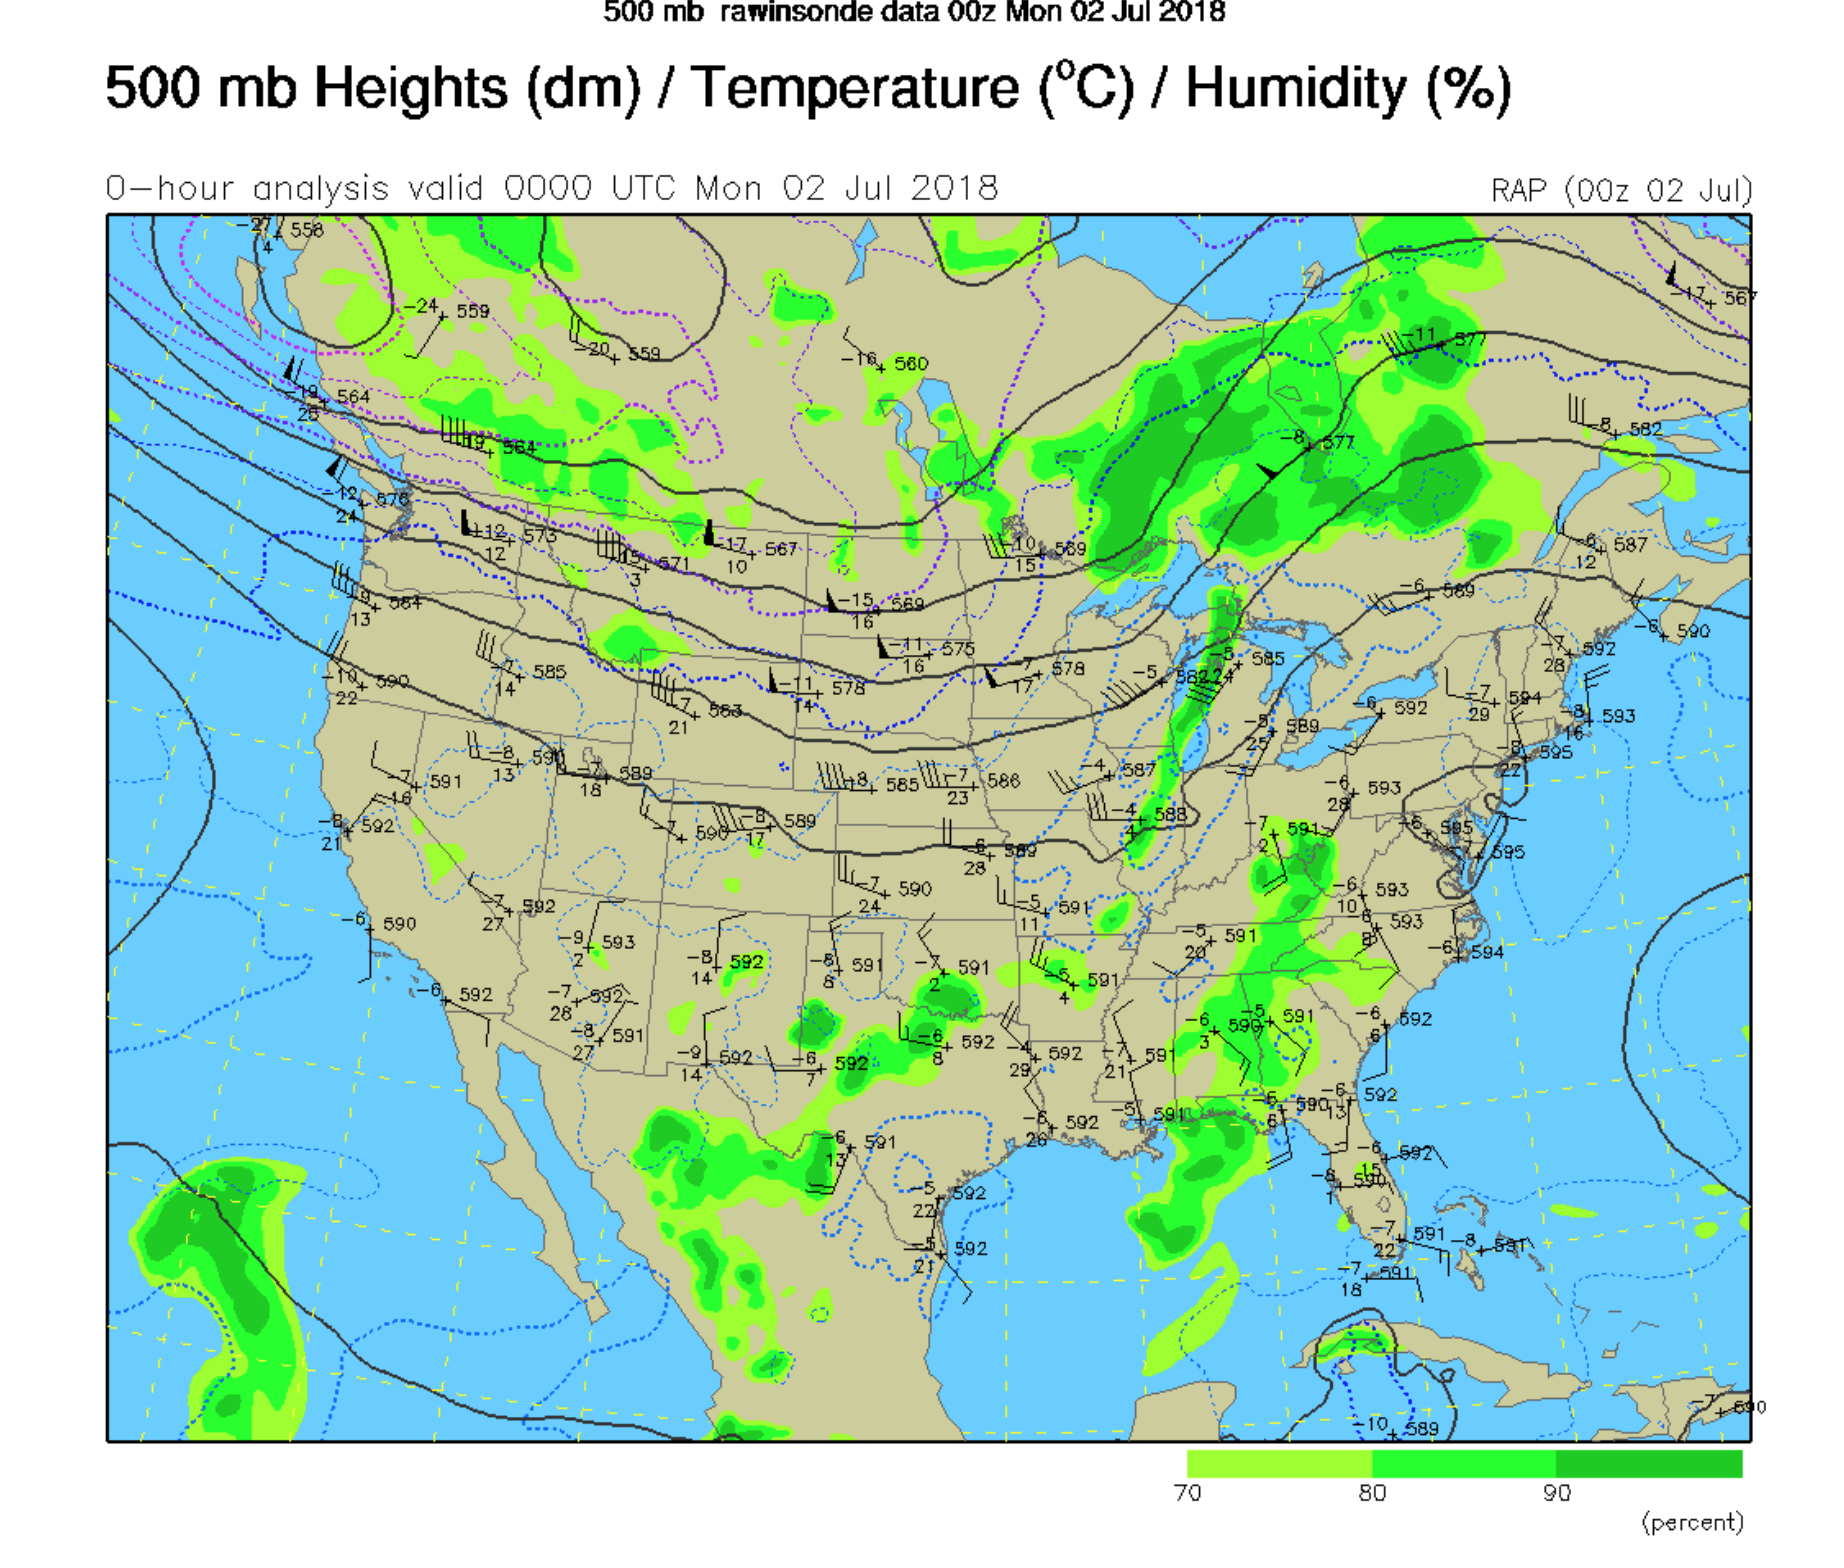
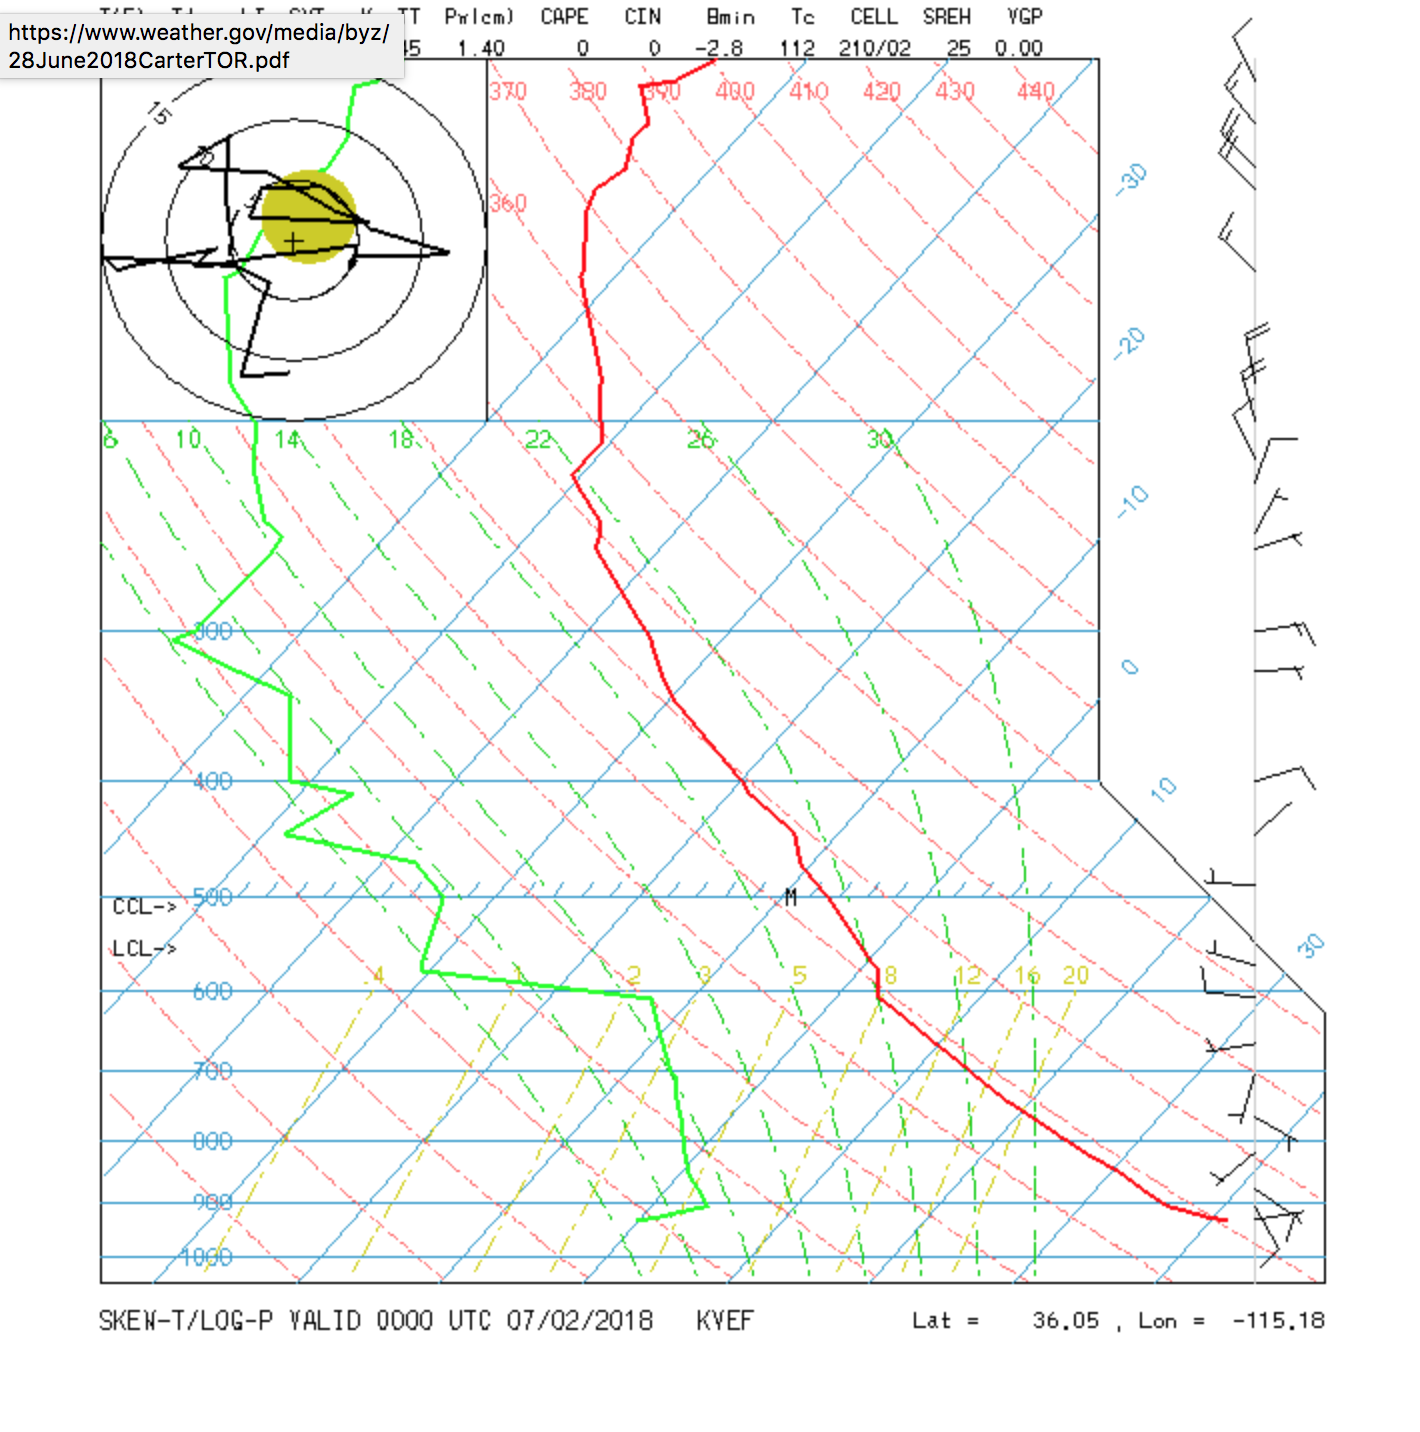
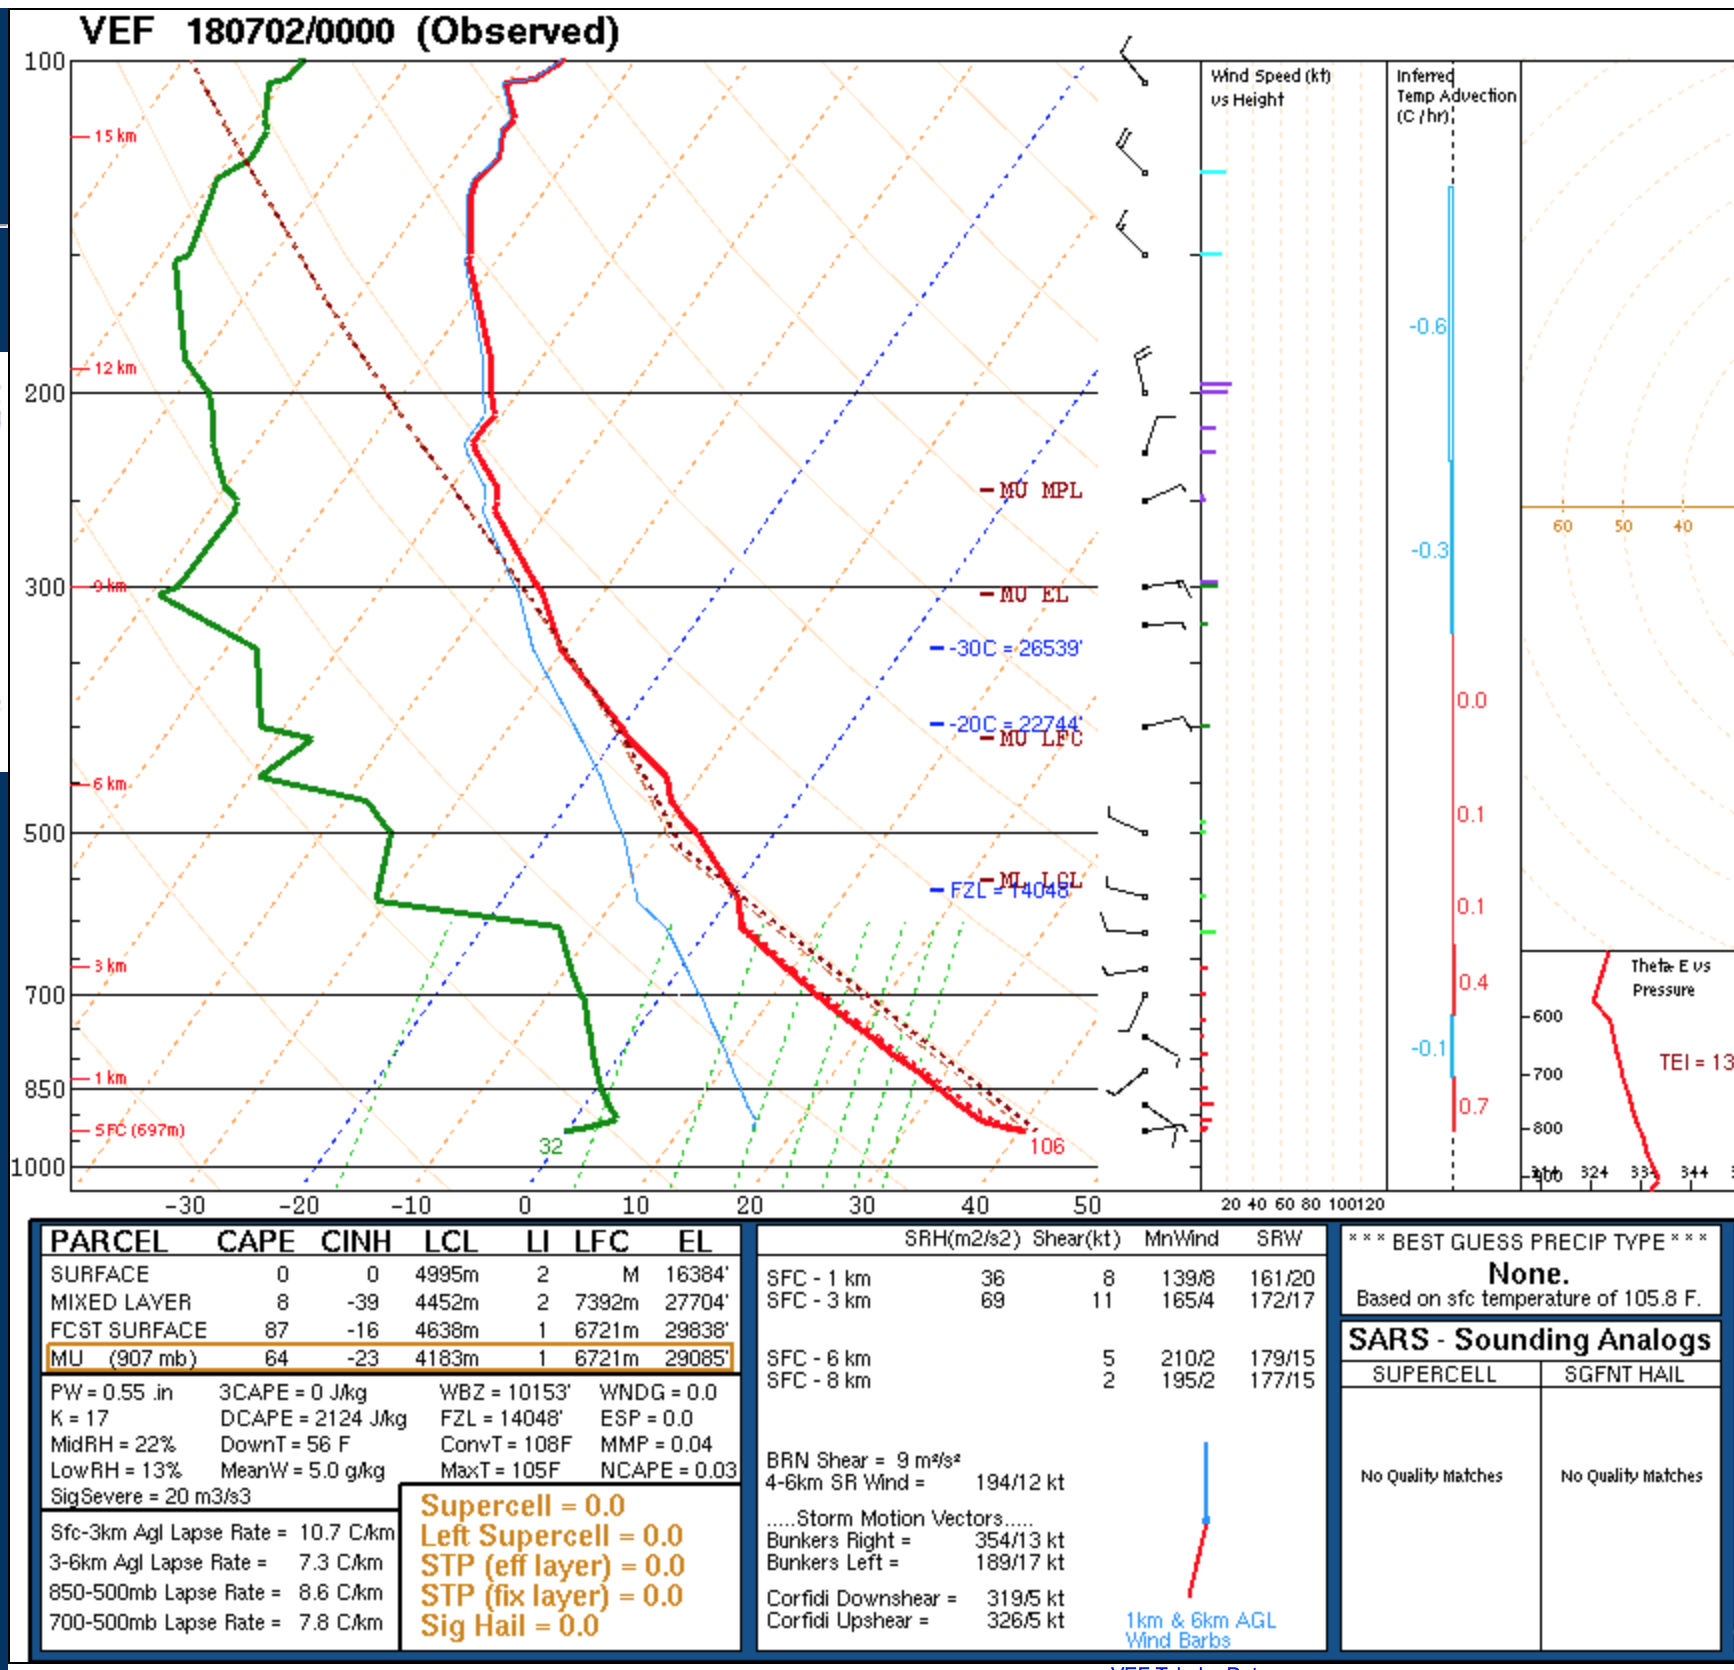
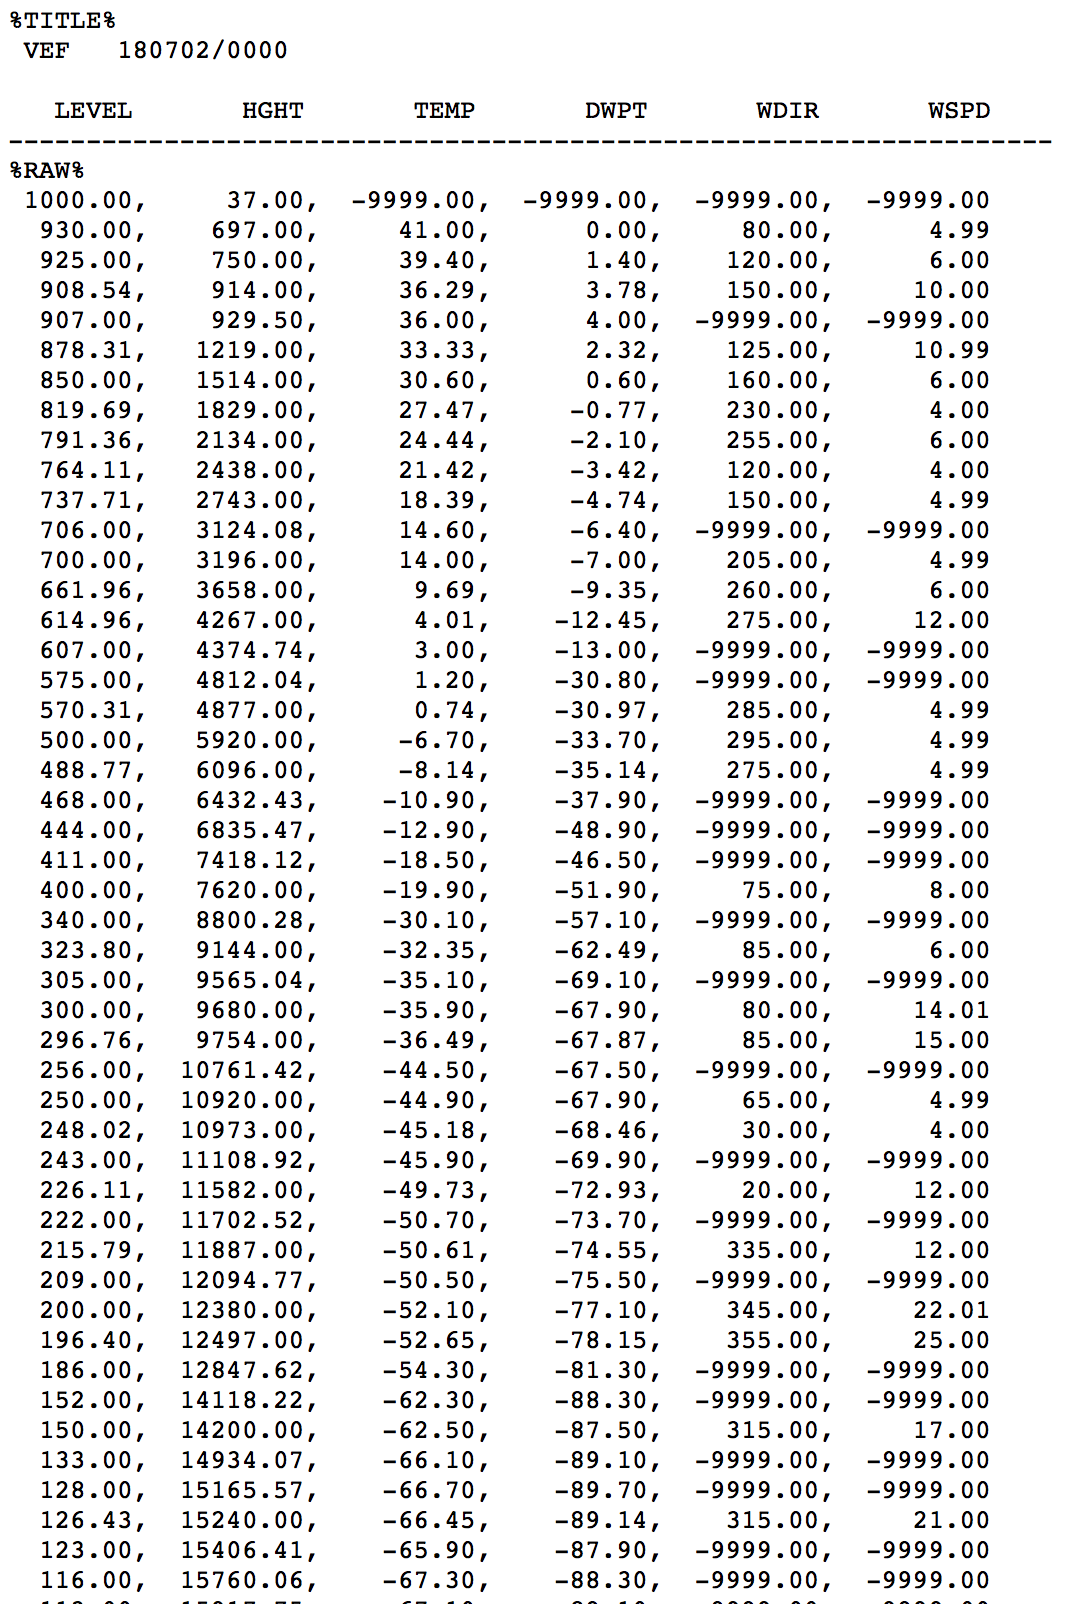
July 2
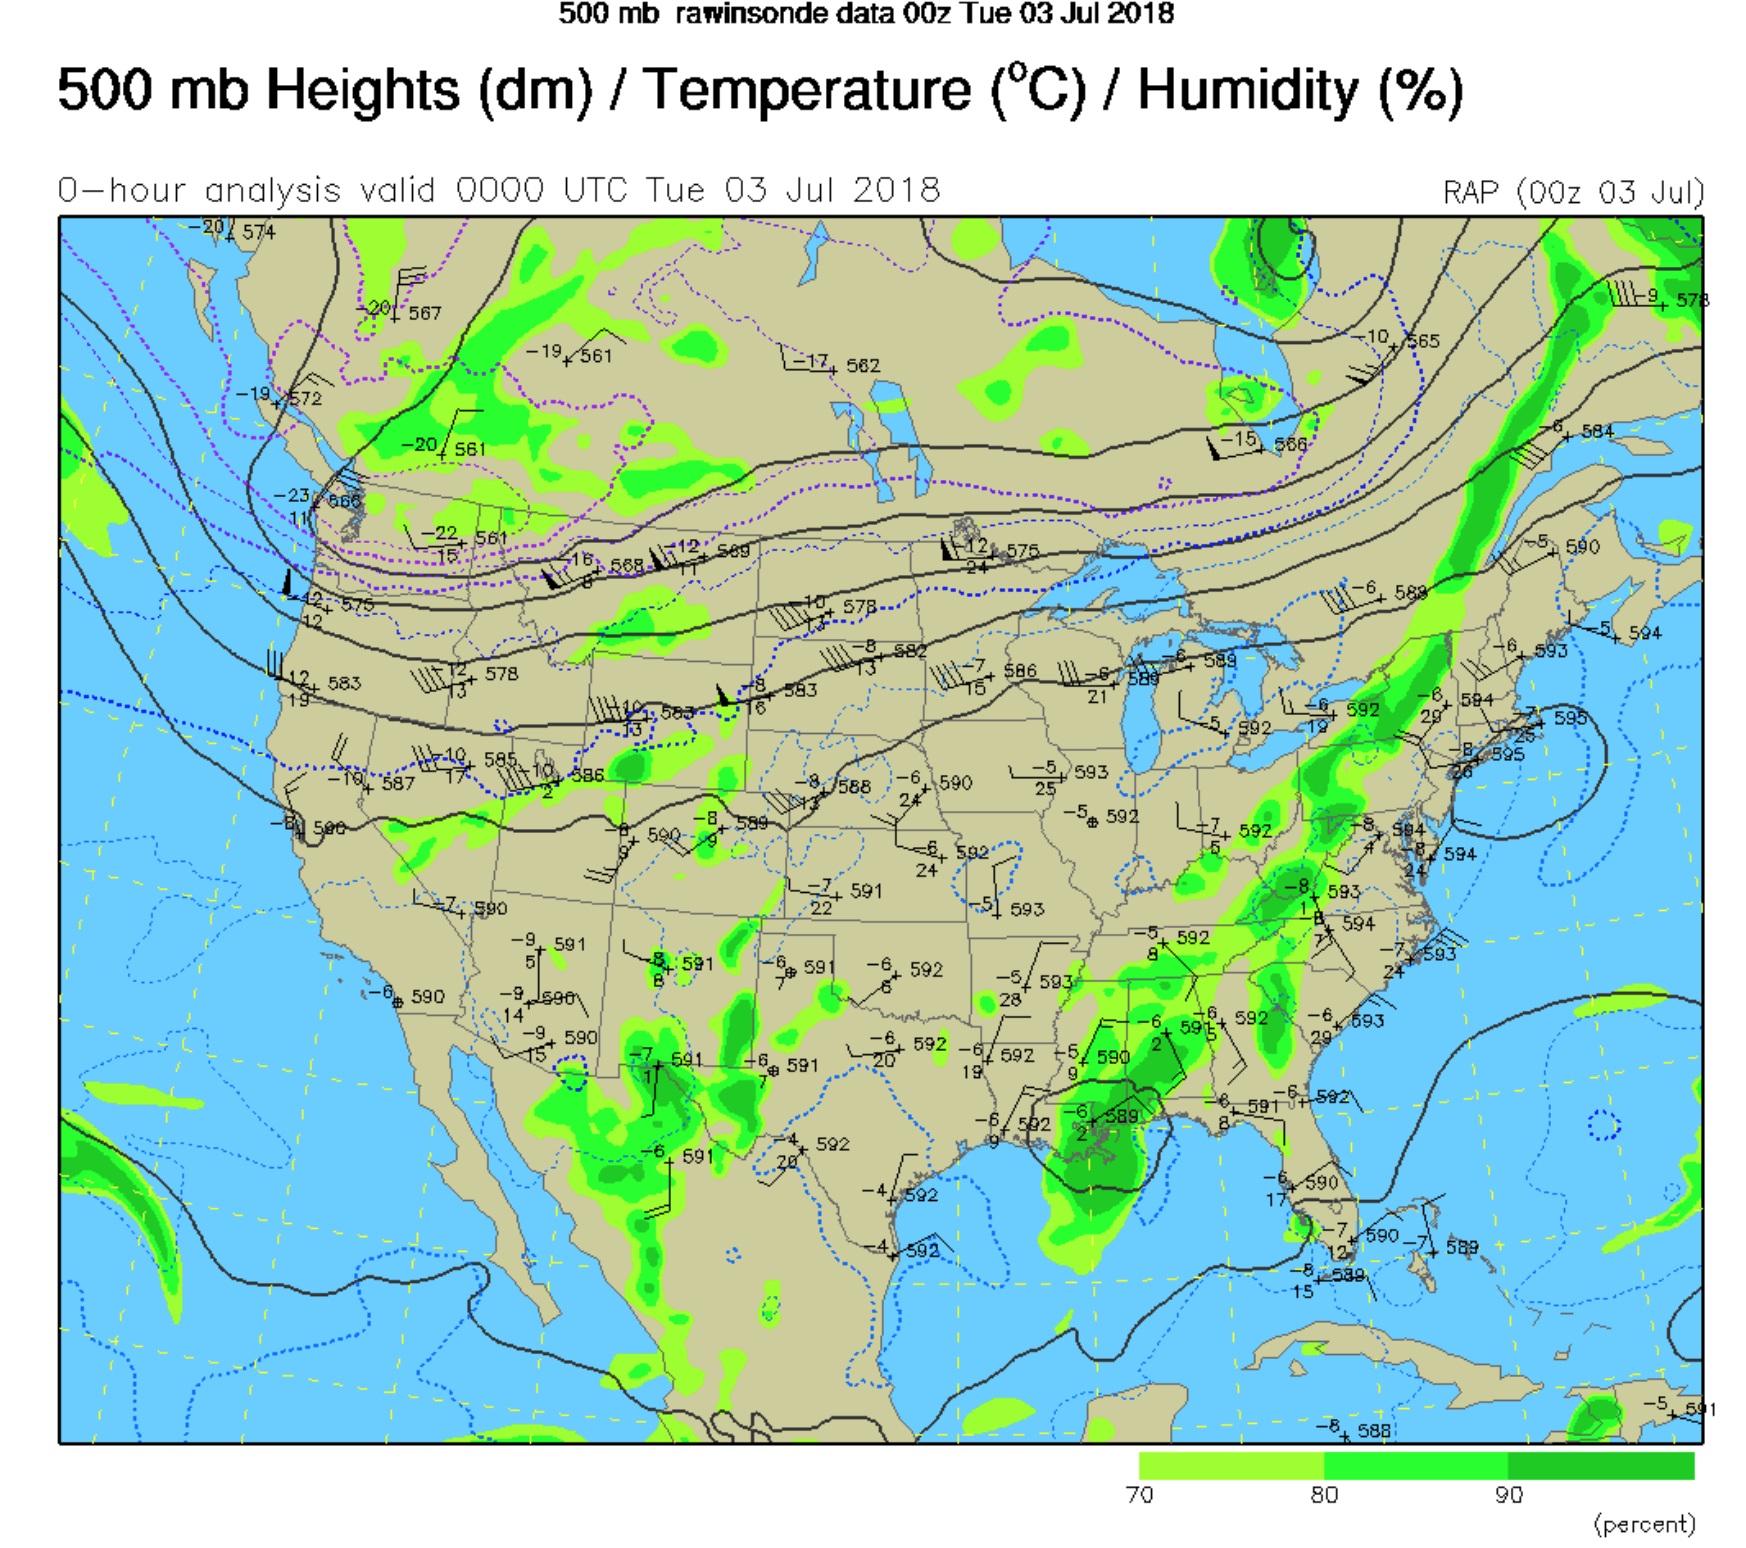
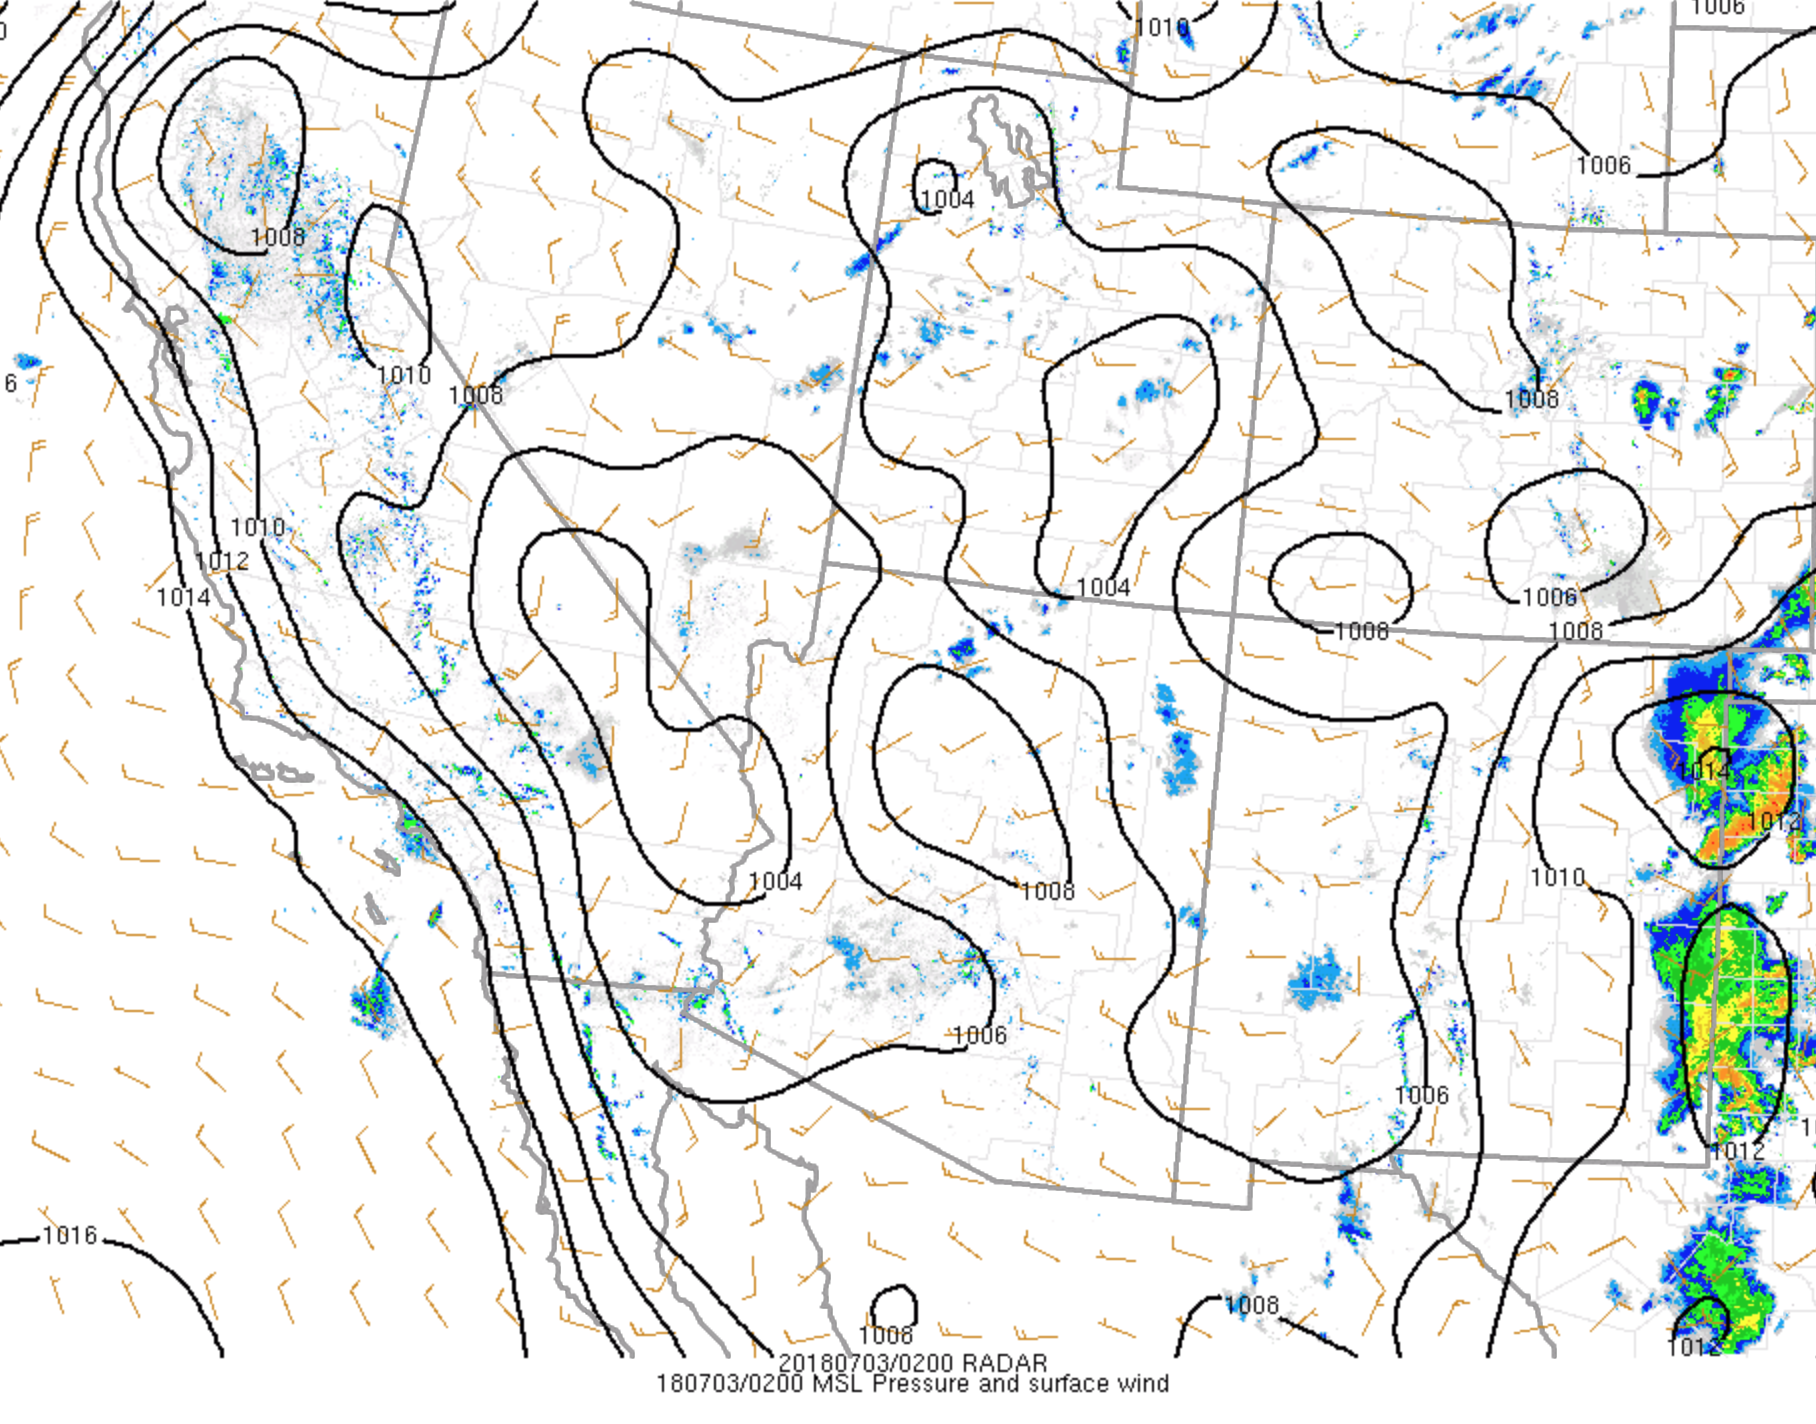
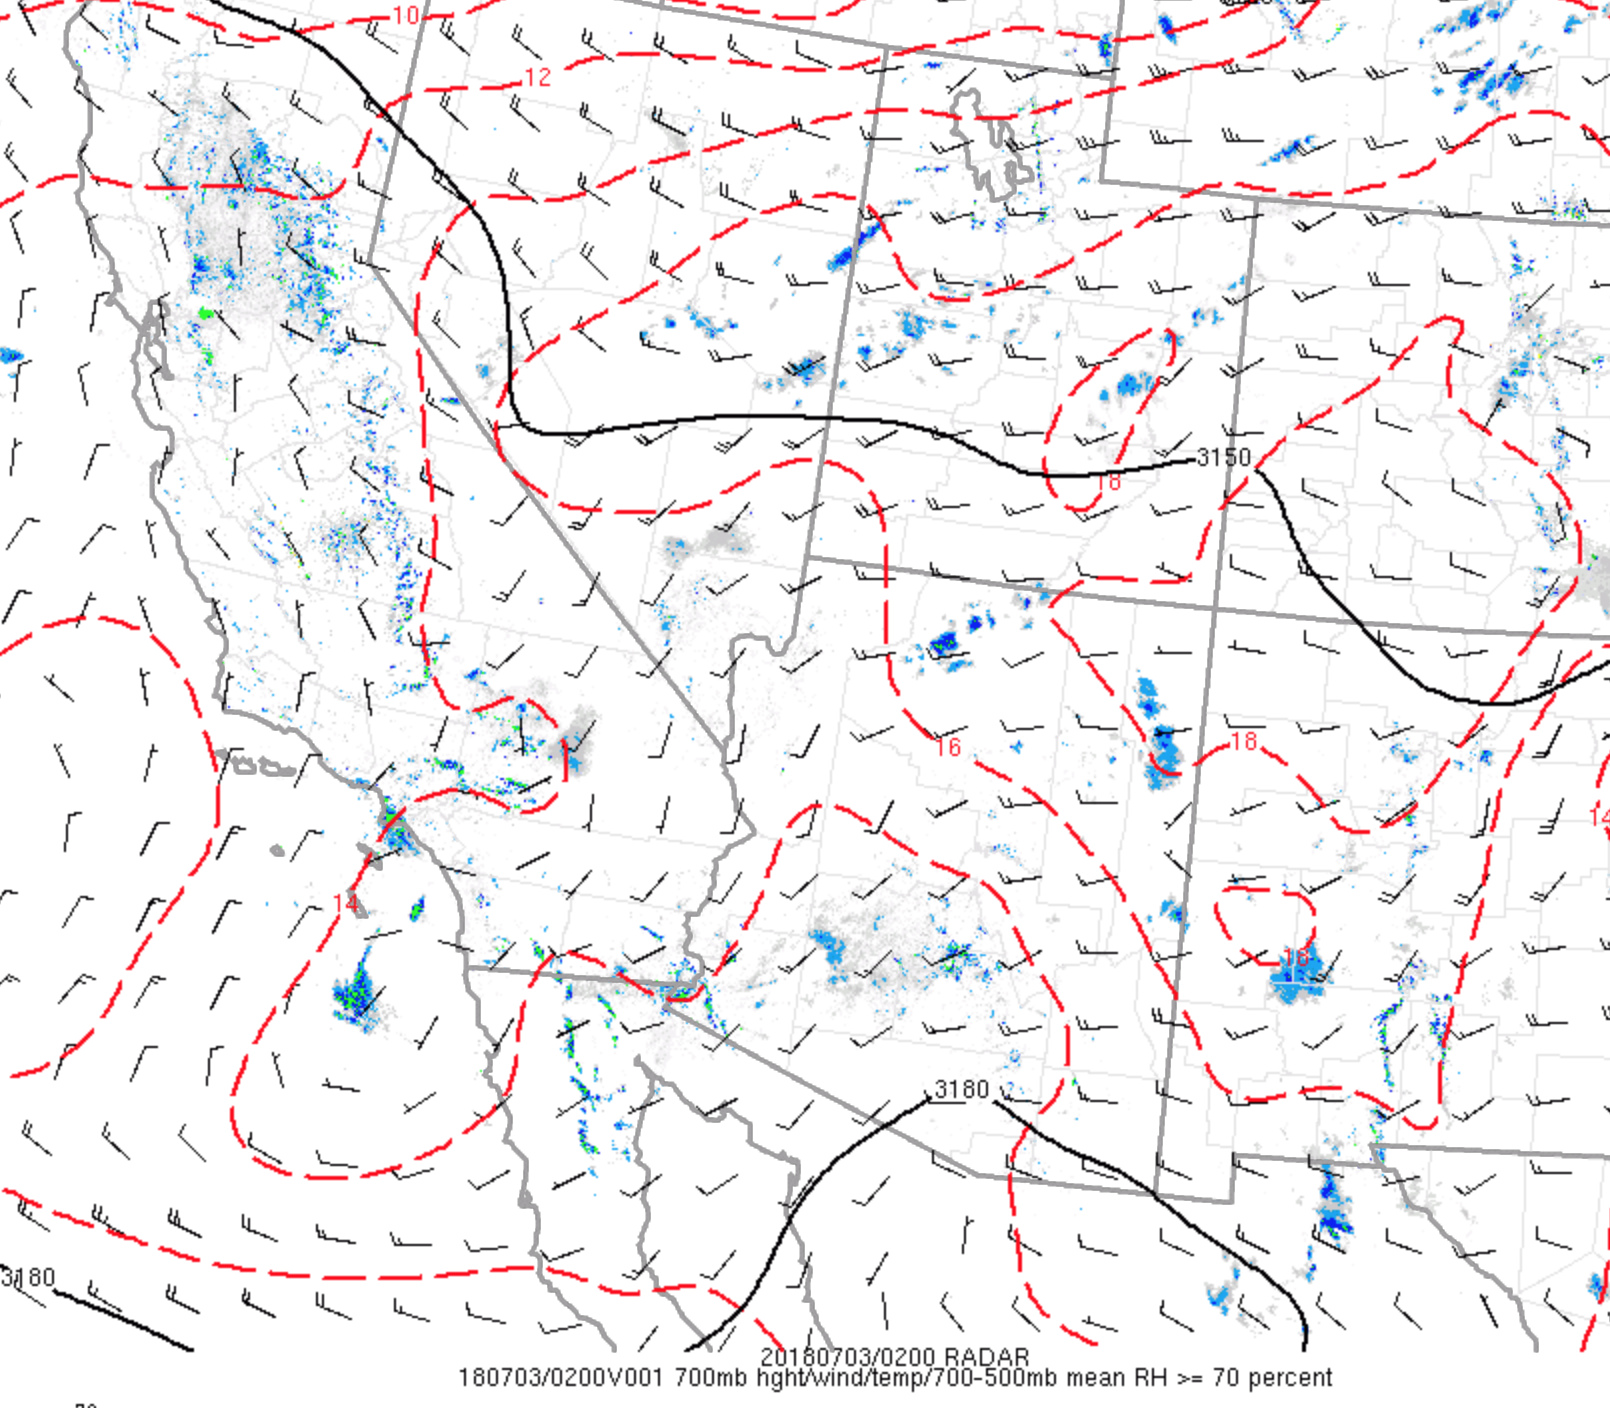
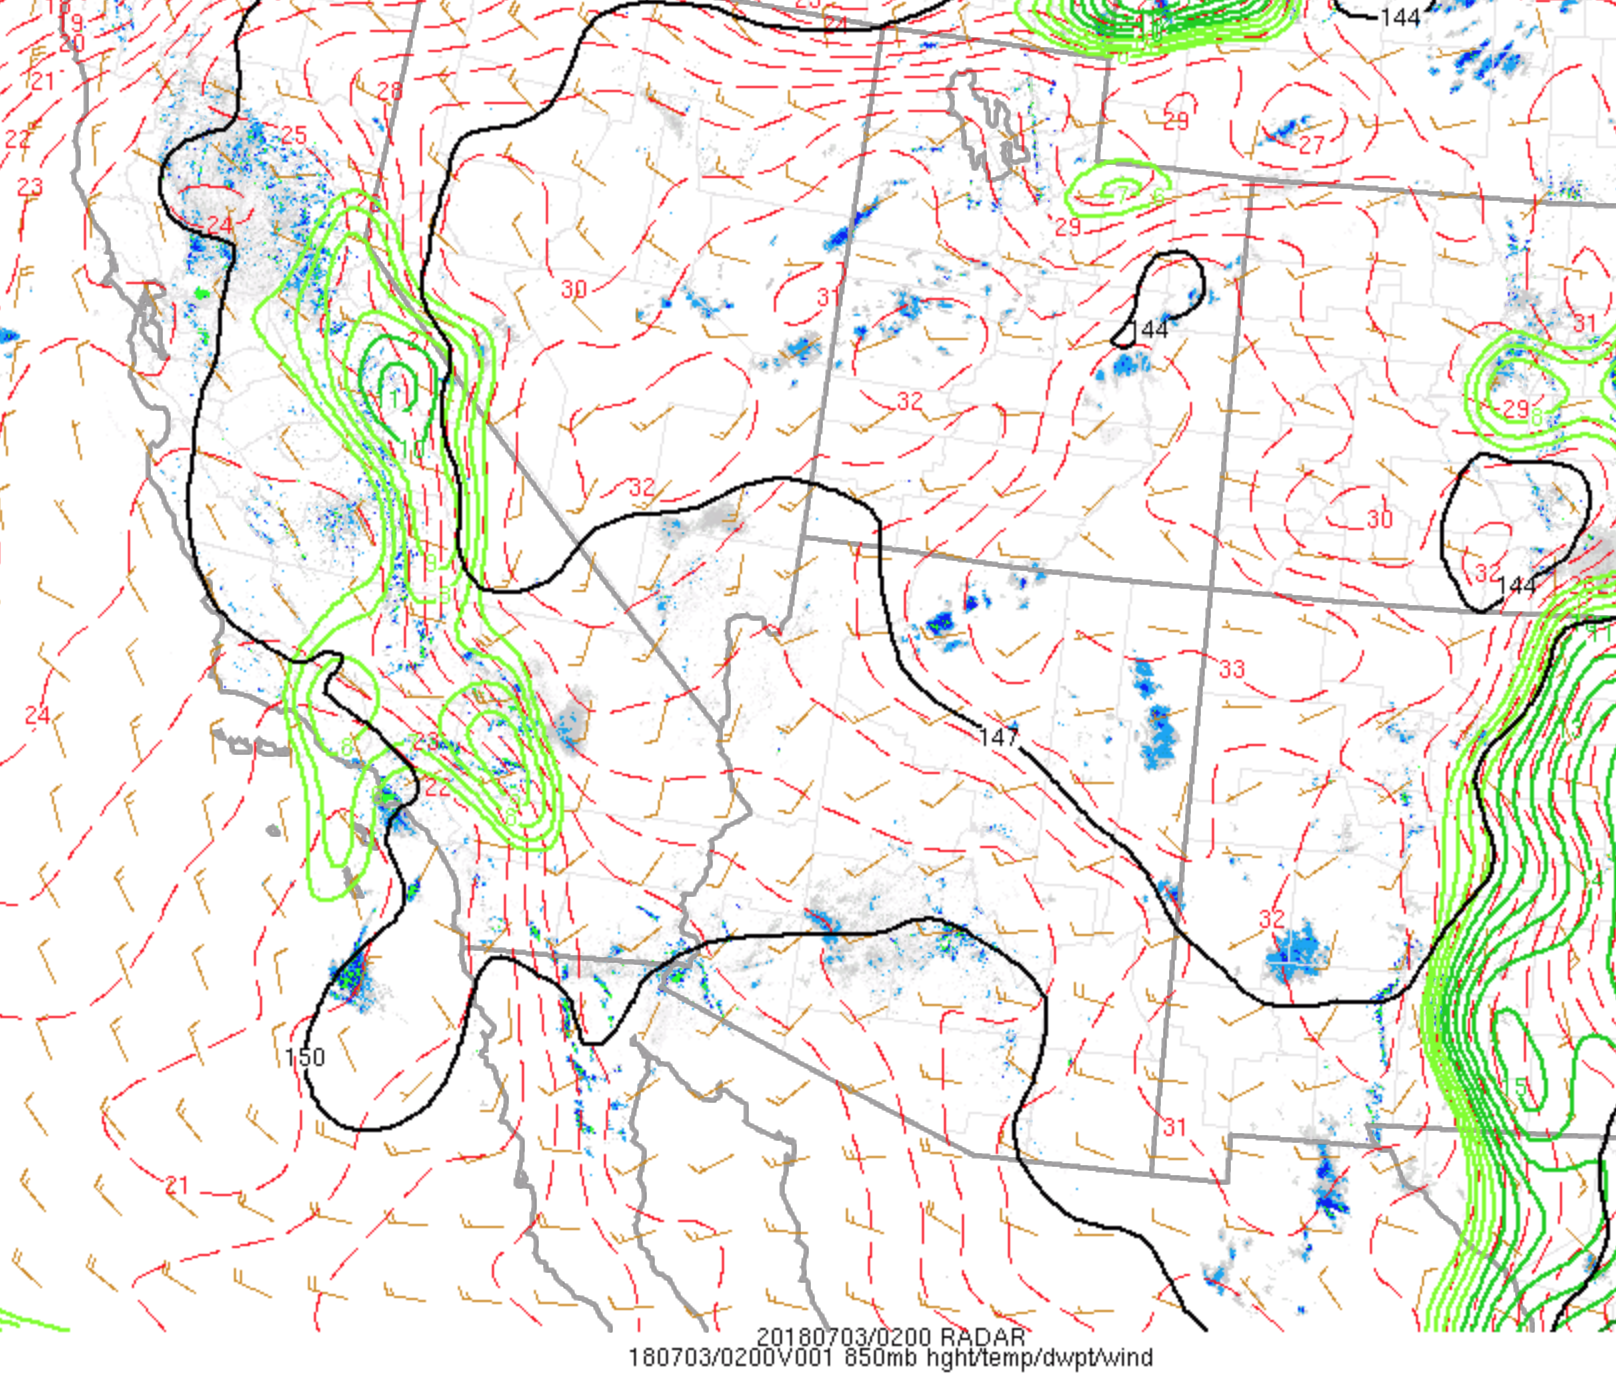
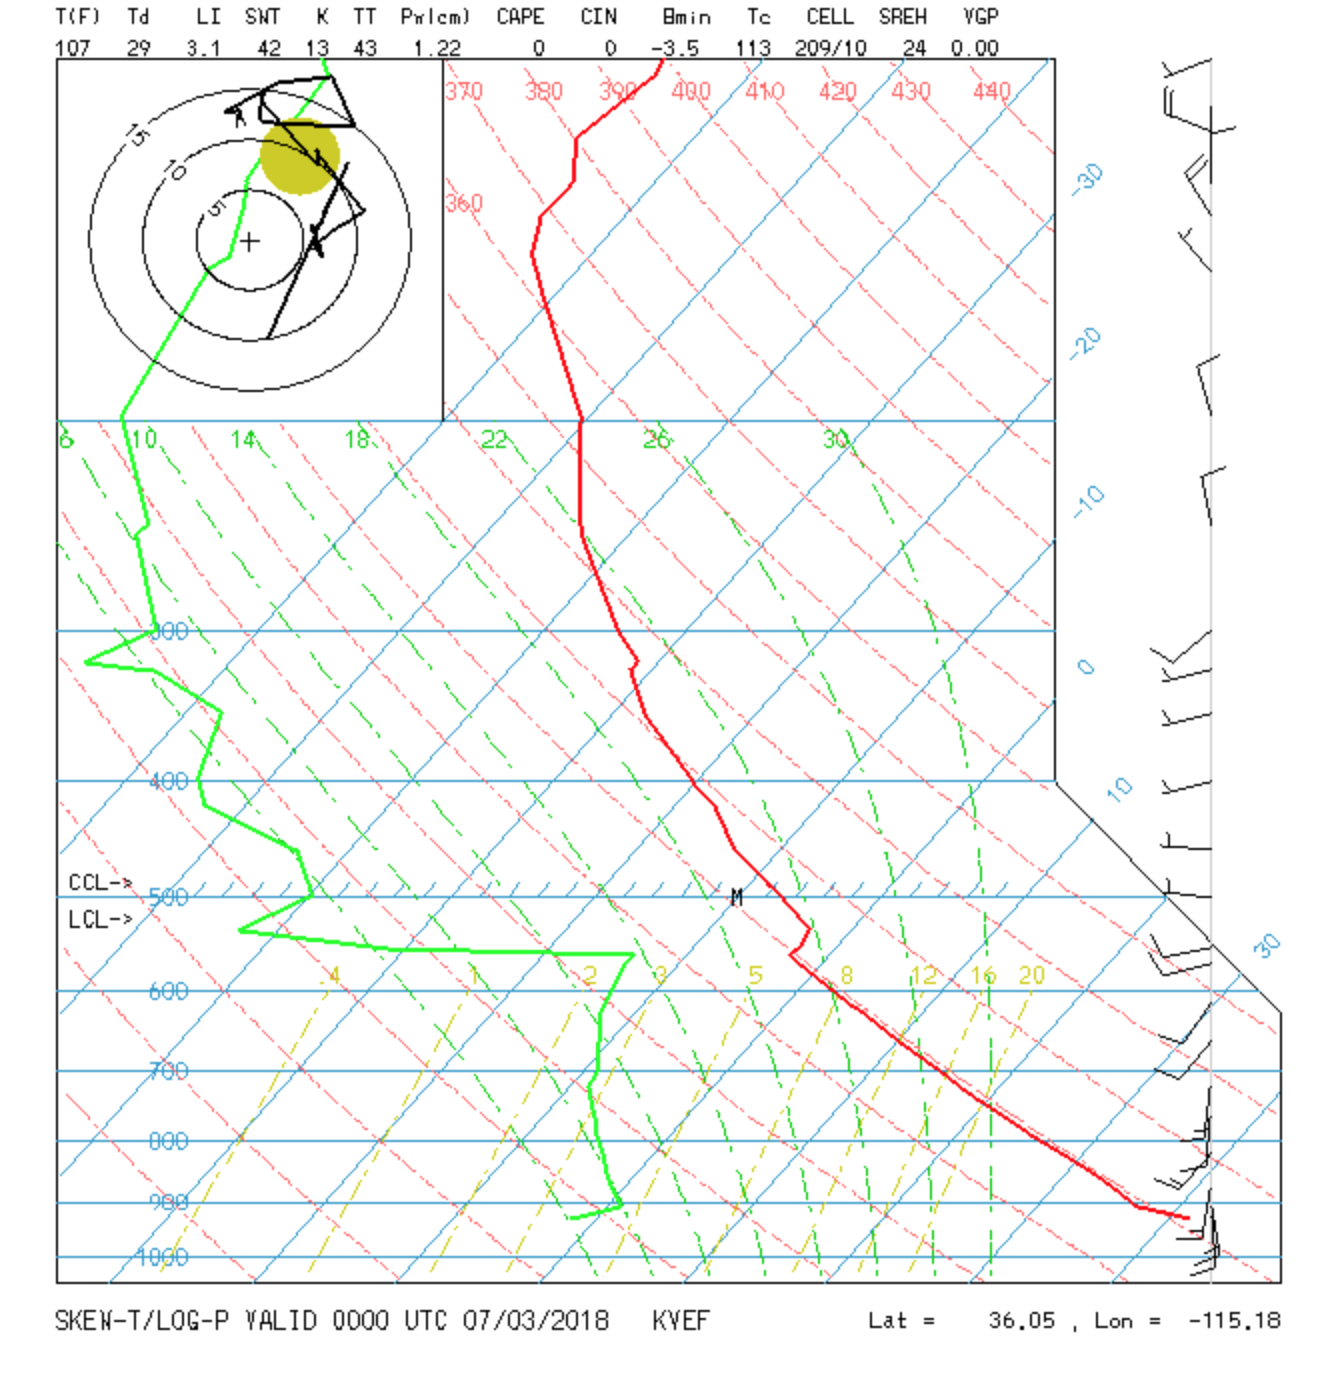
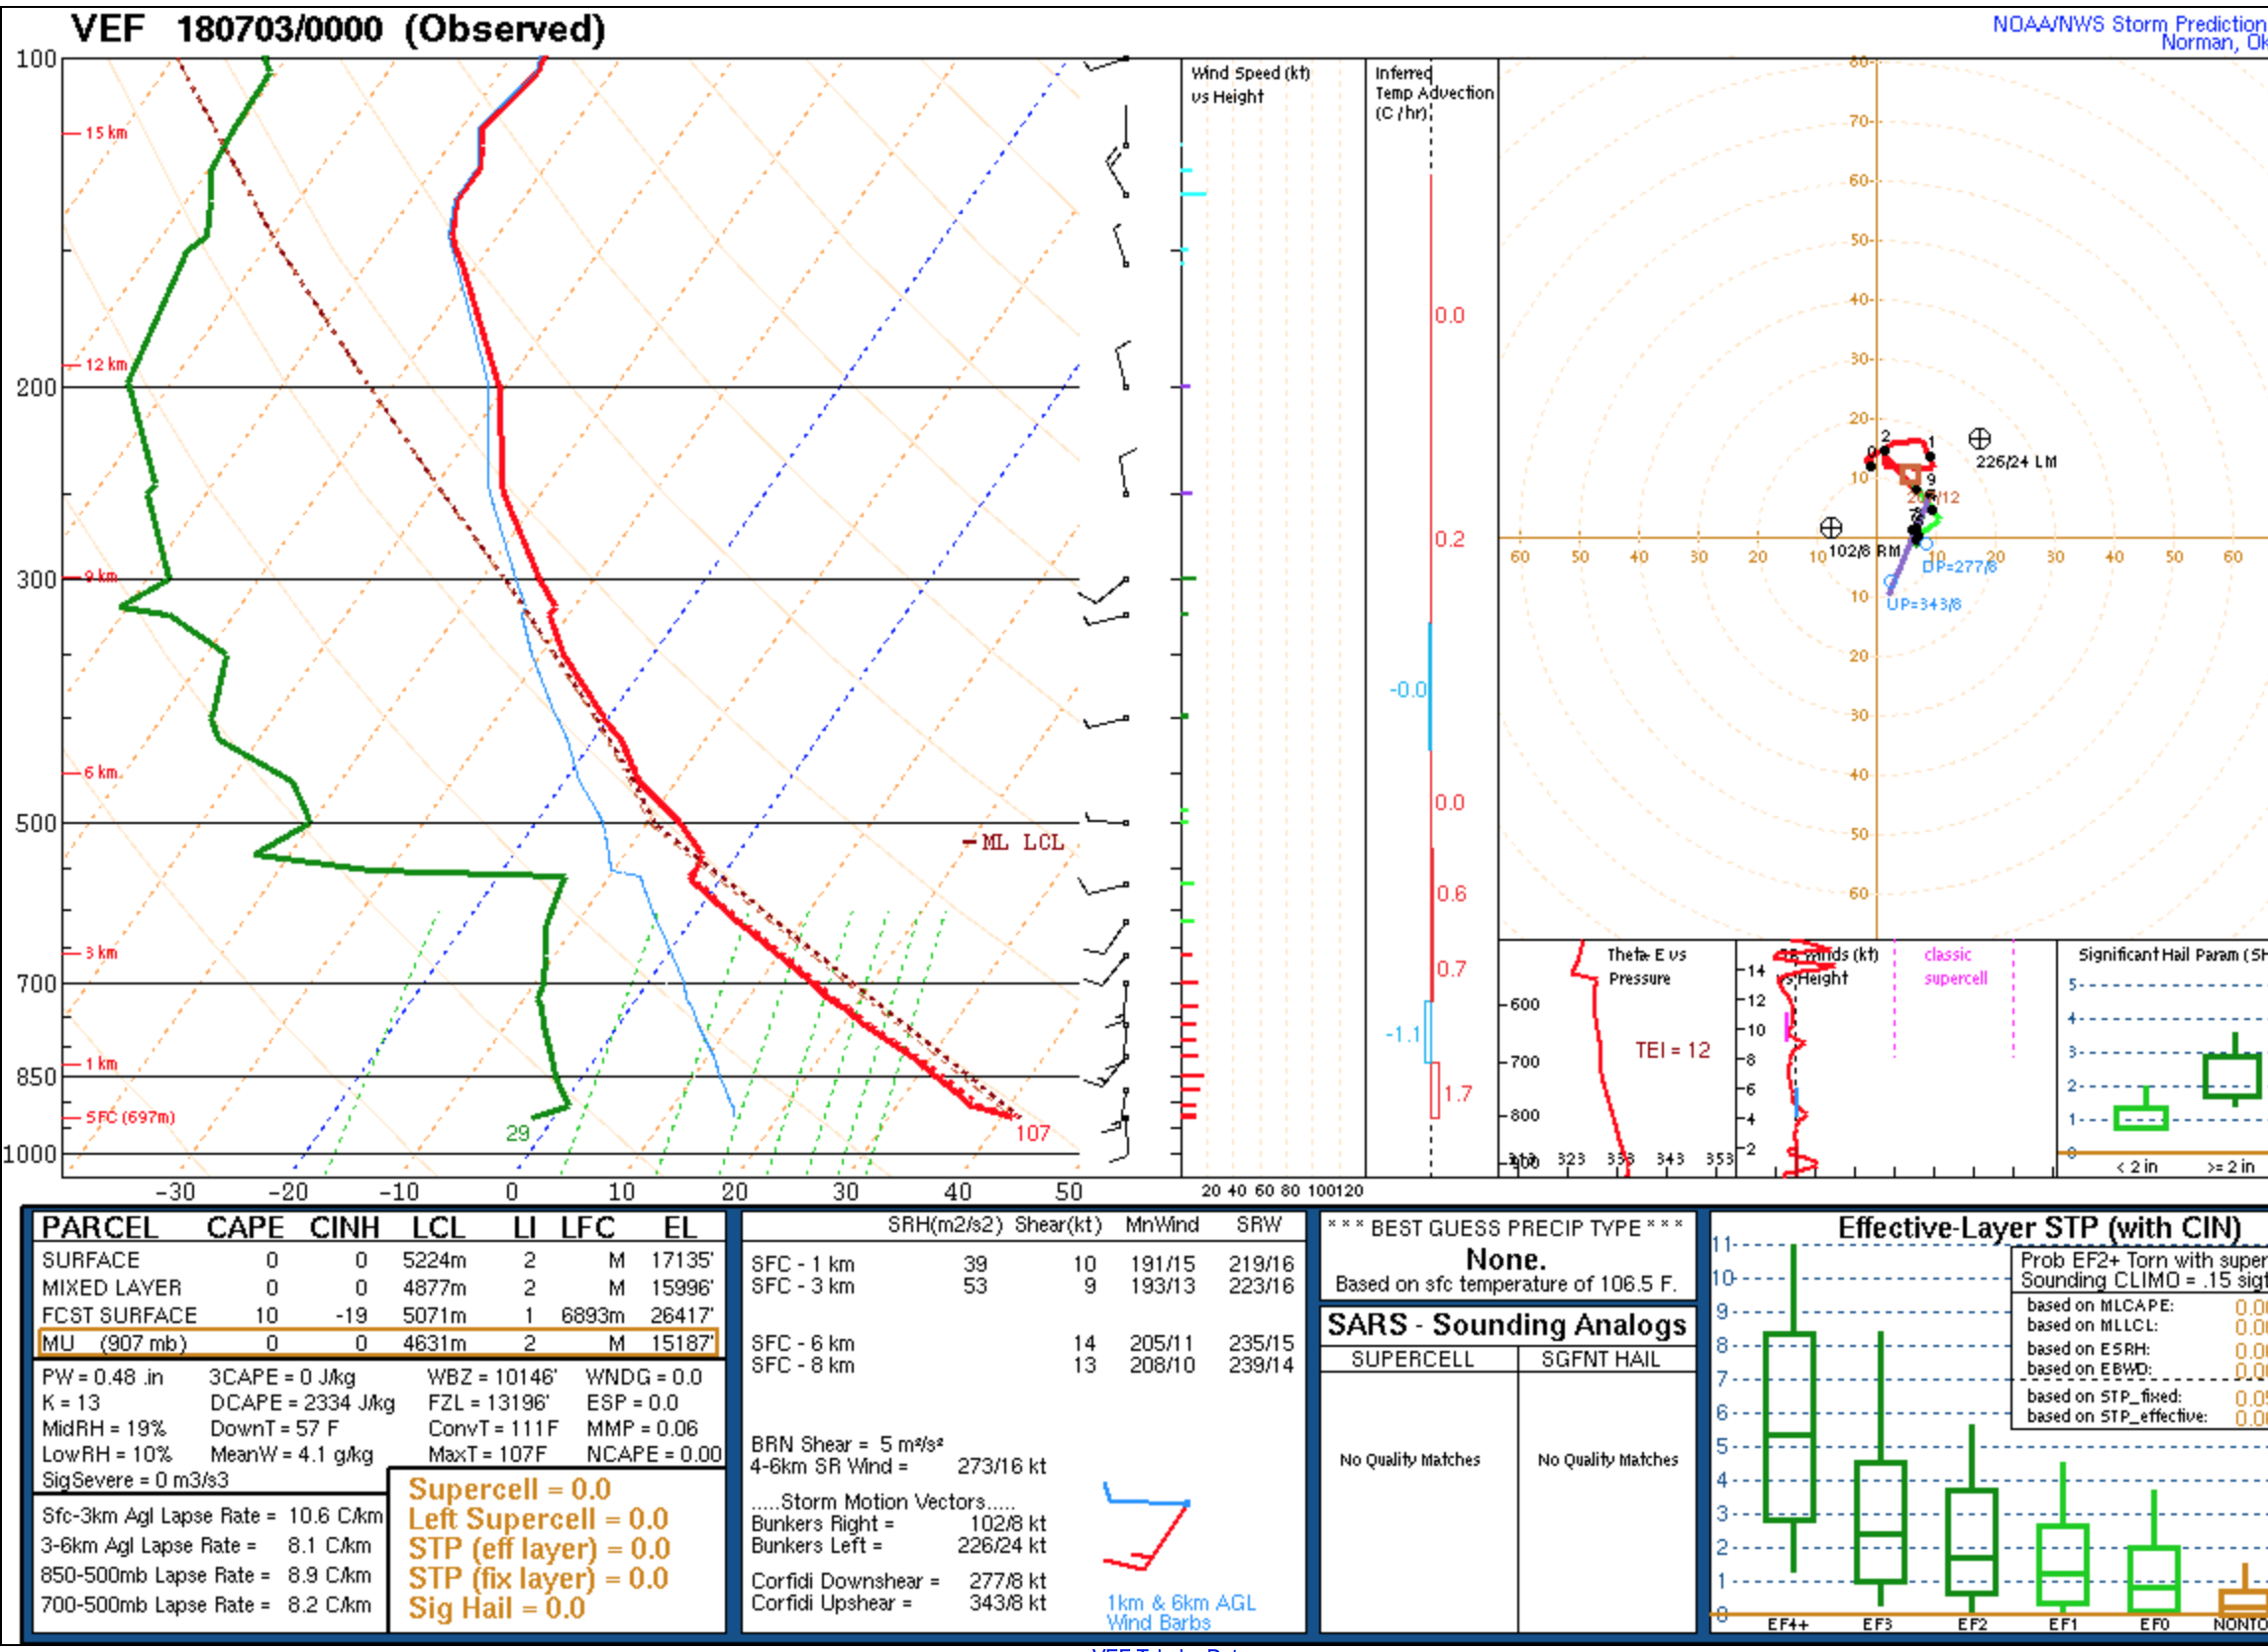
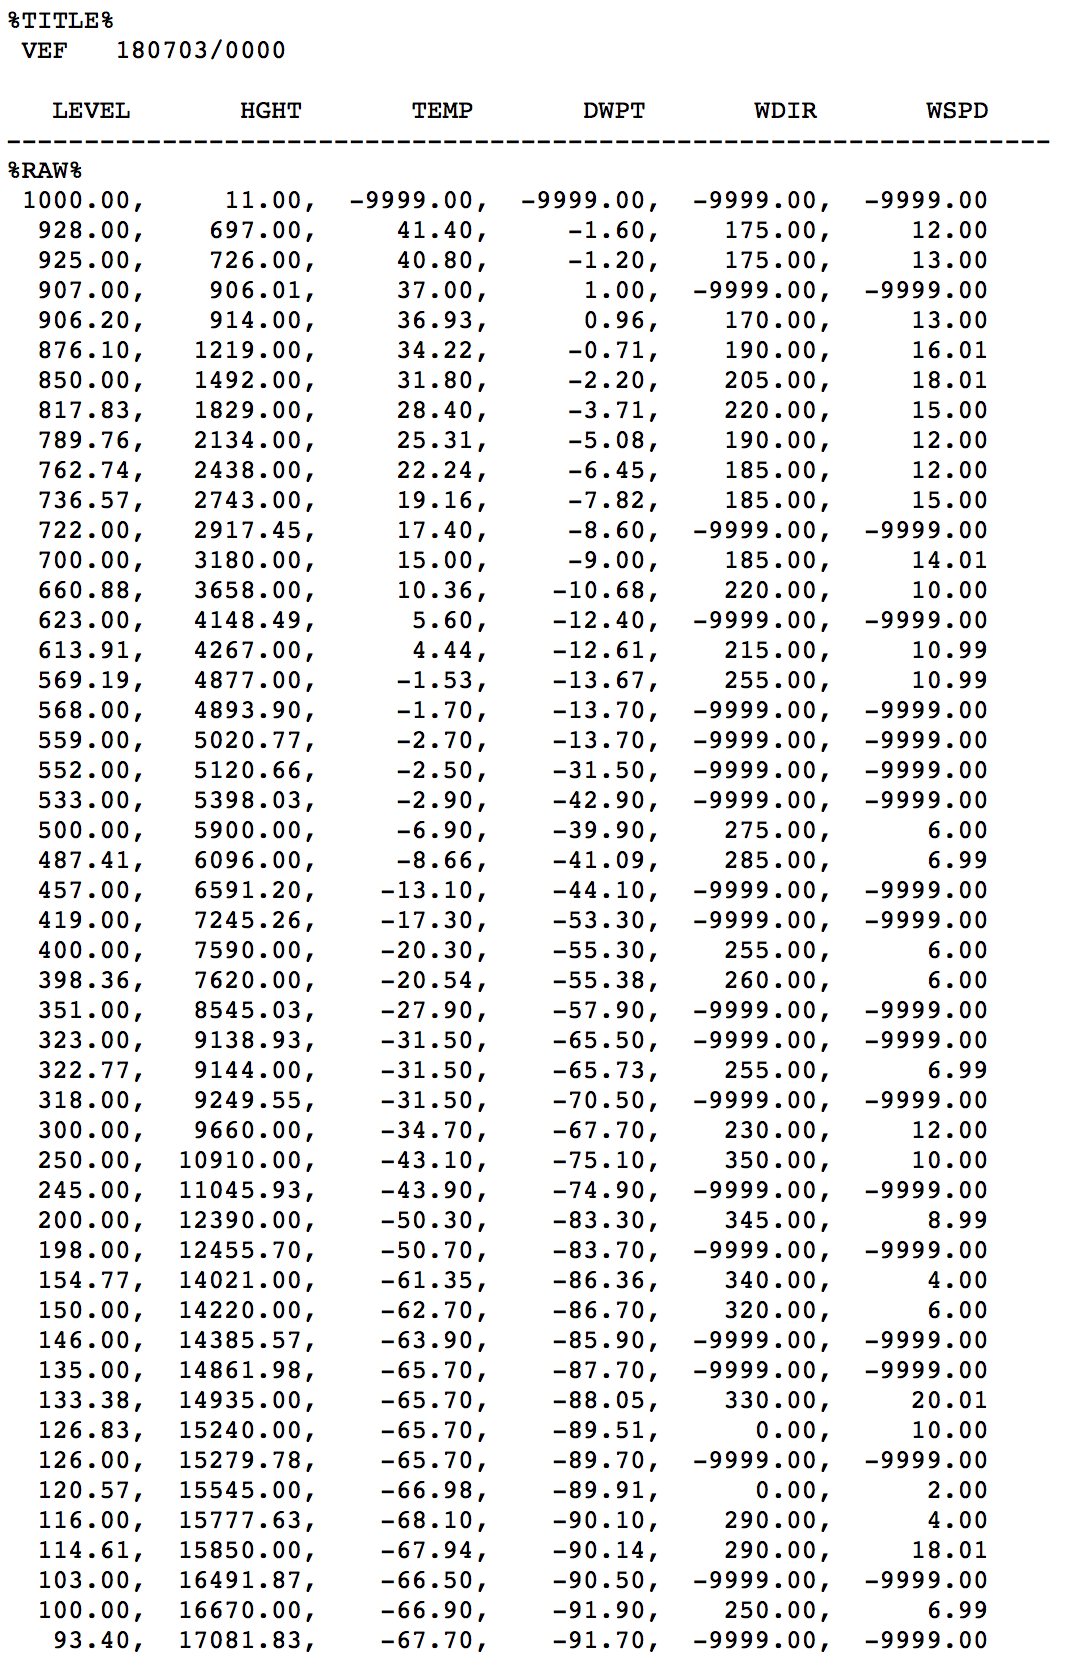
July 3
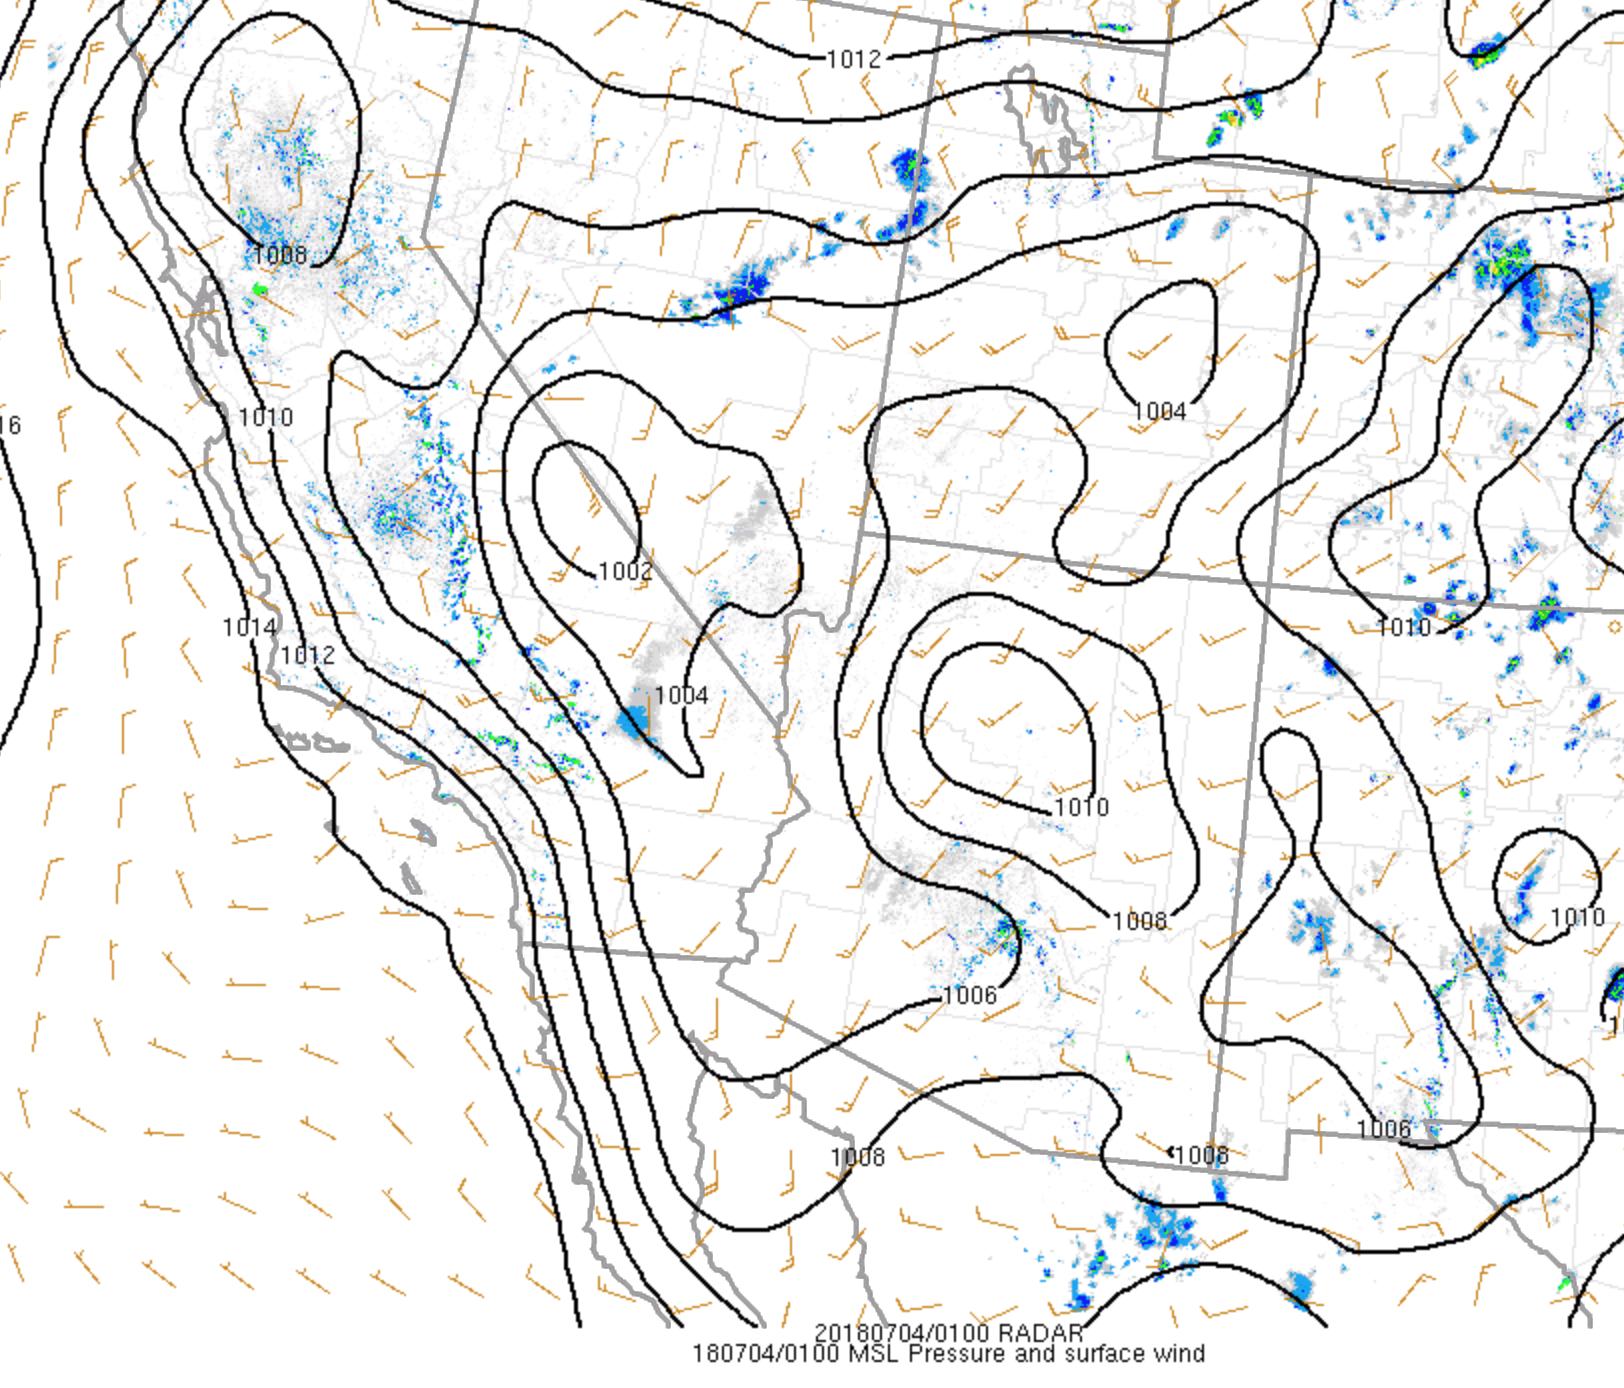
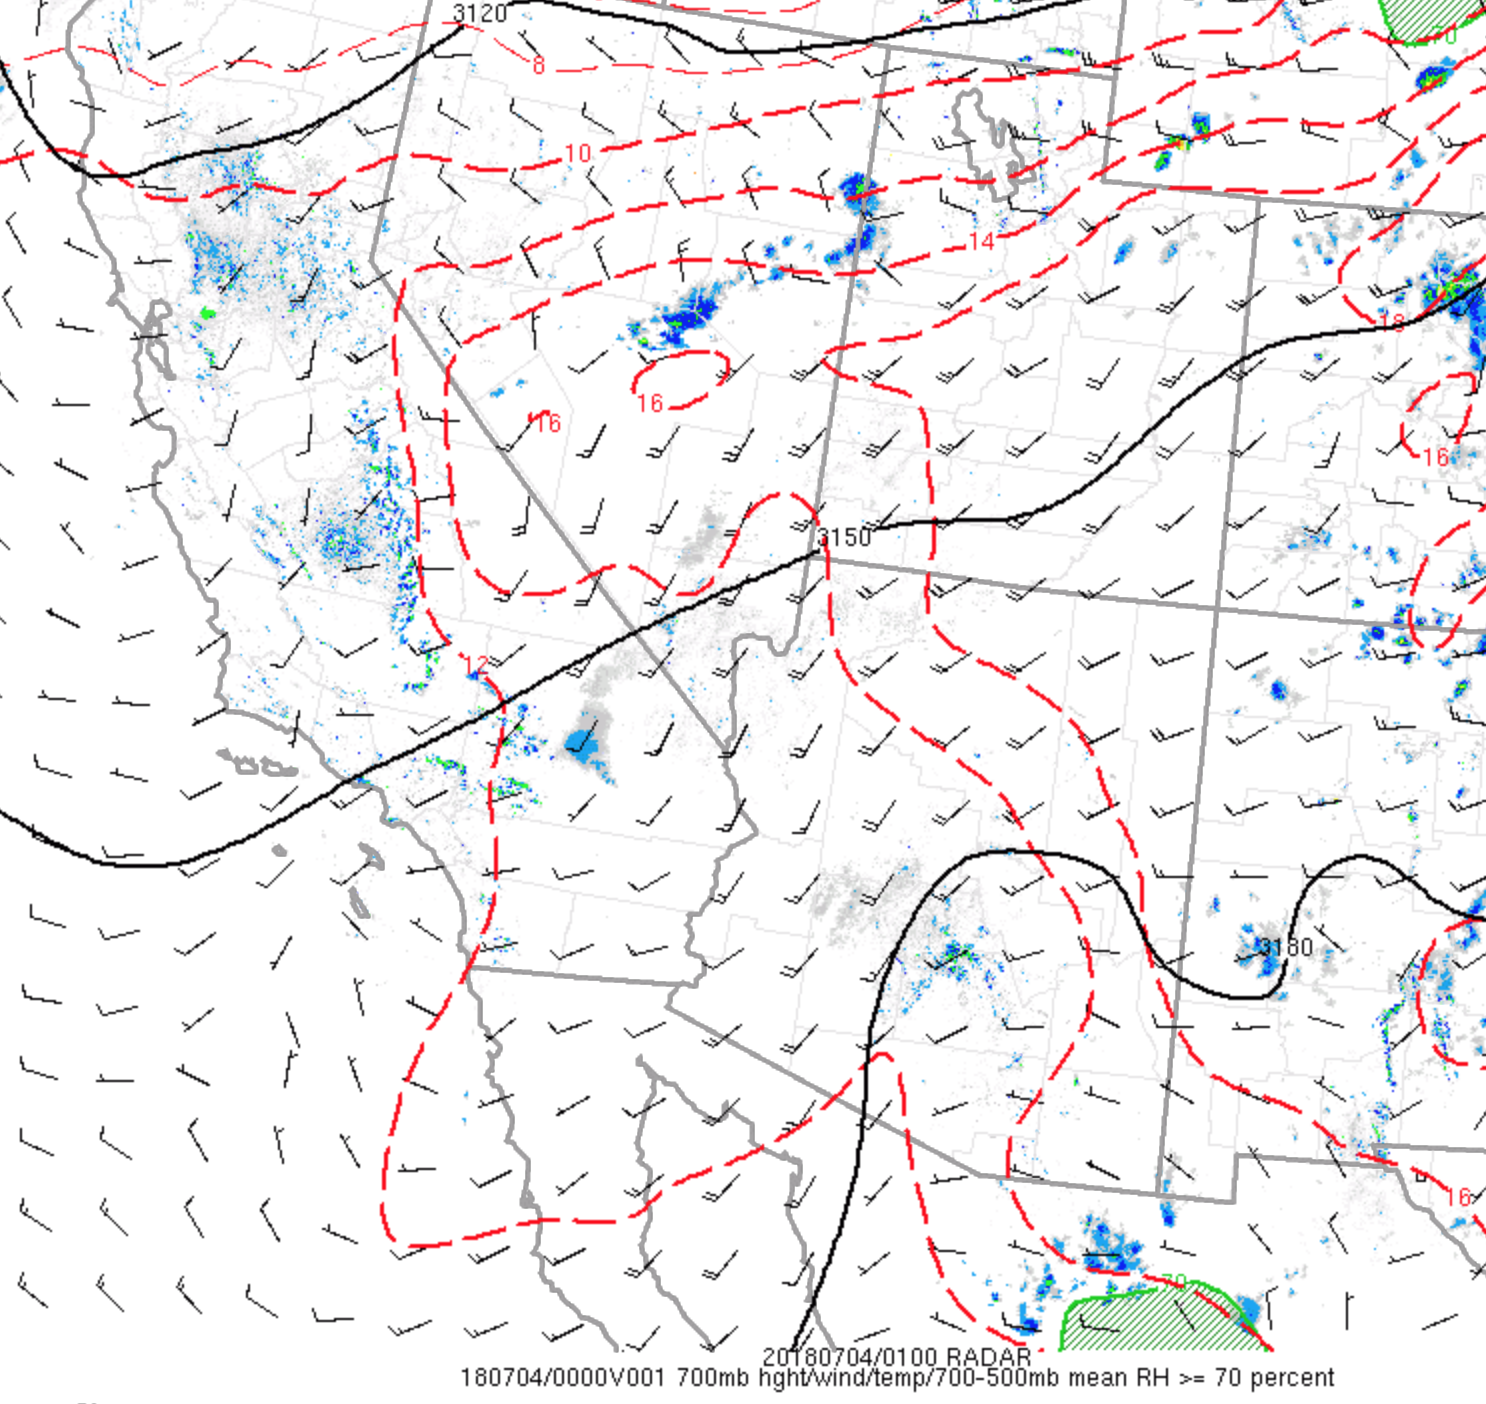
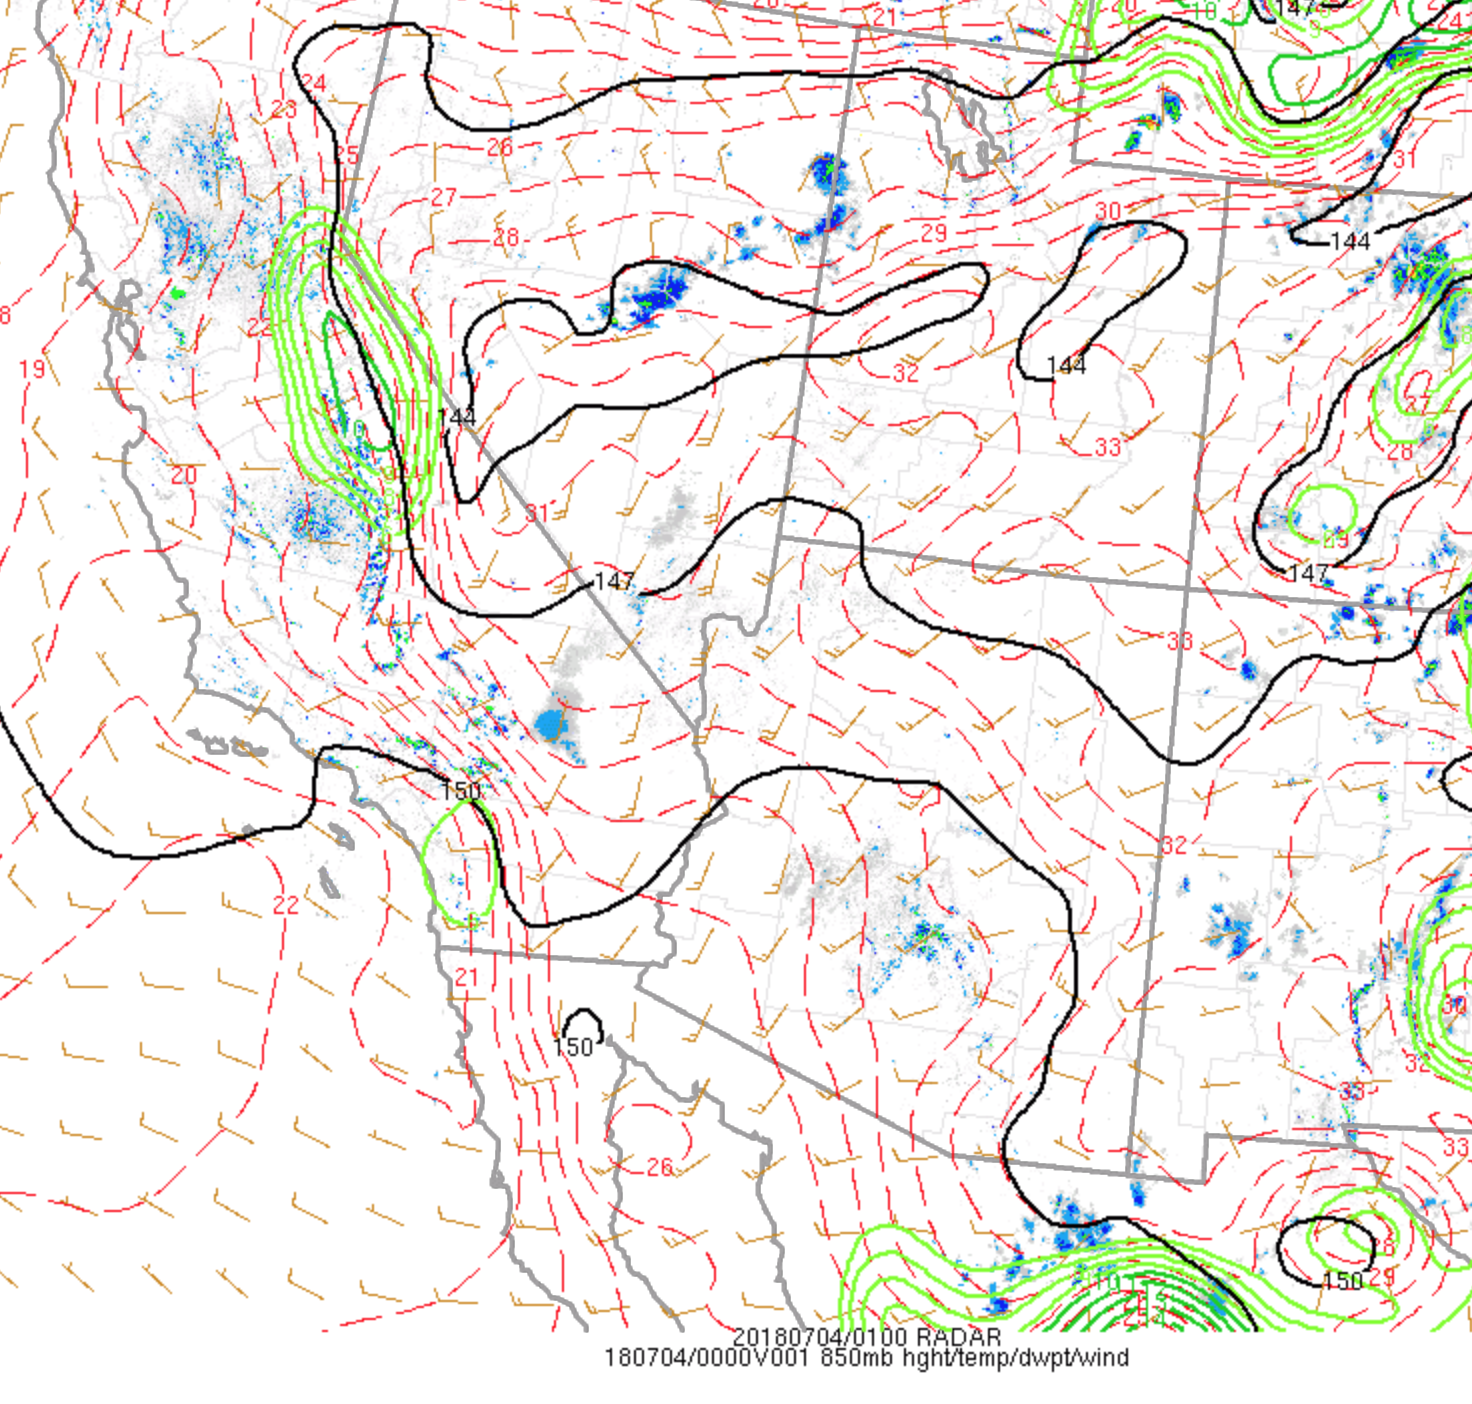

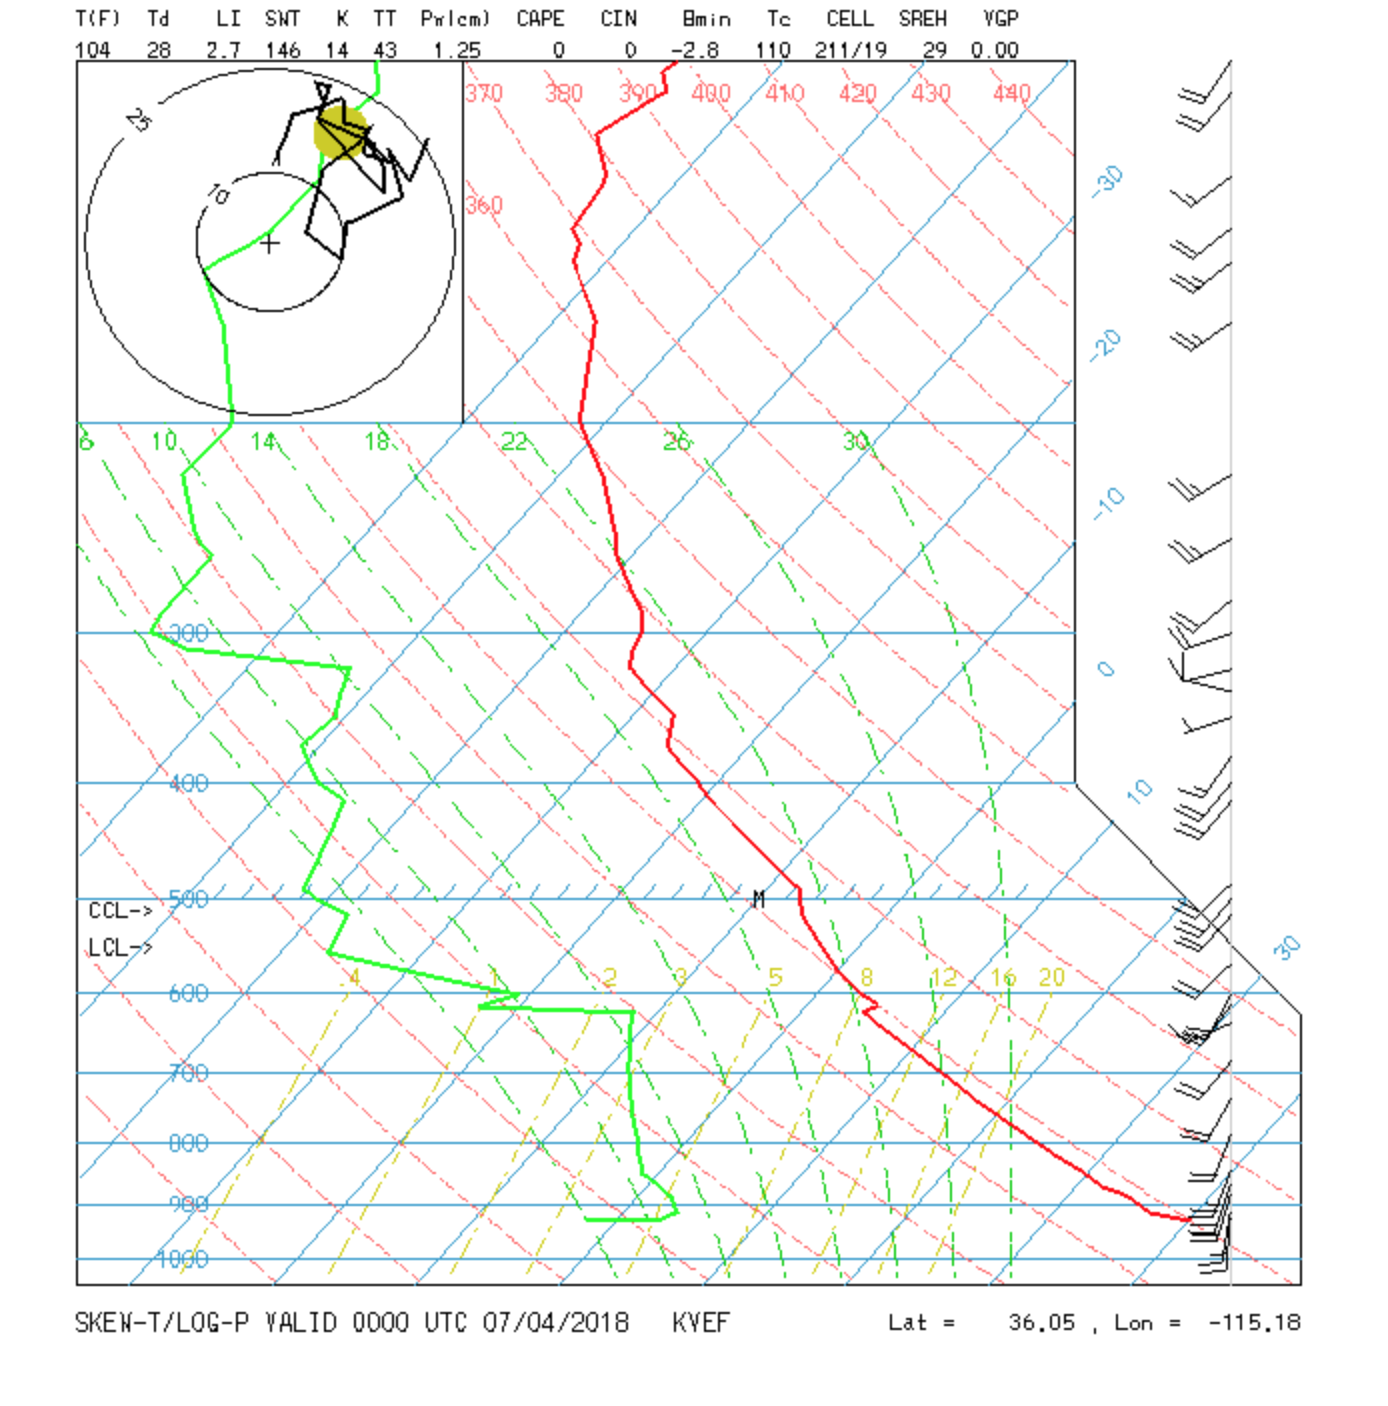
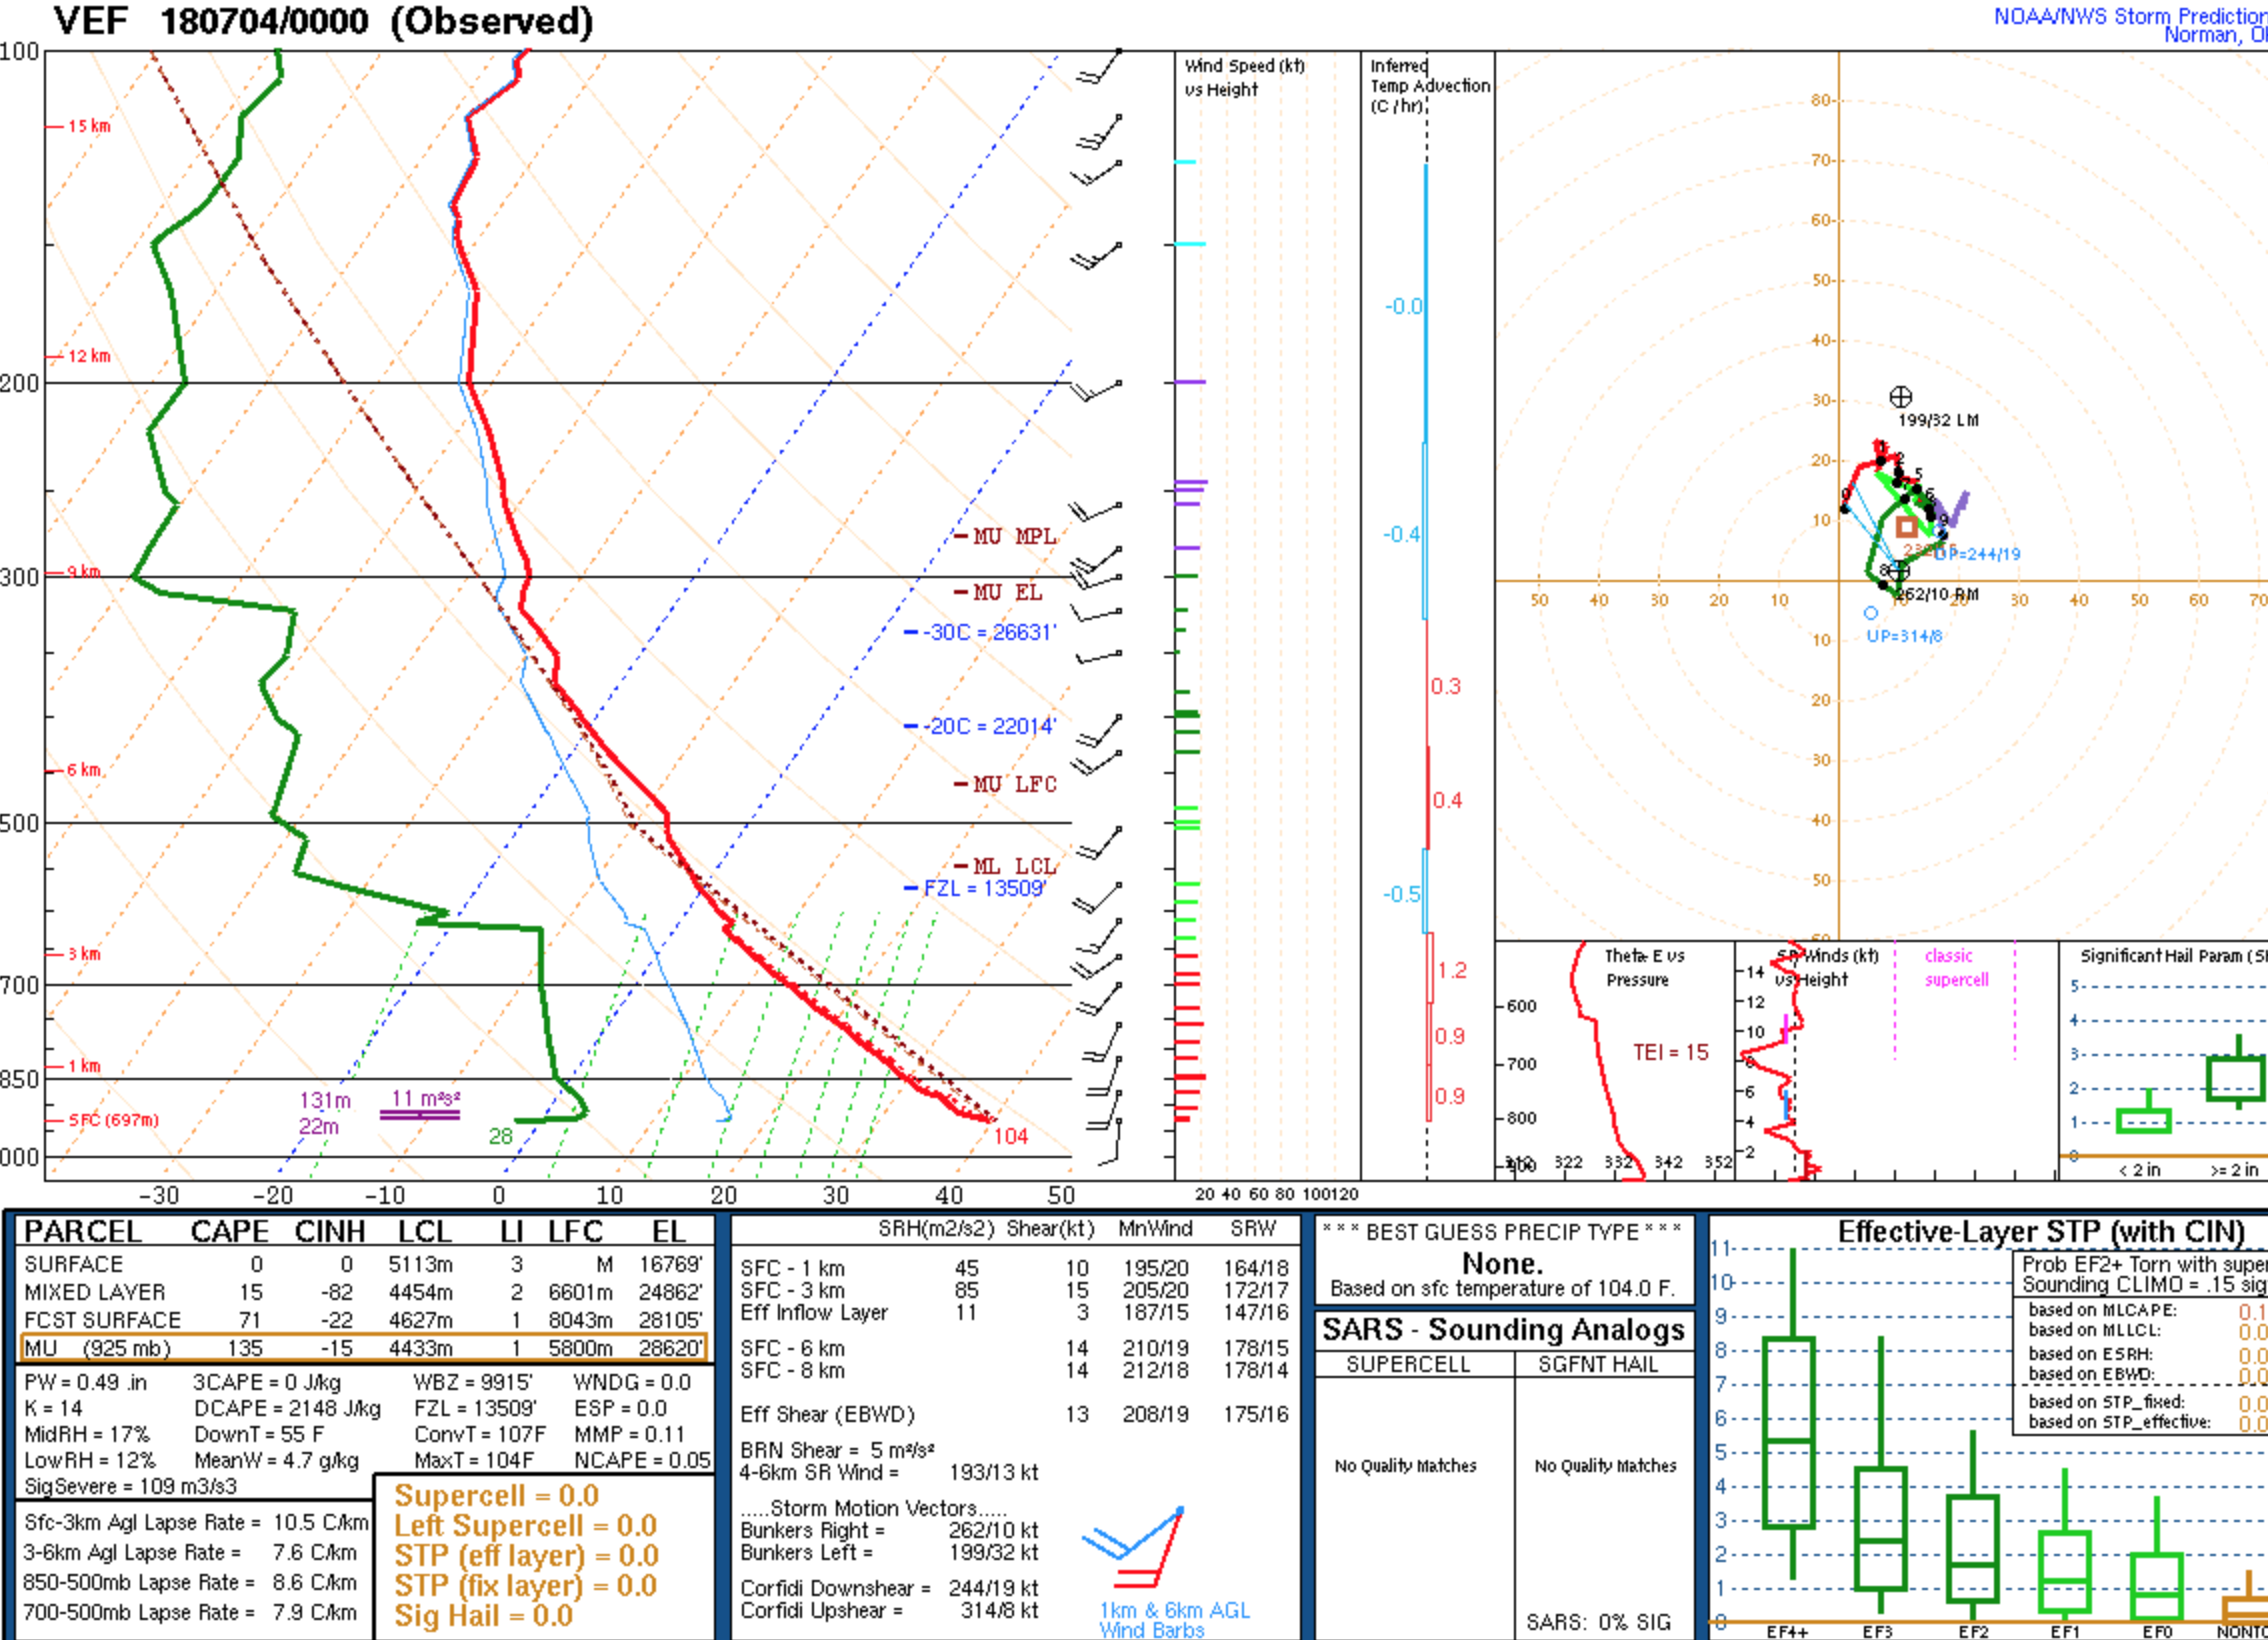
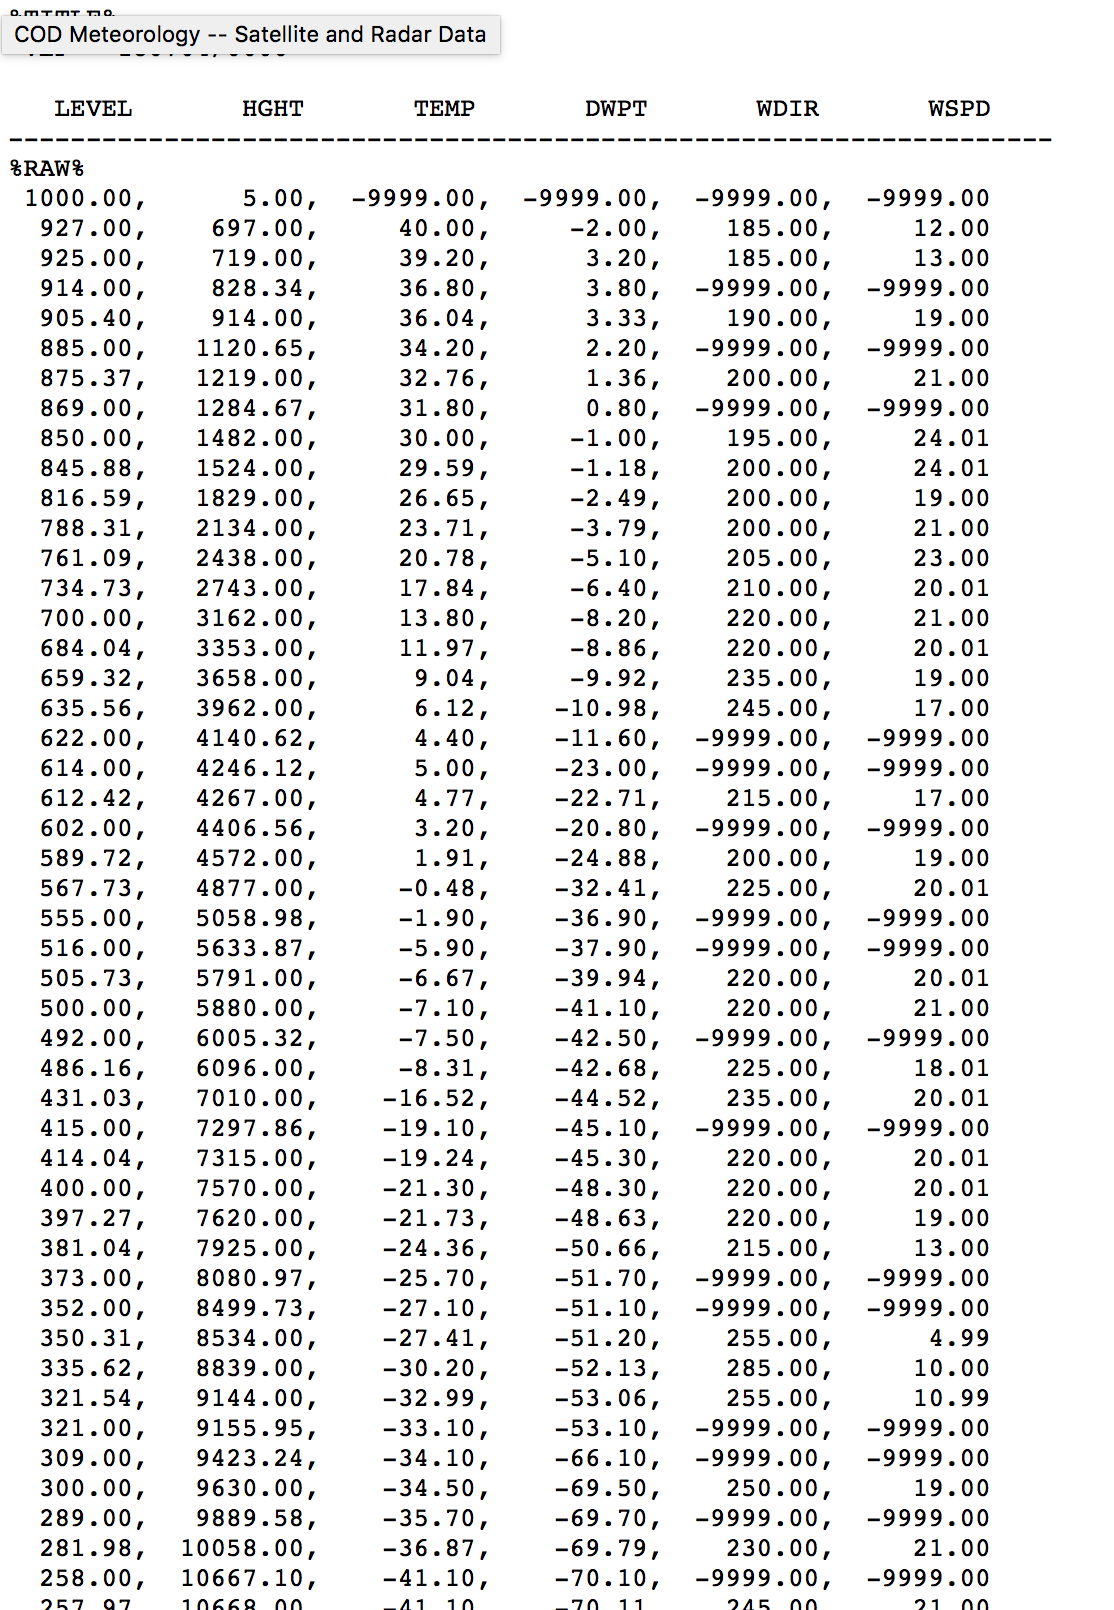
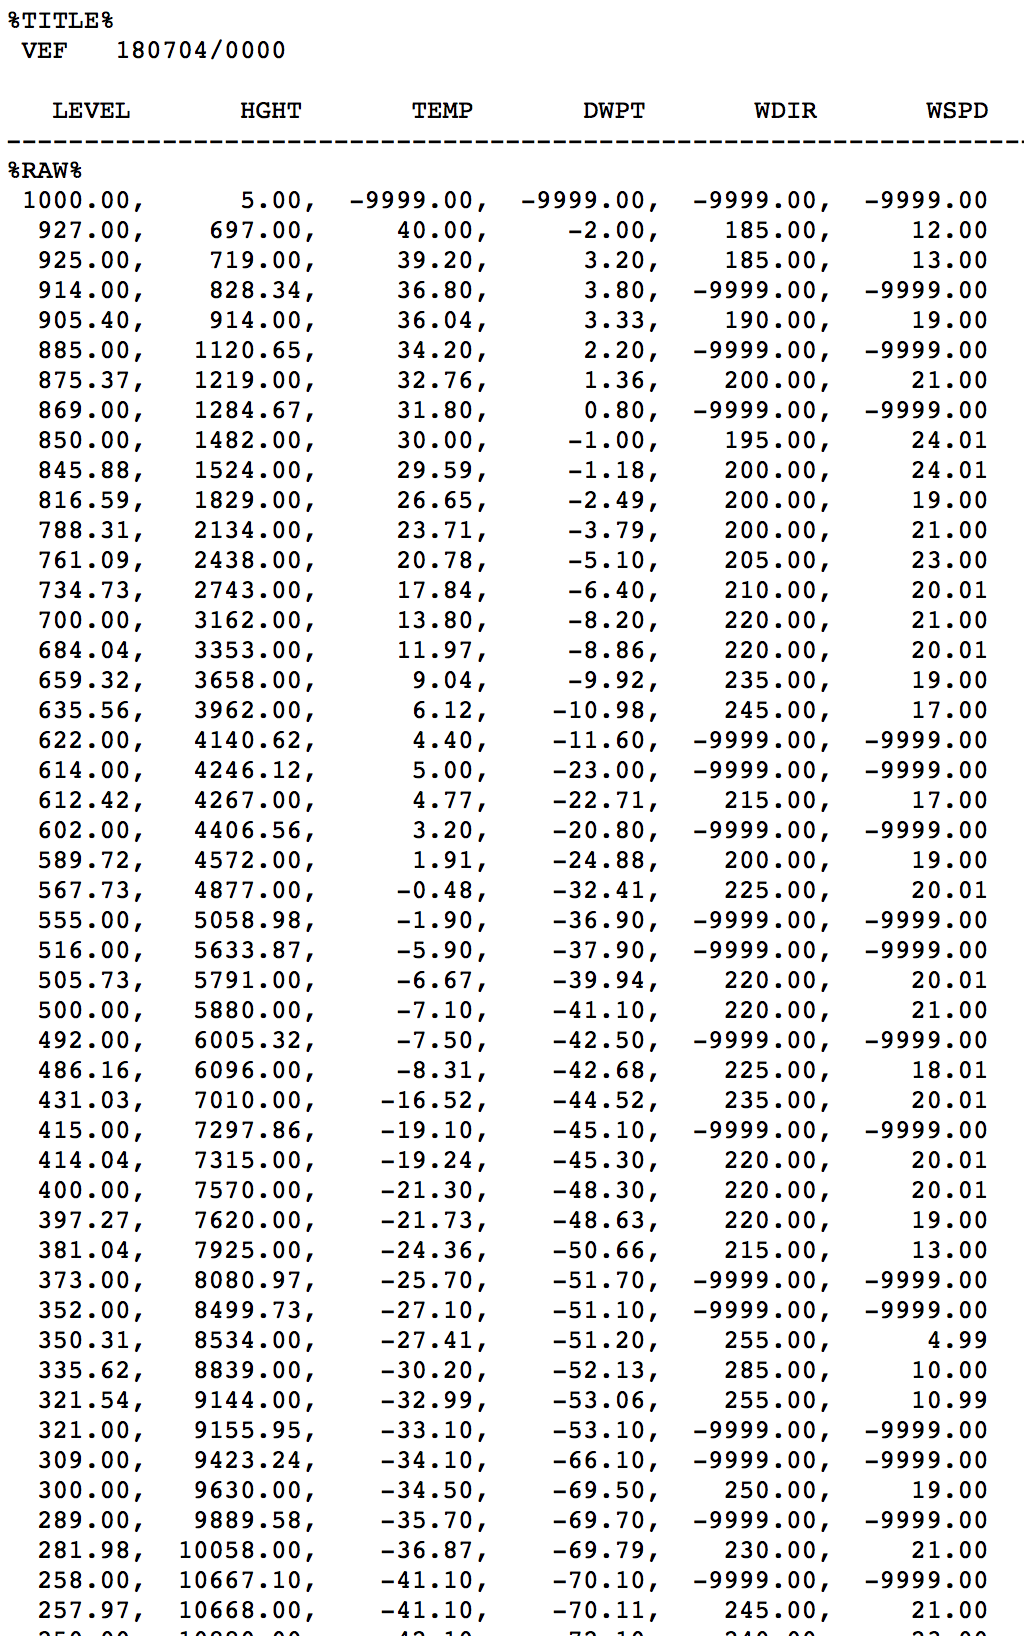
July 4
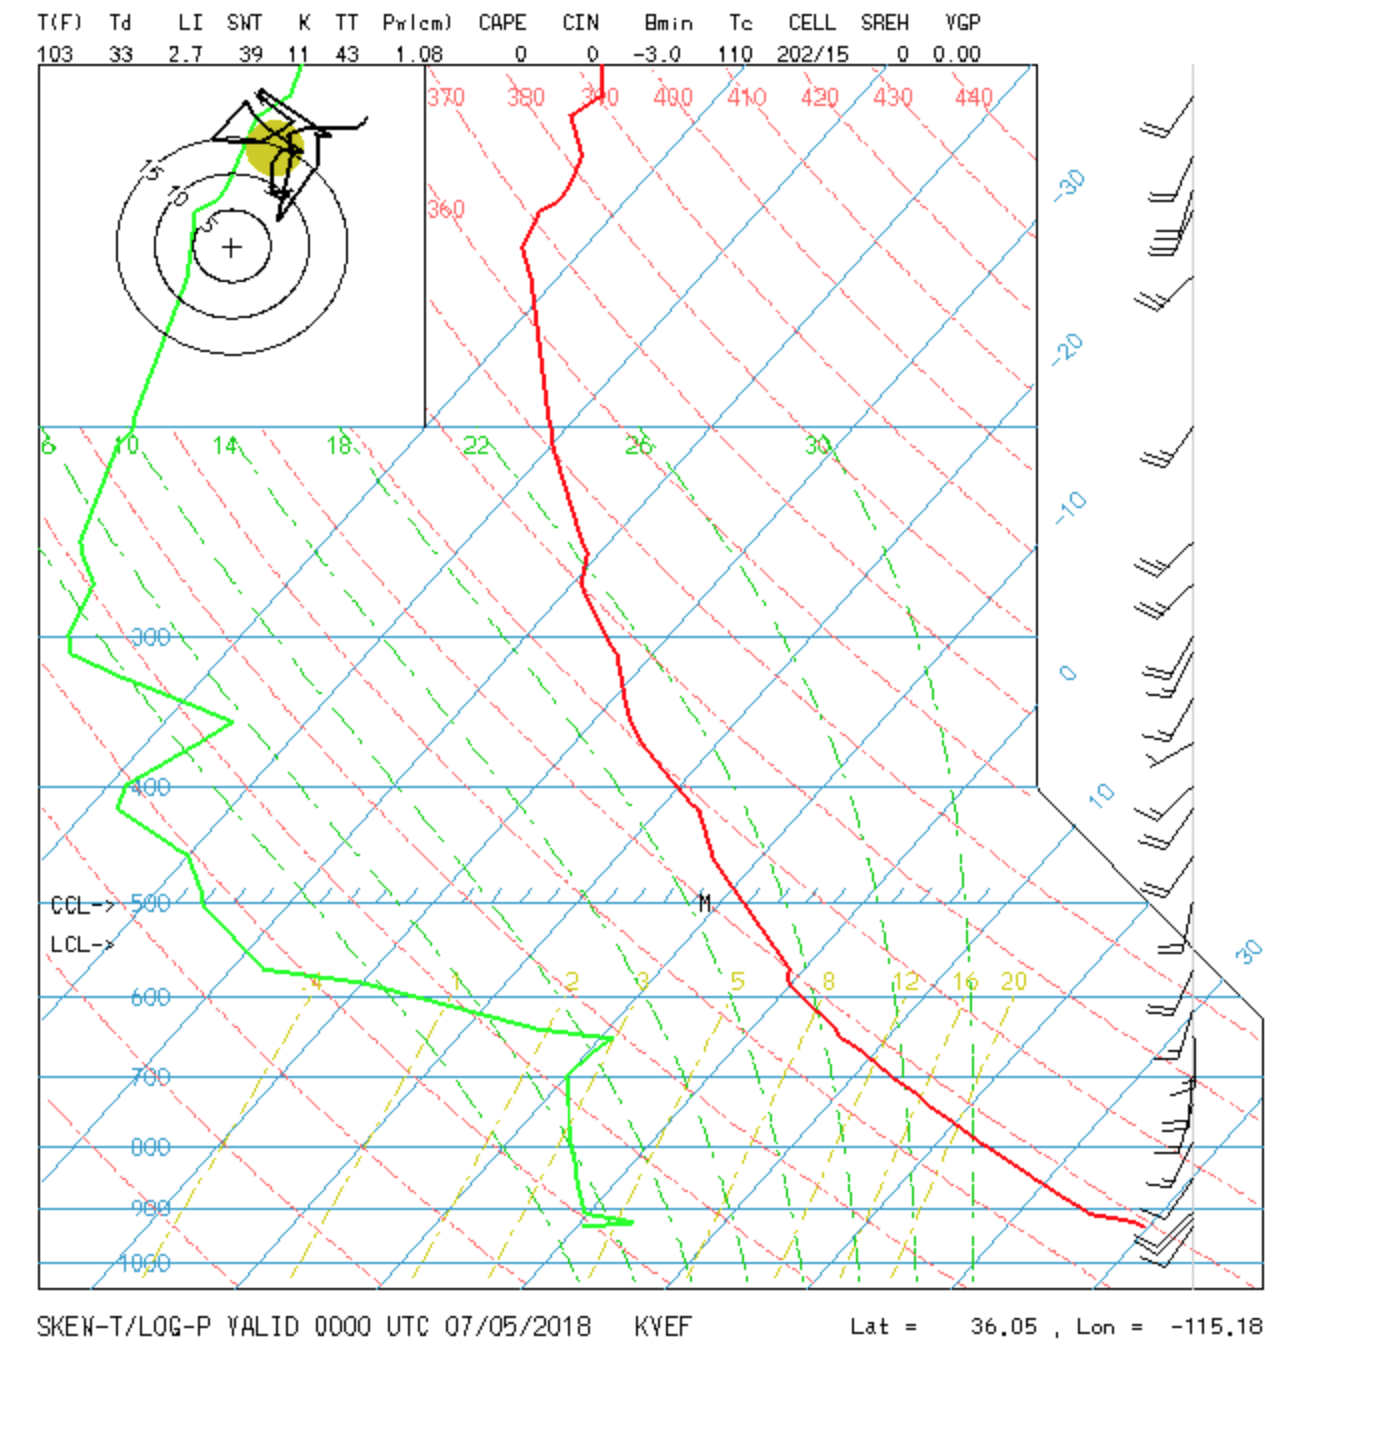
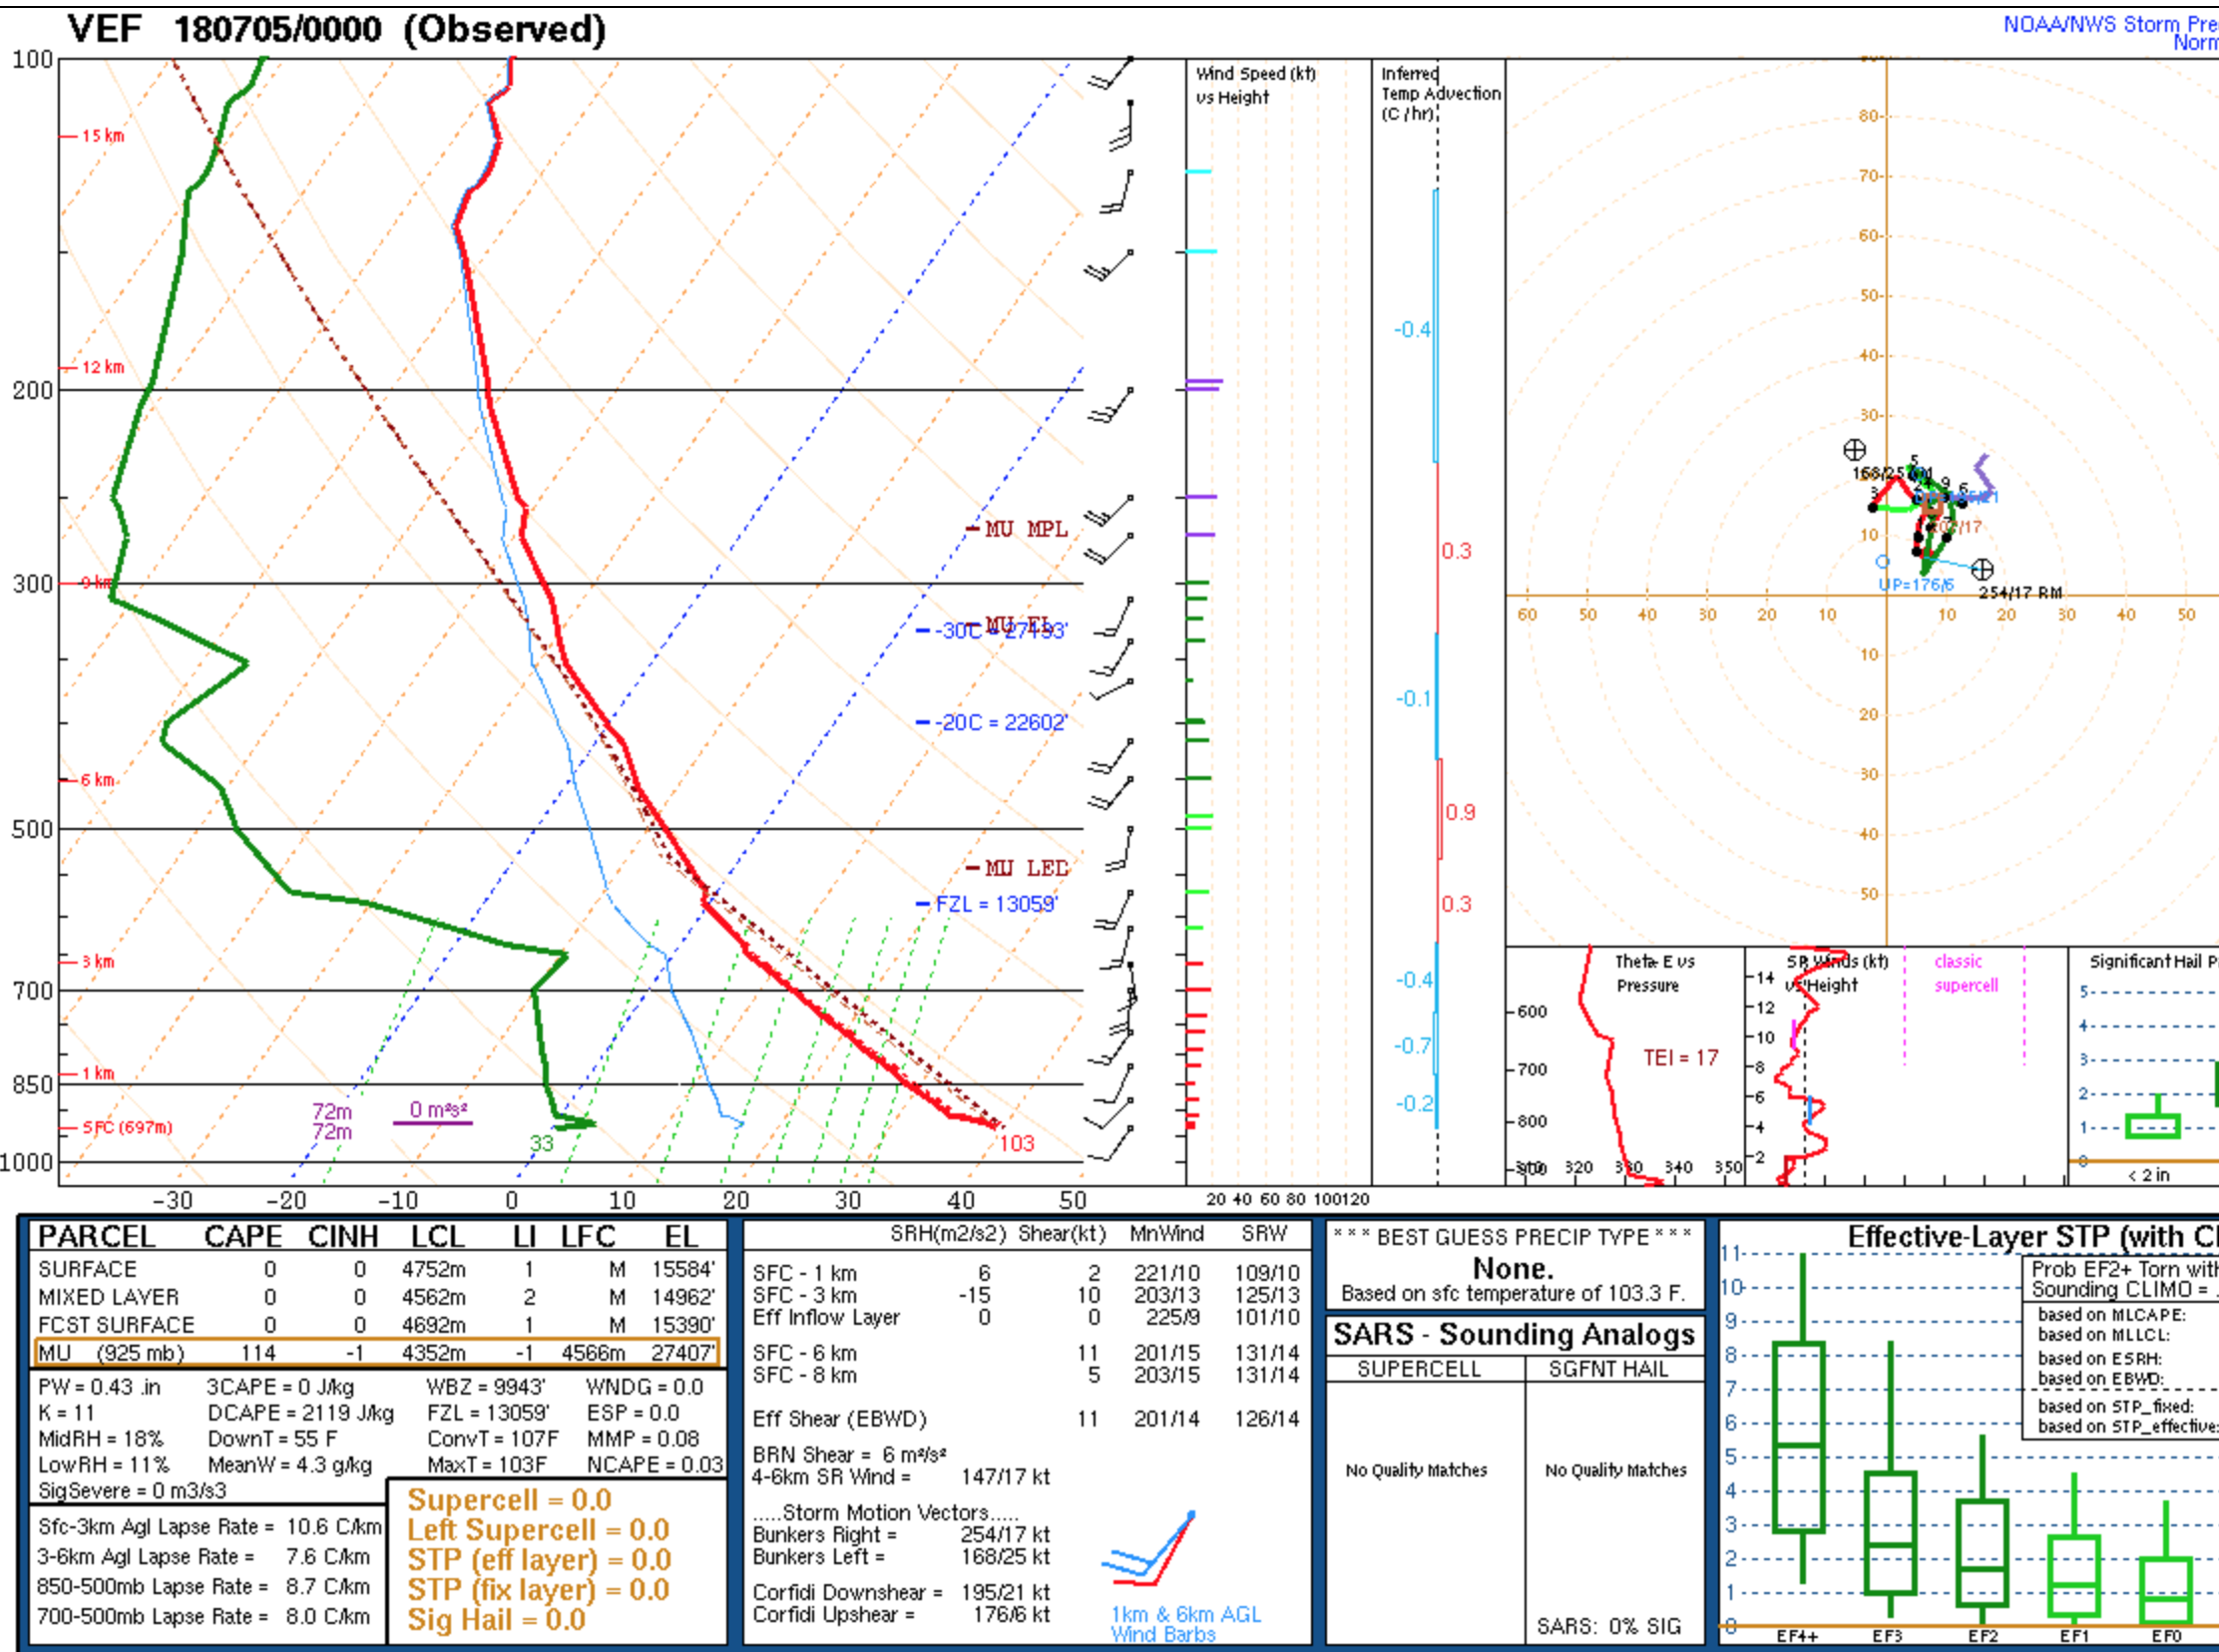
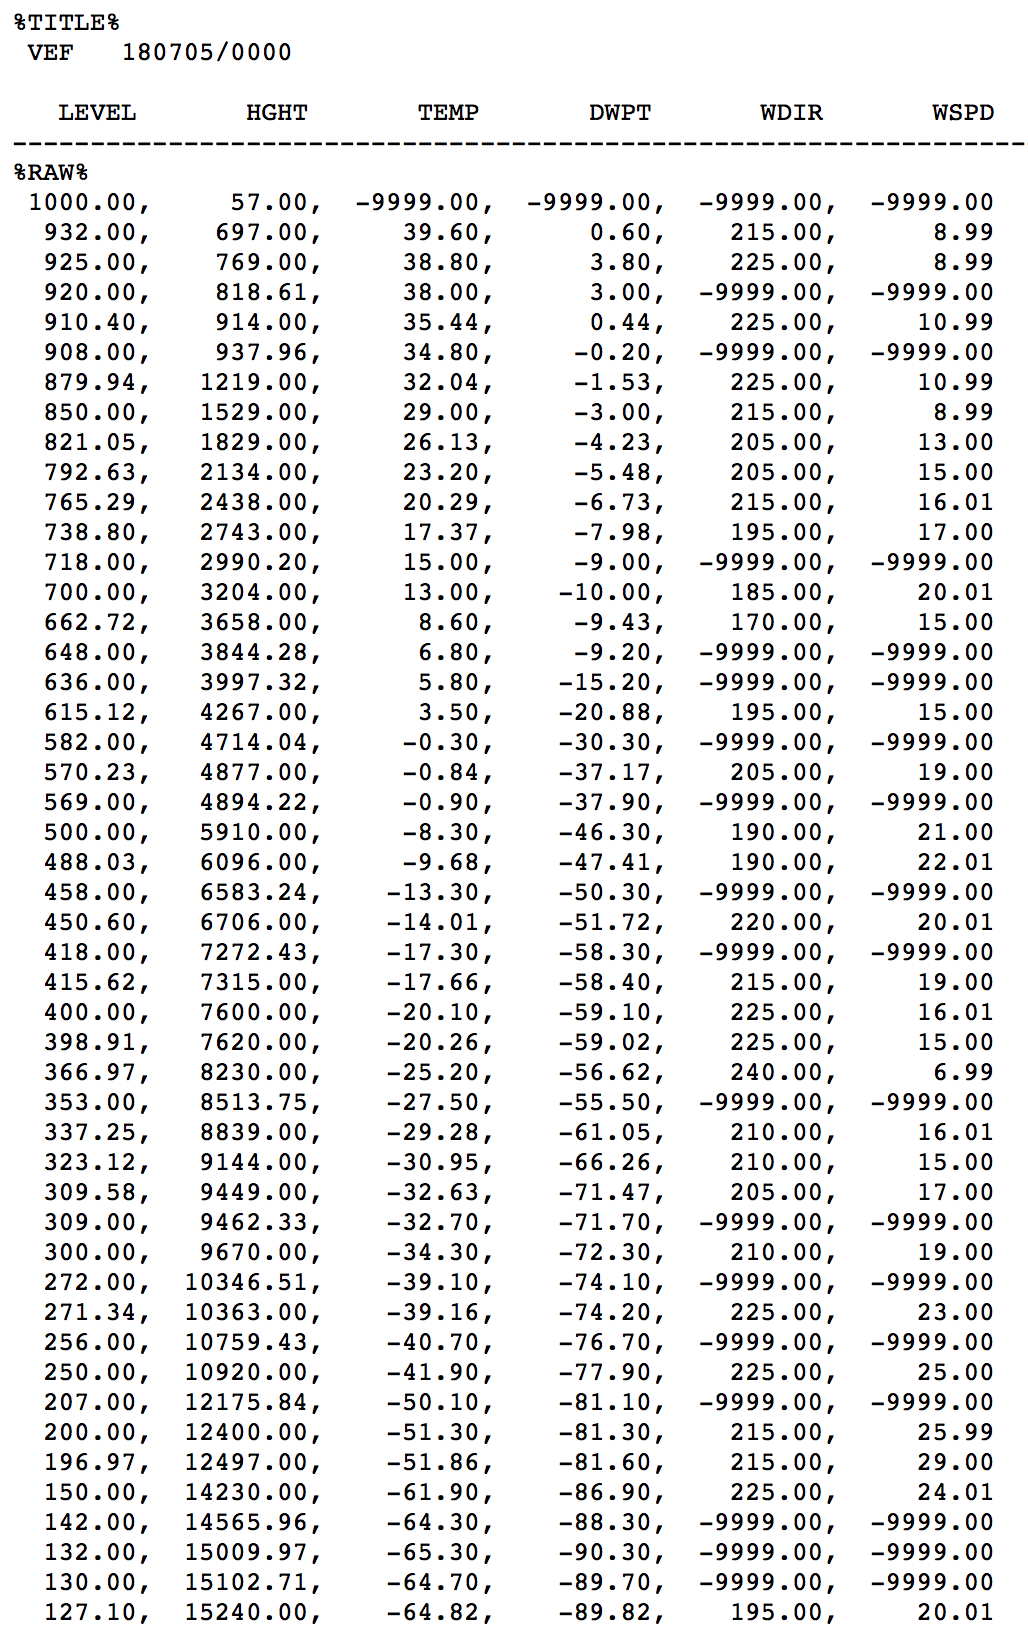
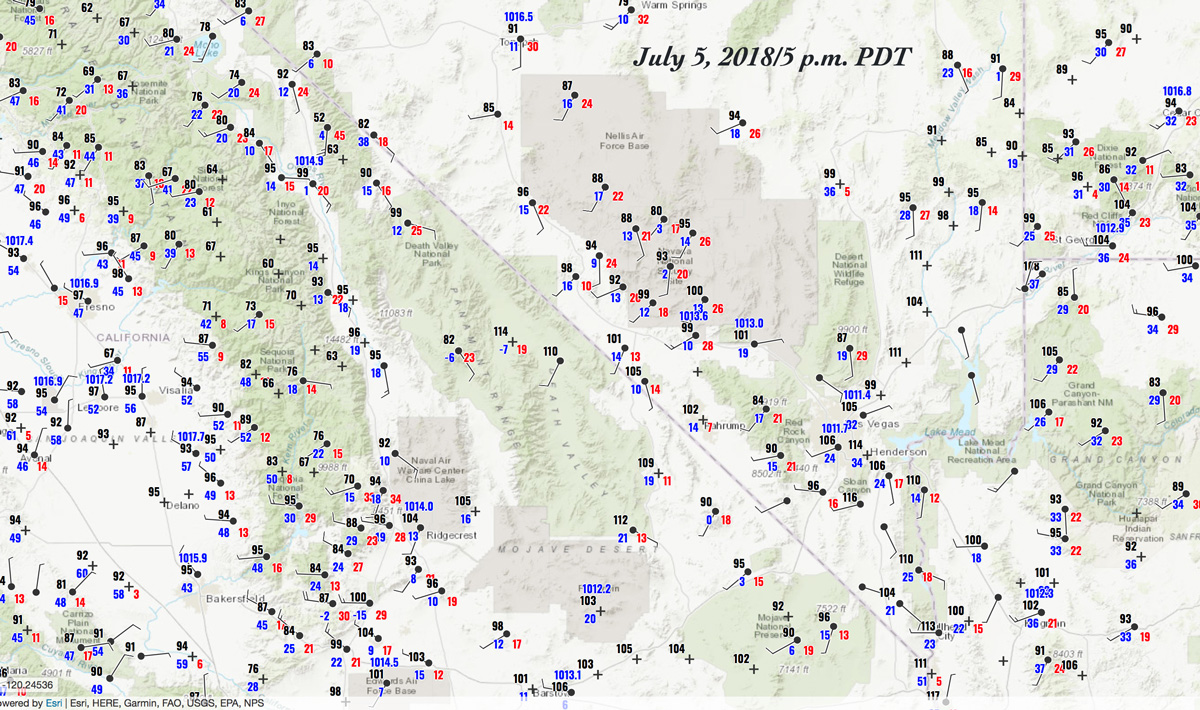
July 5
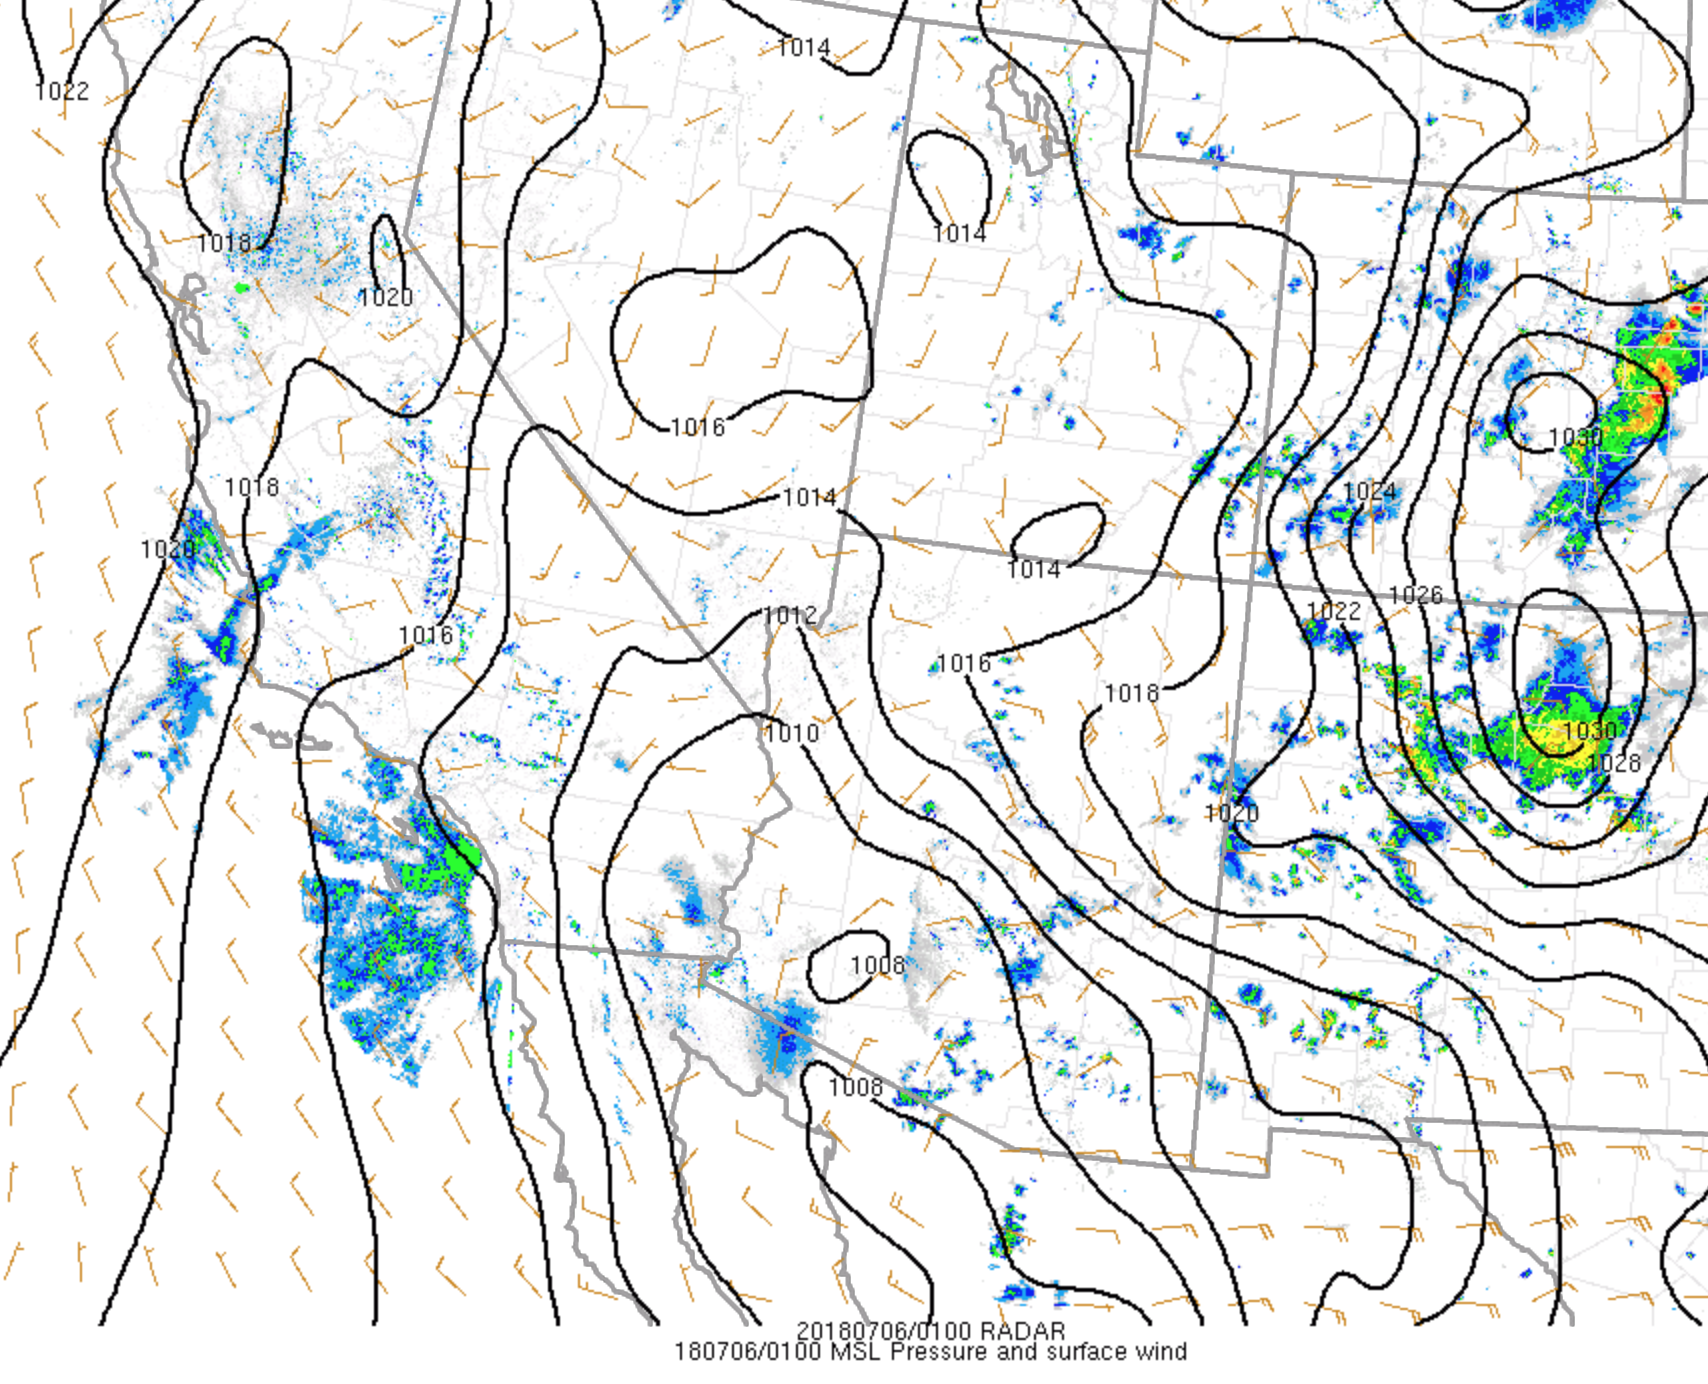
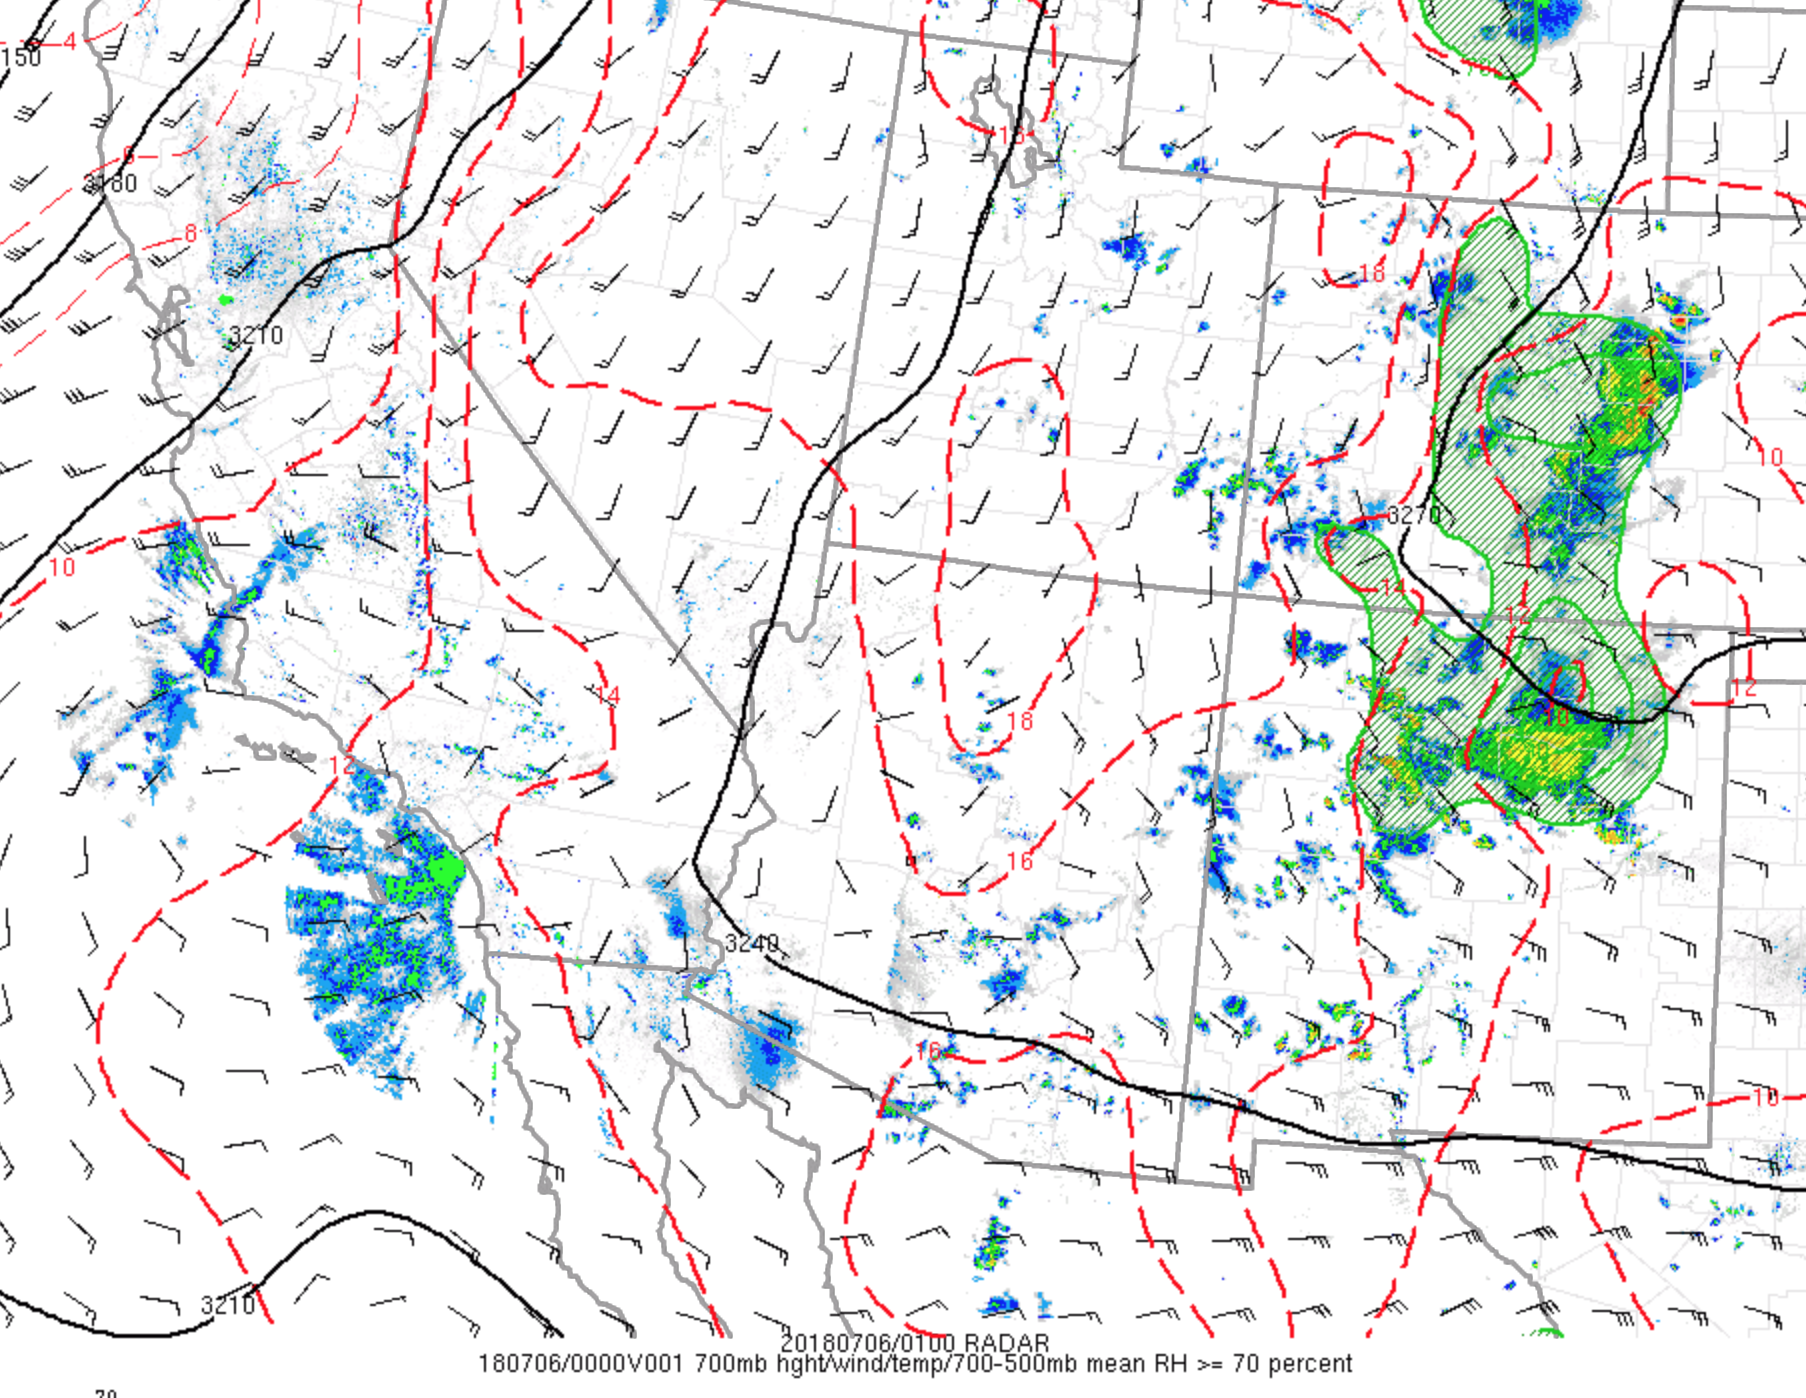
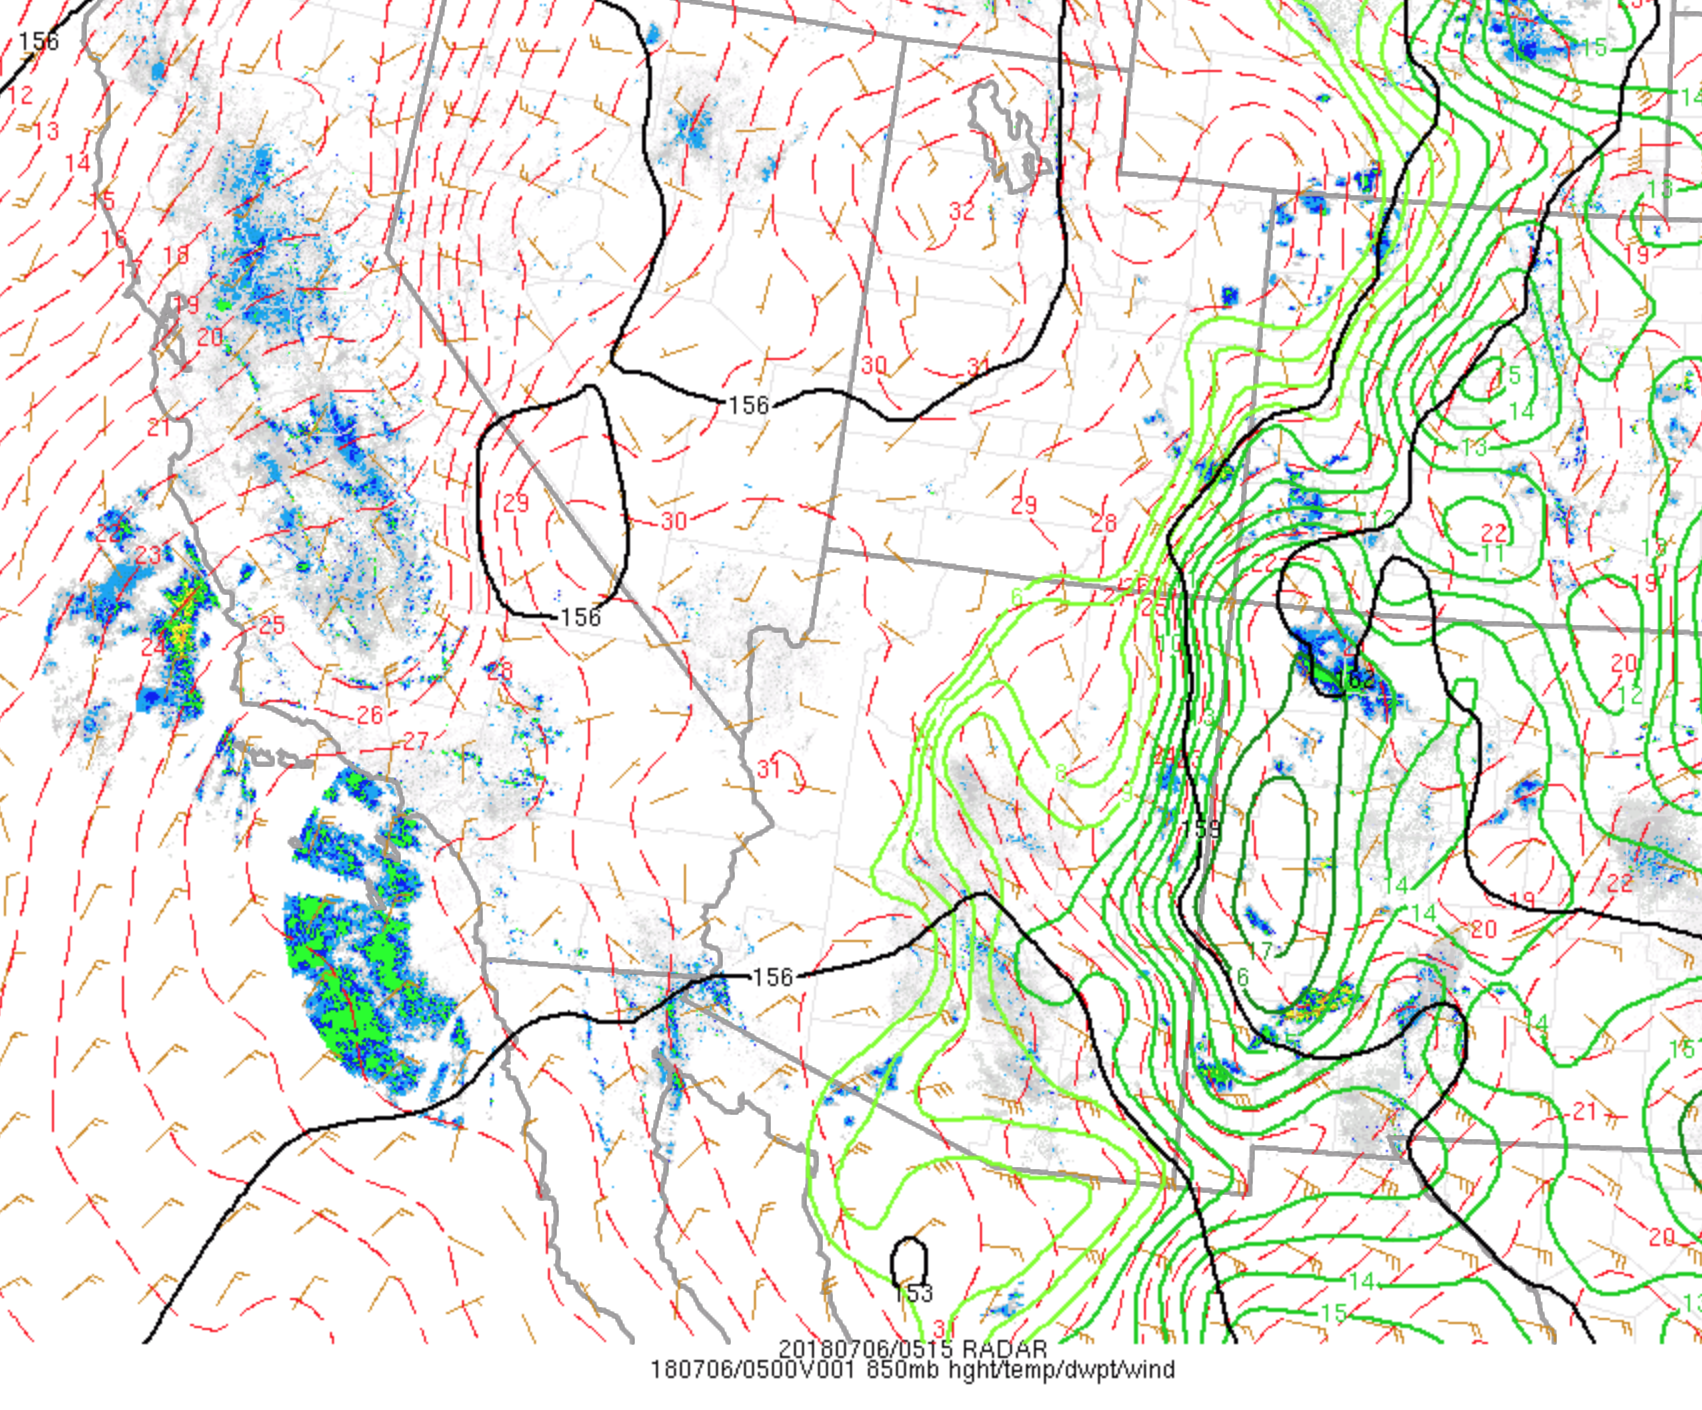
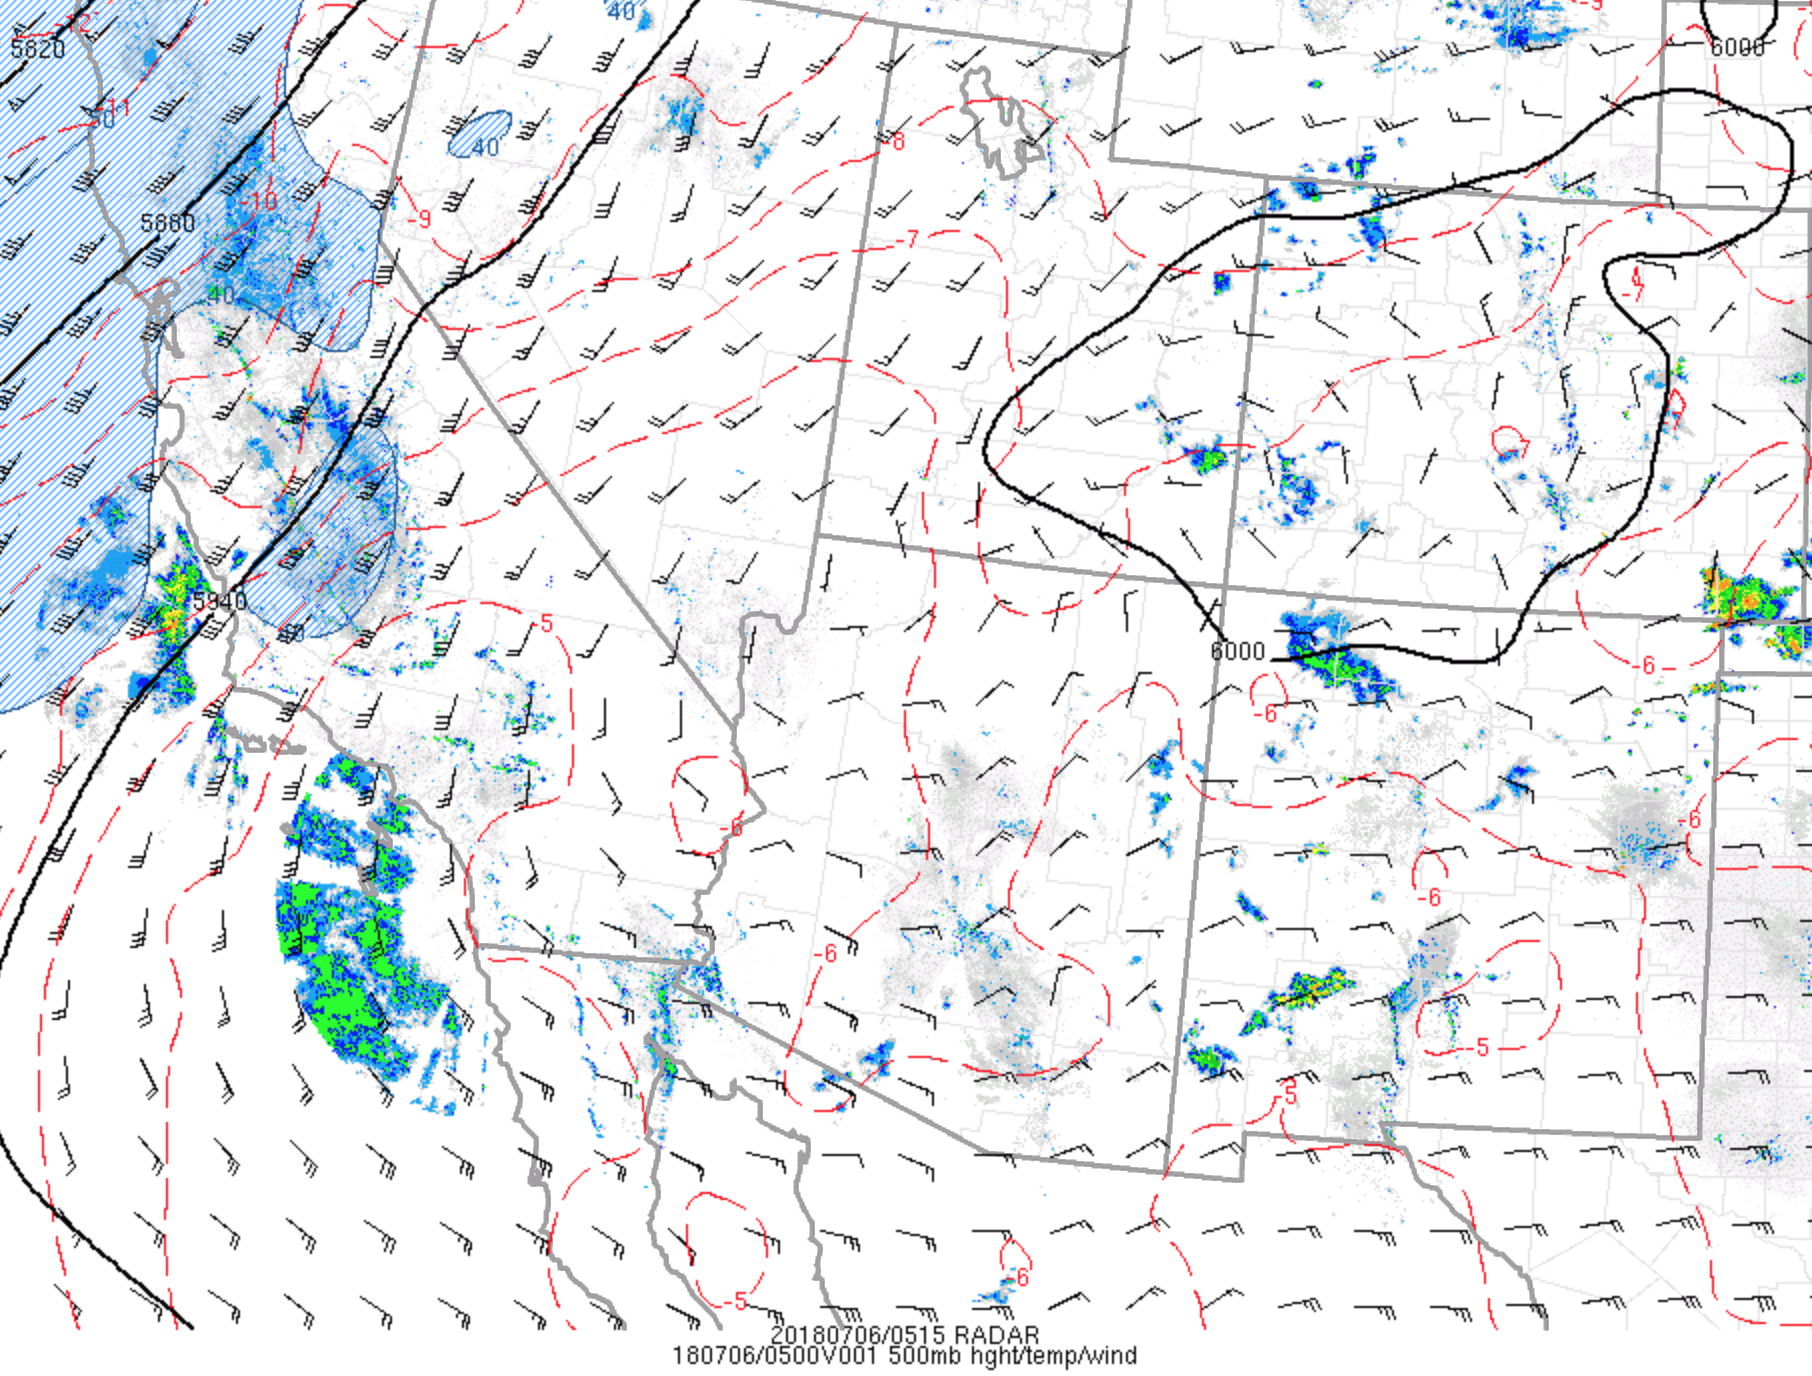
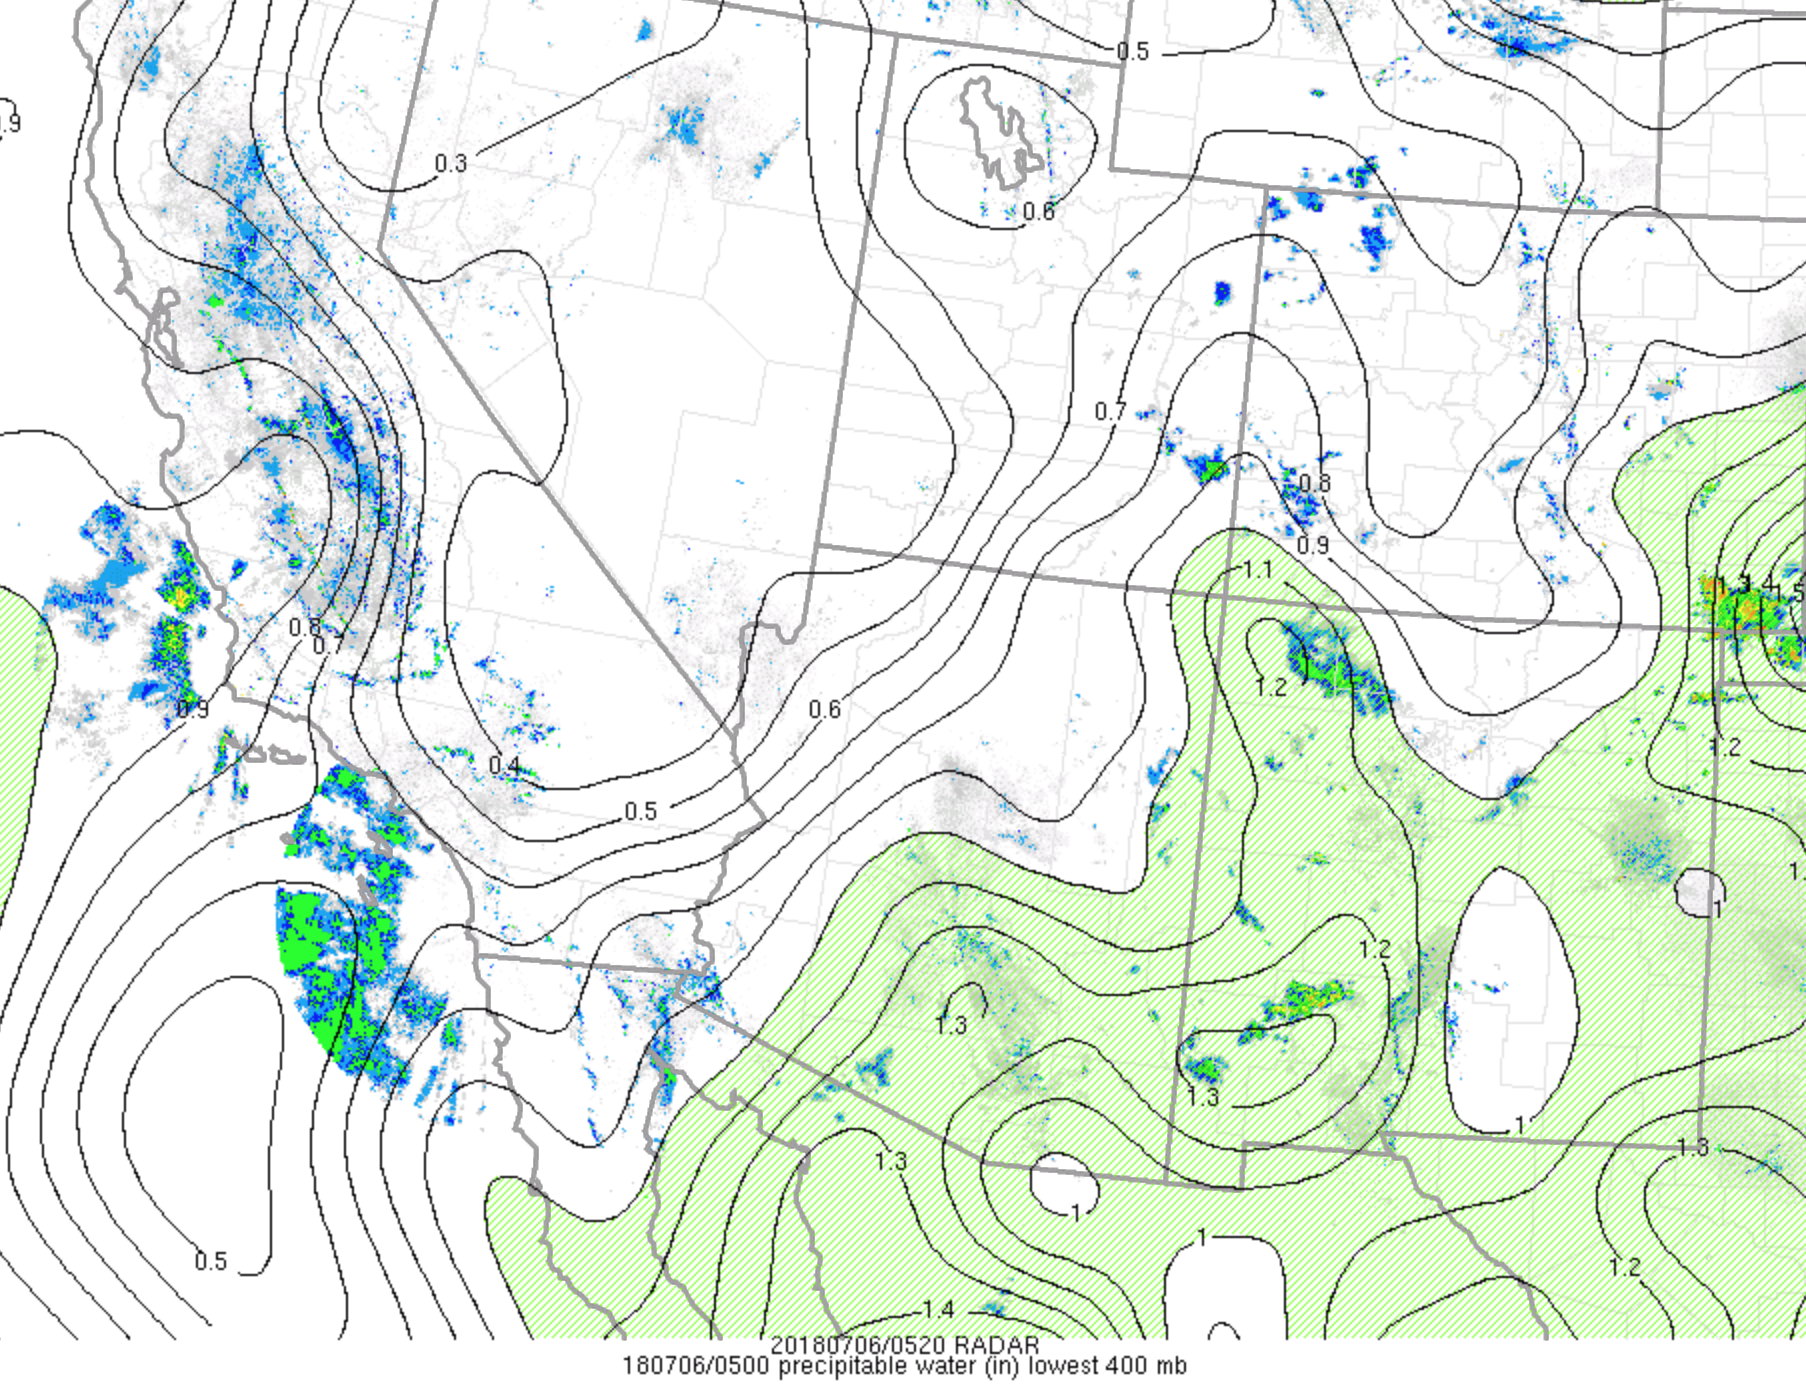
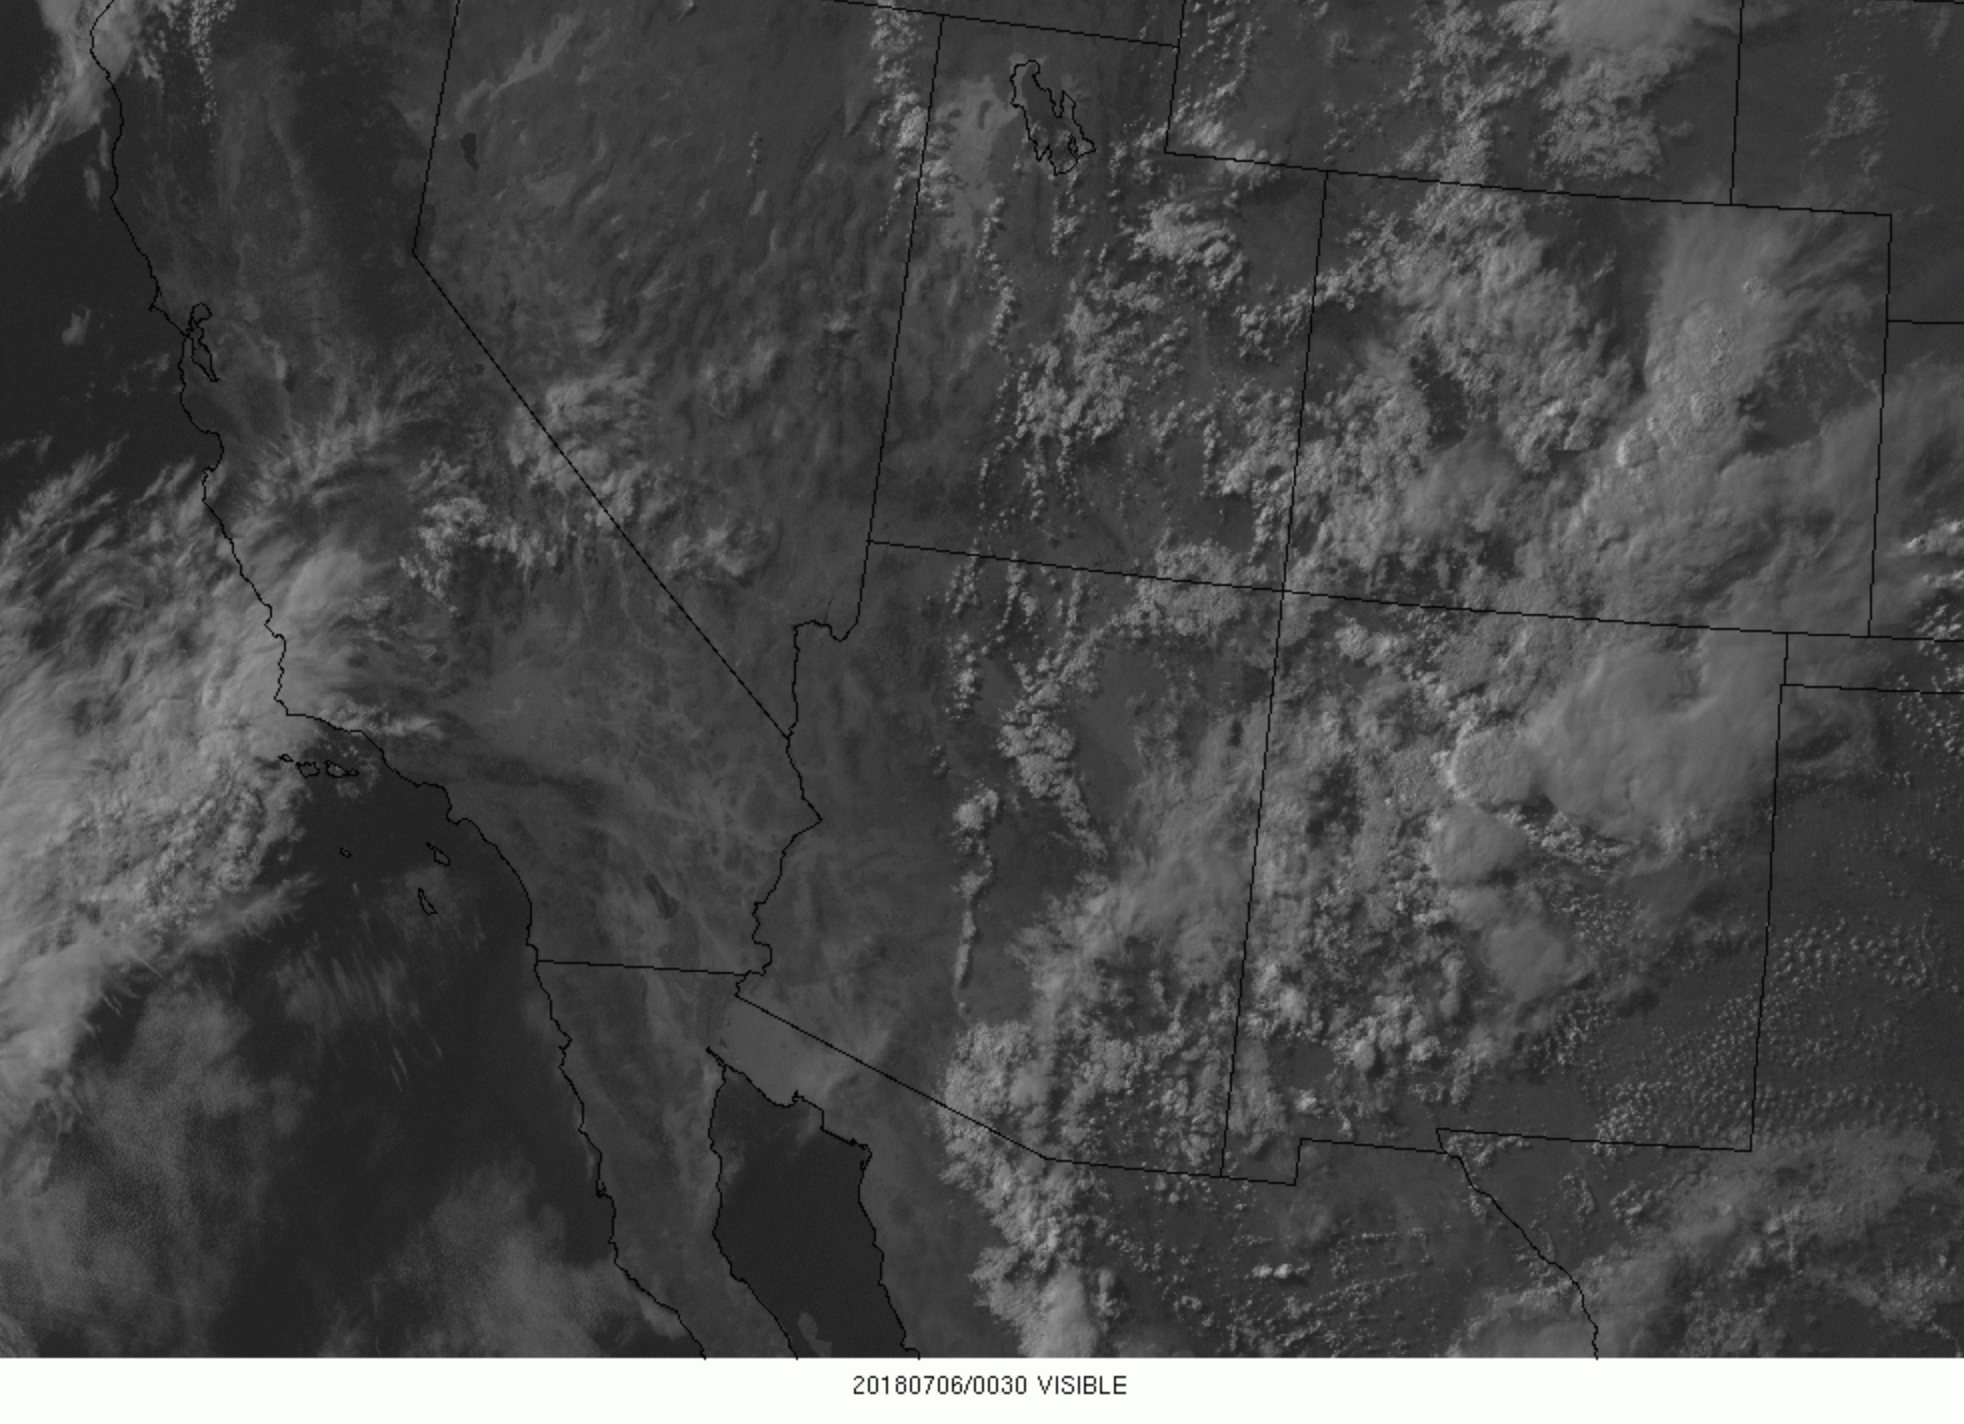
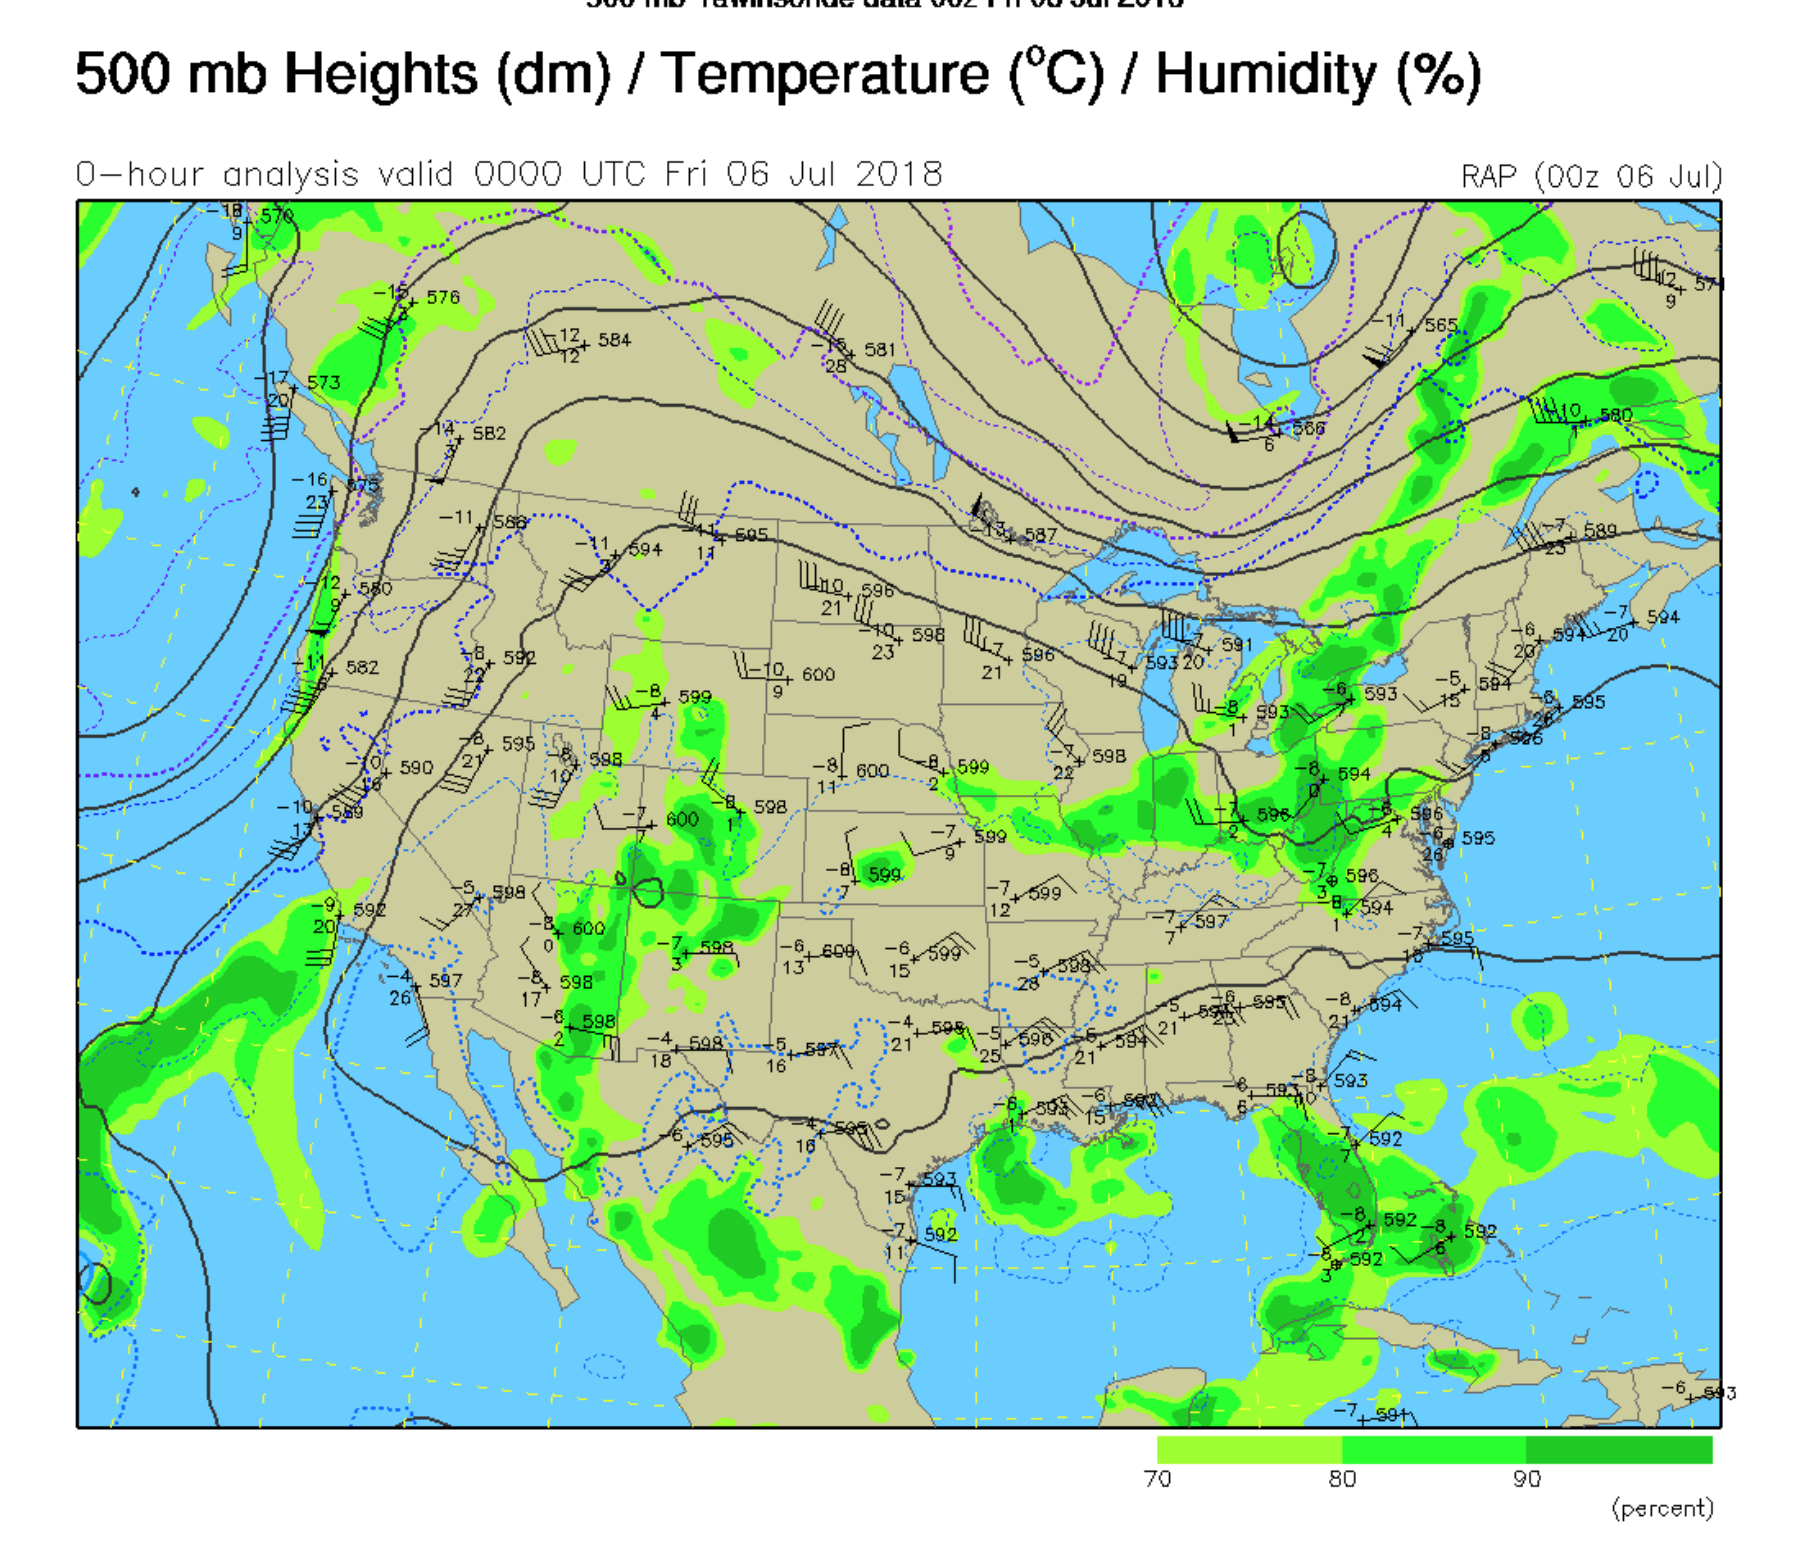
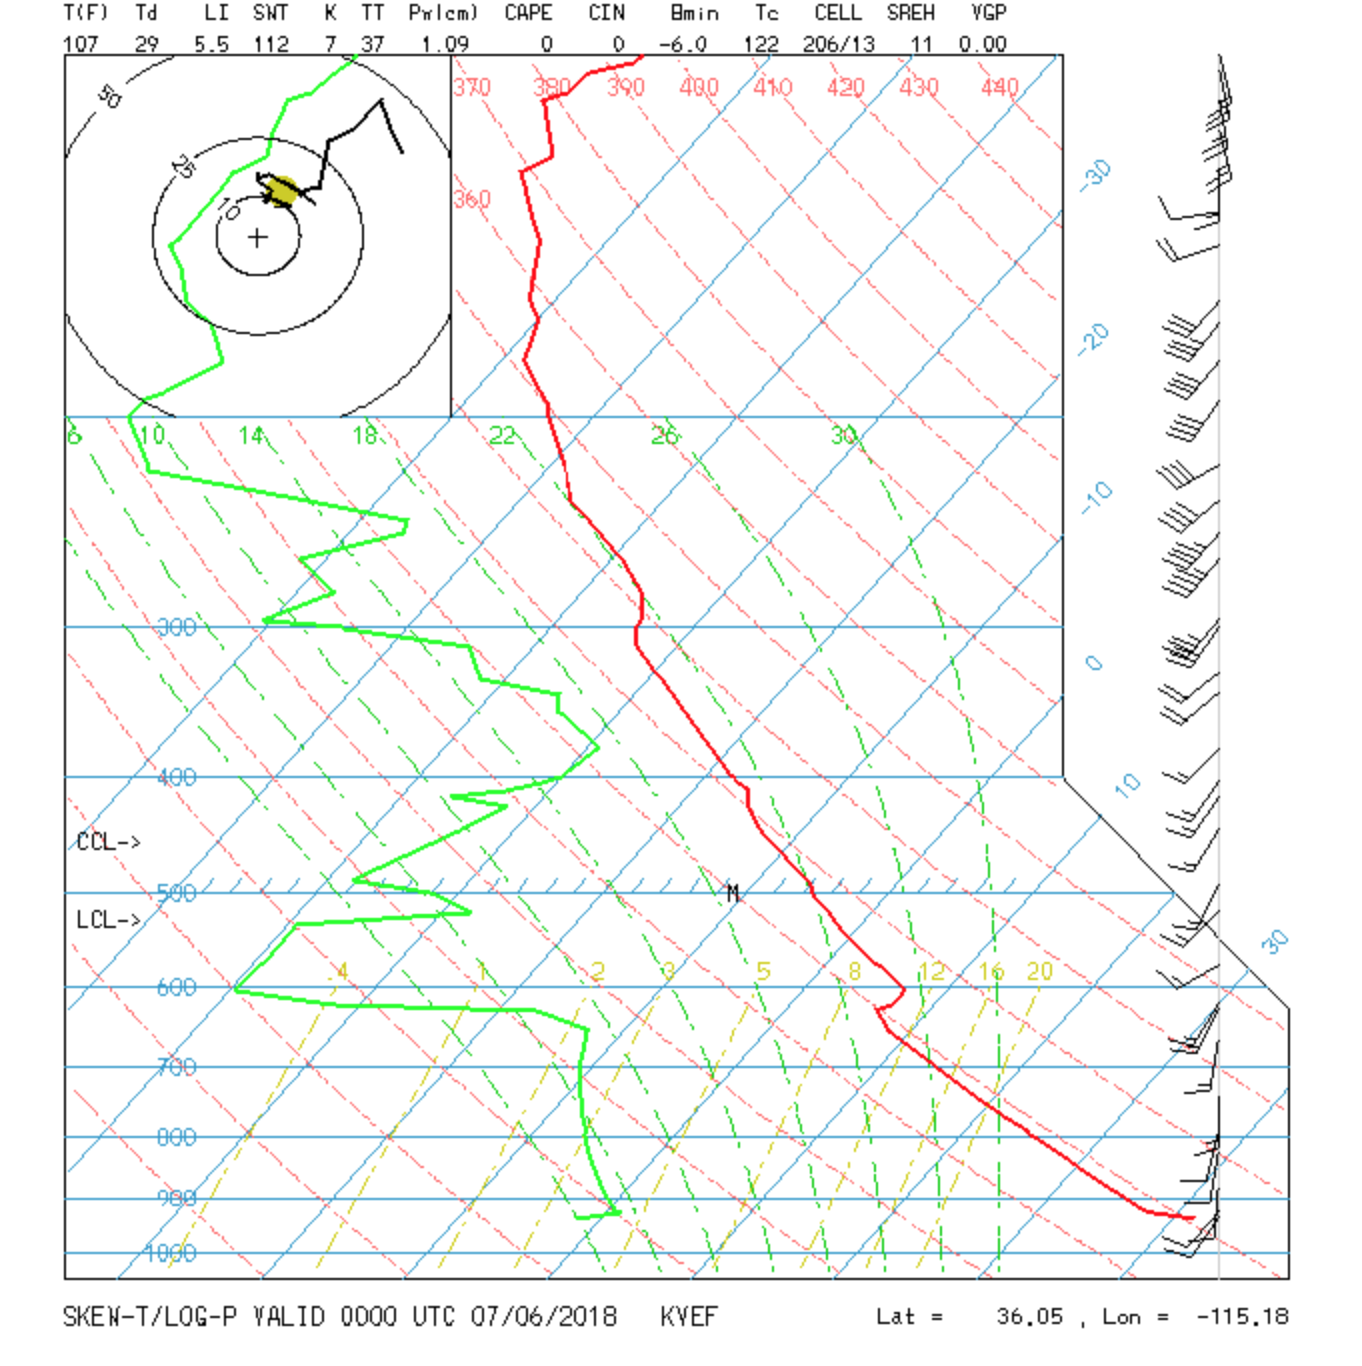

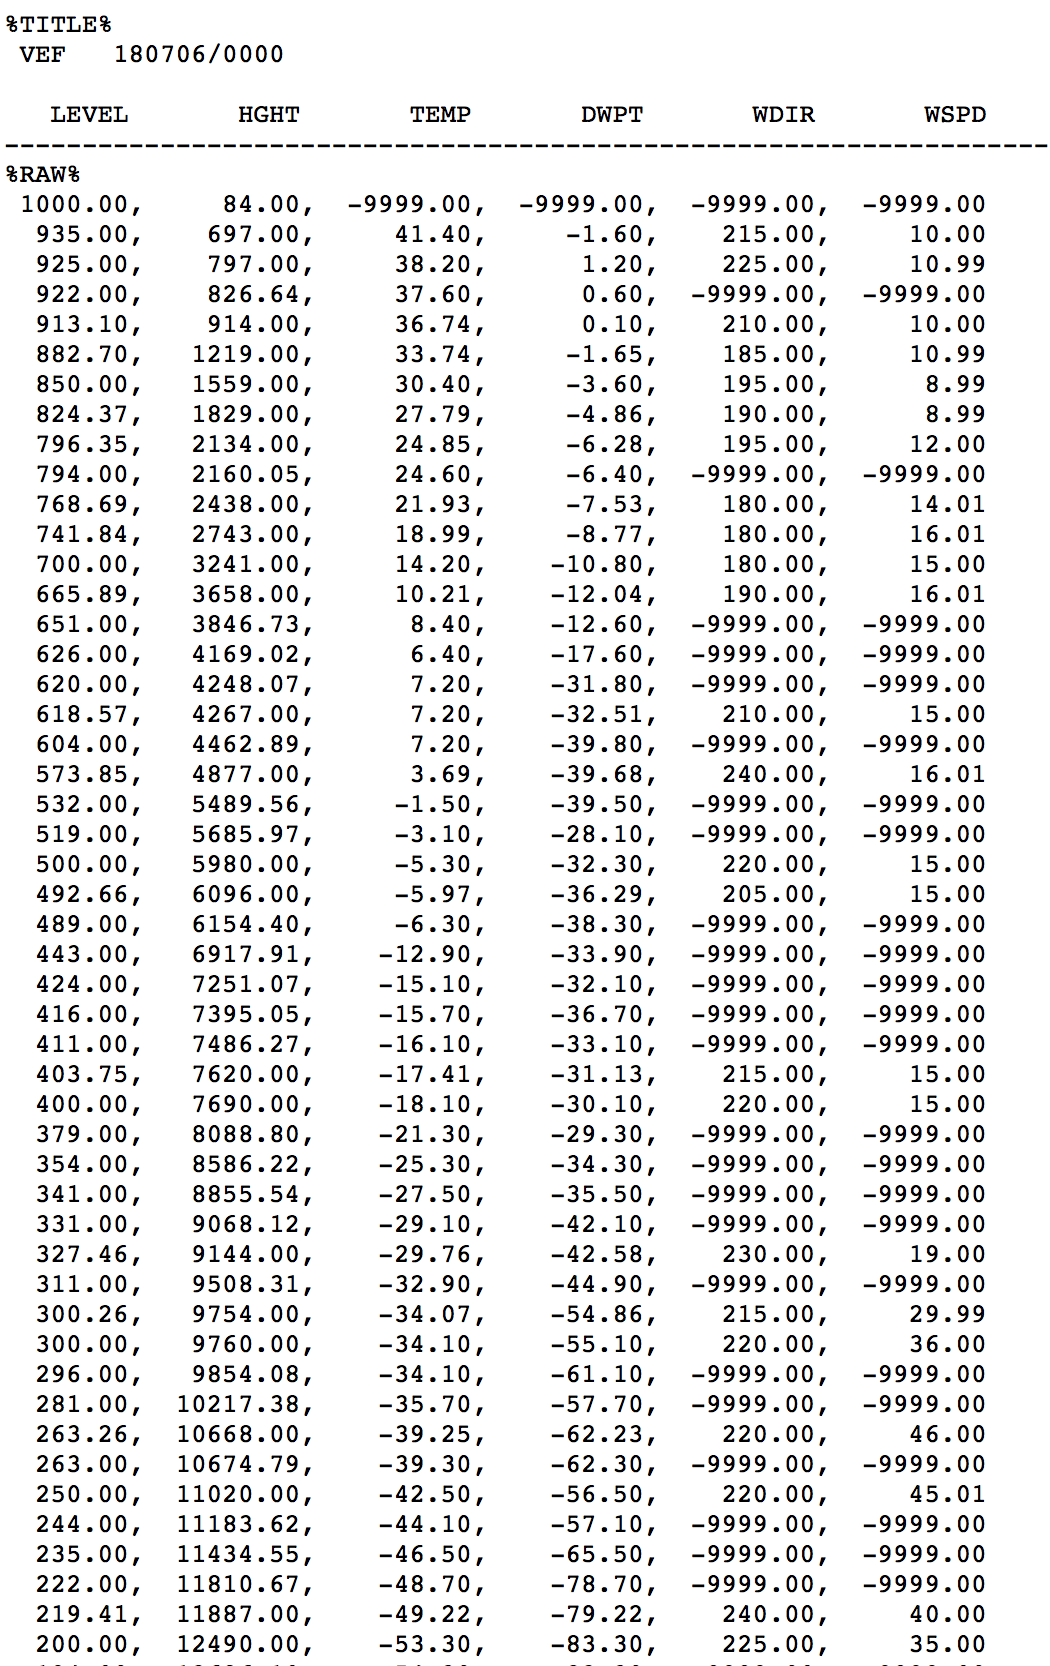
July 6
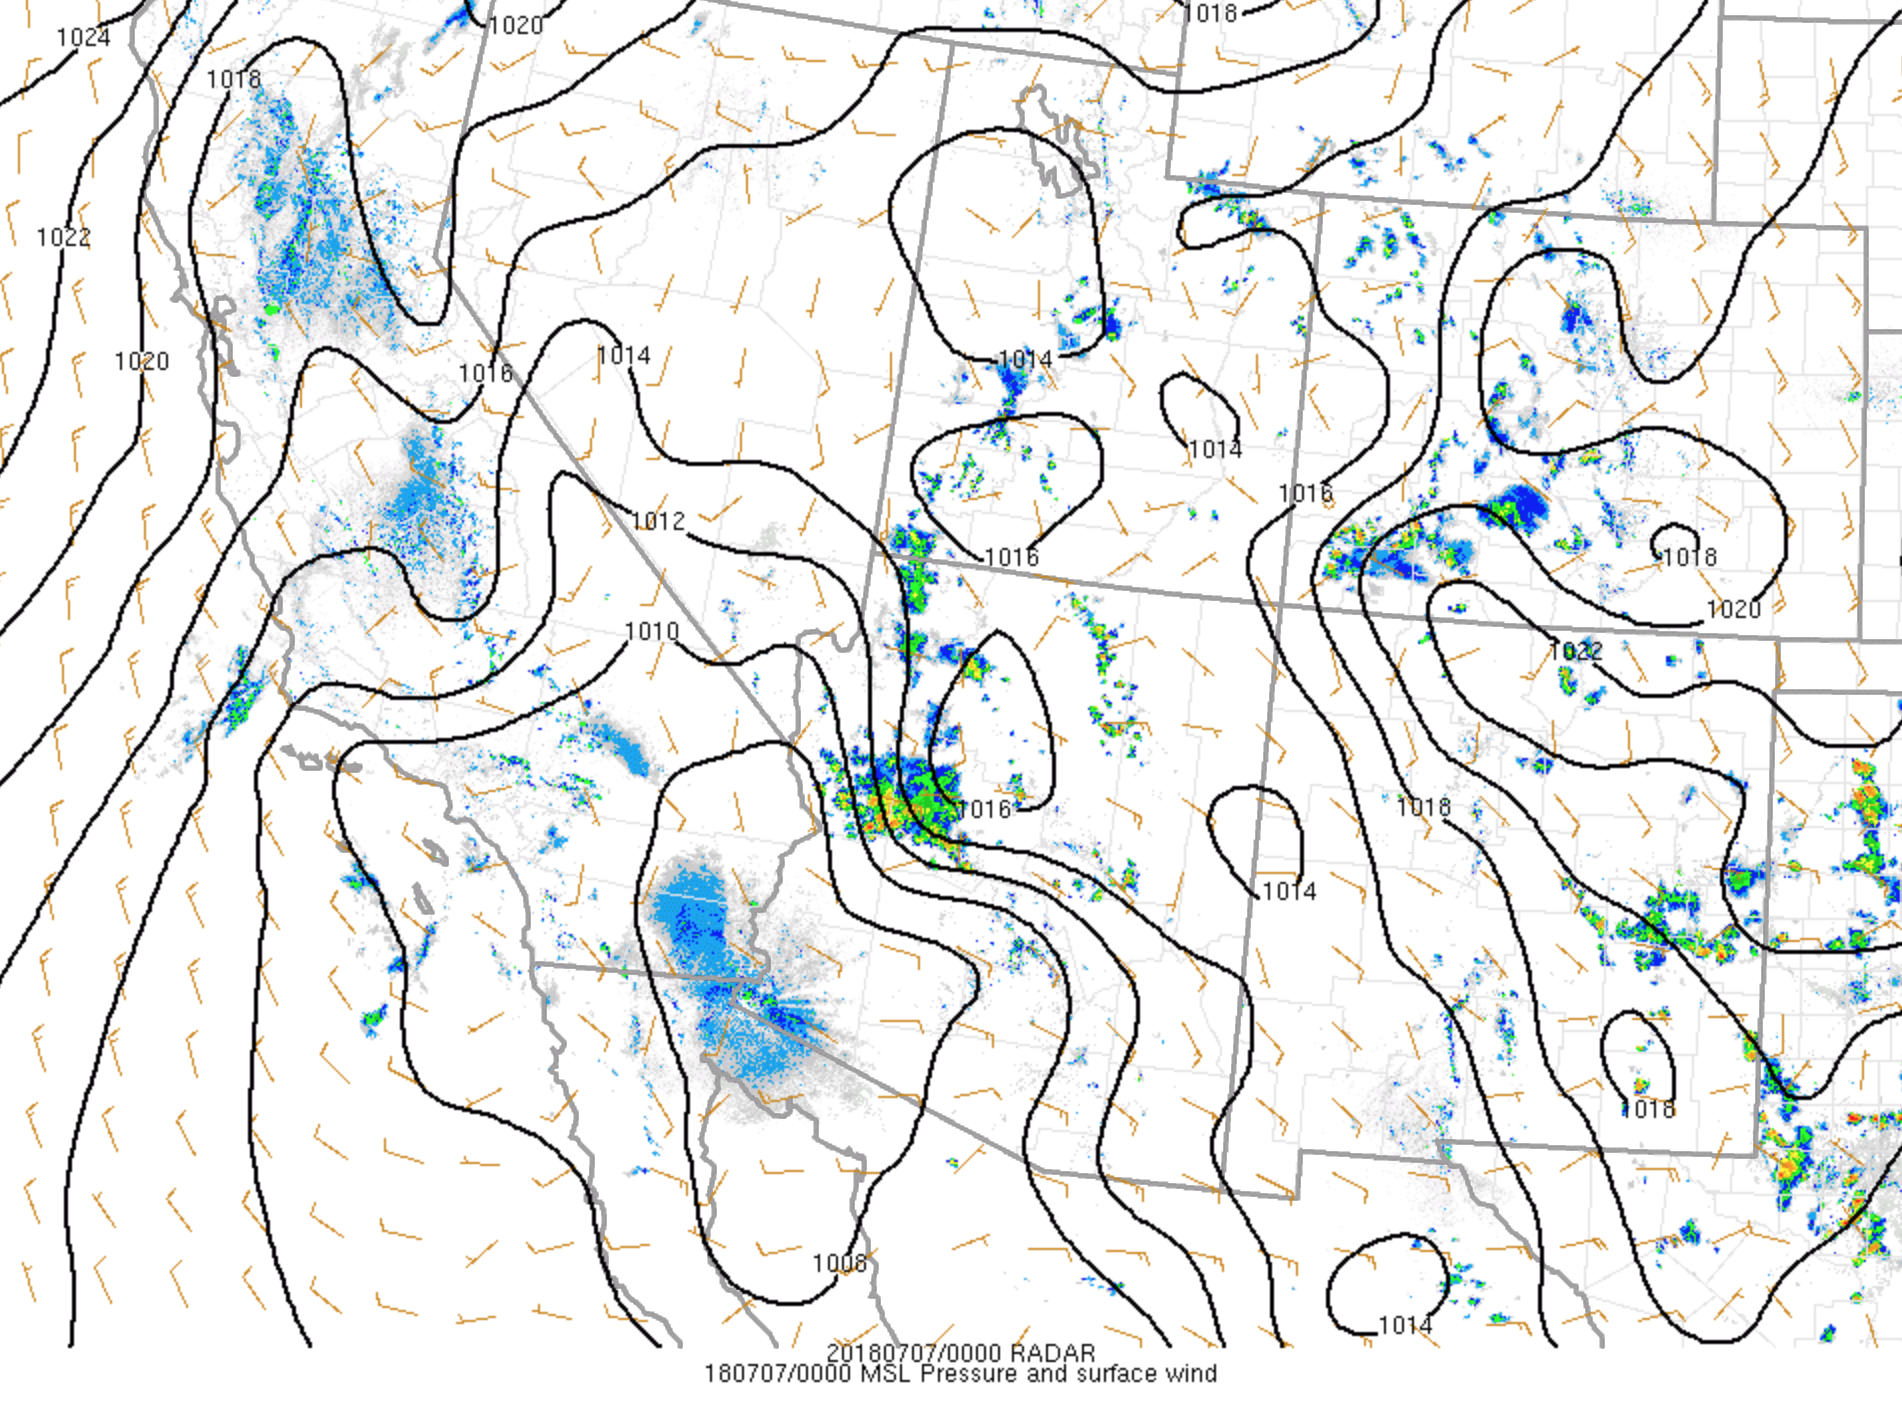
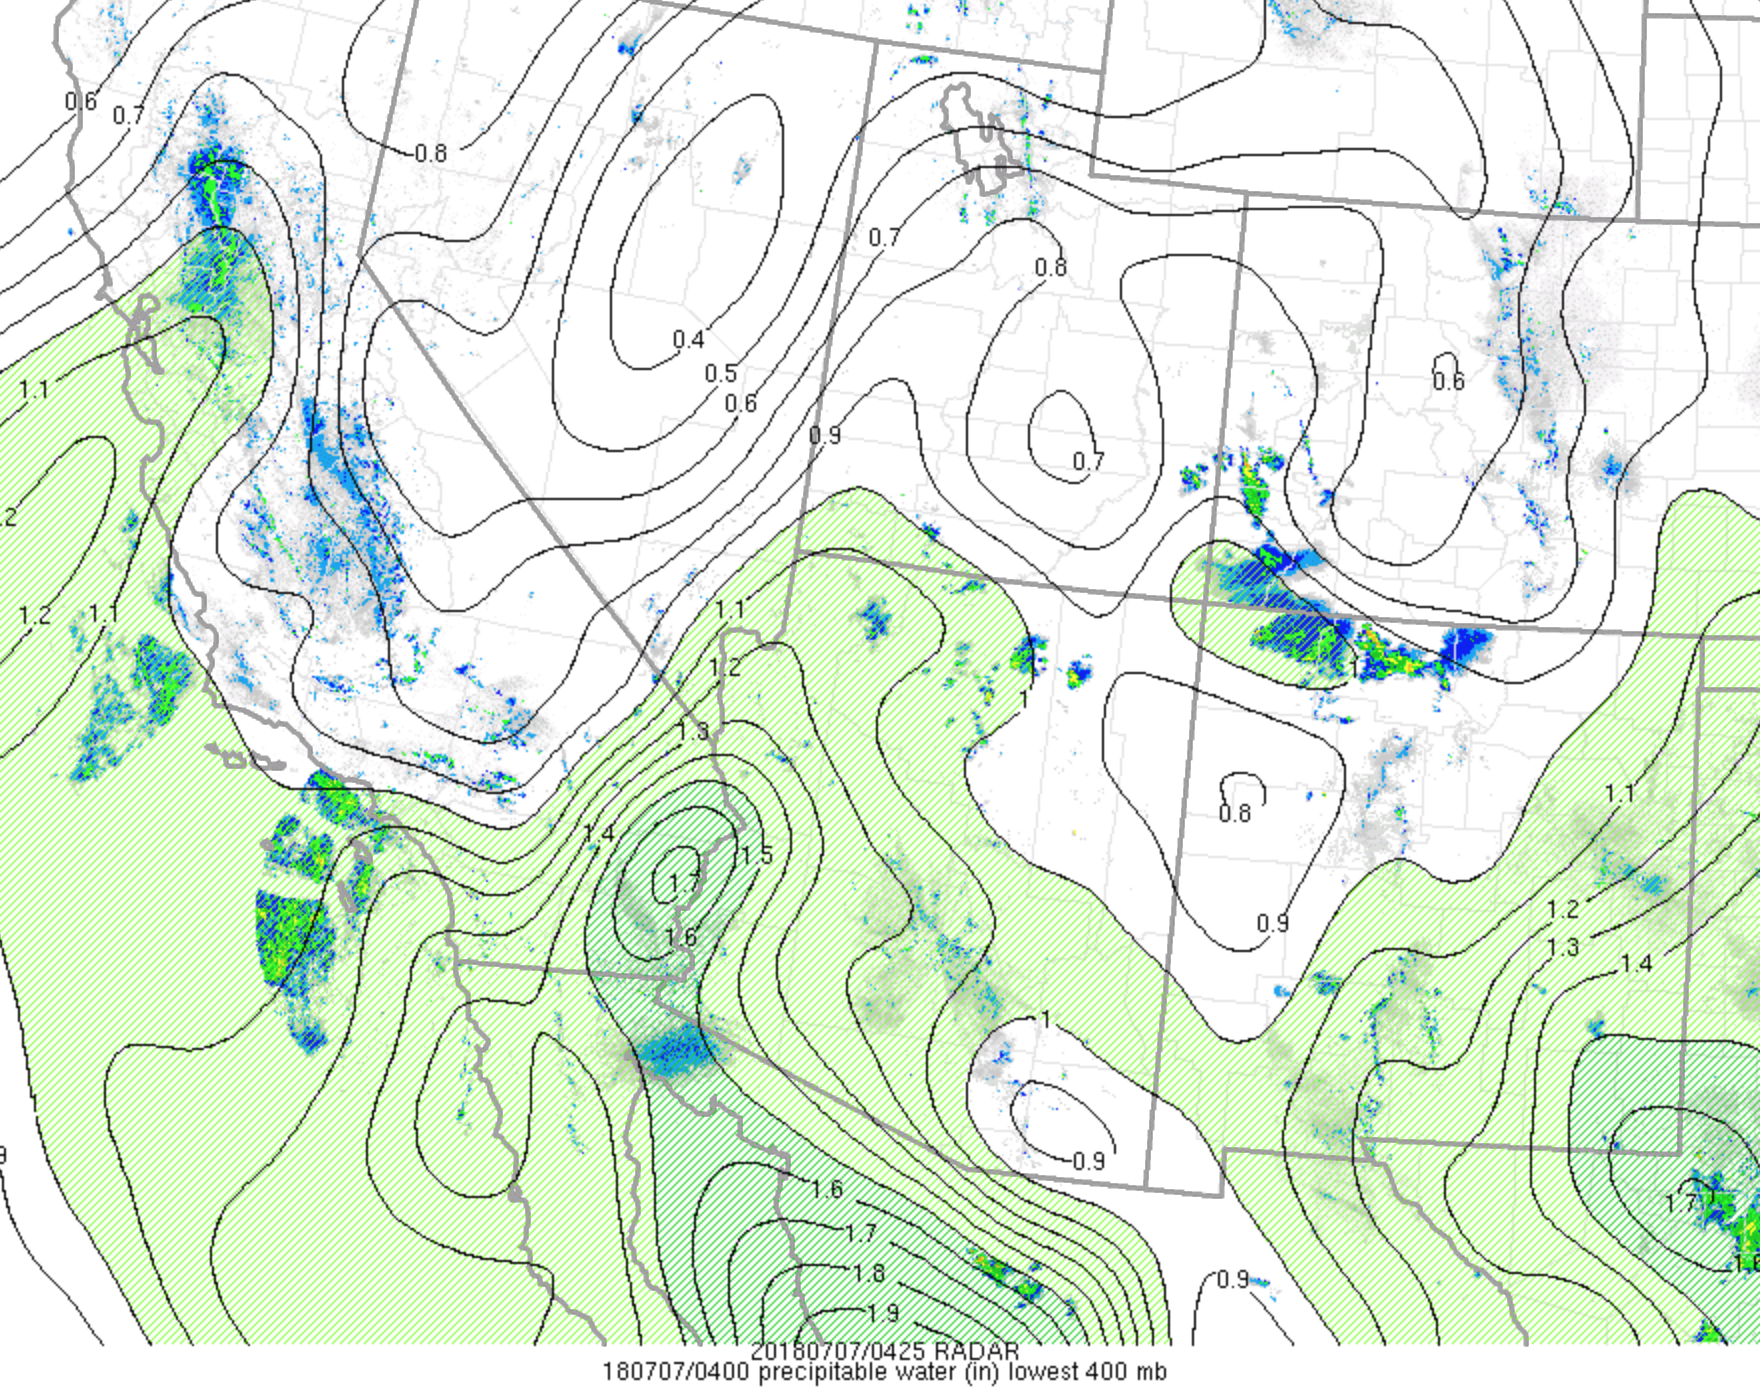
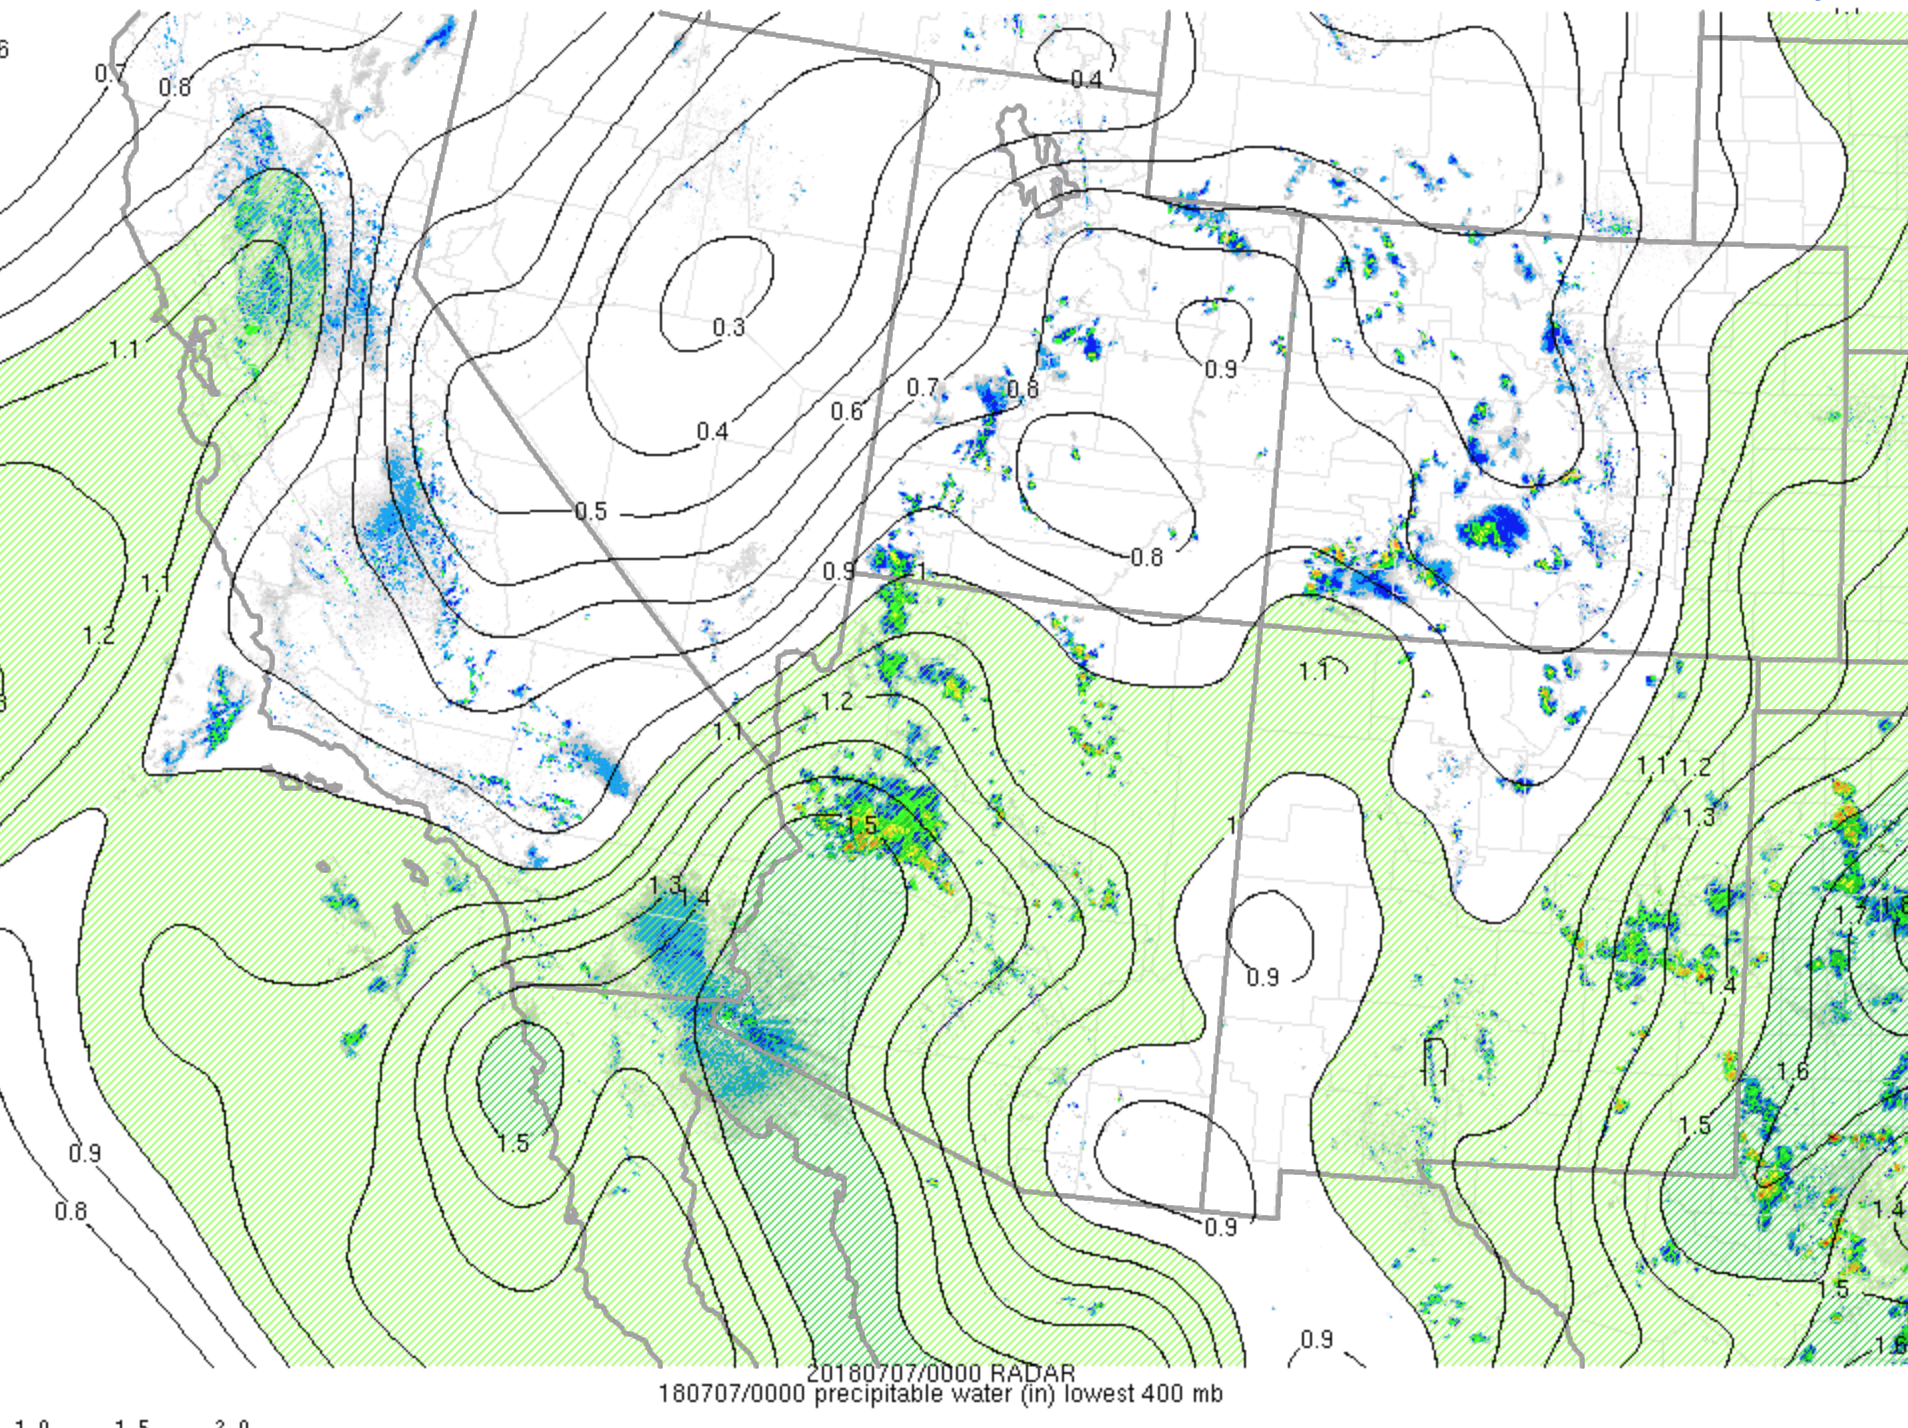
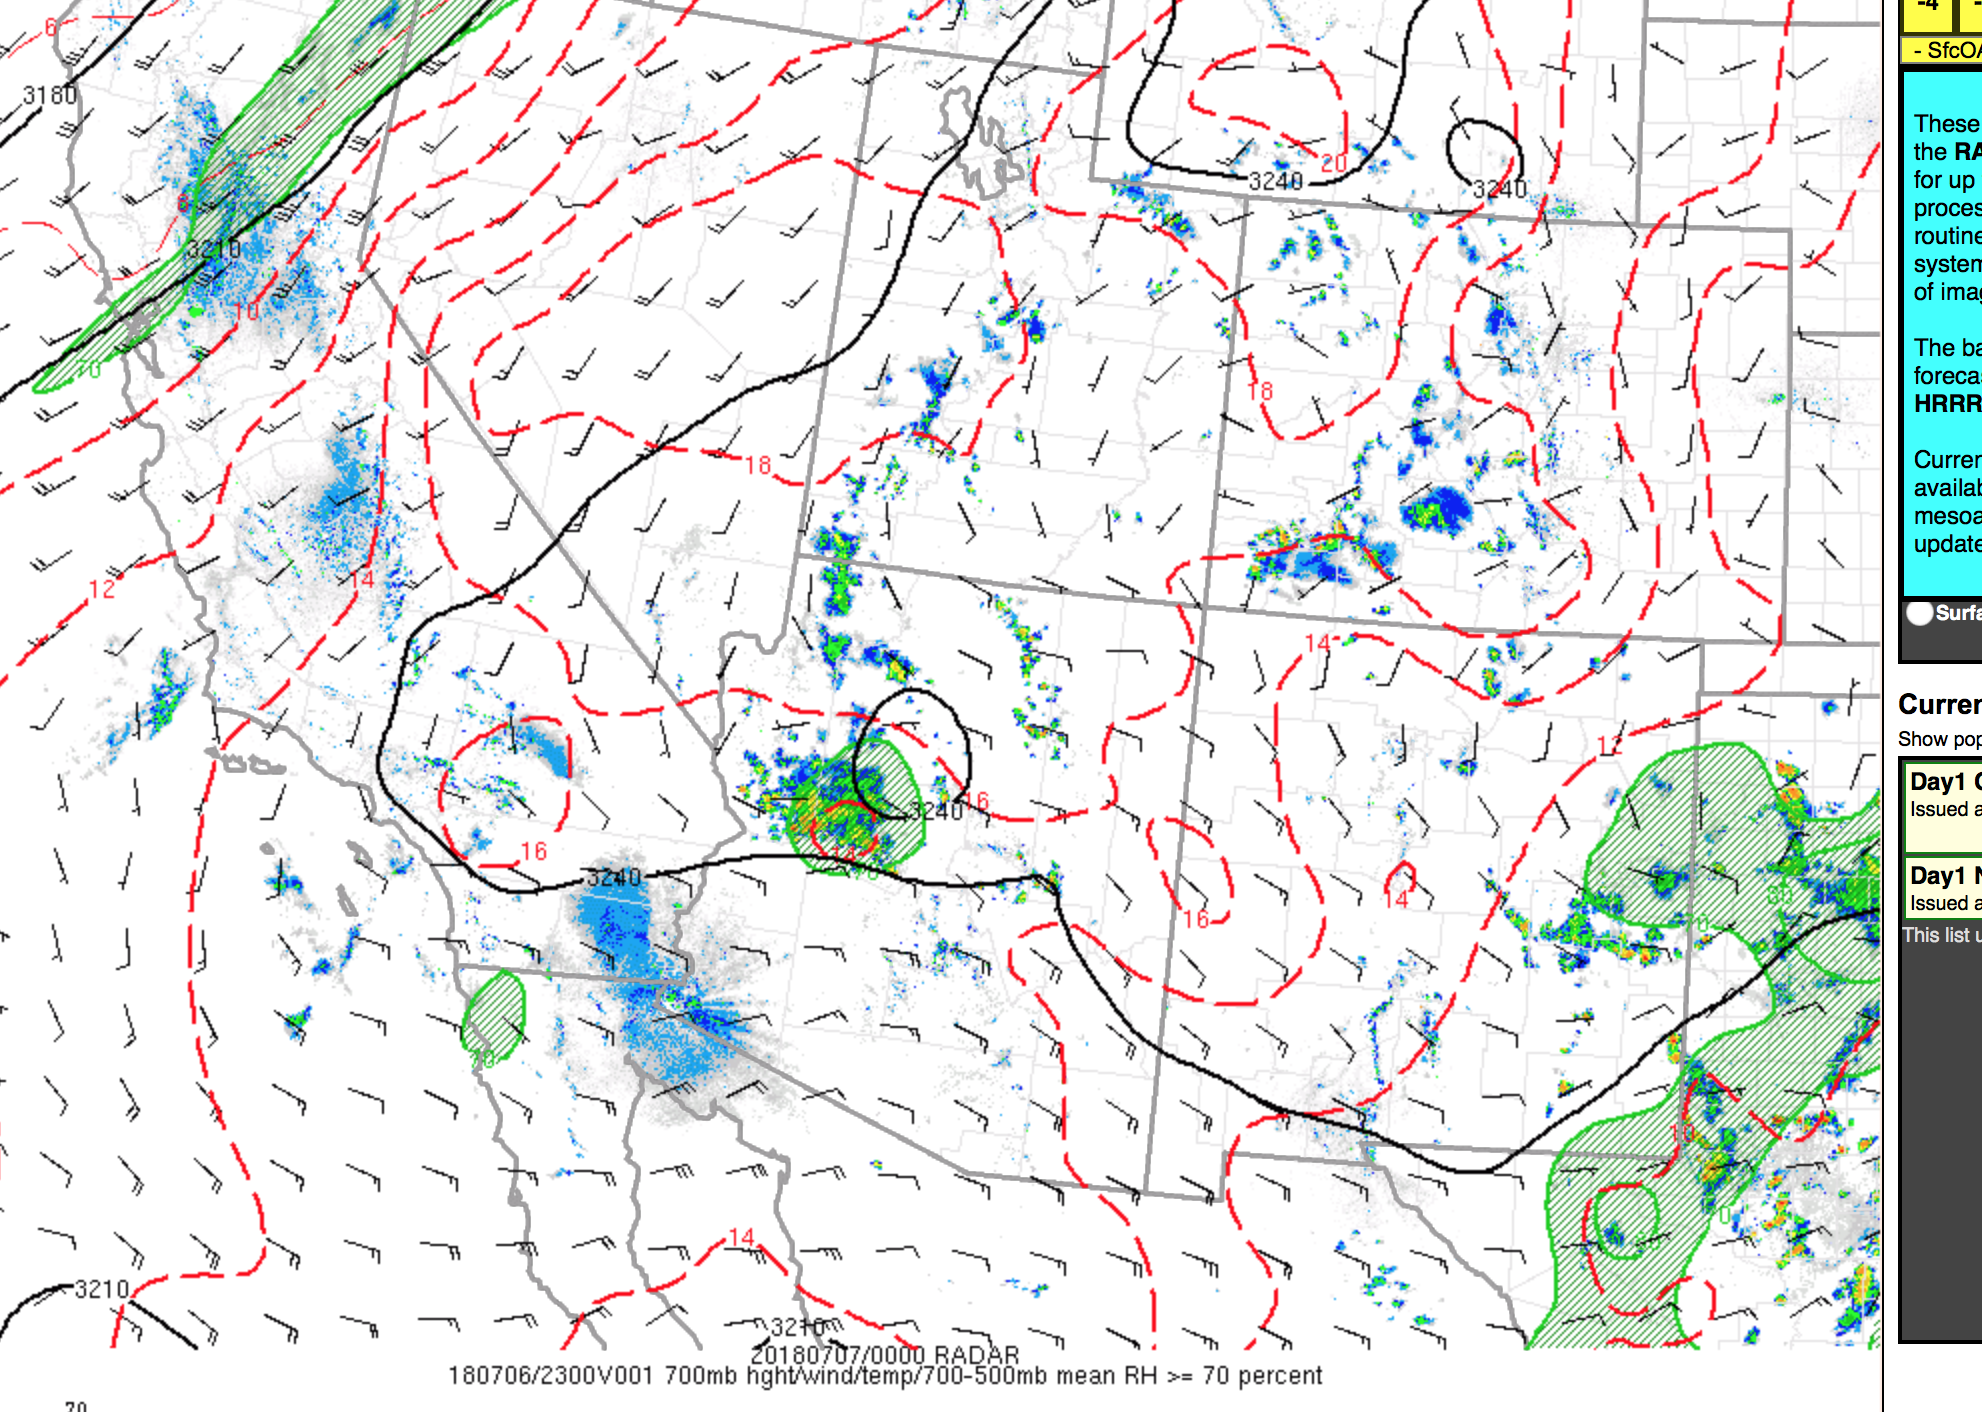
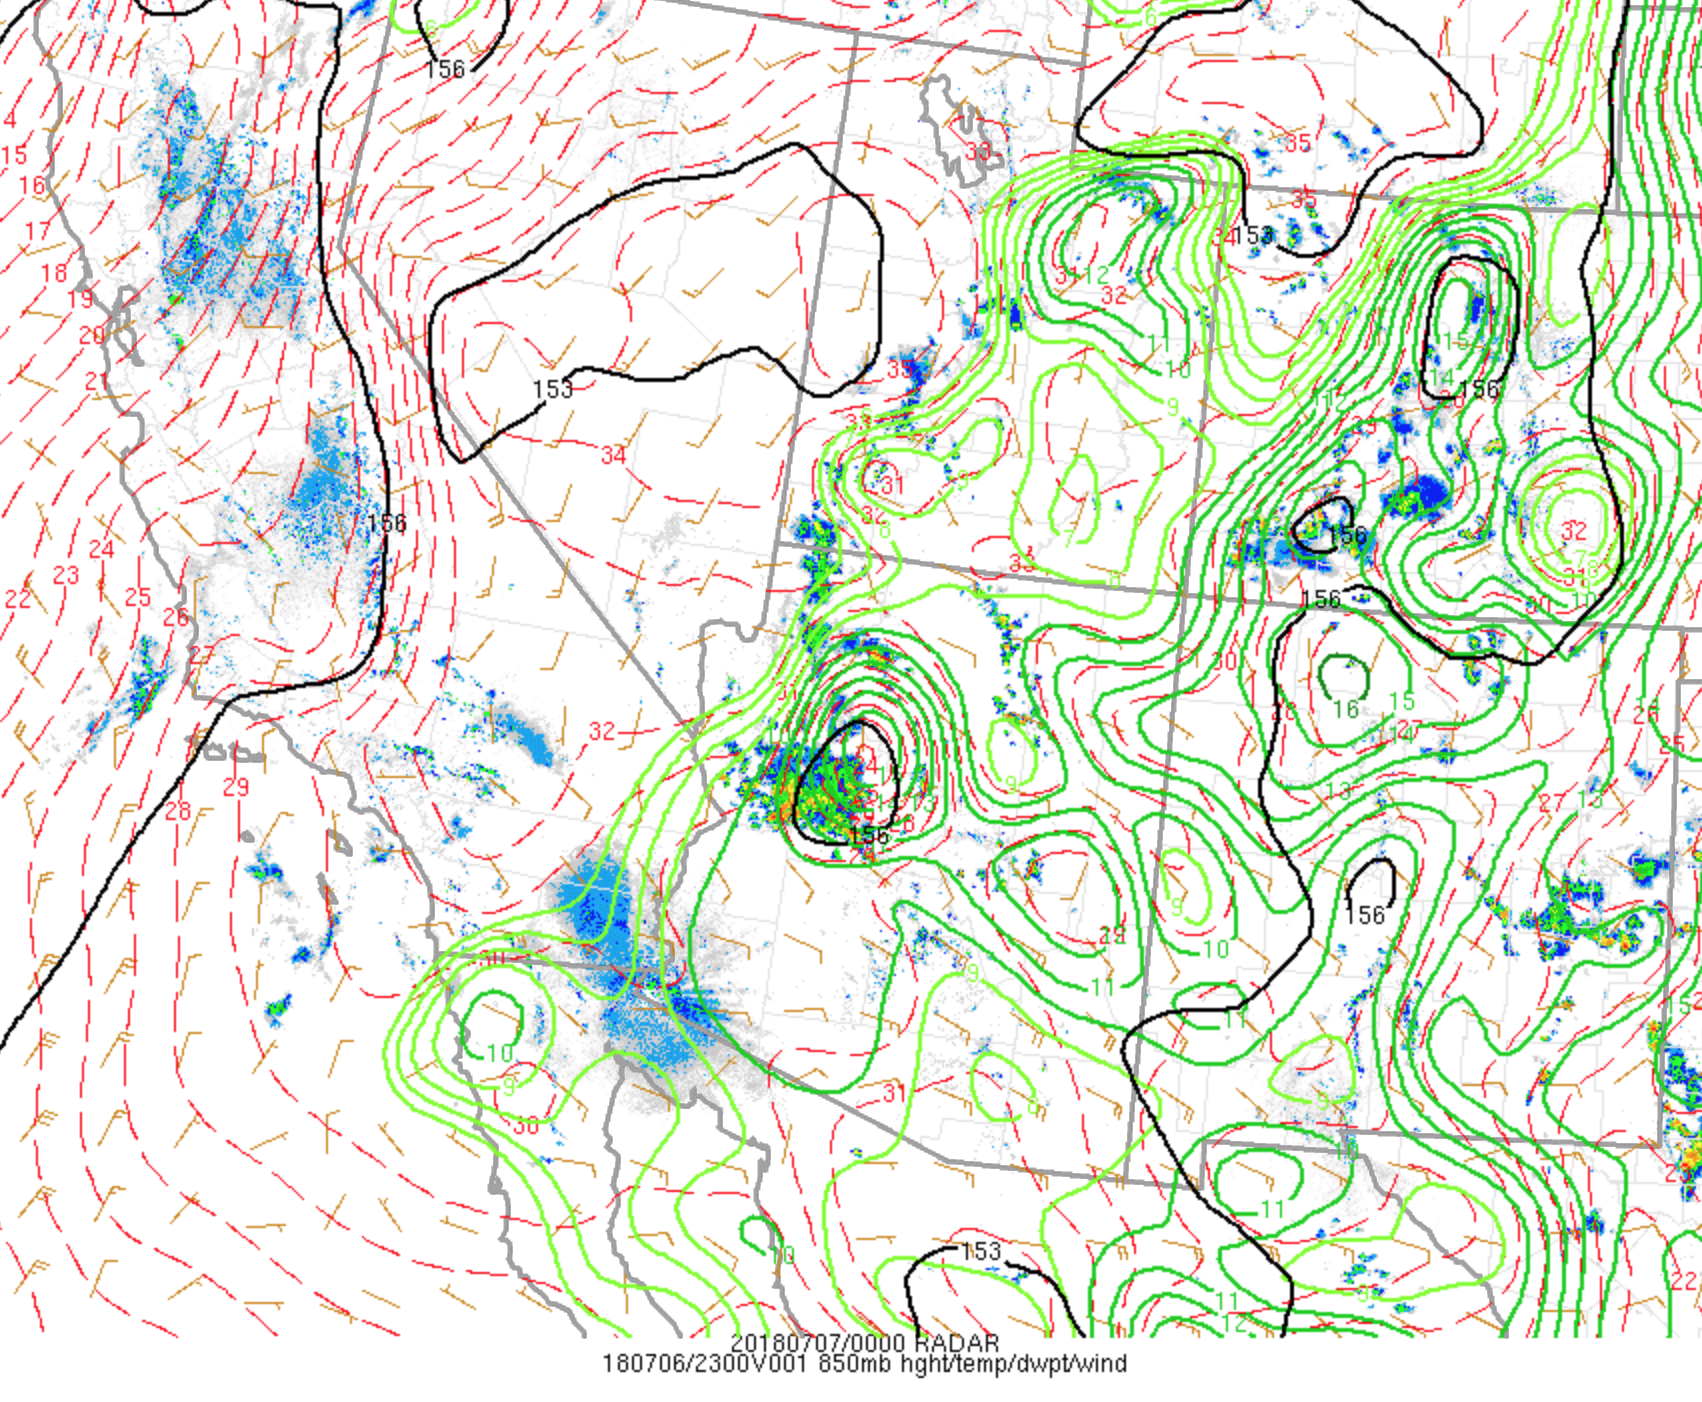
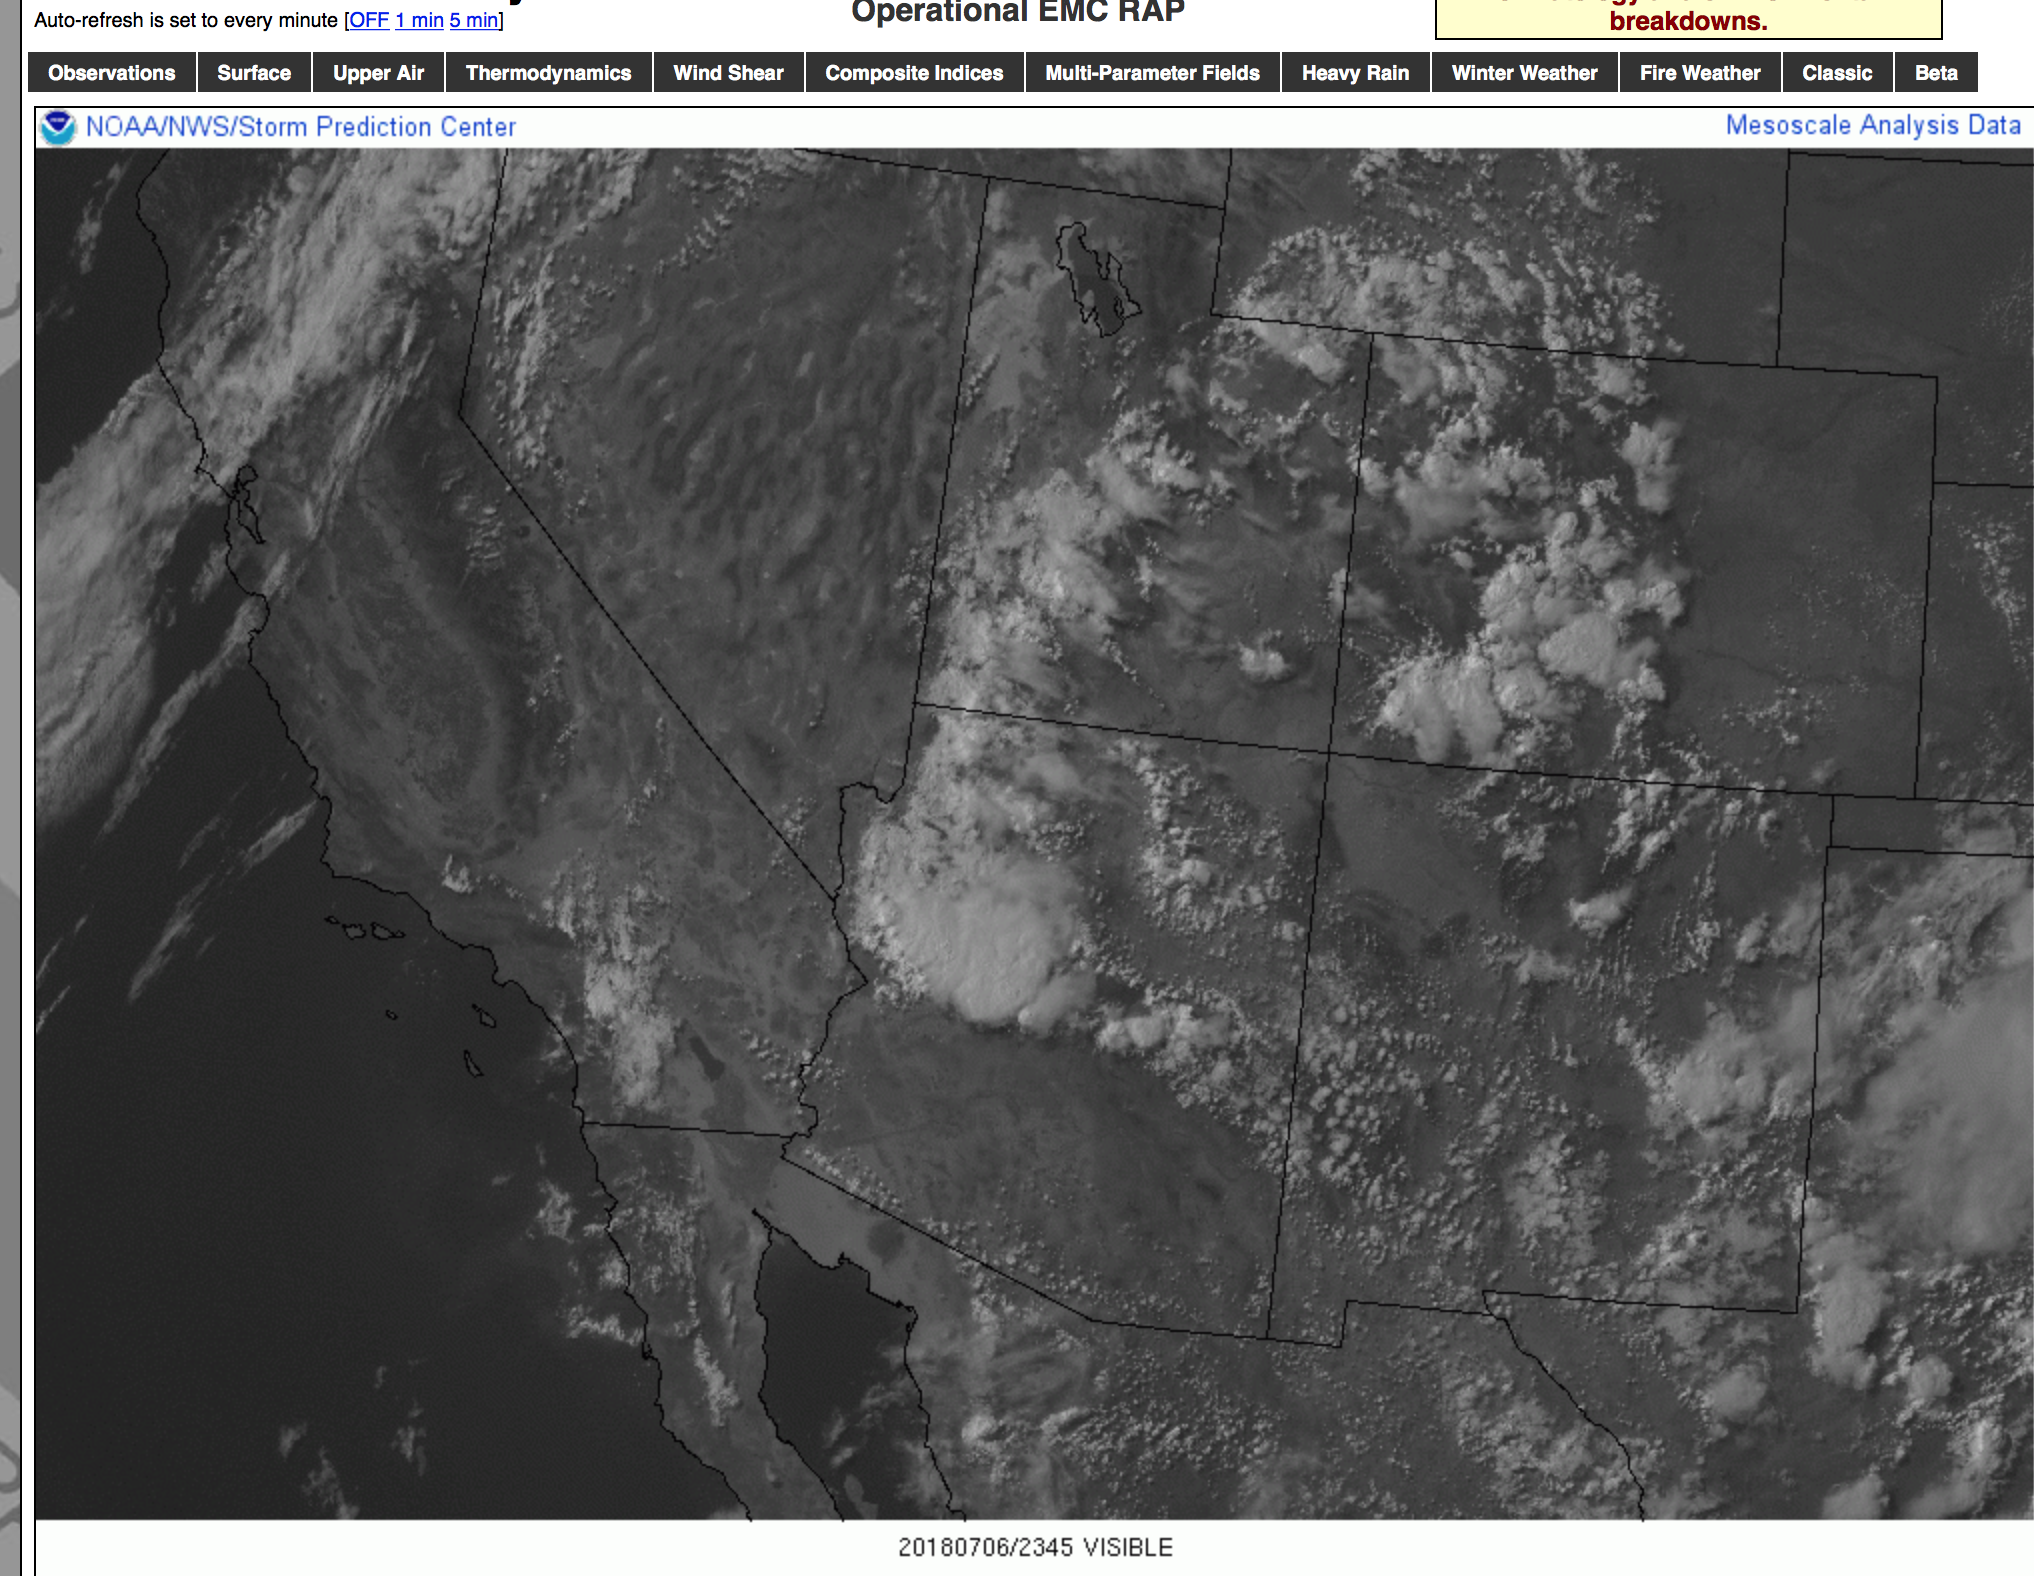
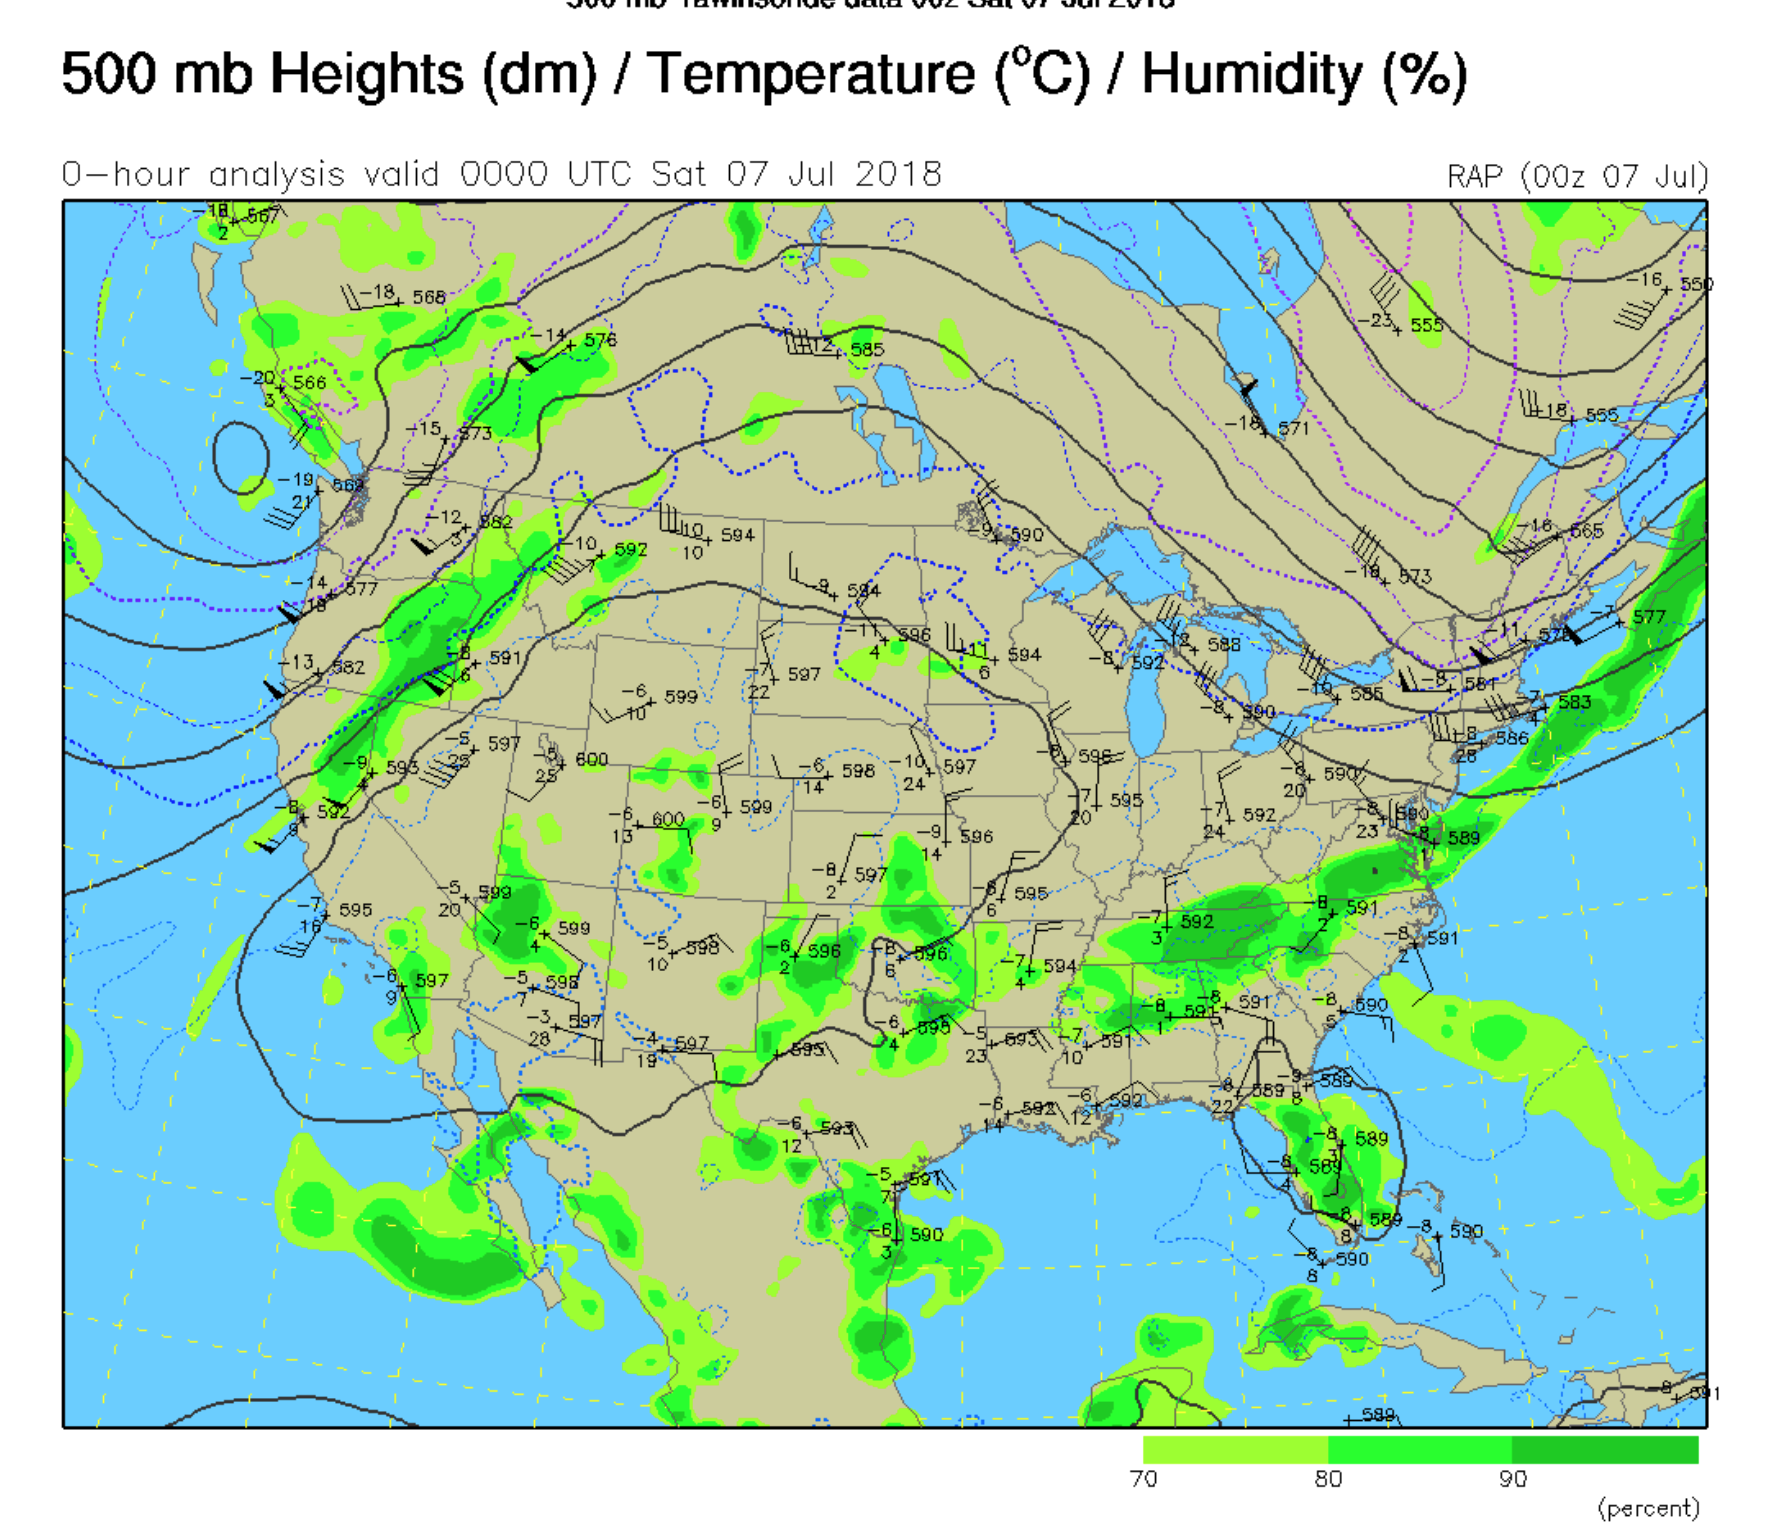
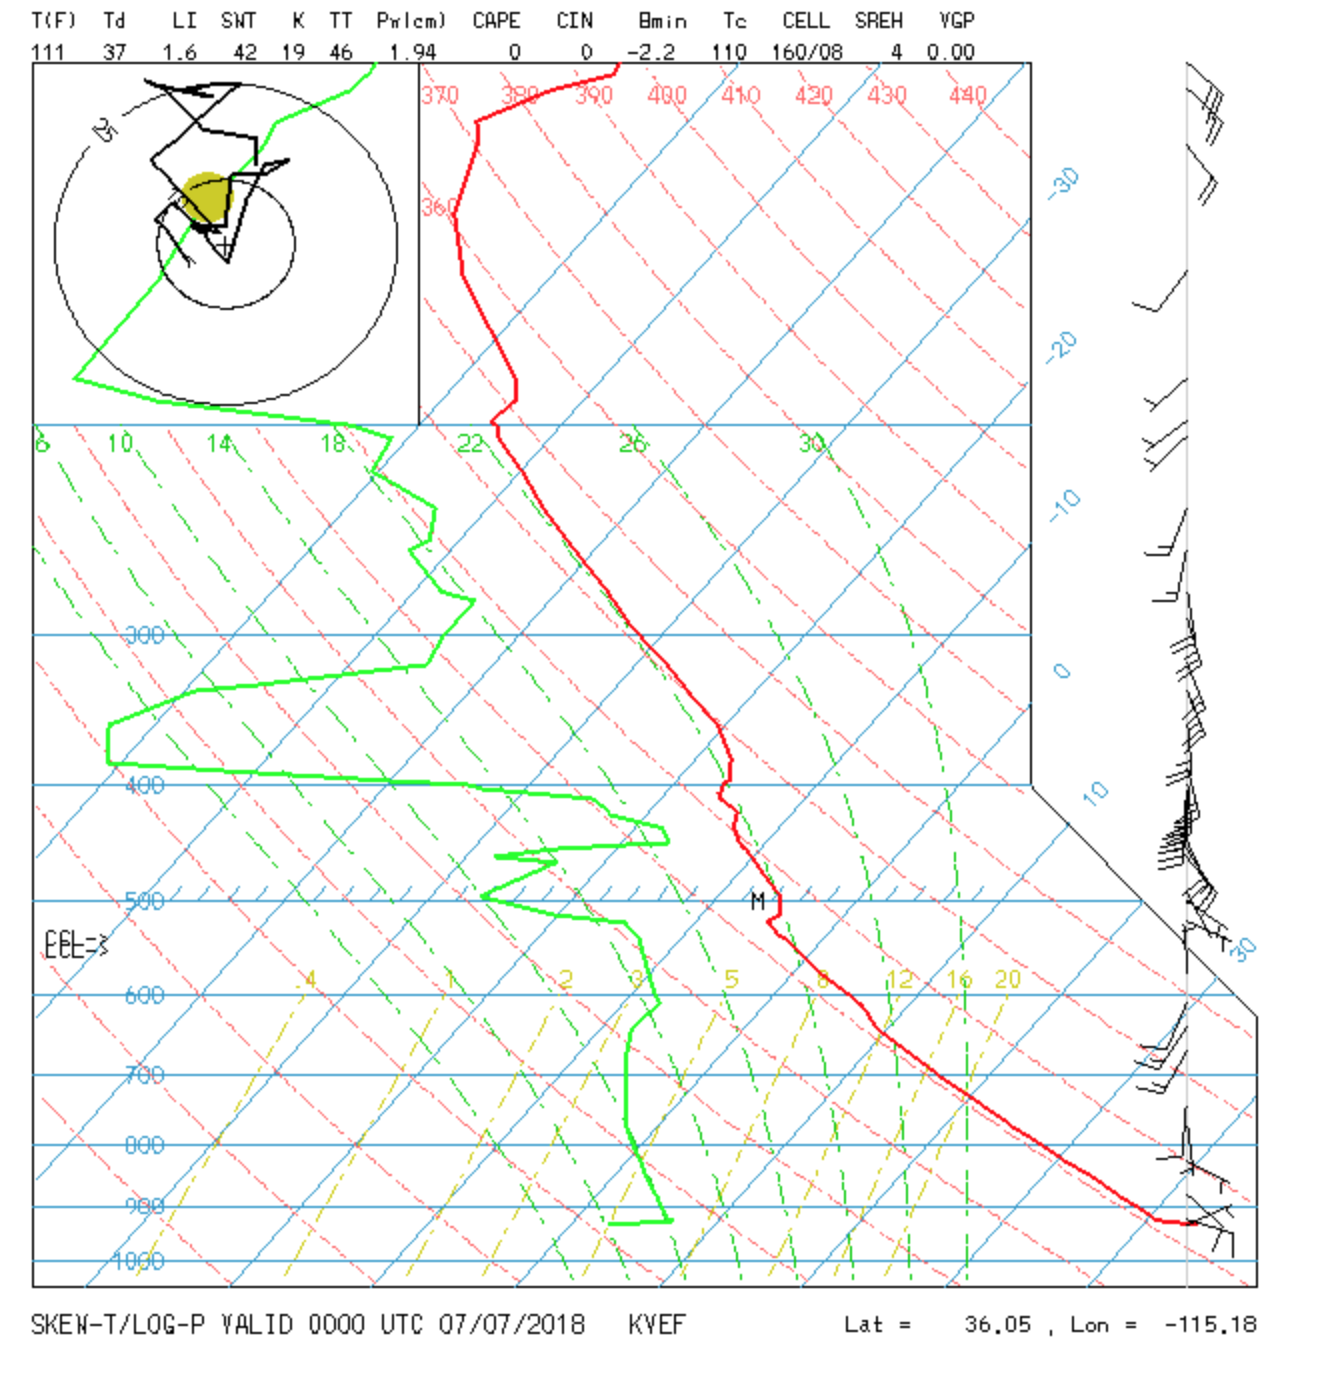
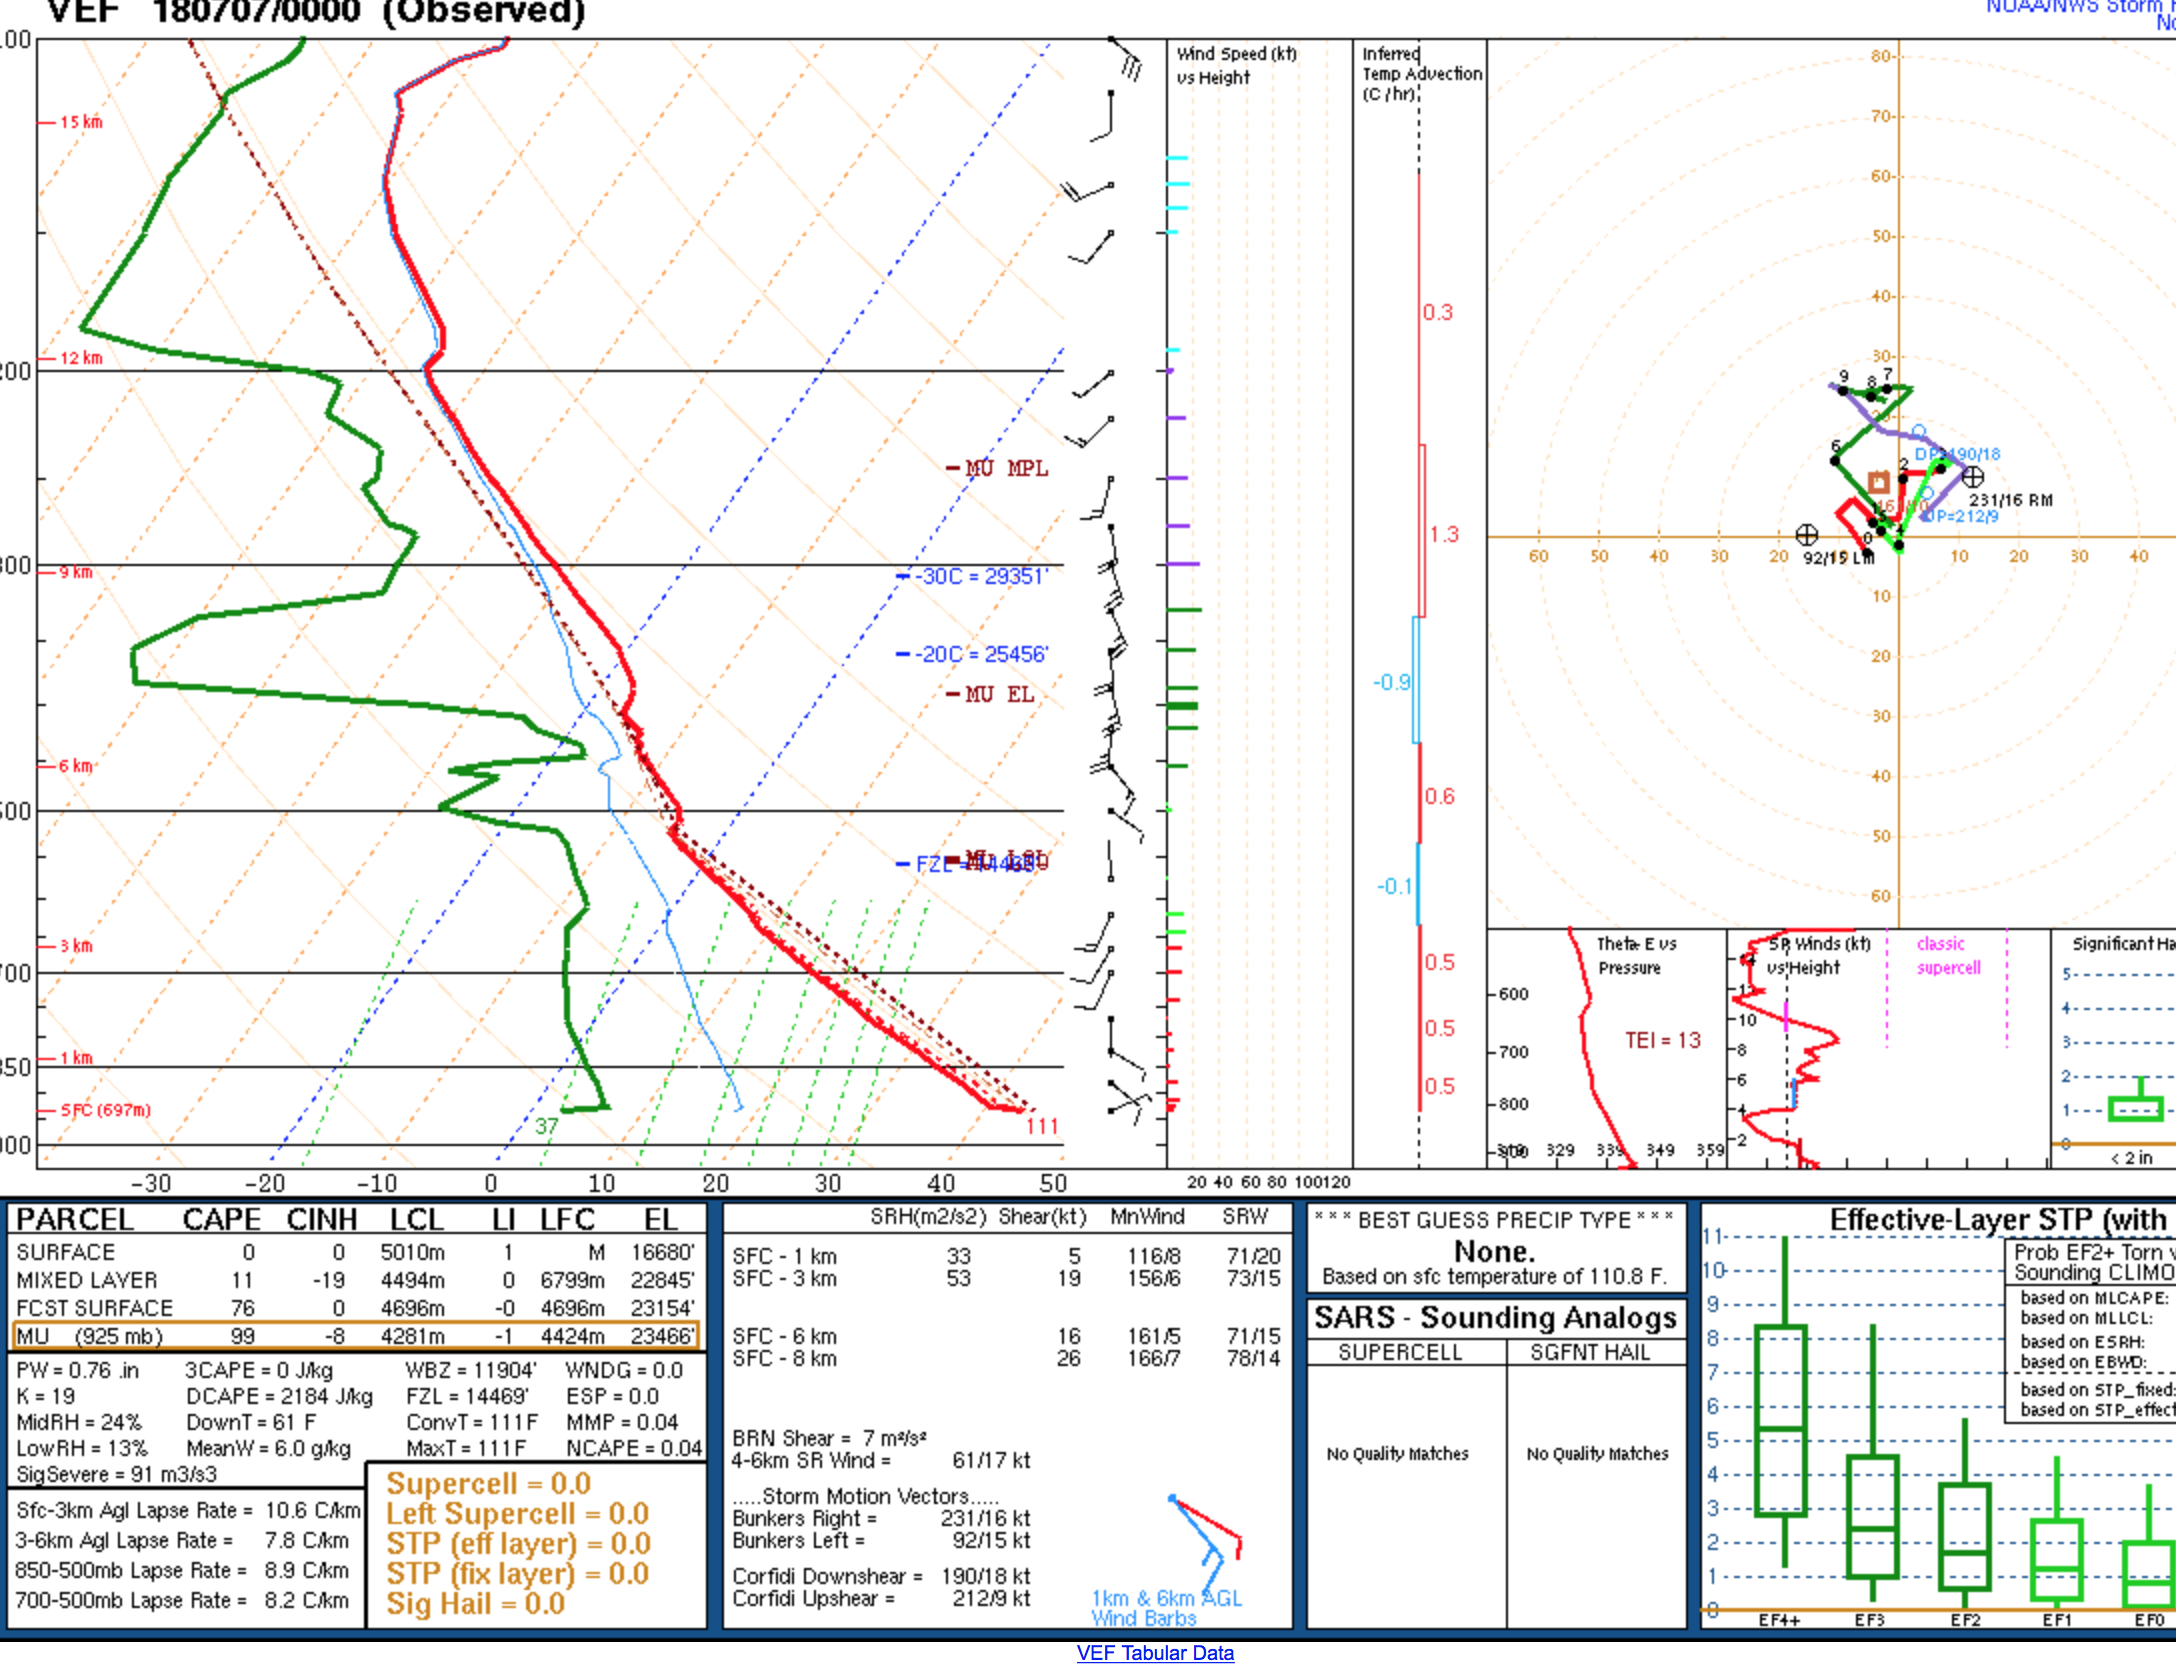
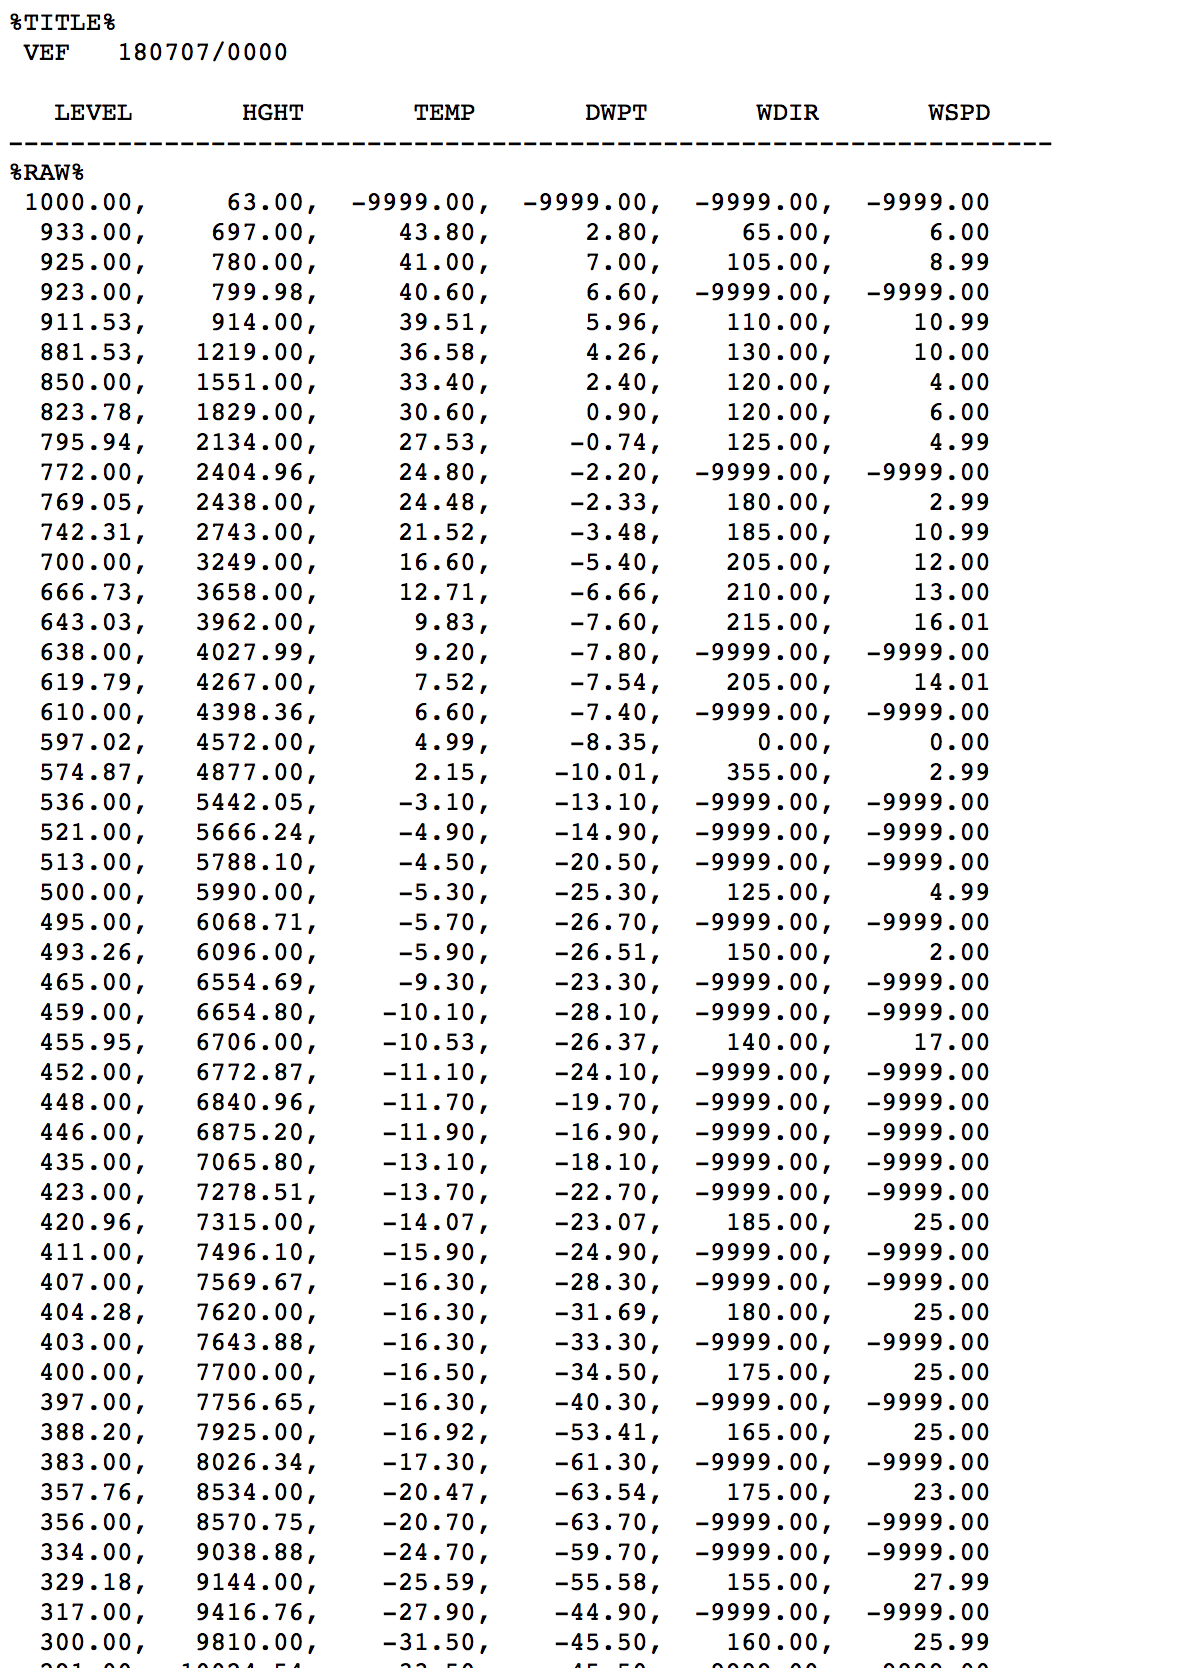
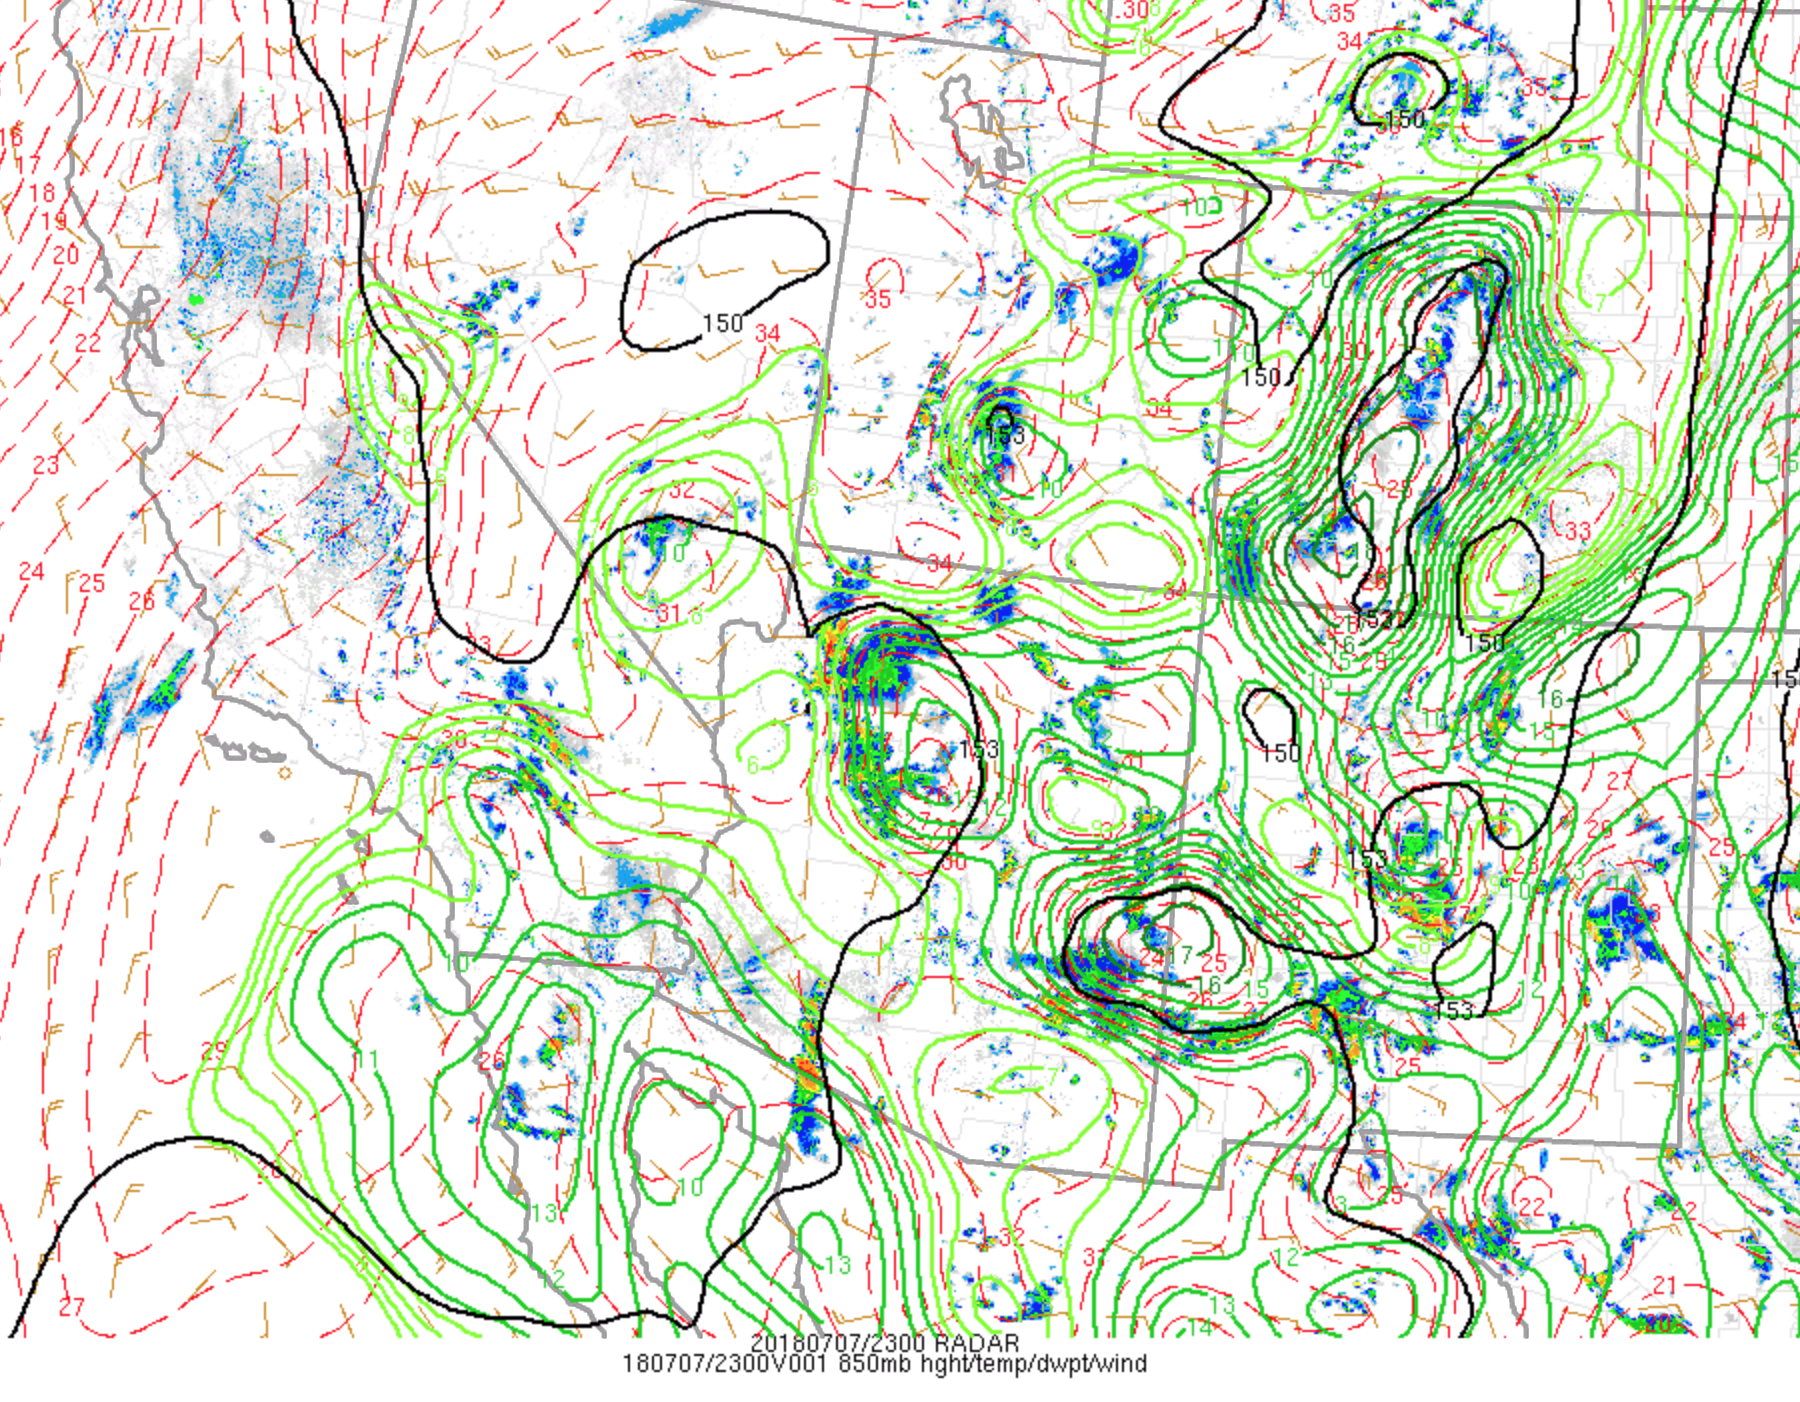
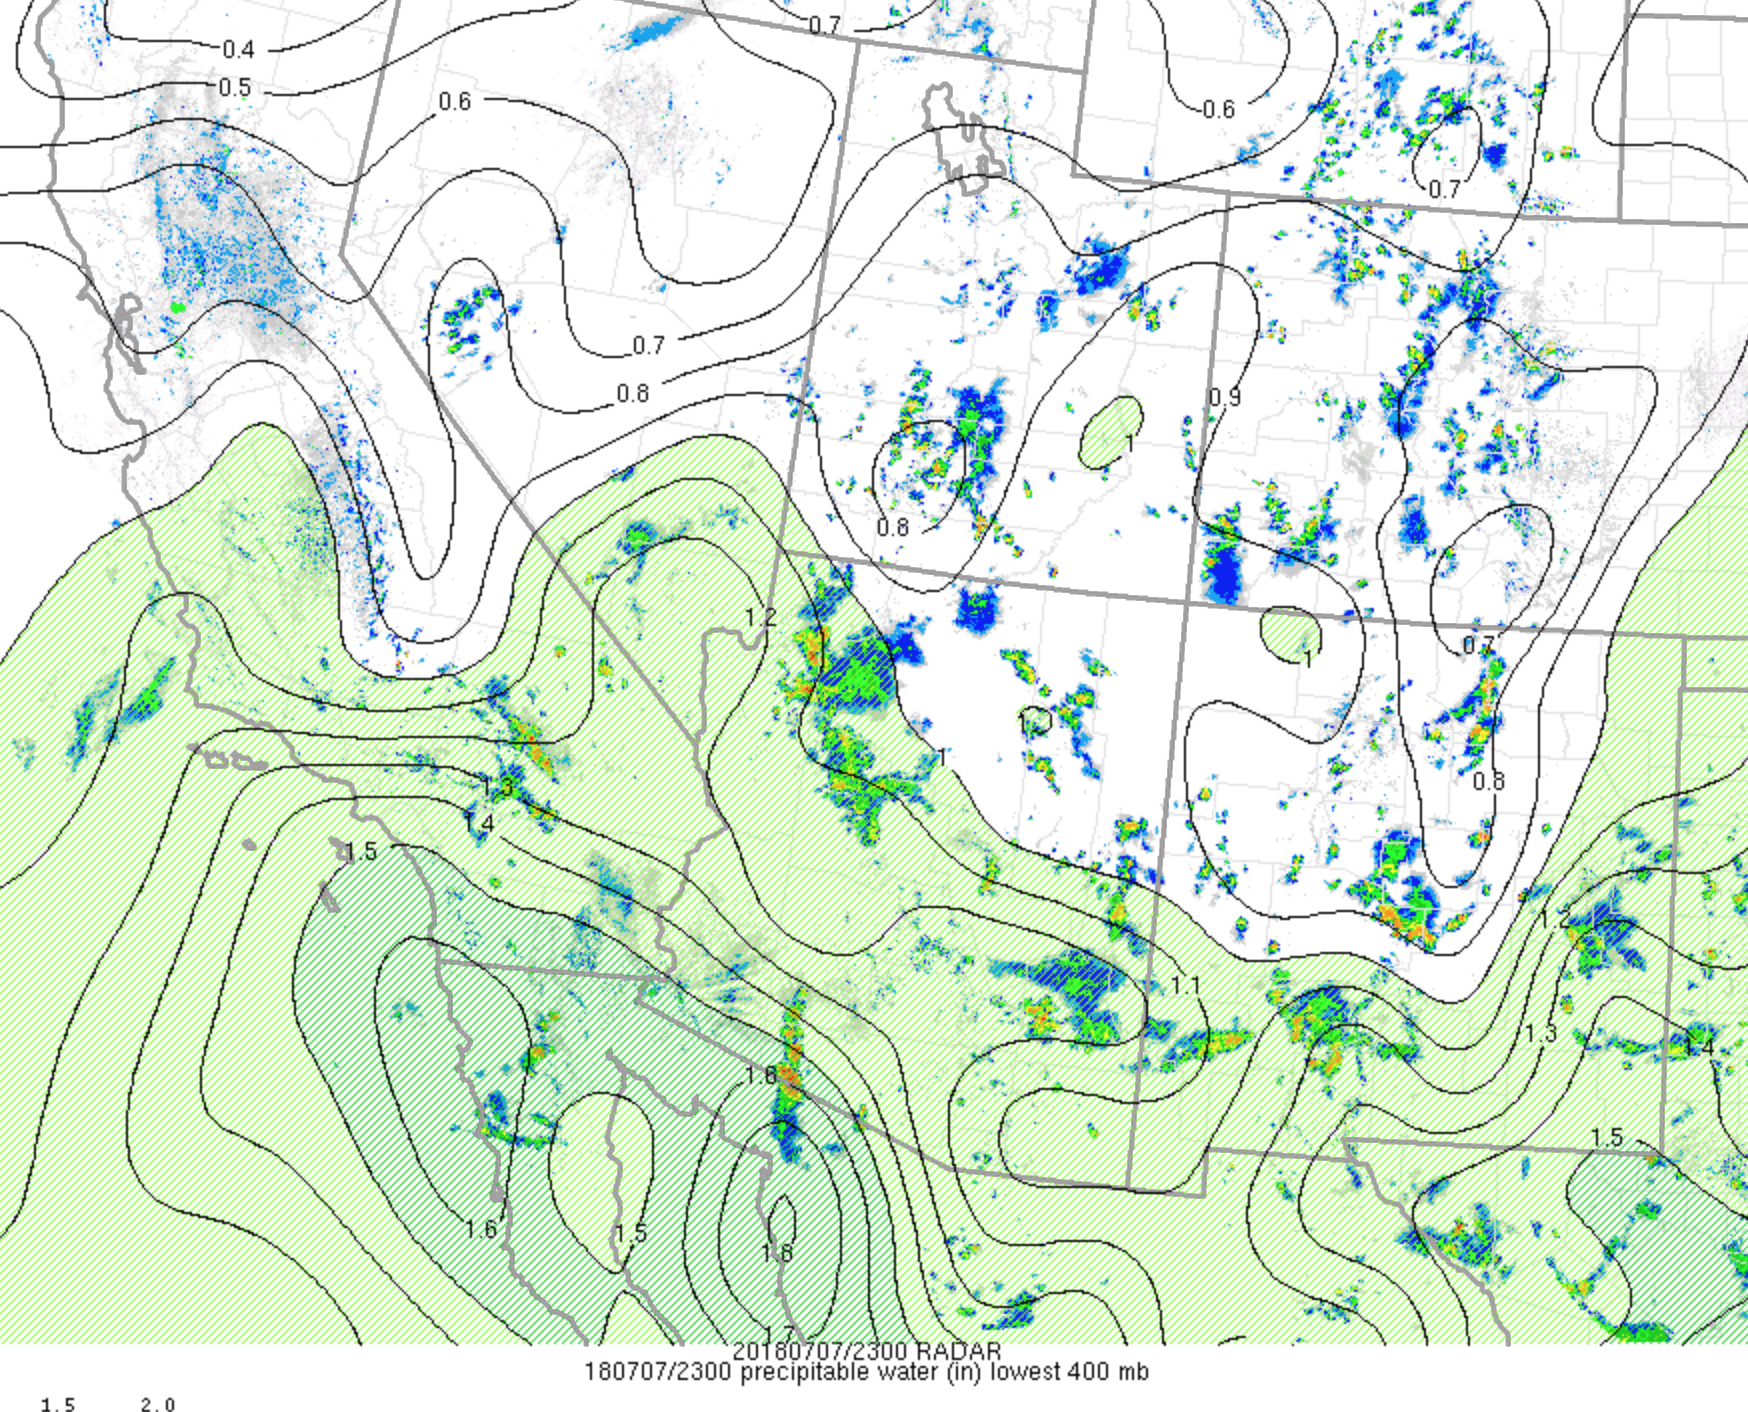
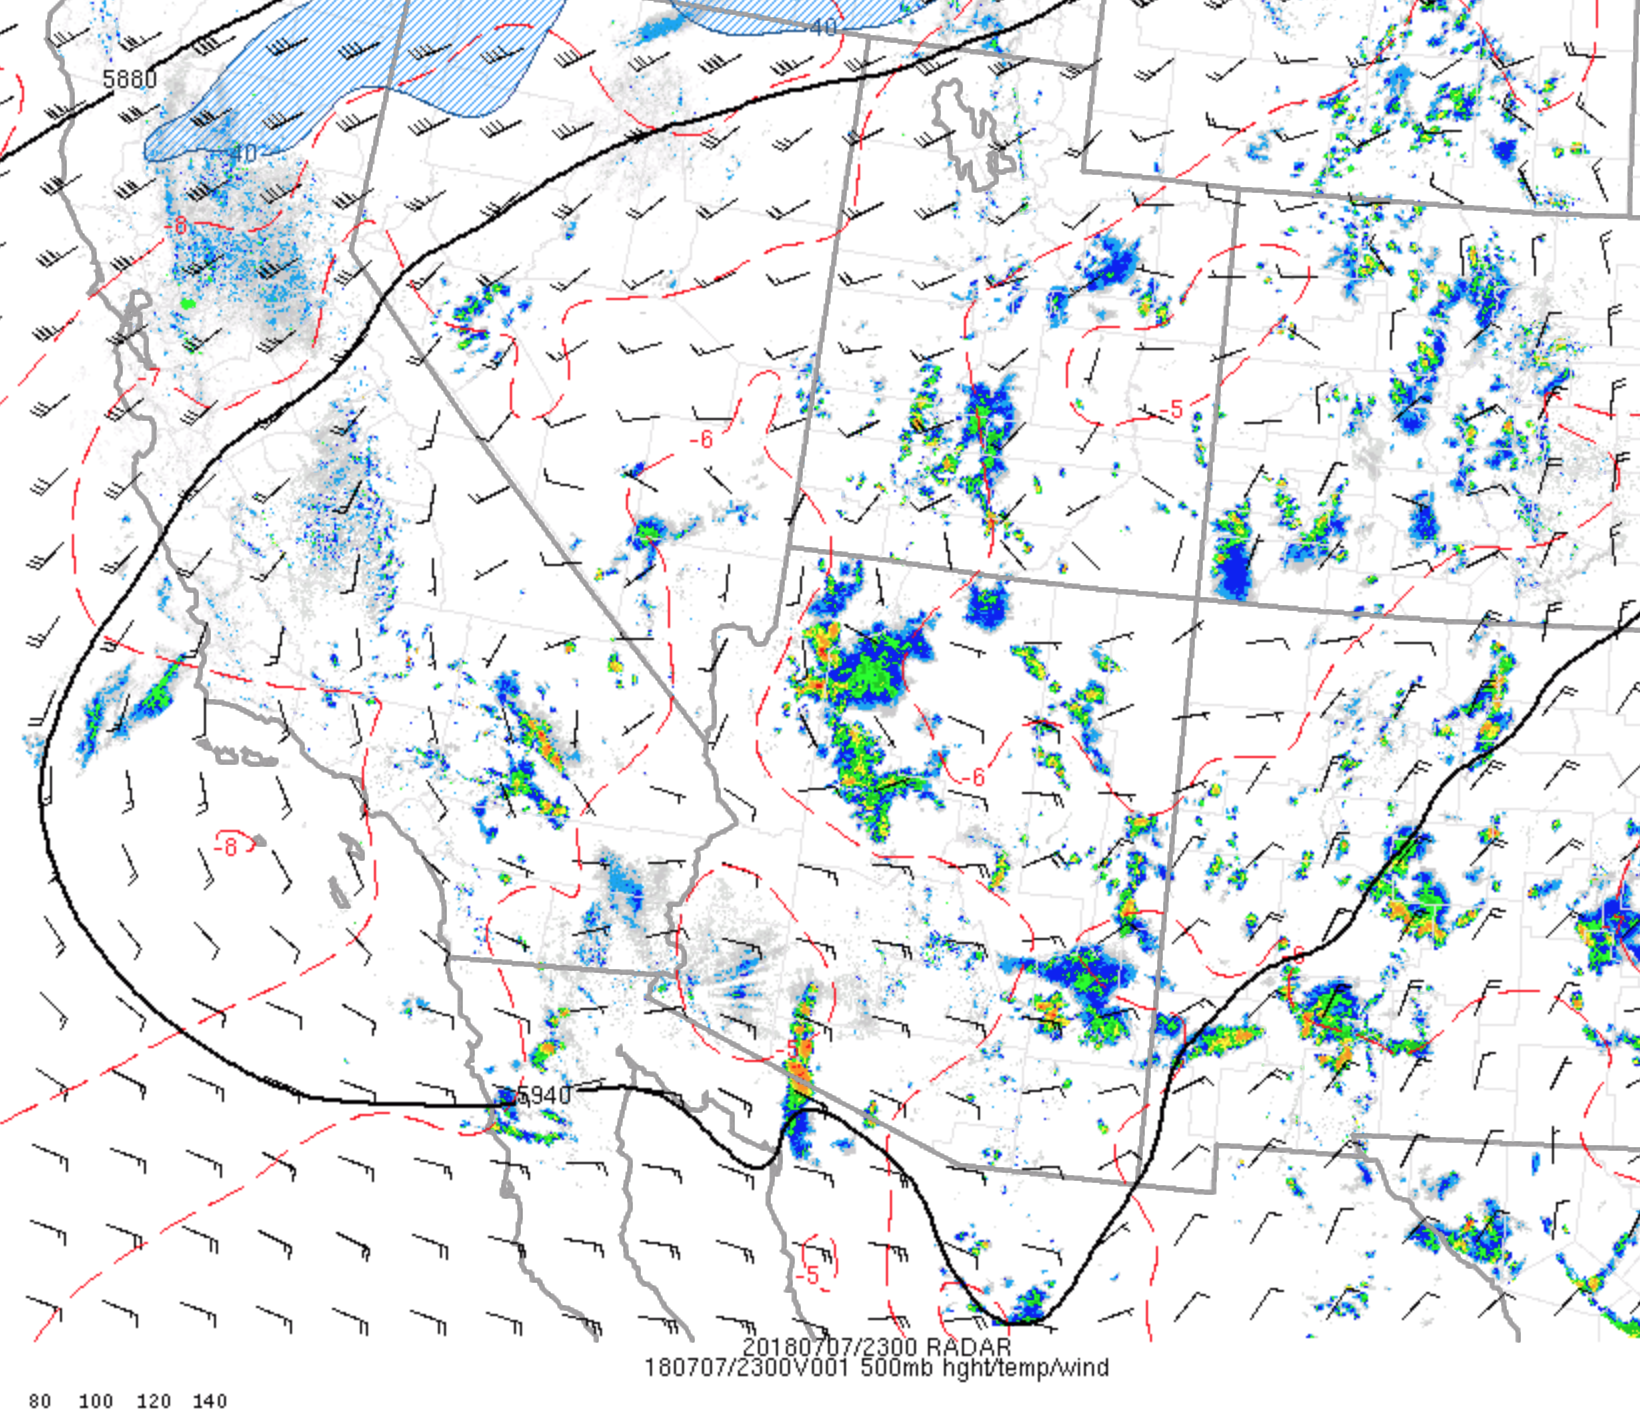
July 7
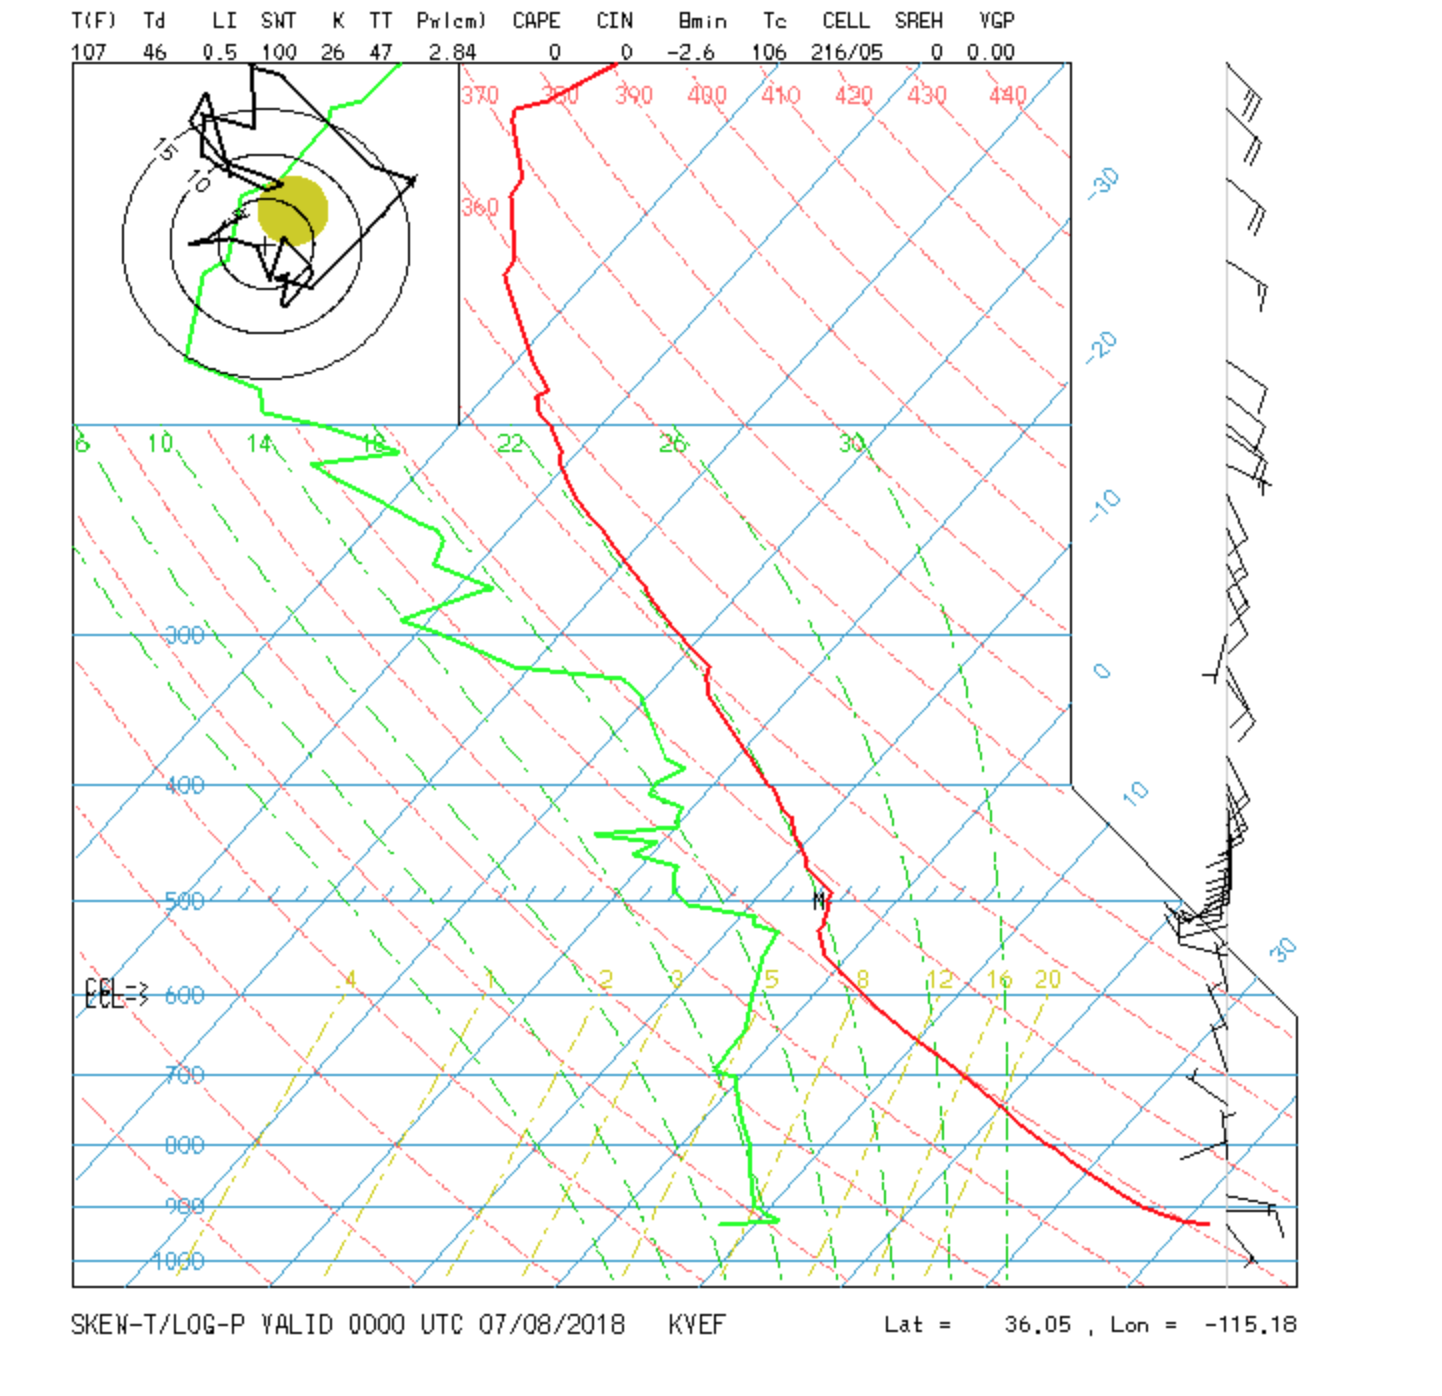
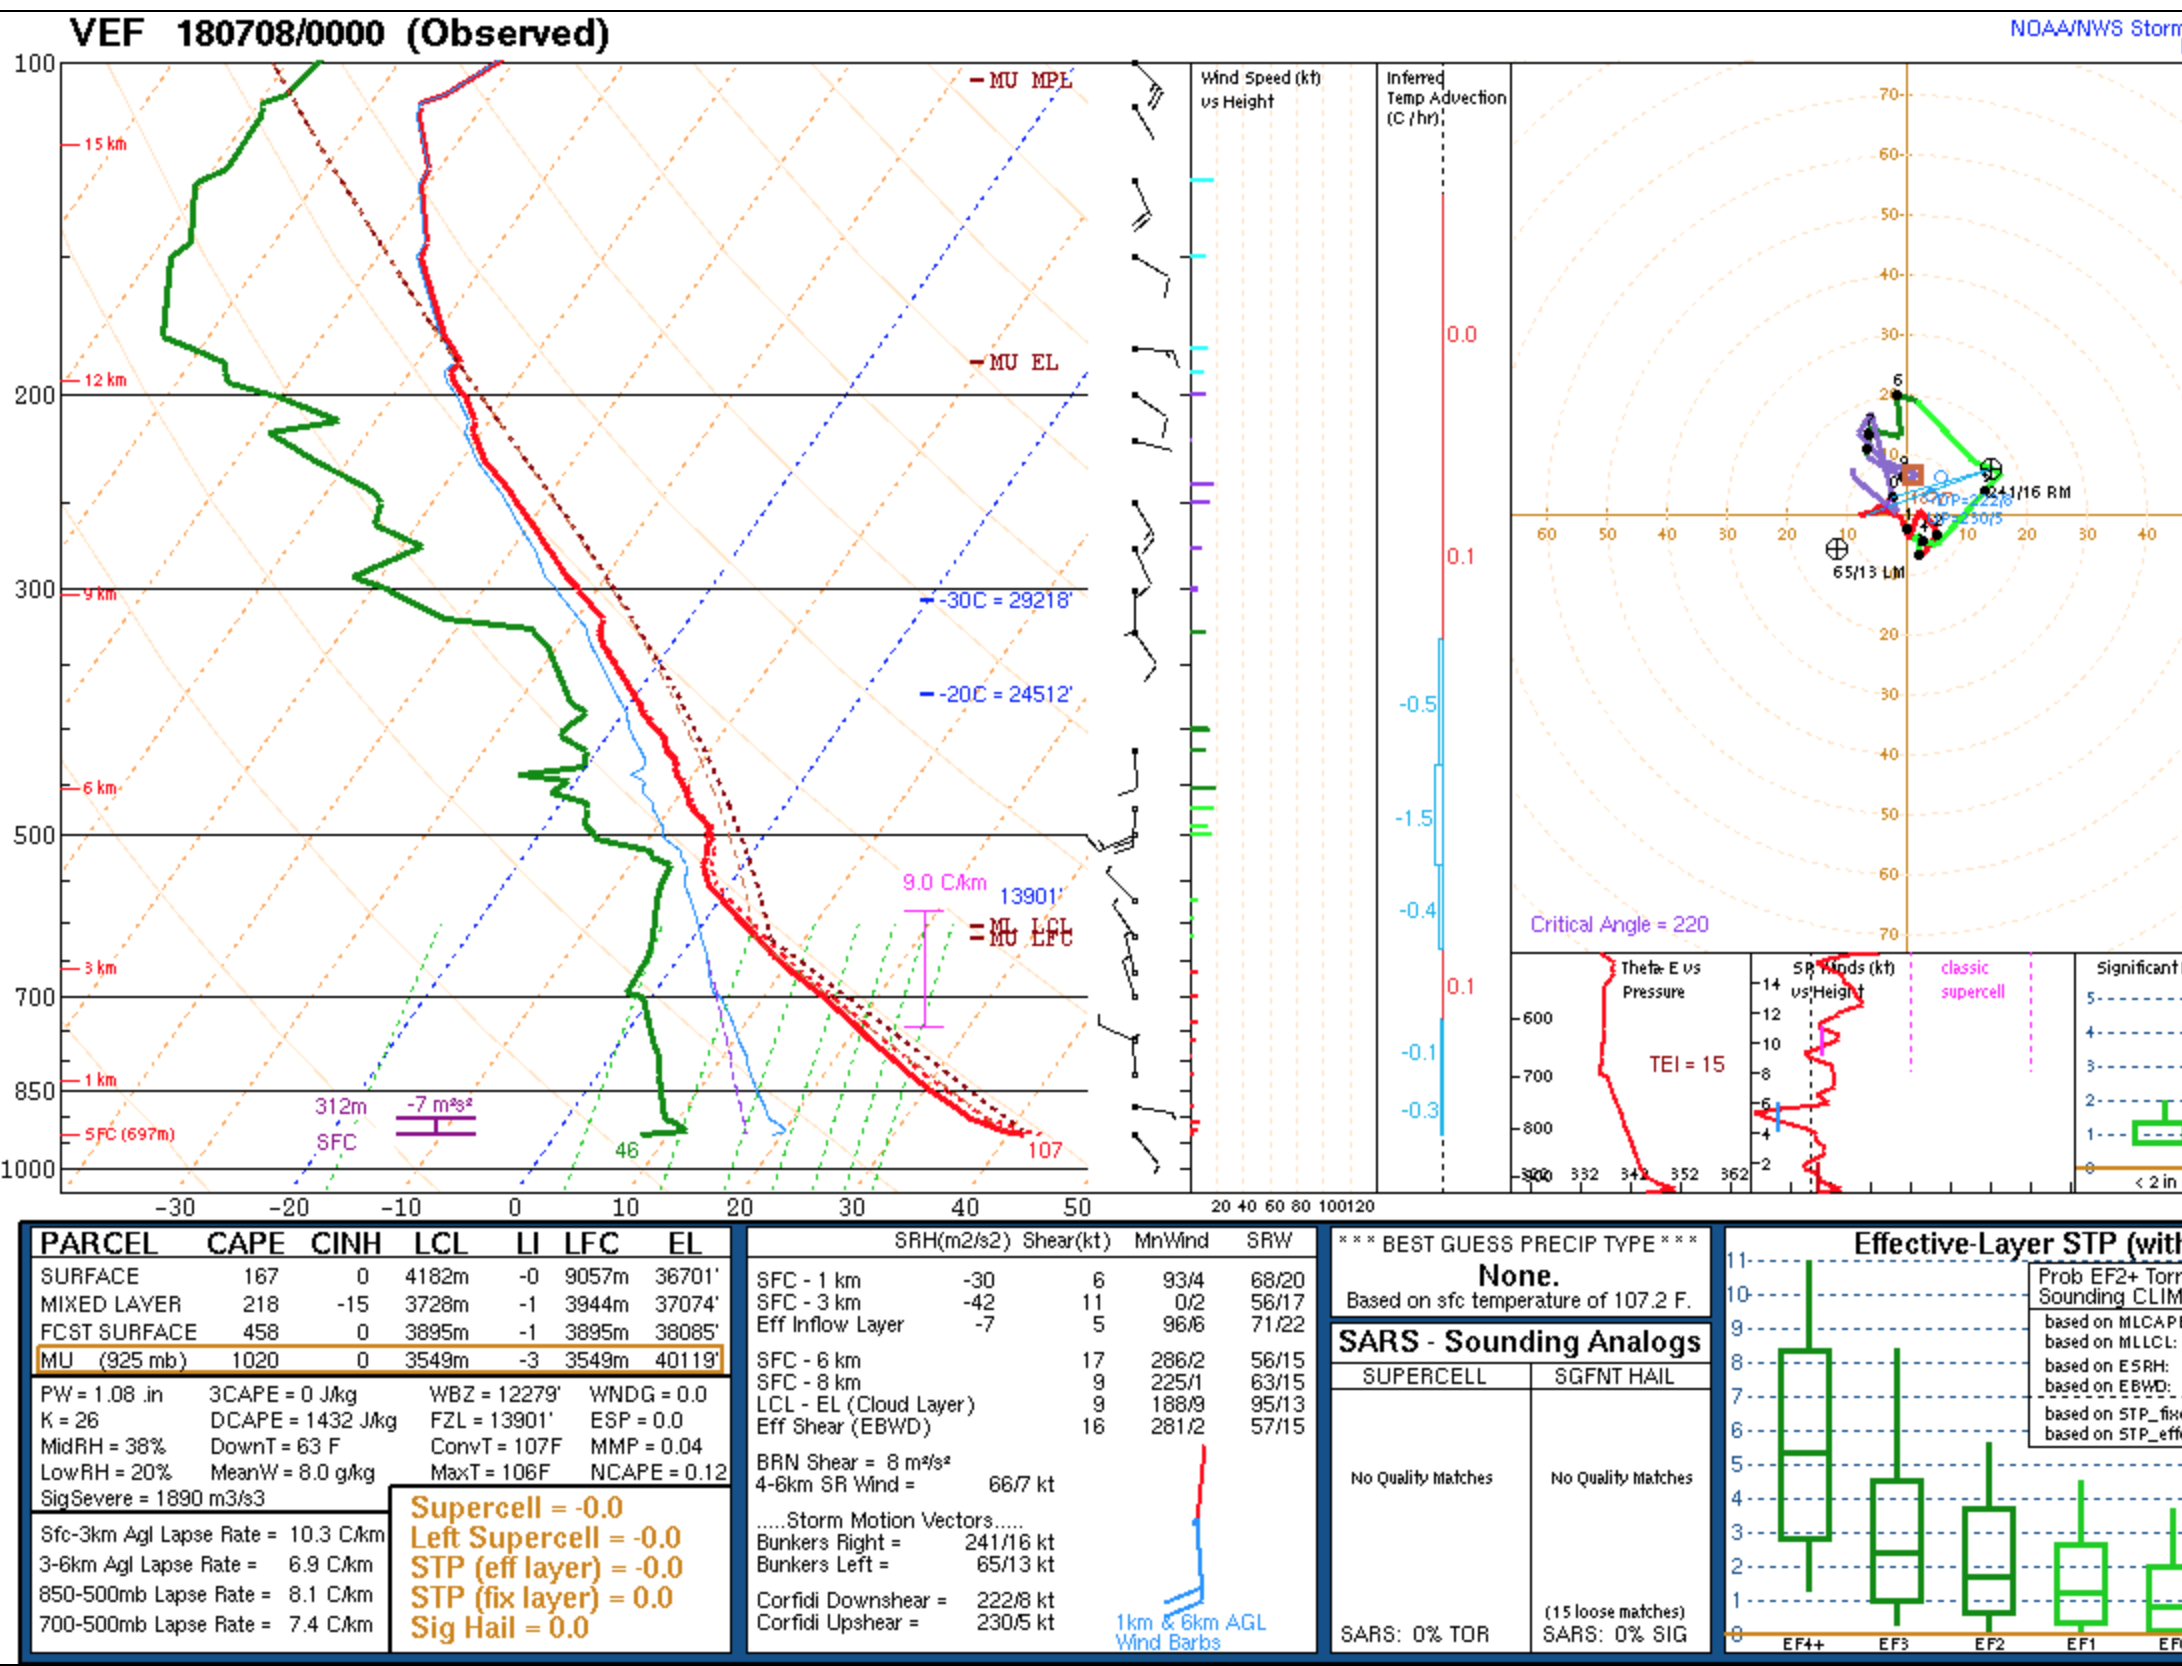
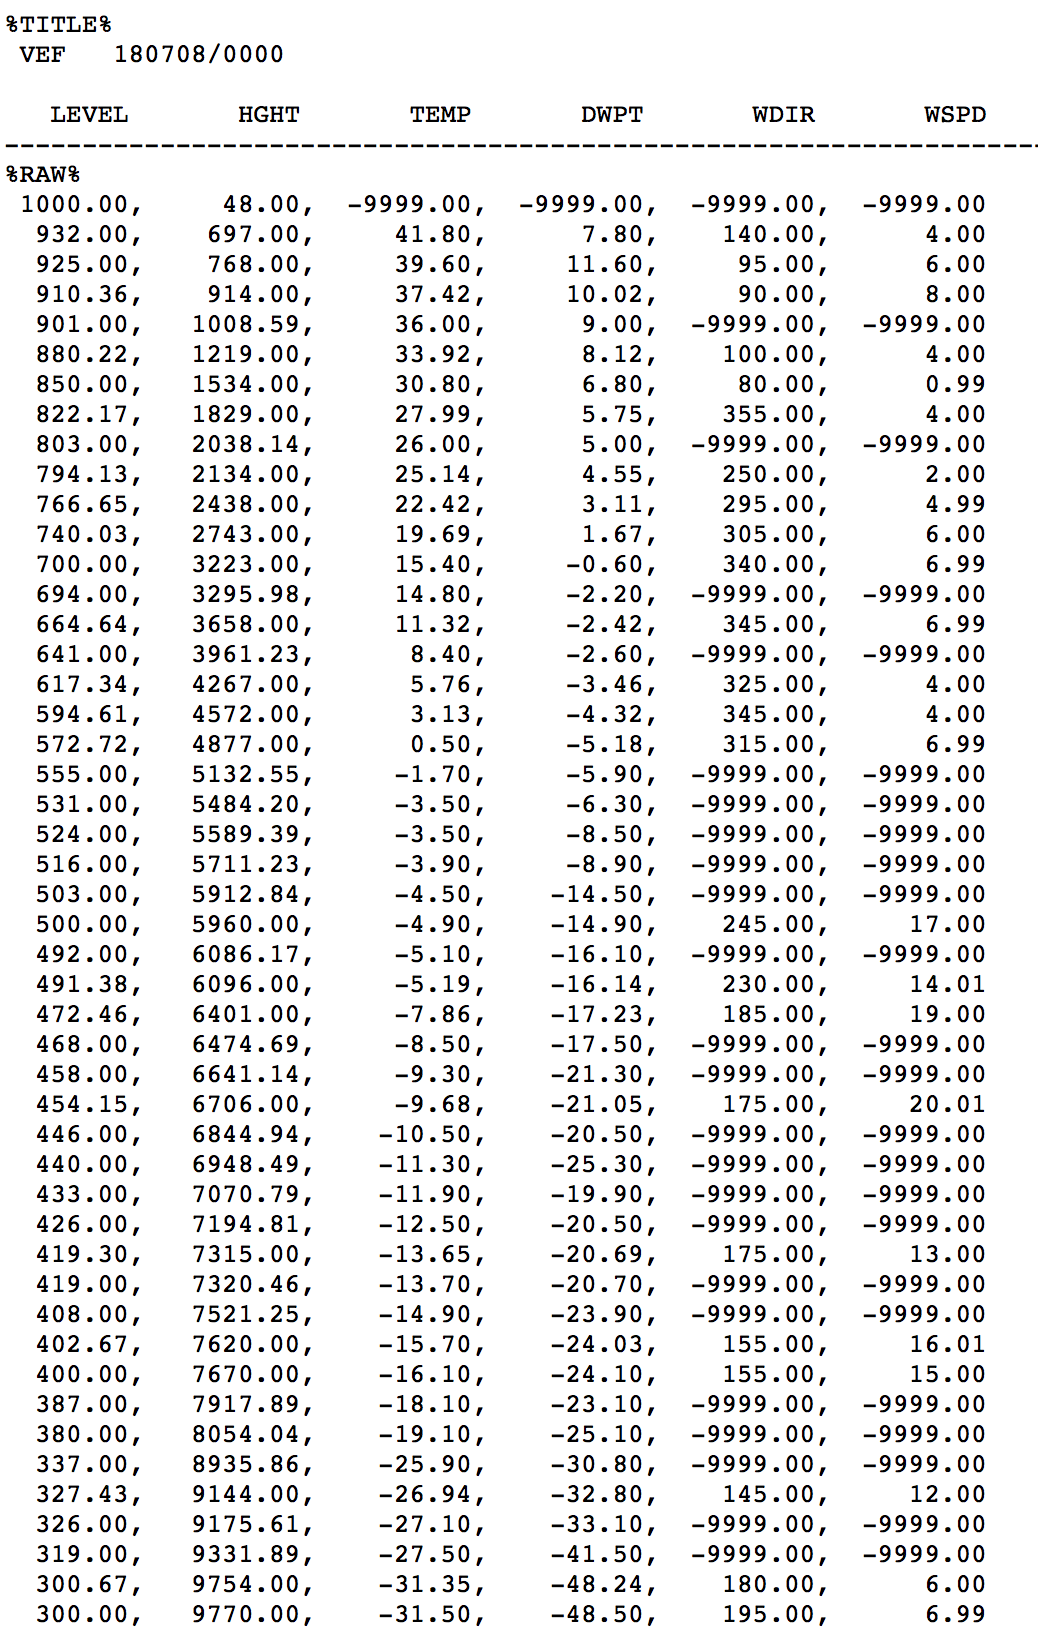
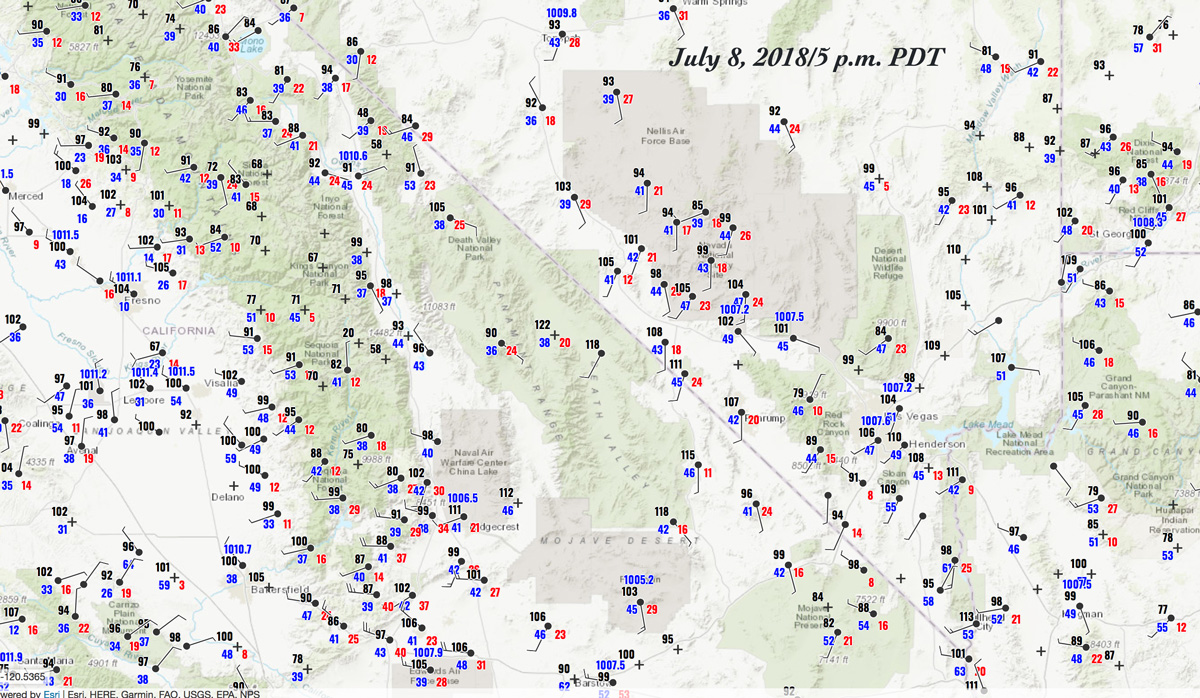
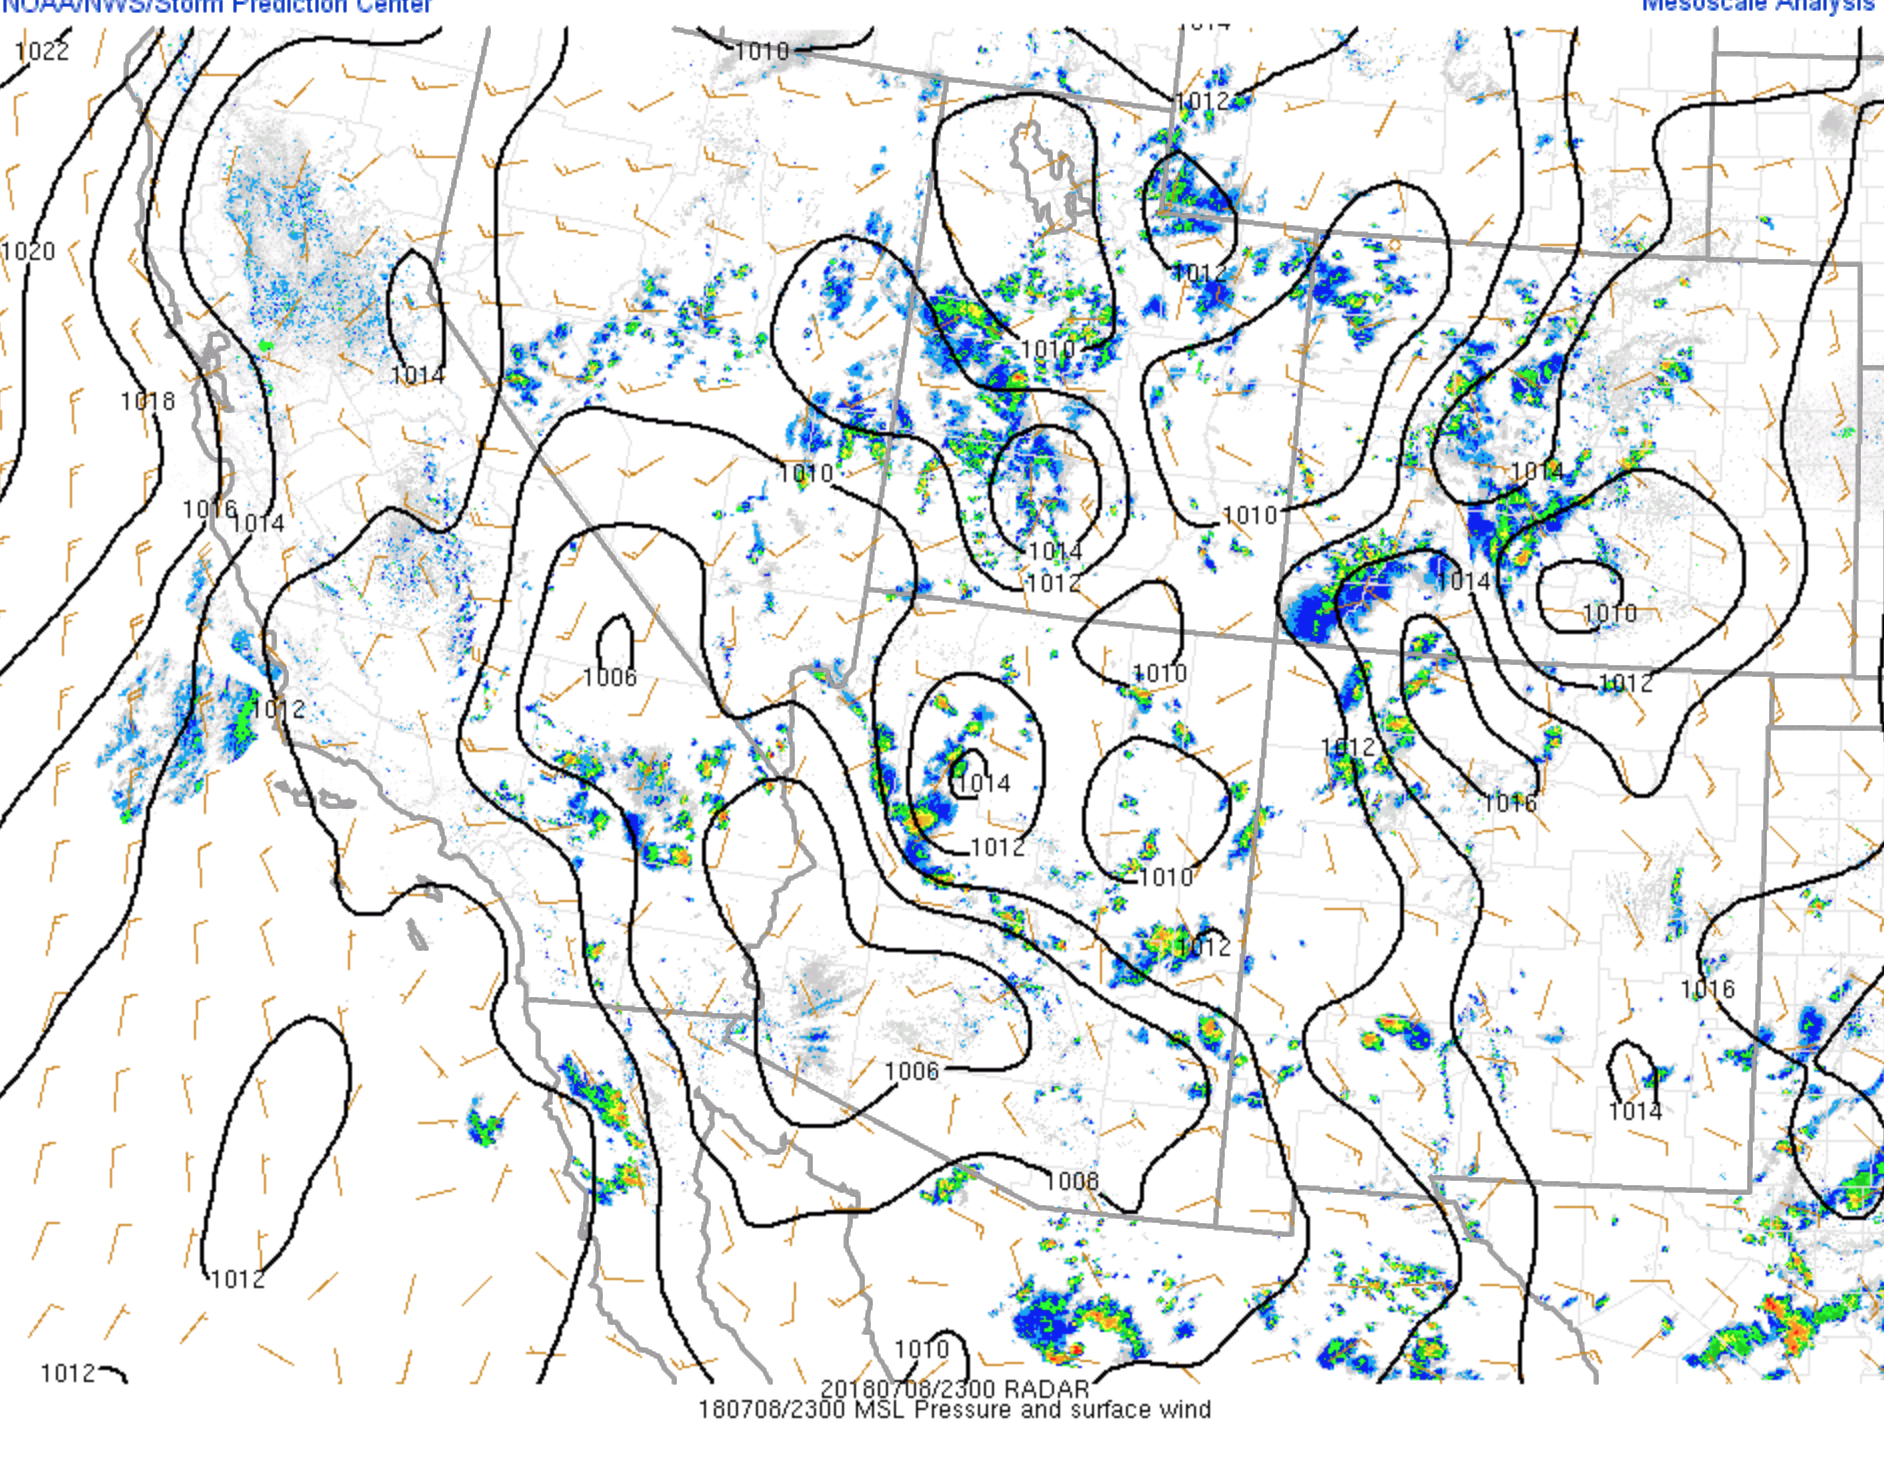
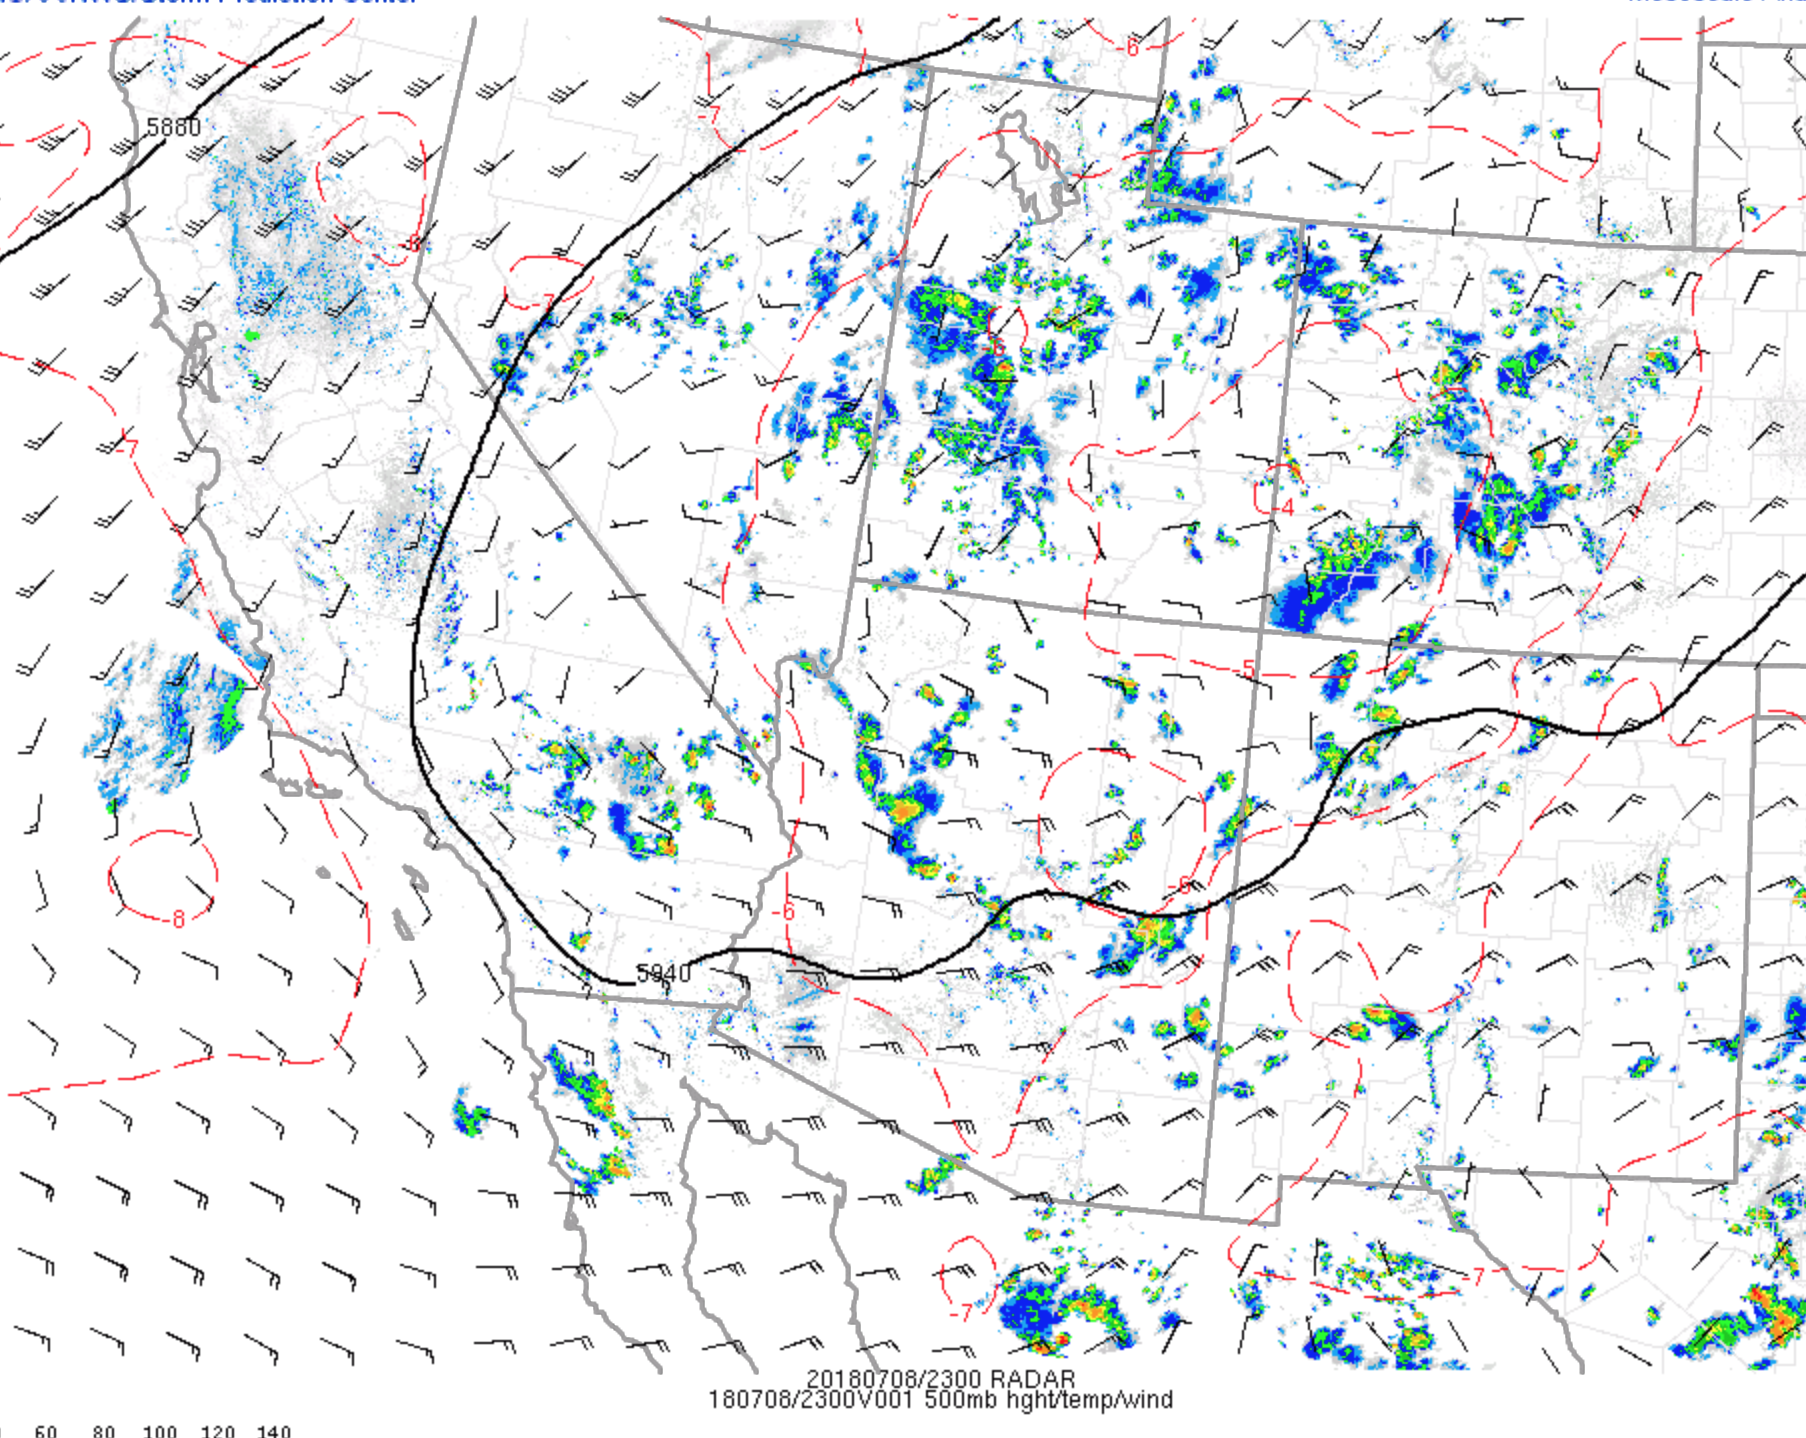
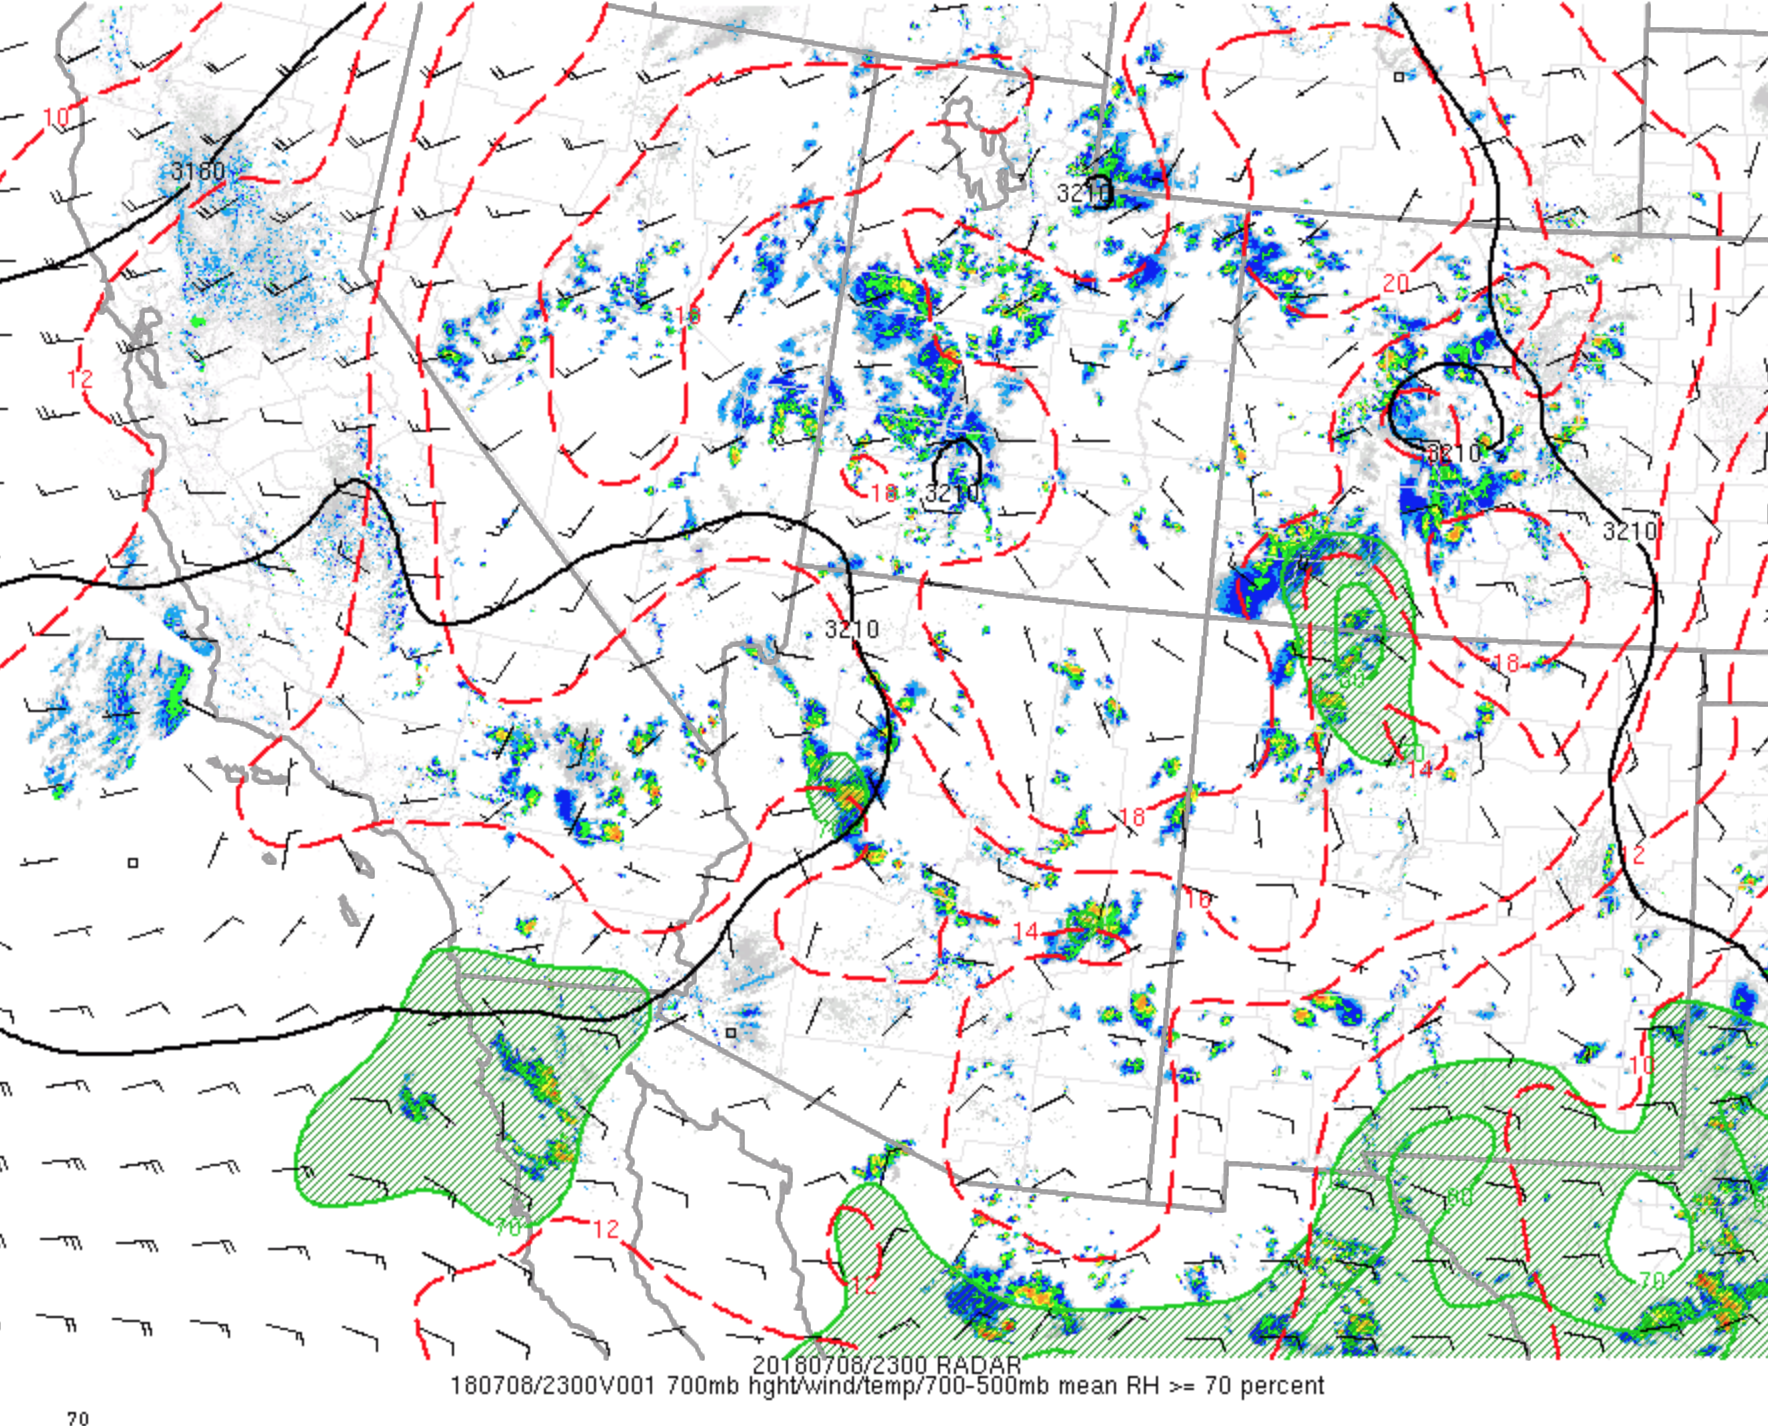
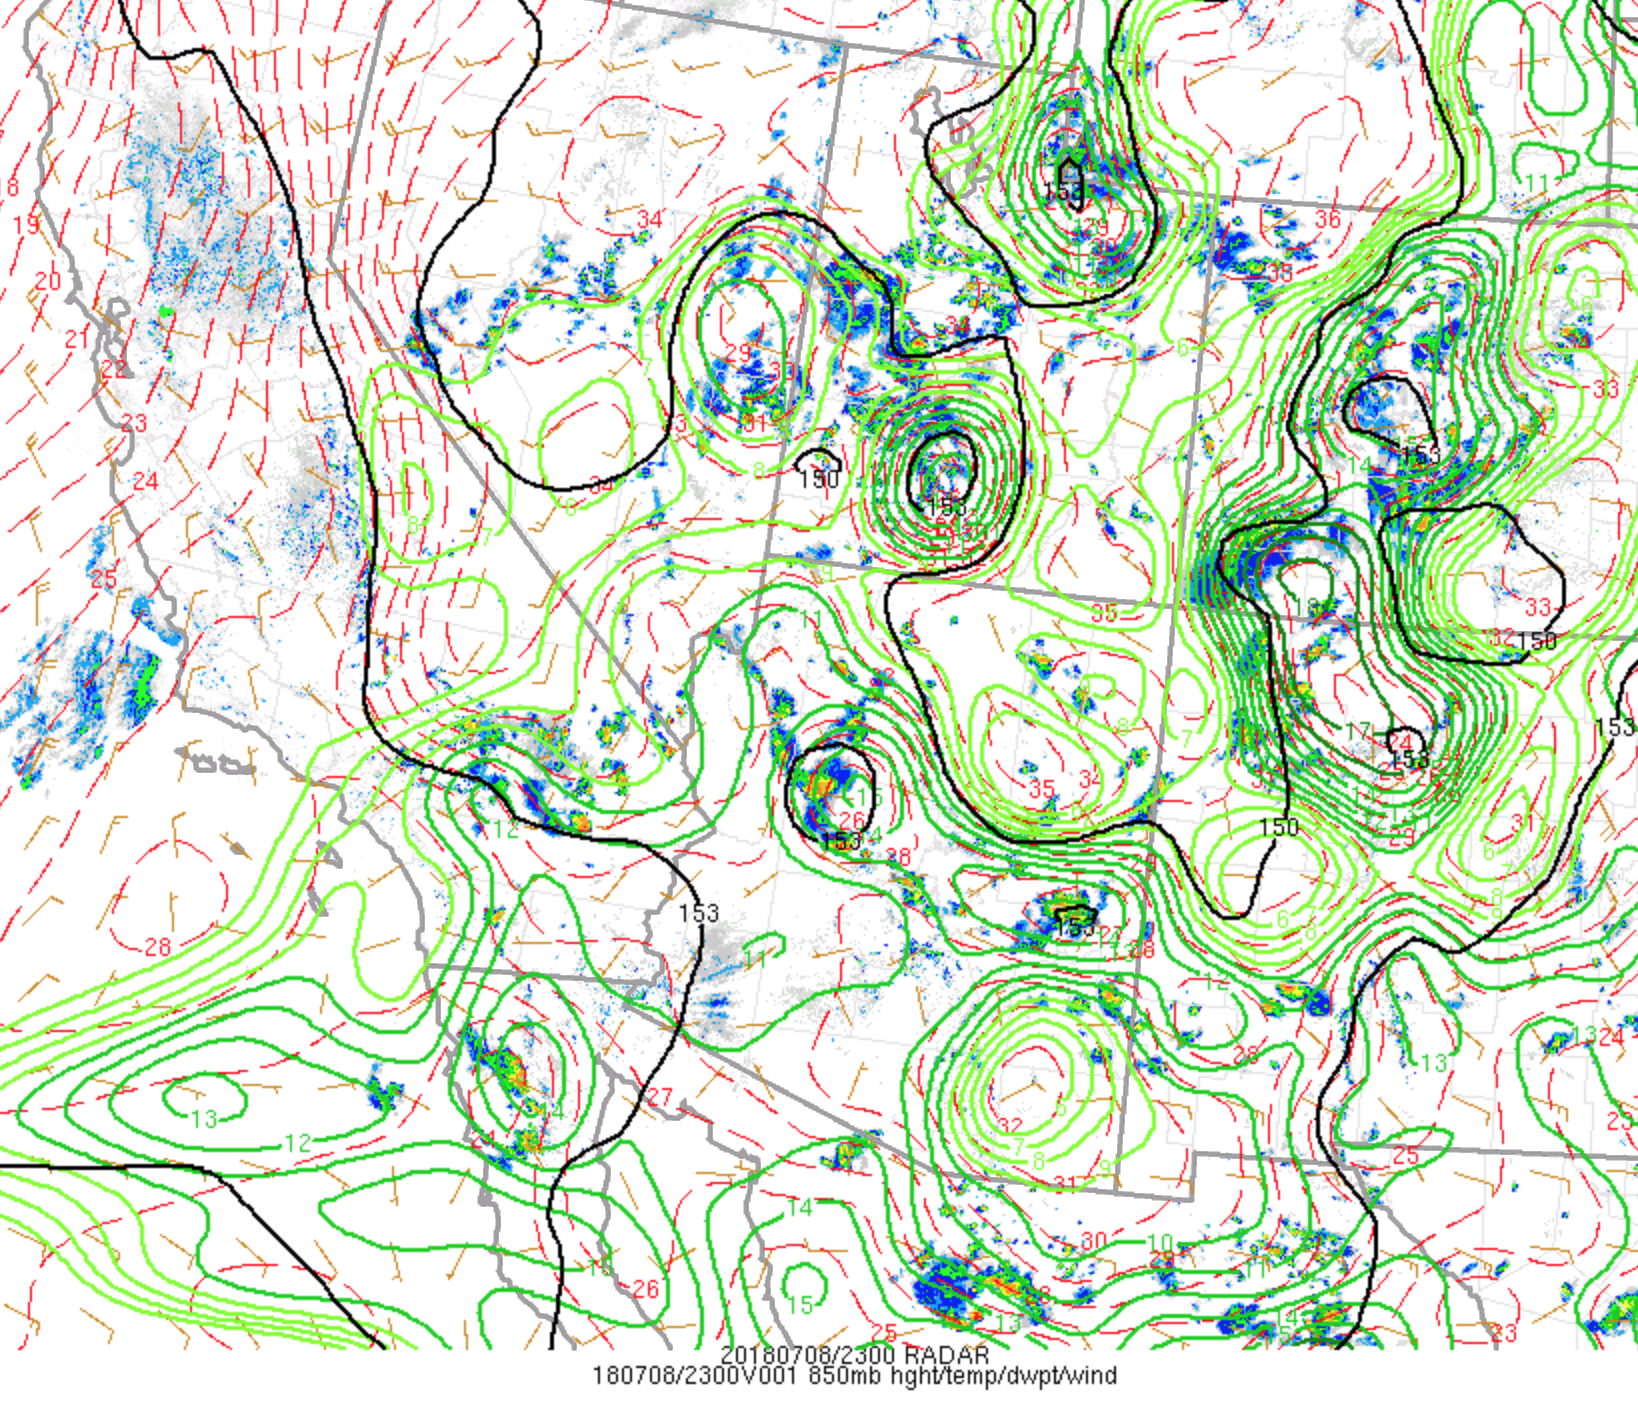
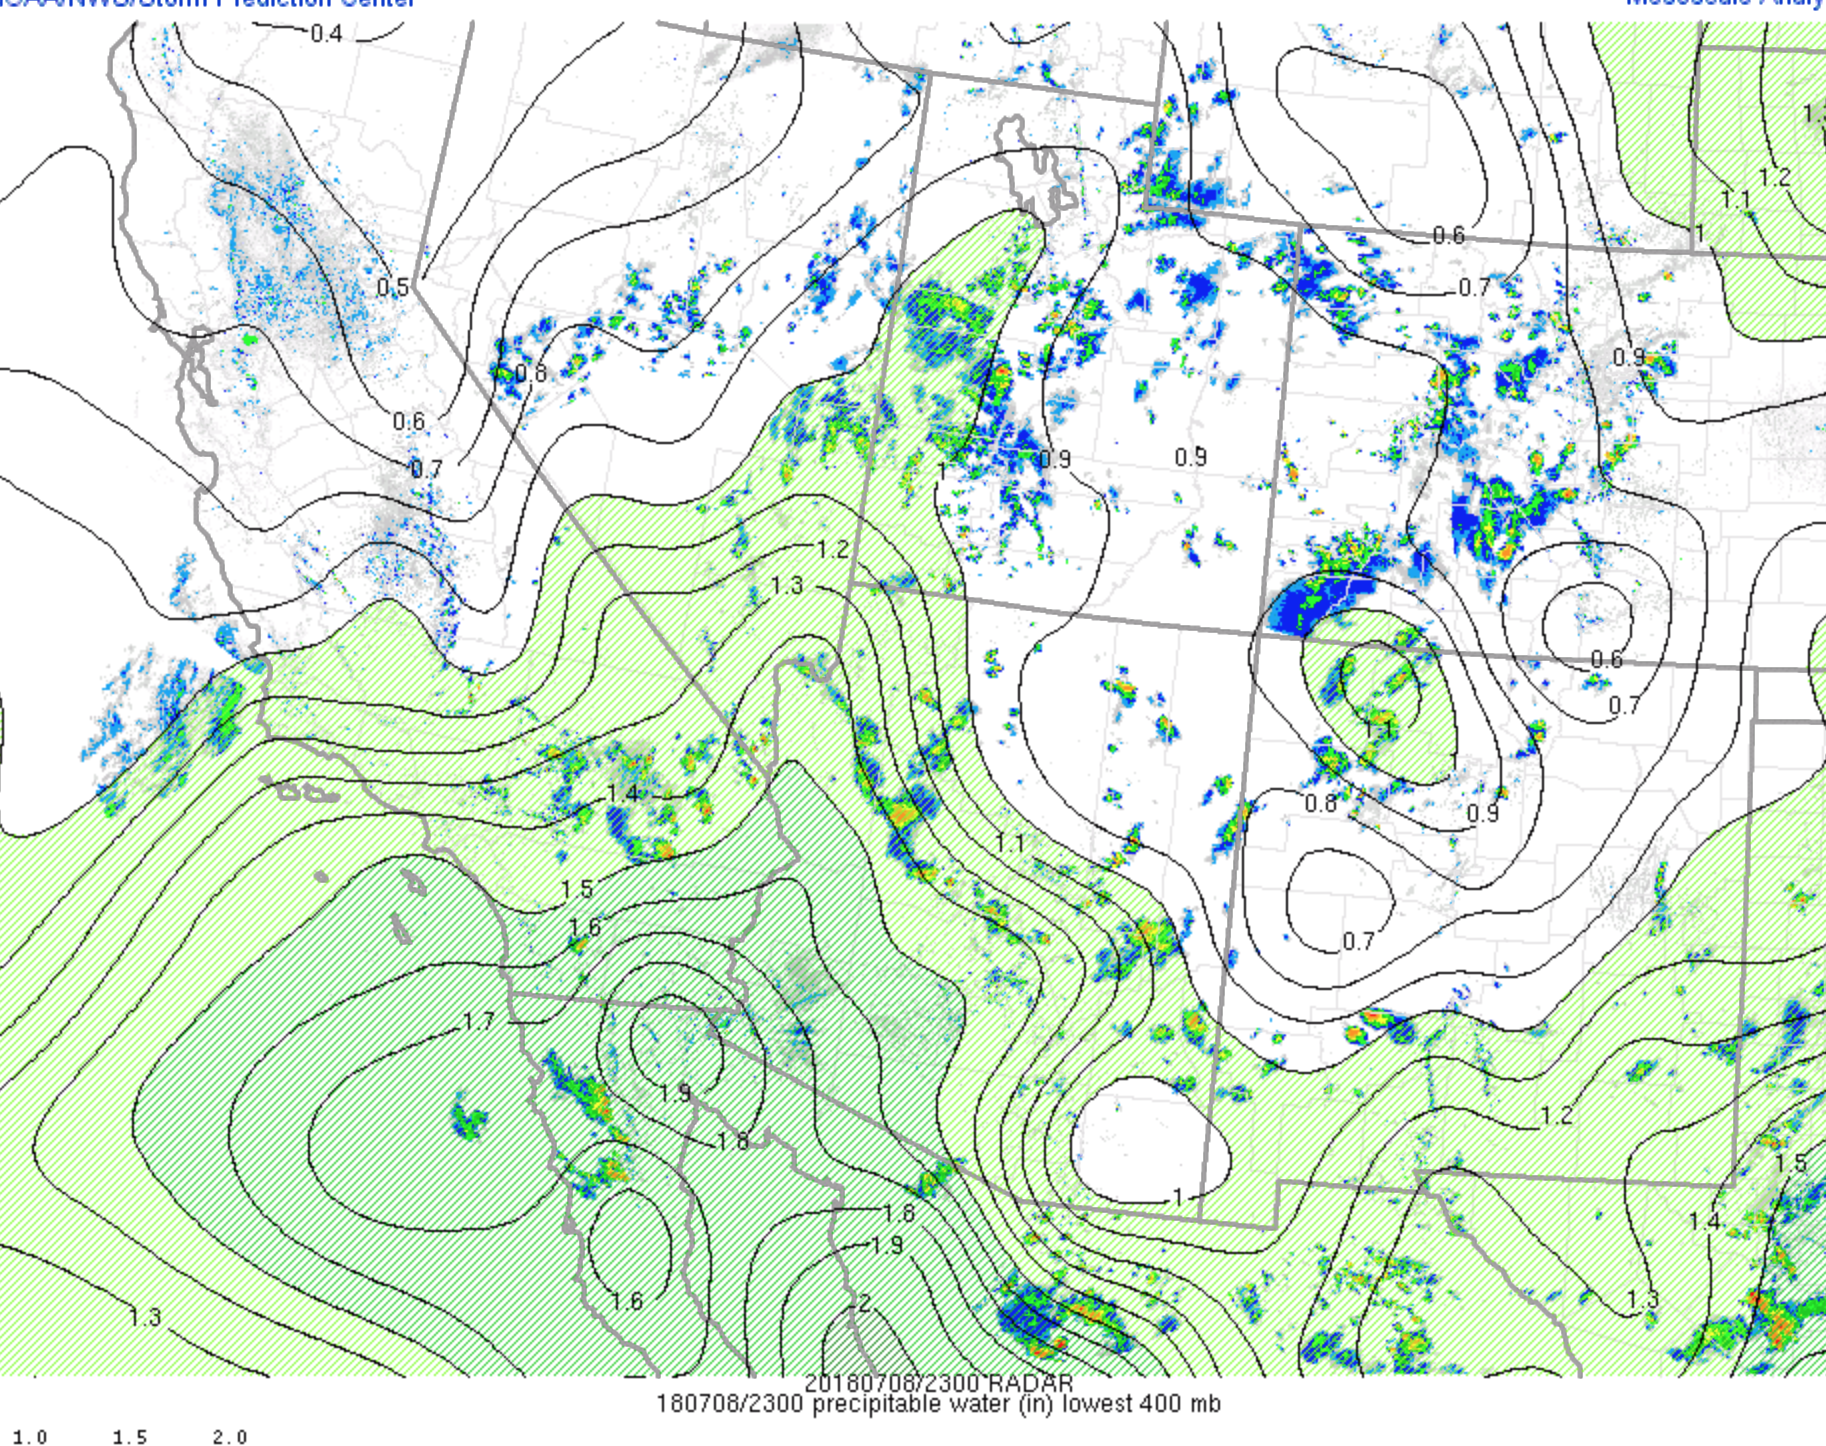
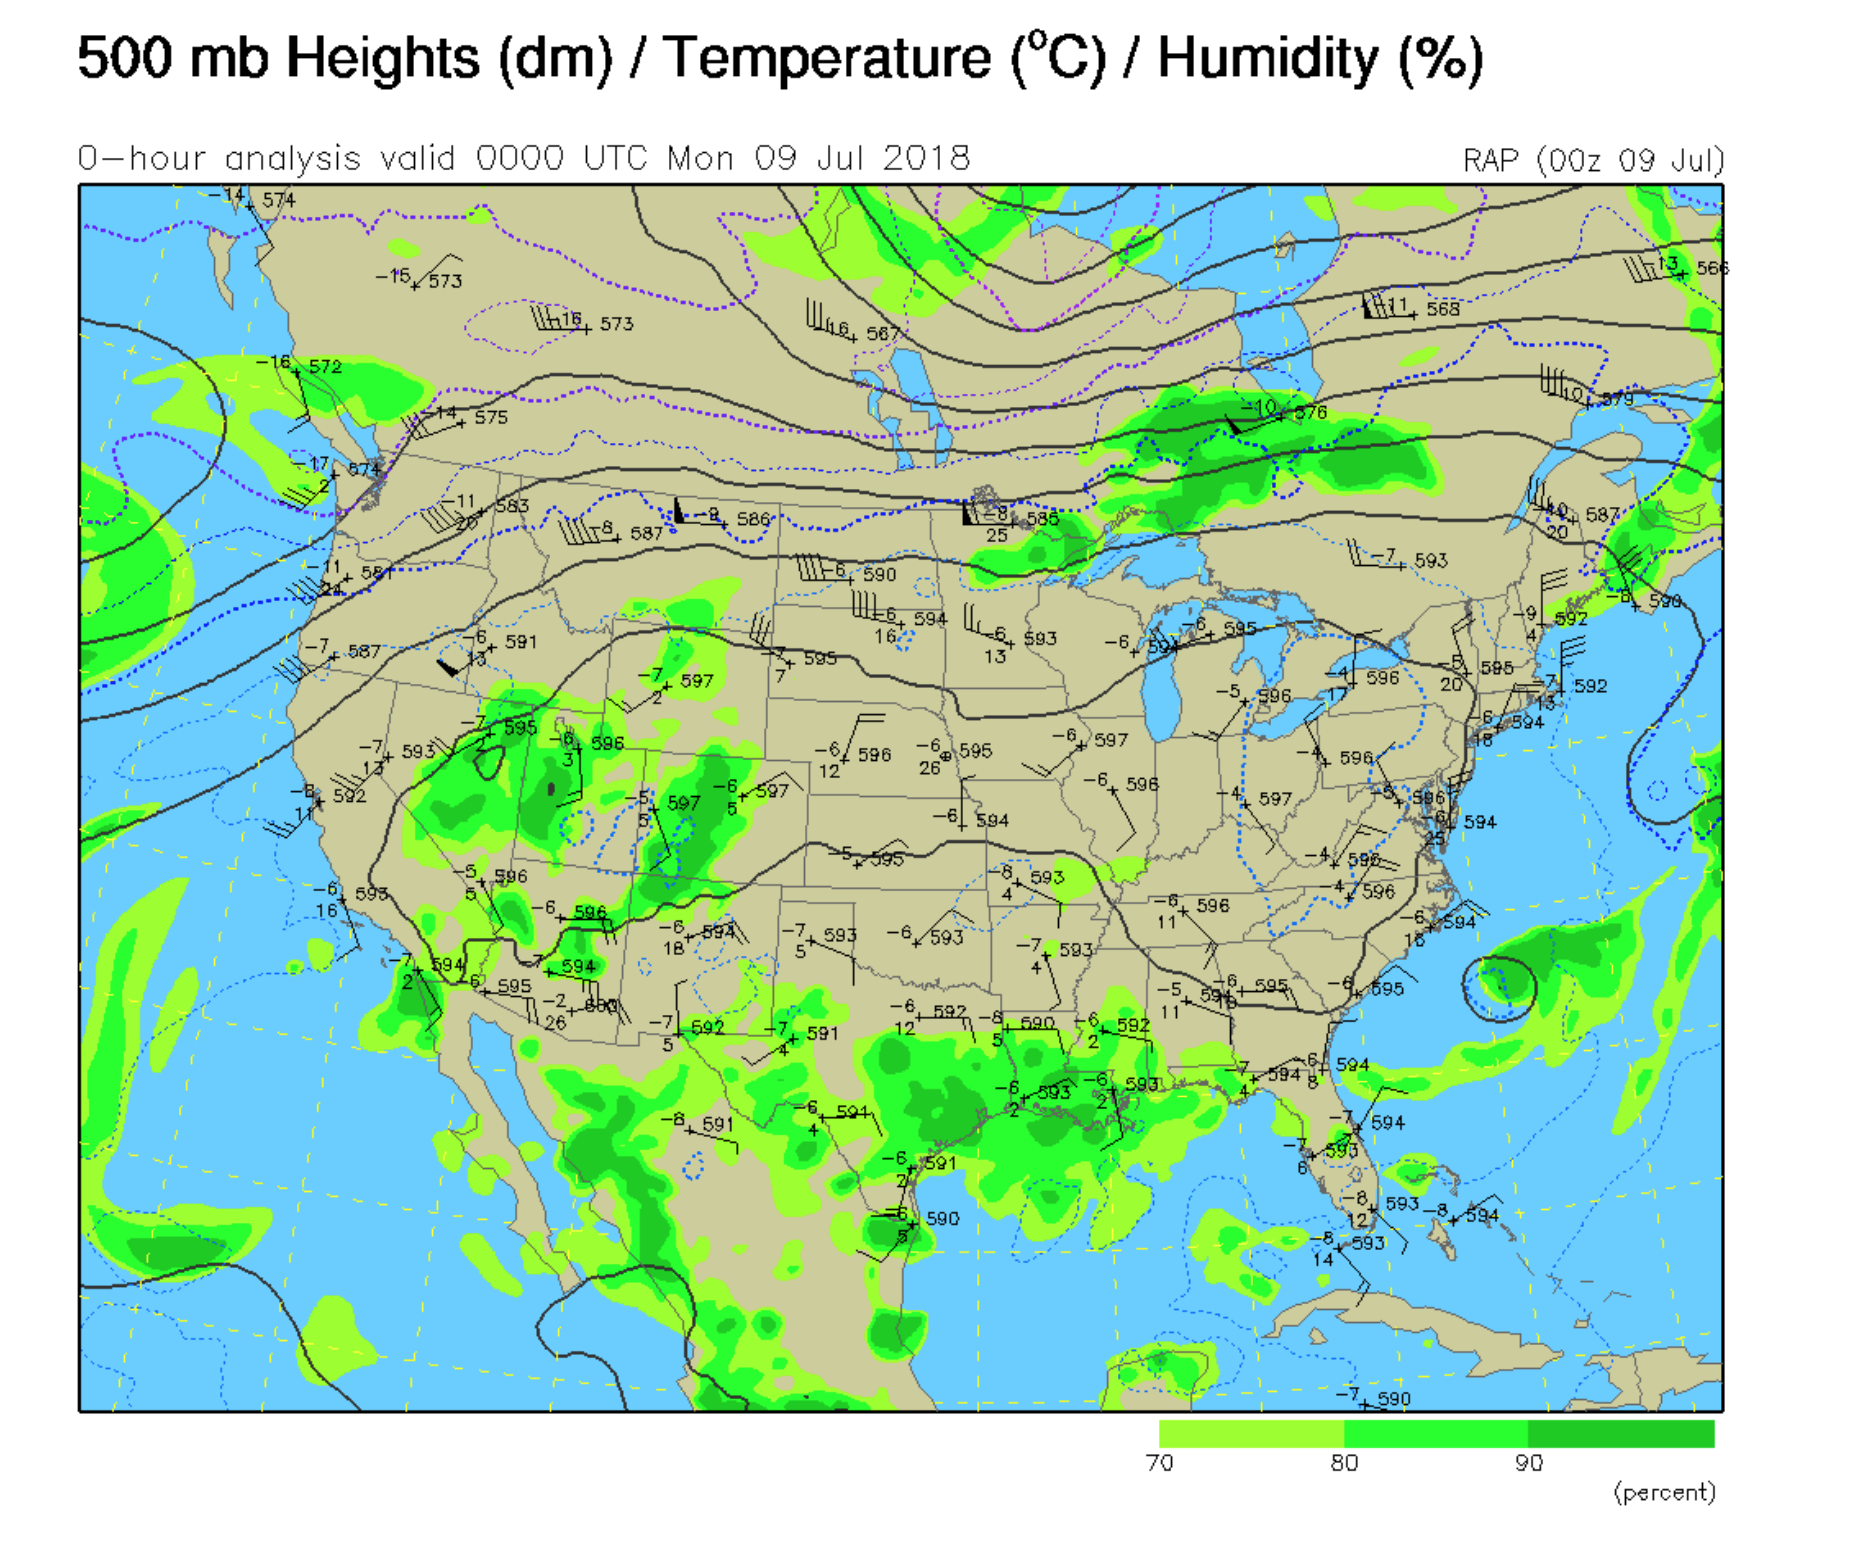
July 8
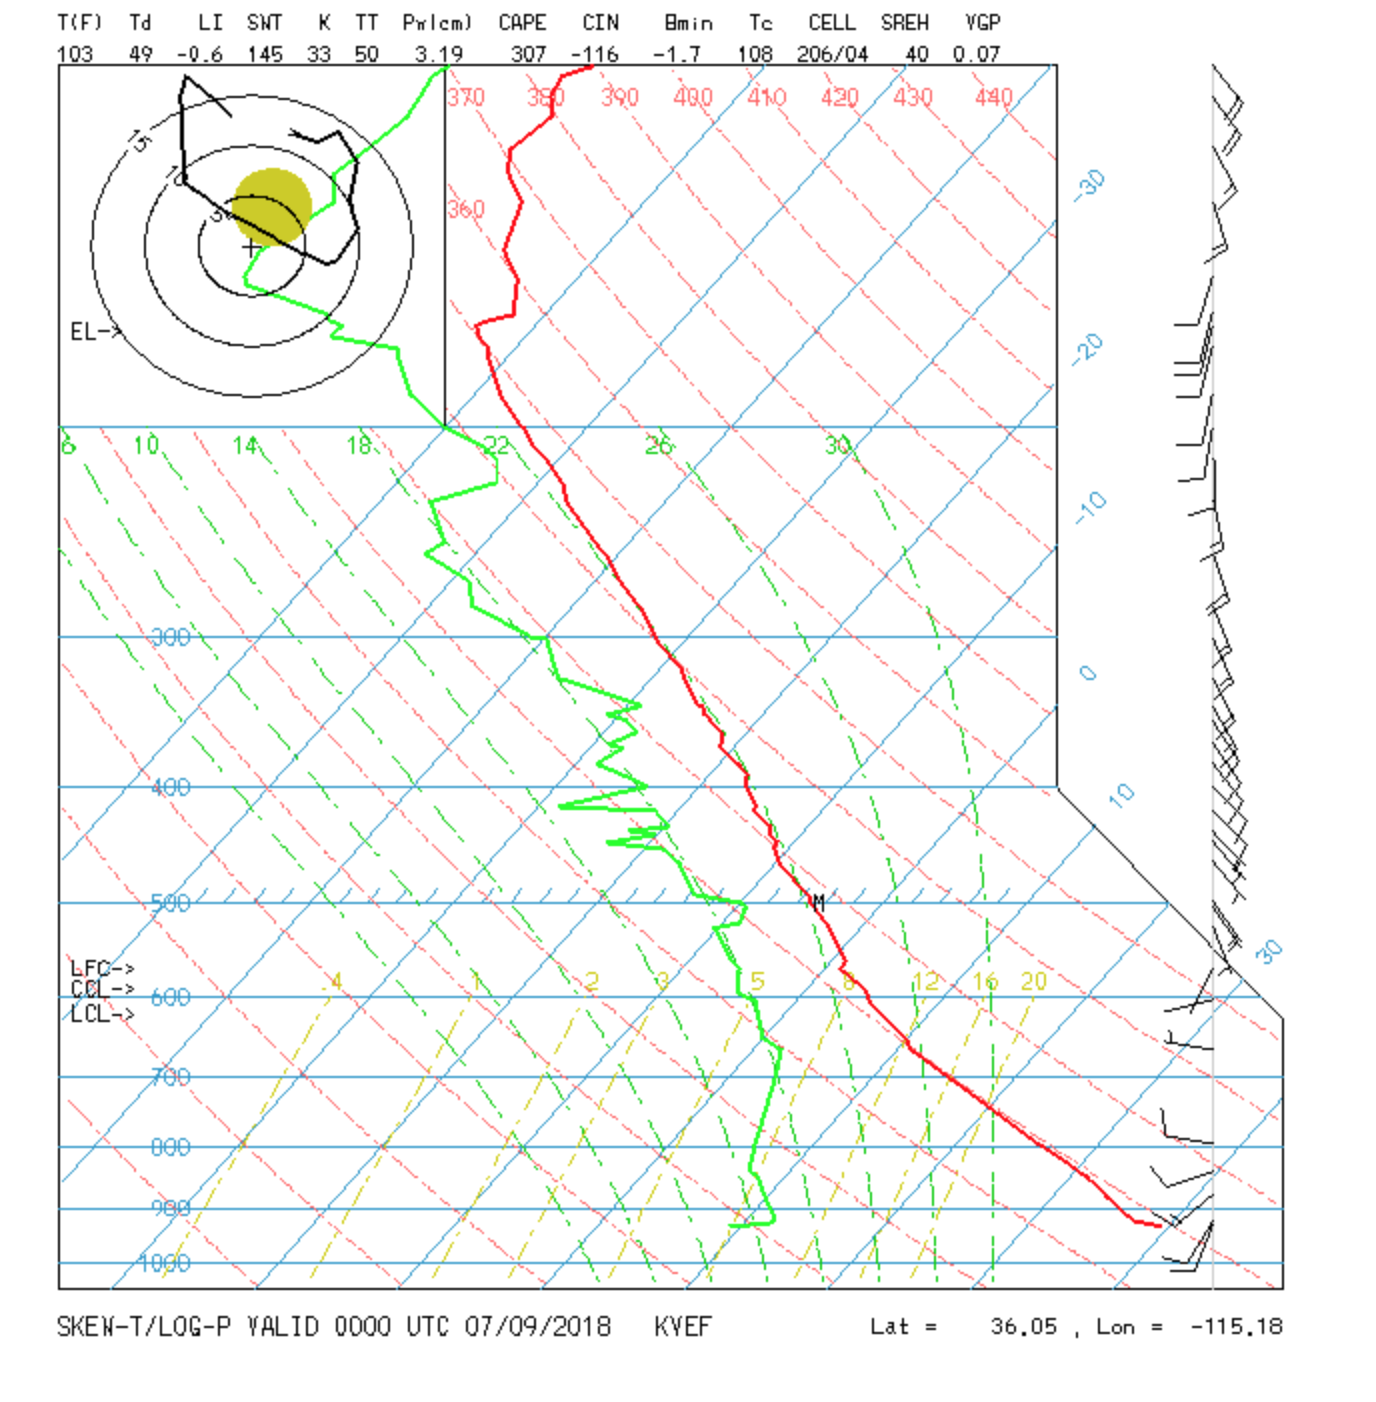
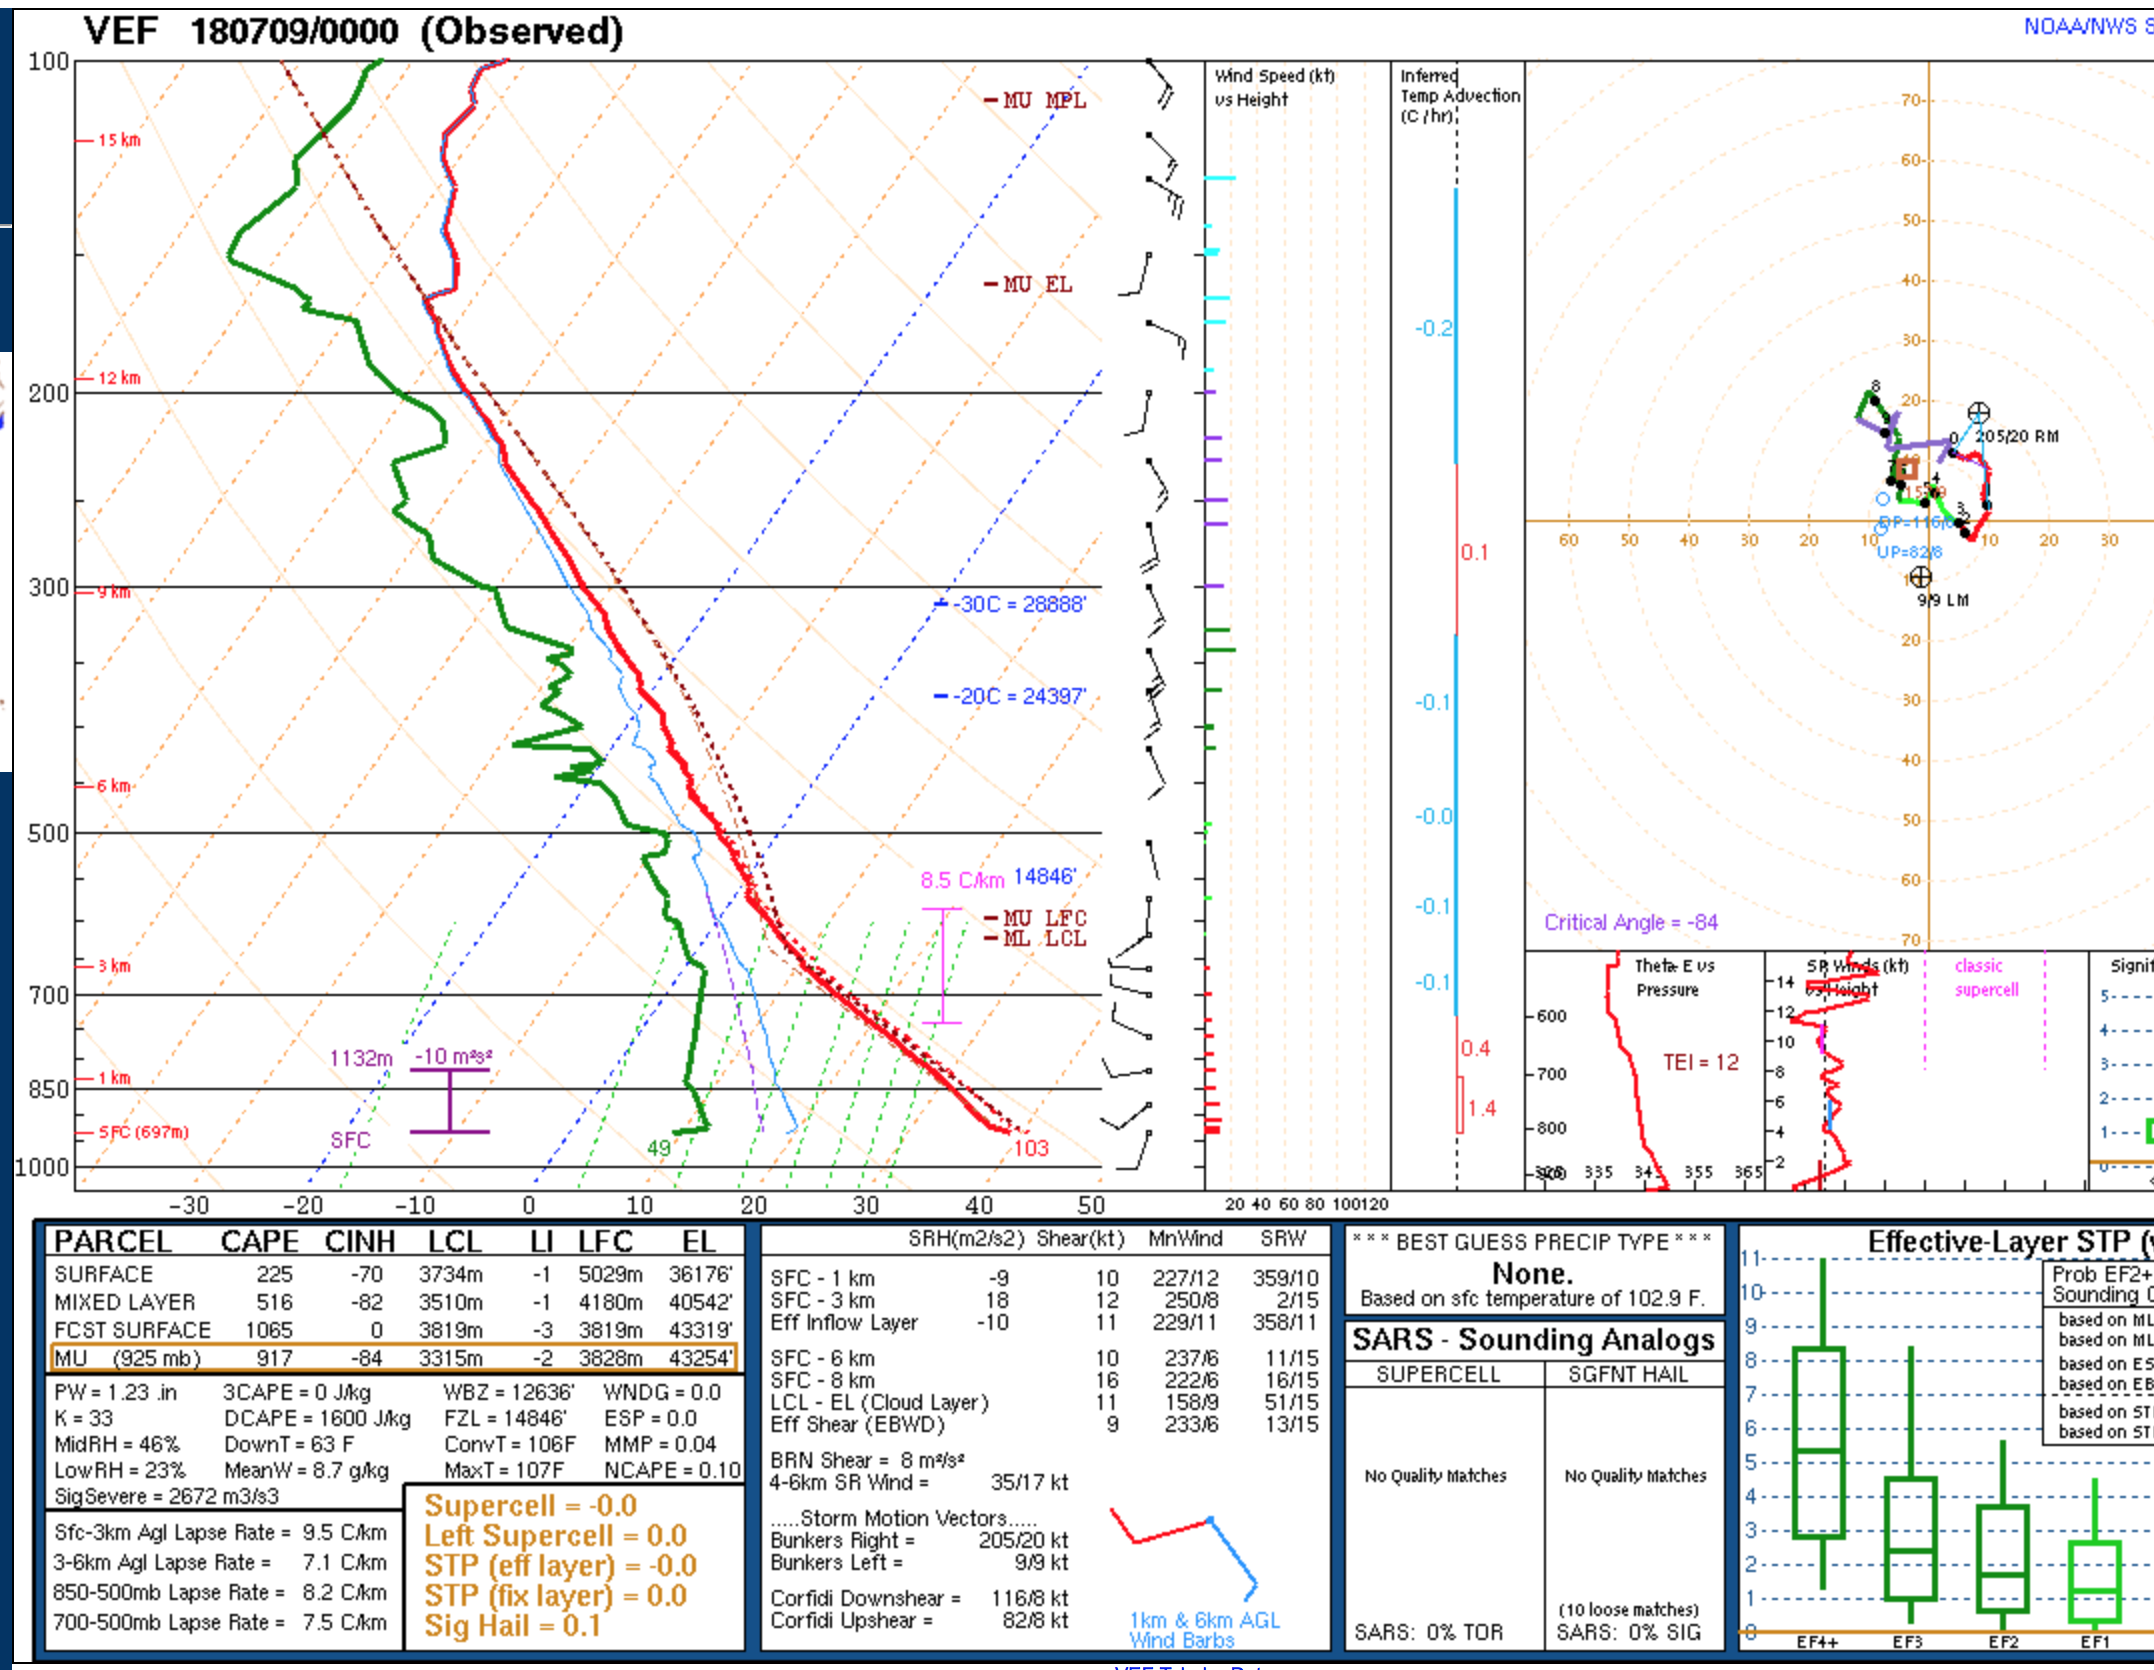
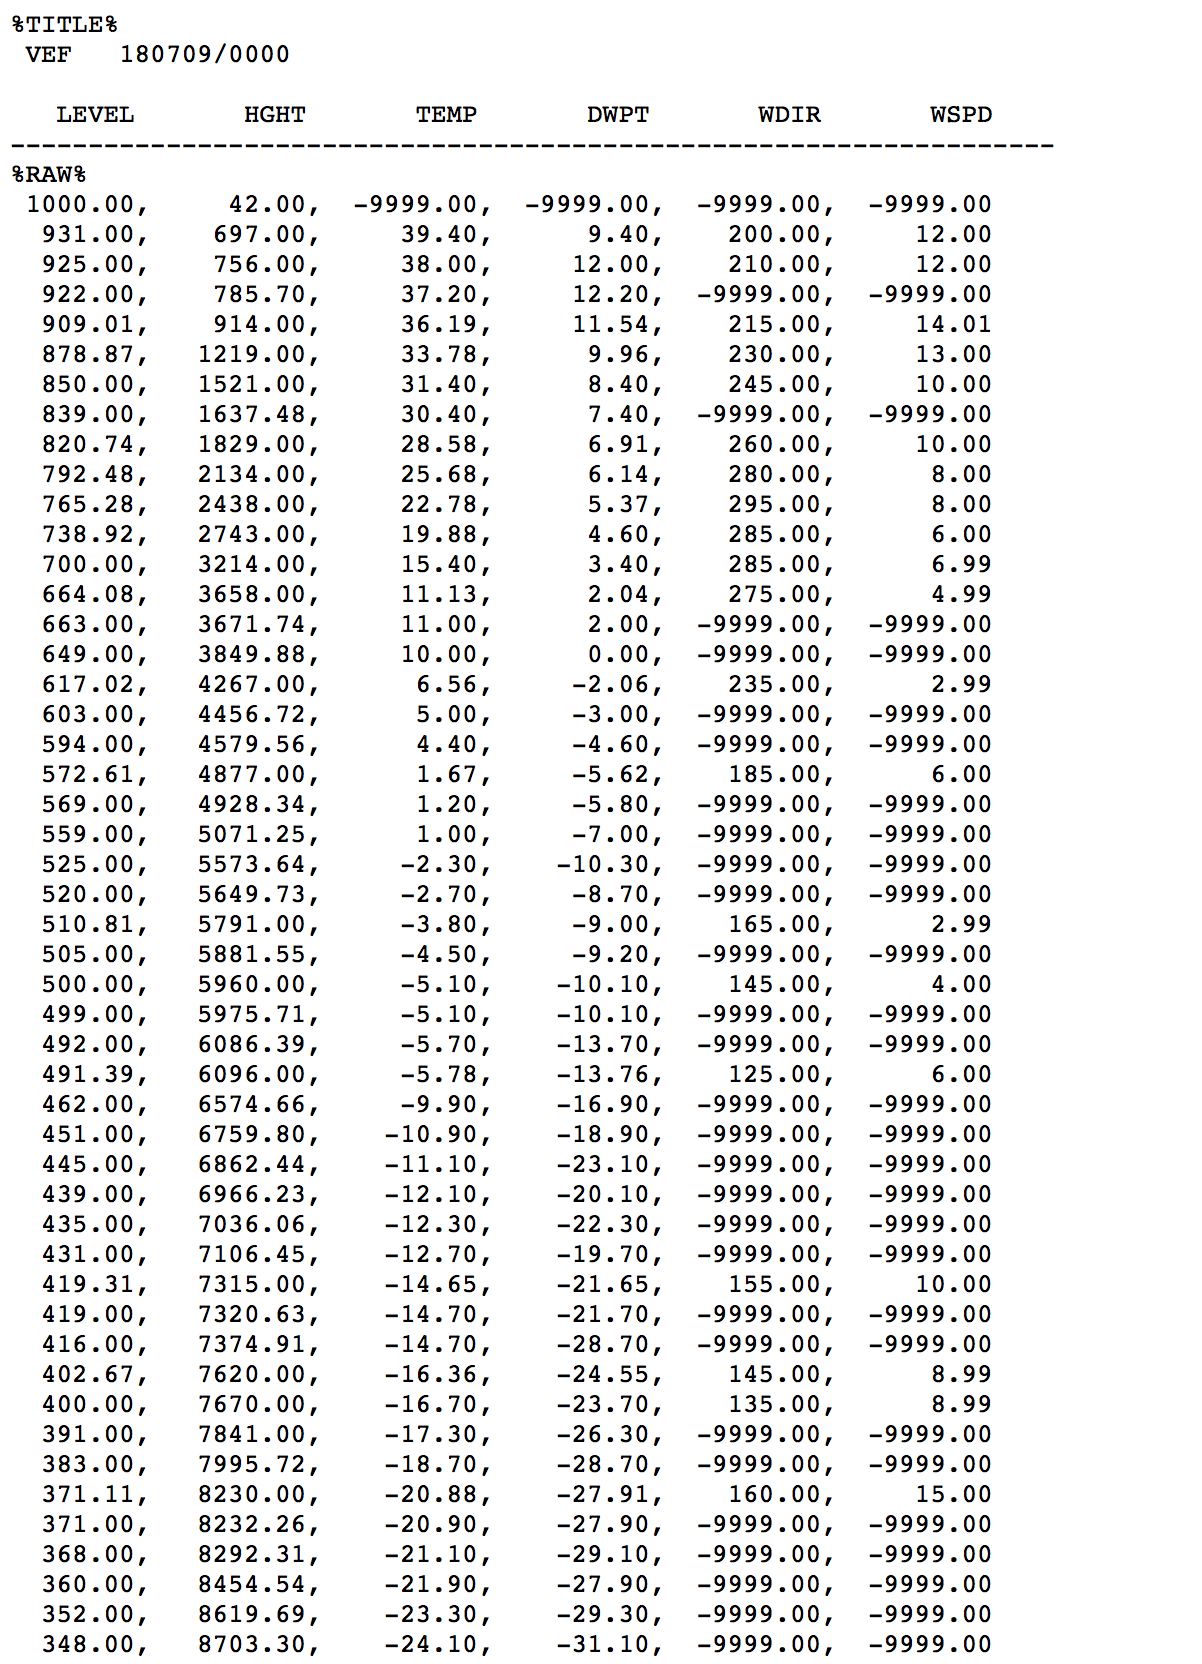
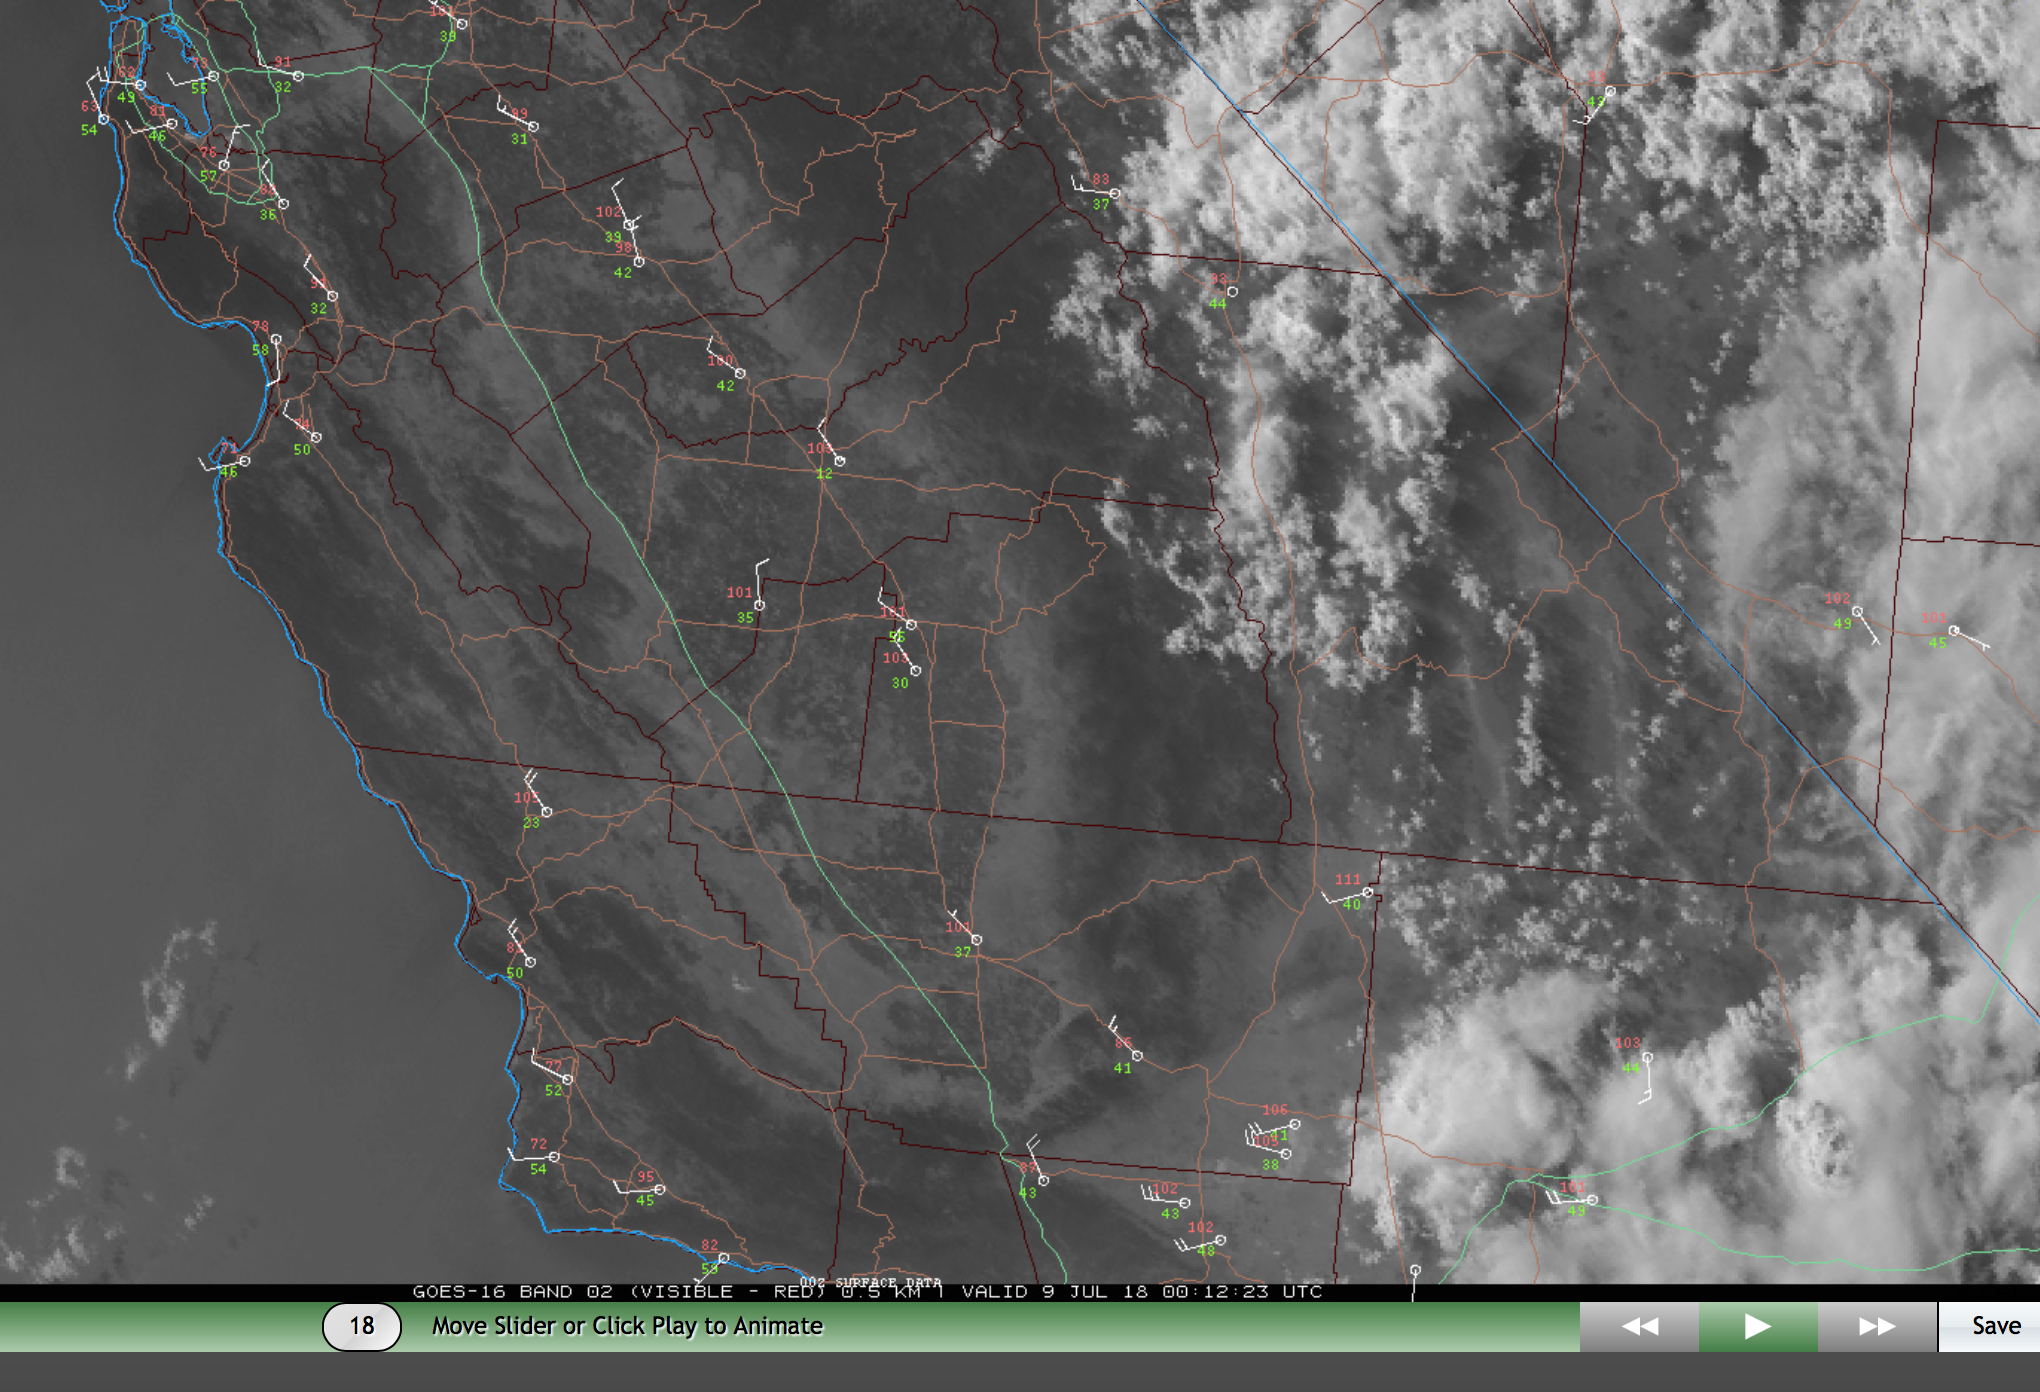
July 9
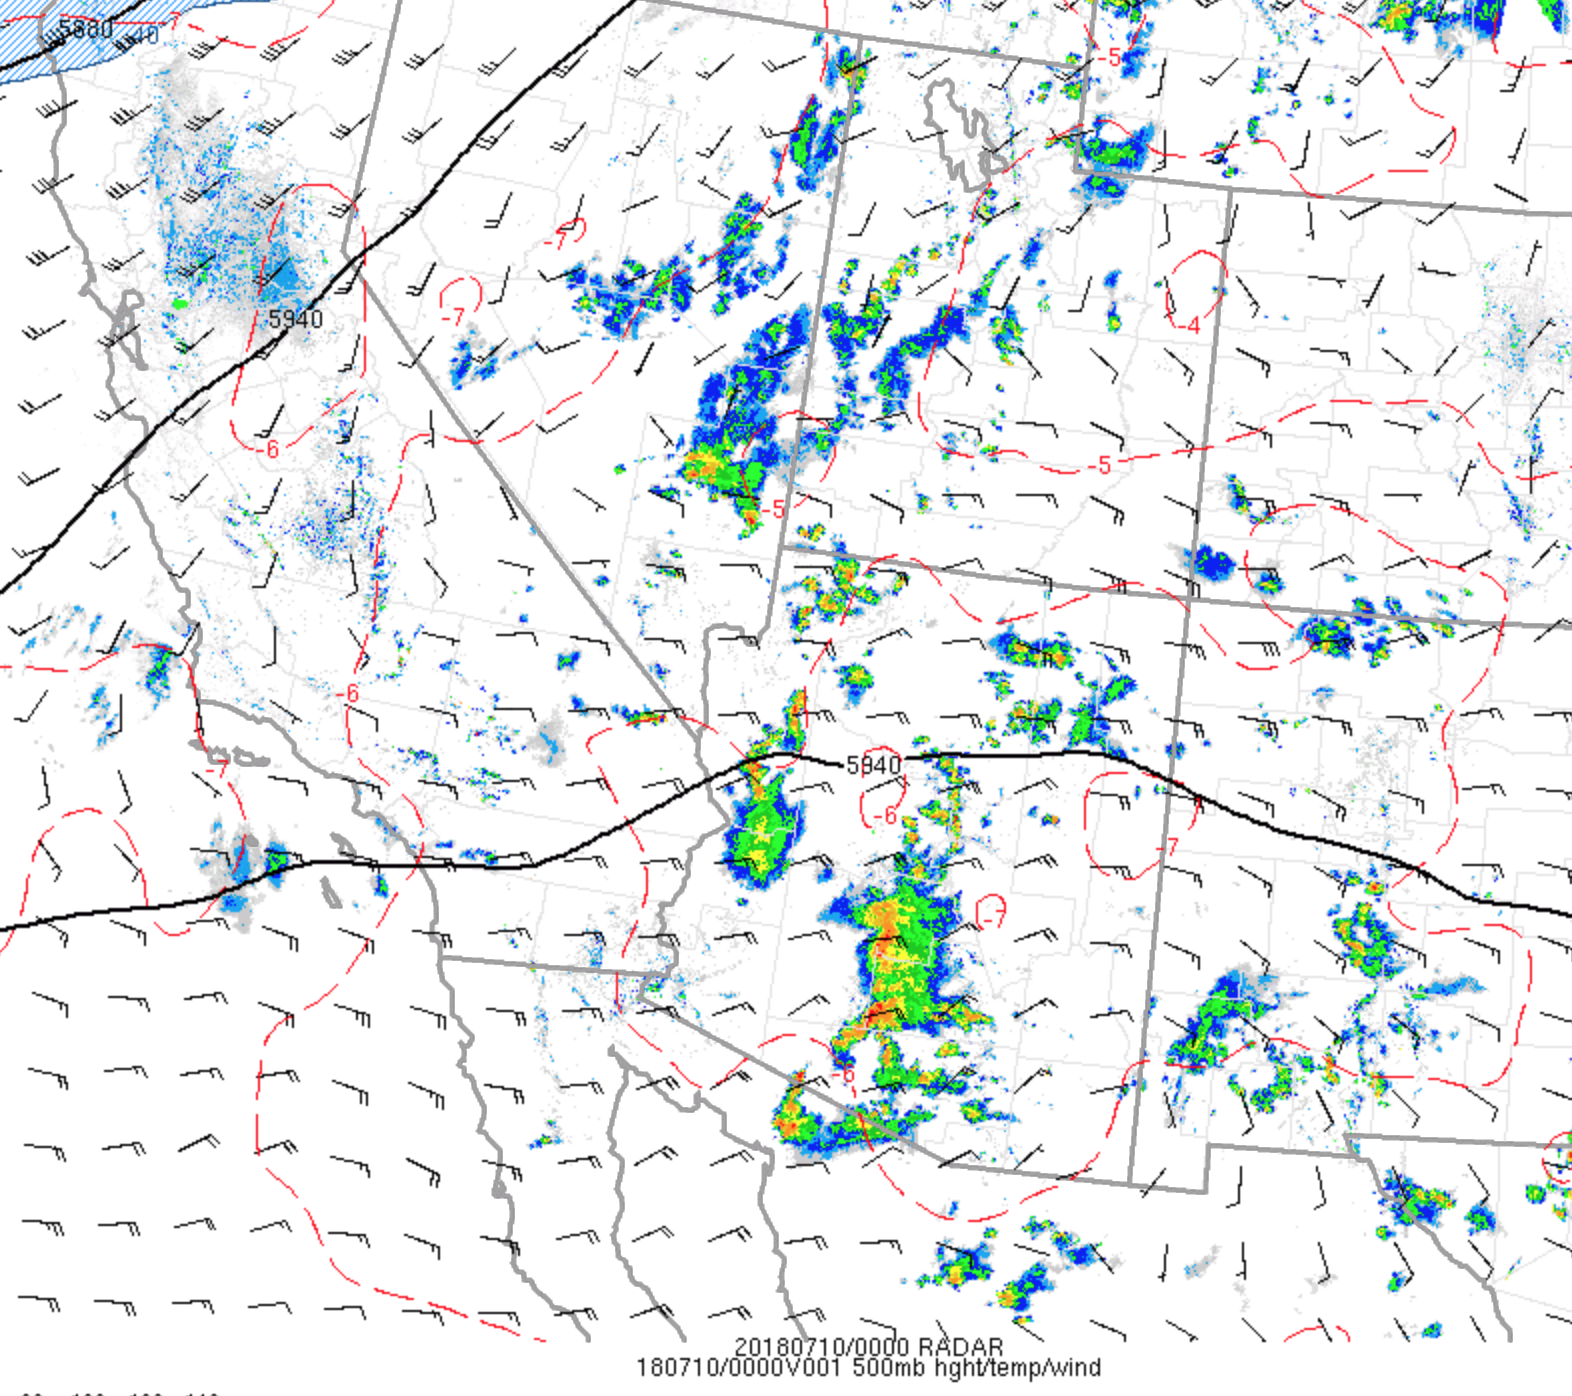
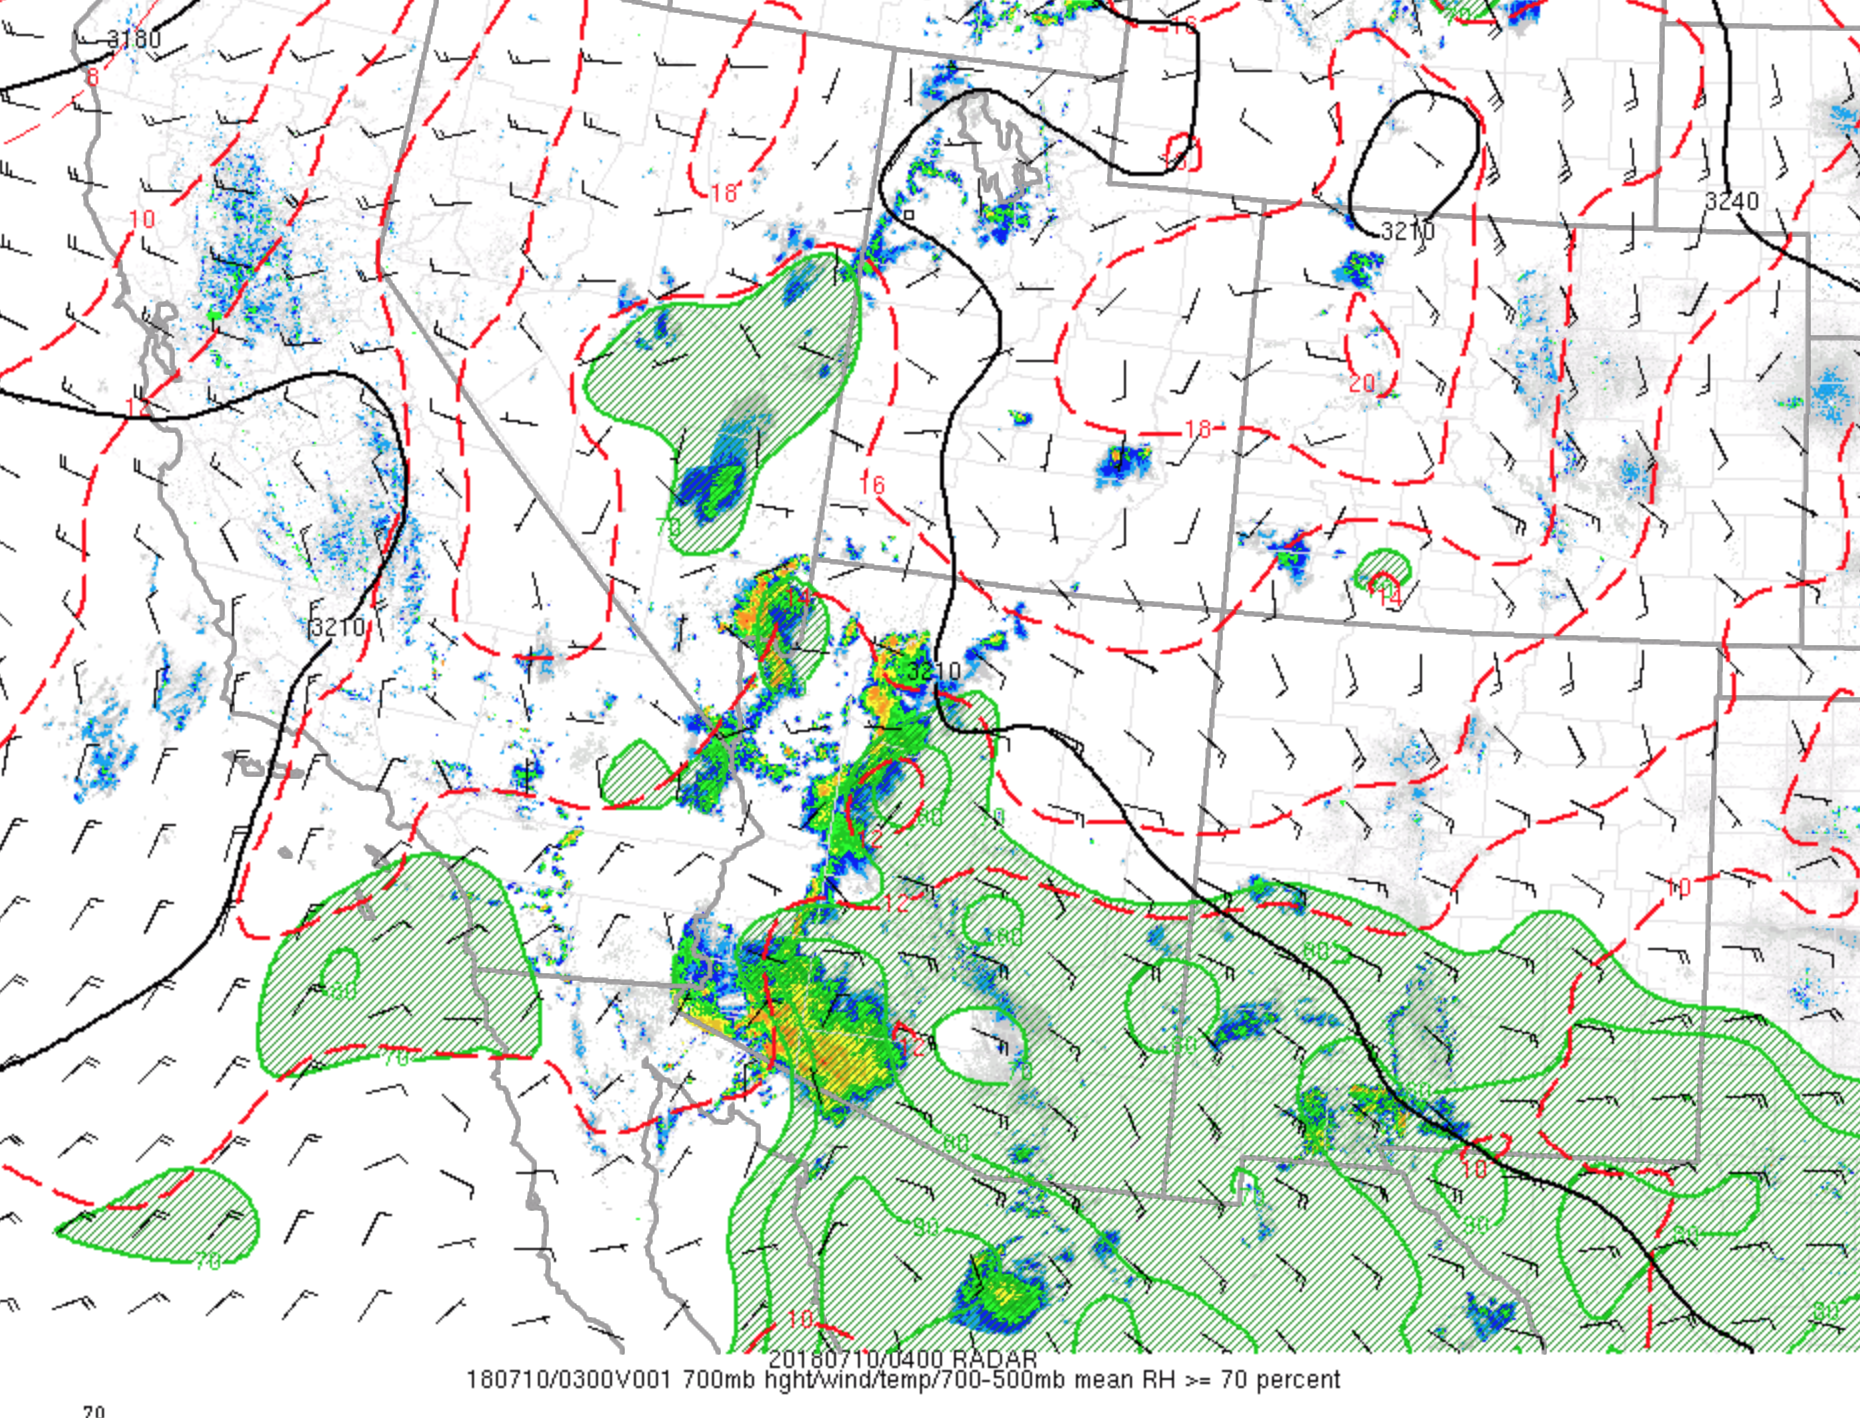
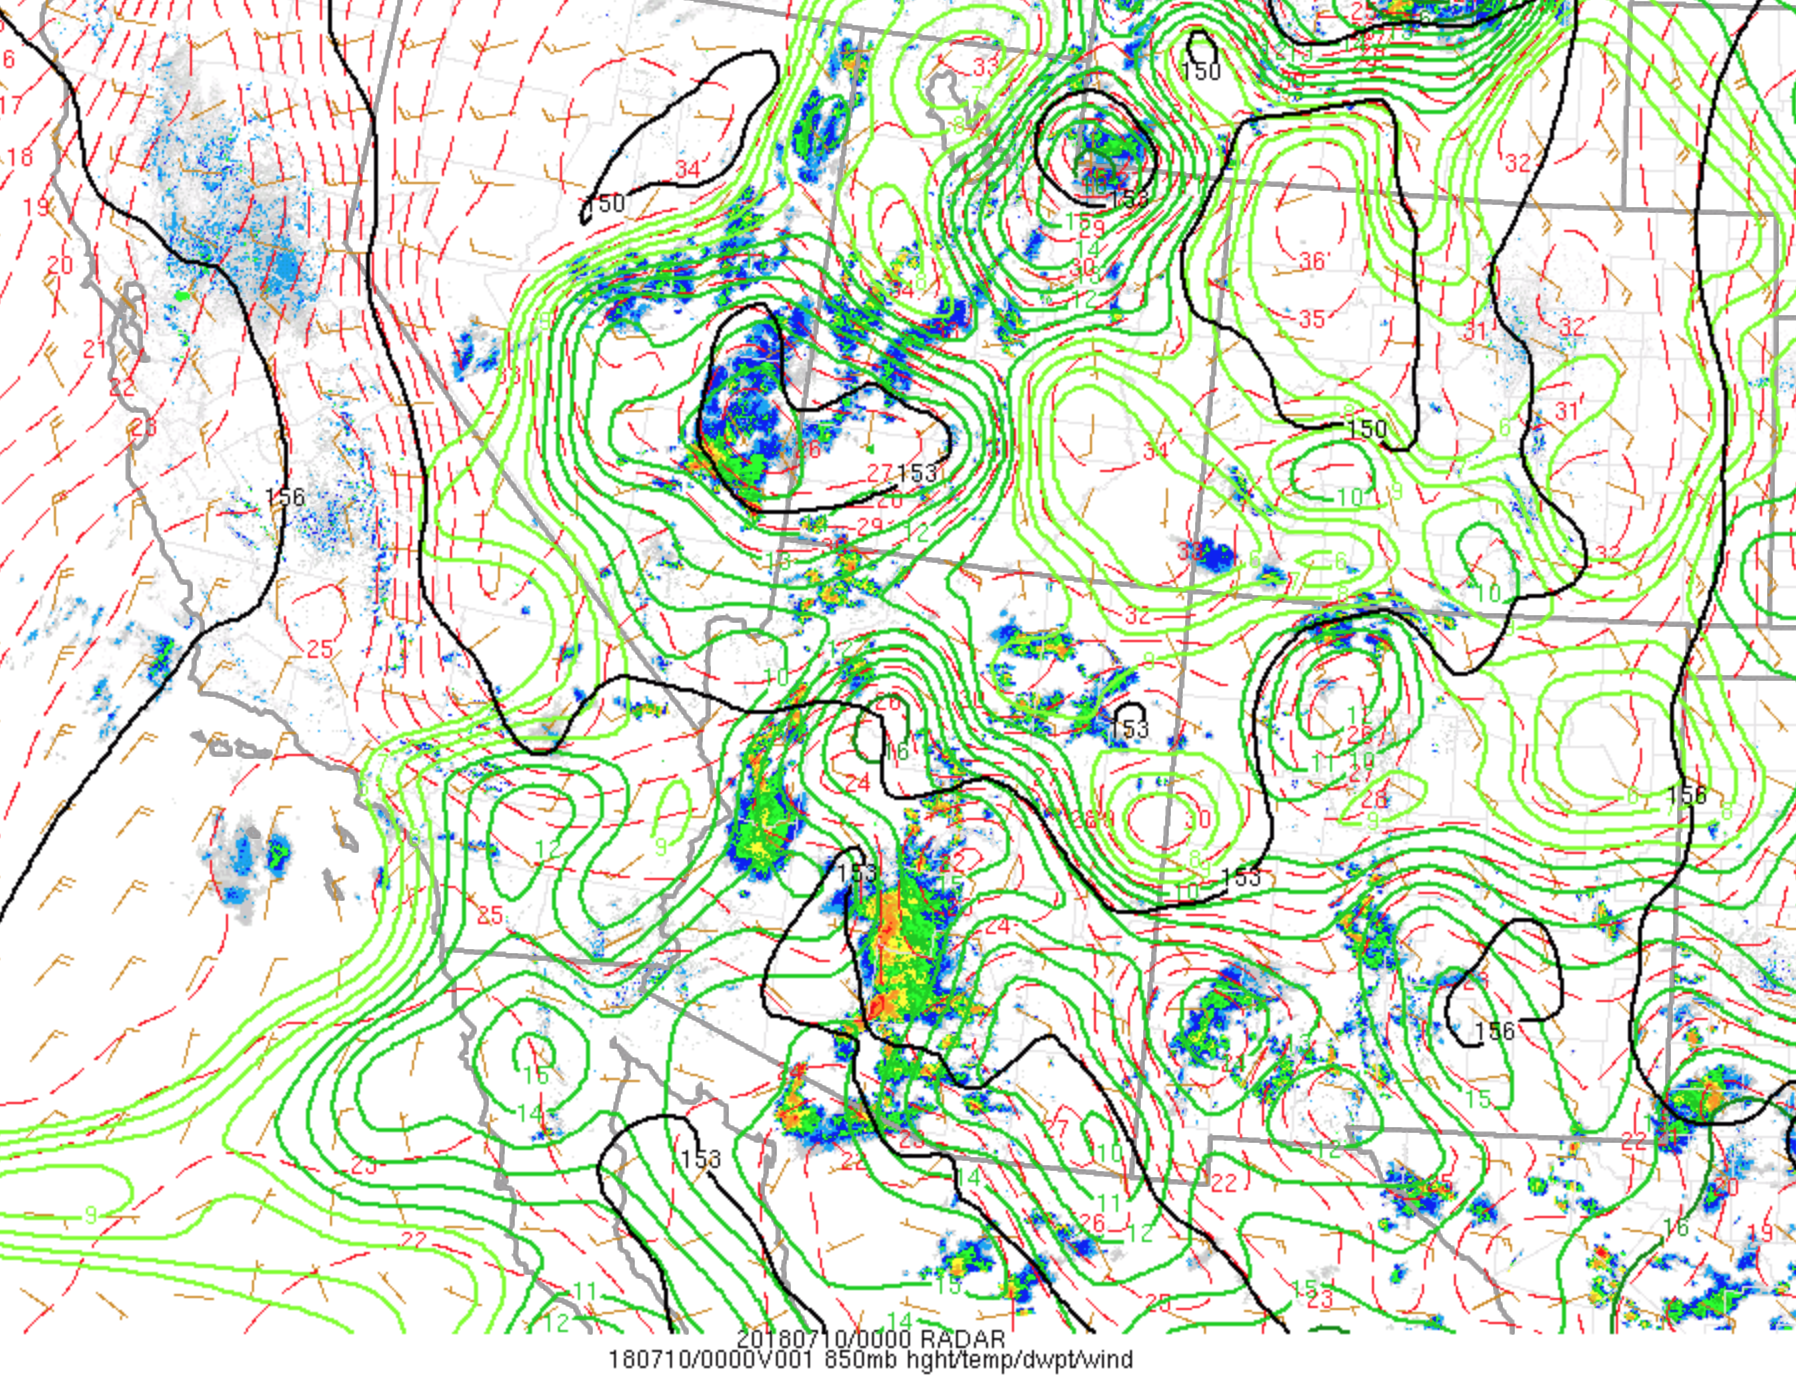
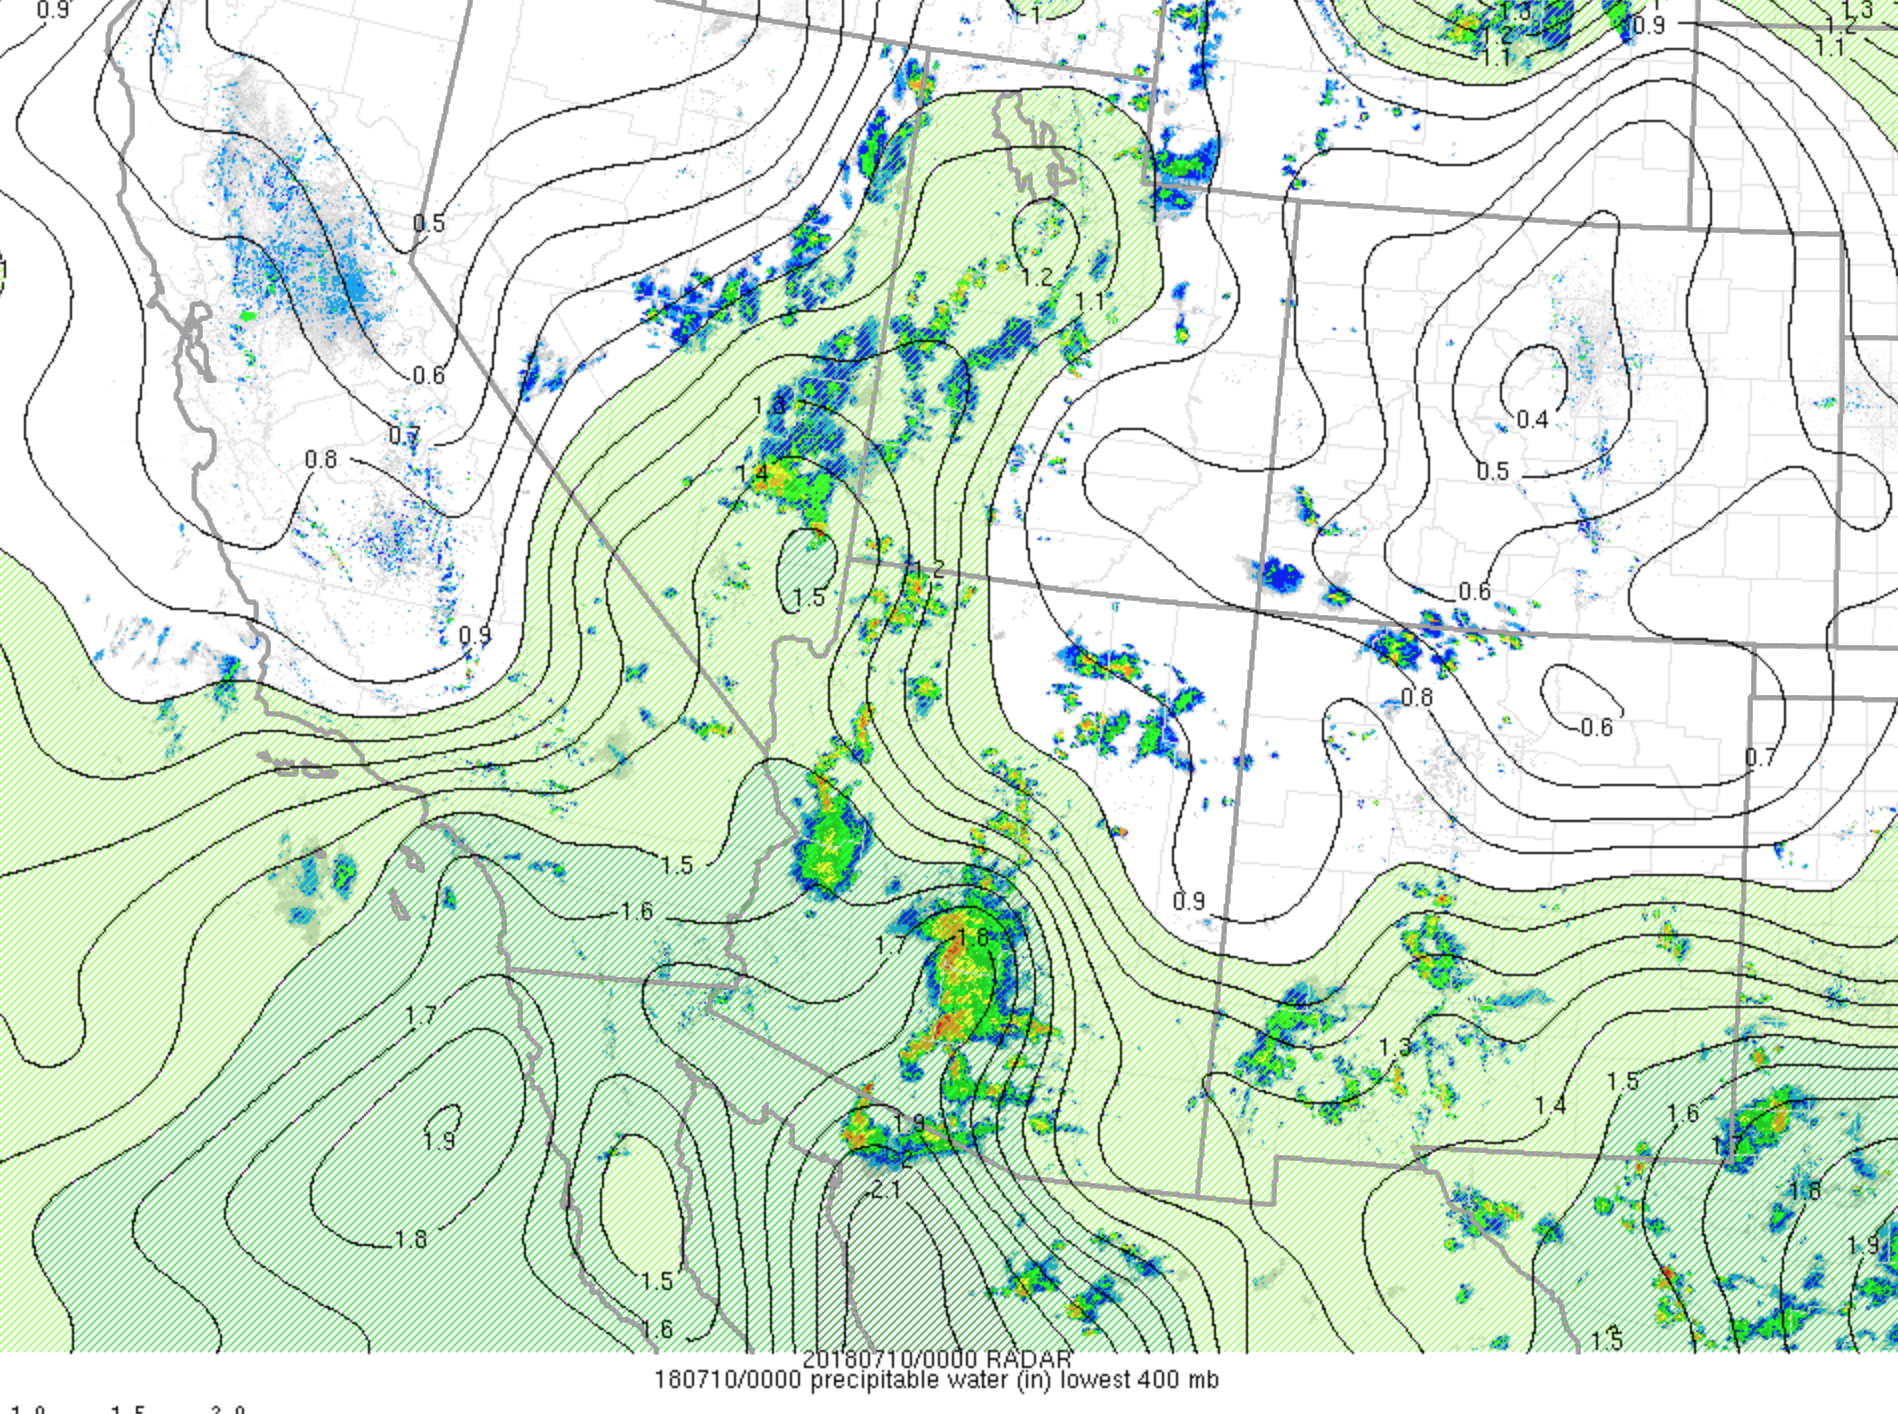
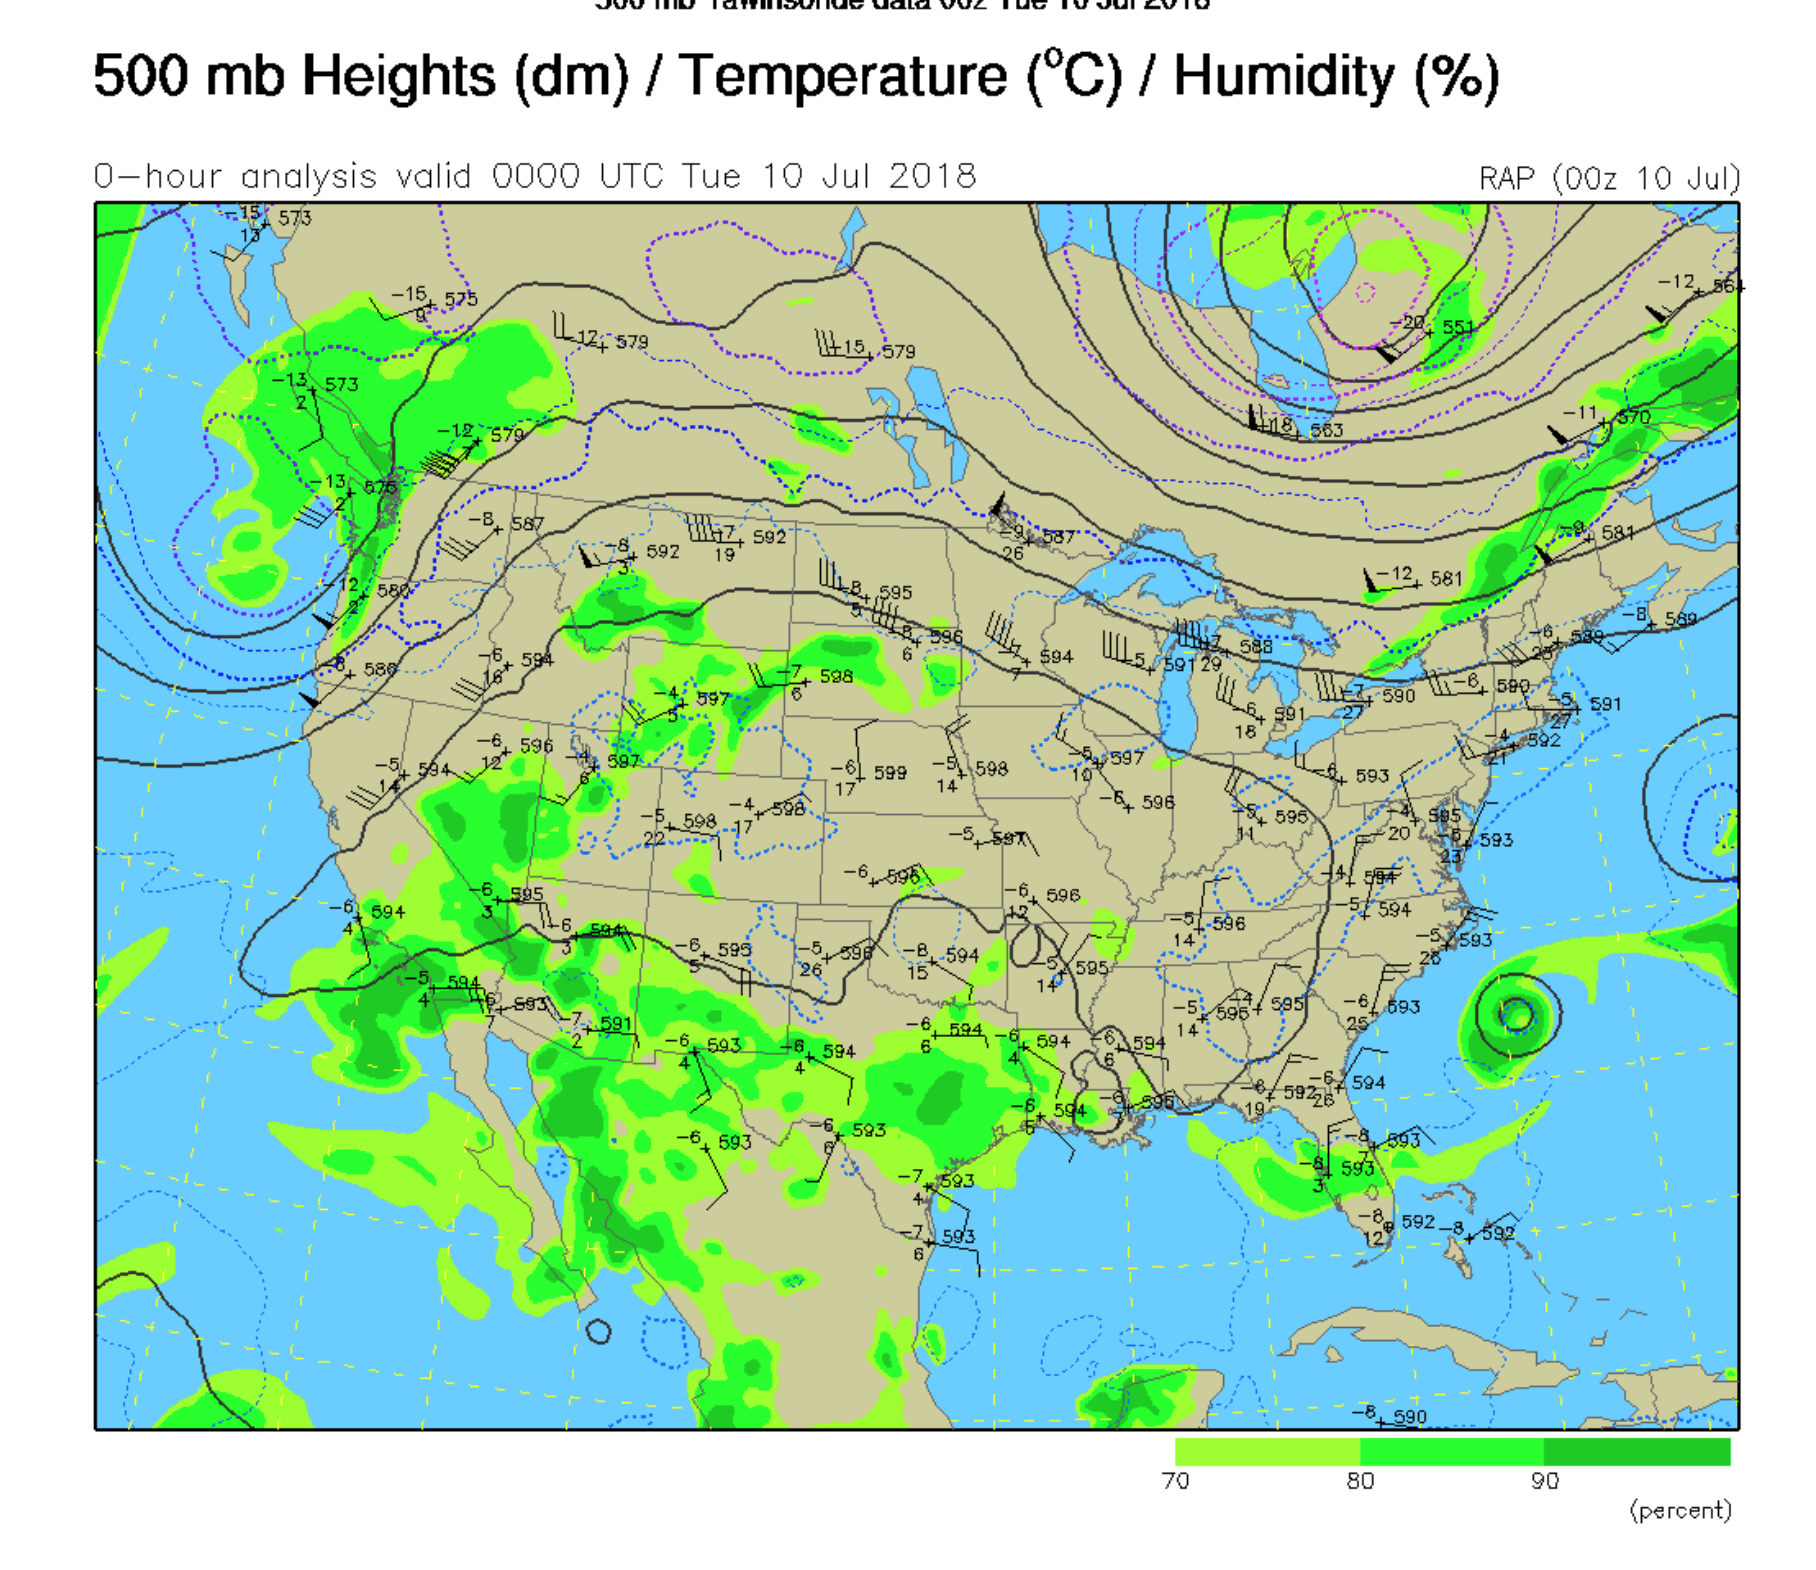
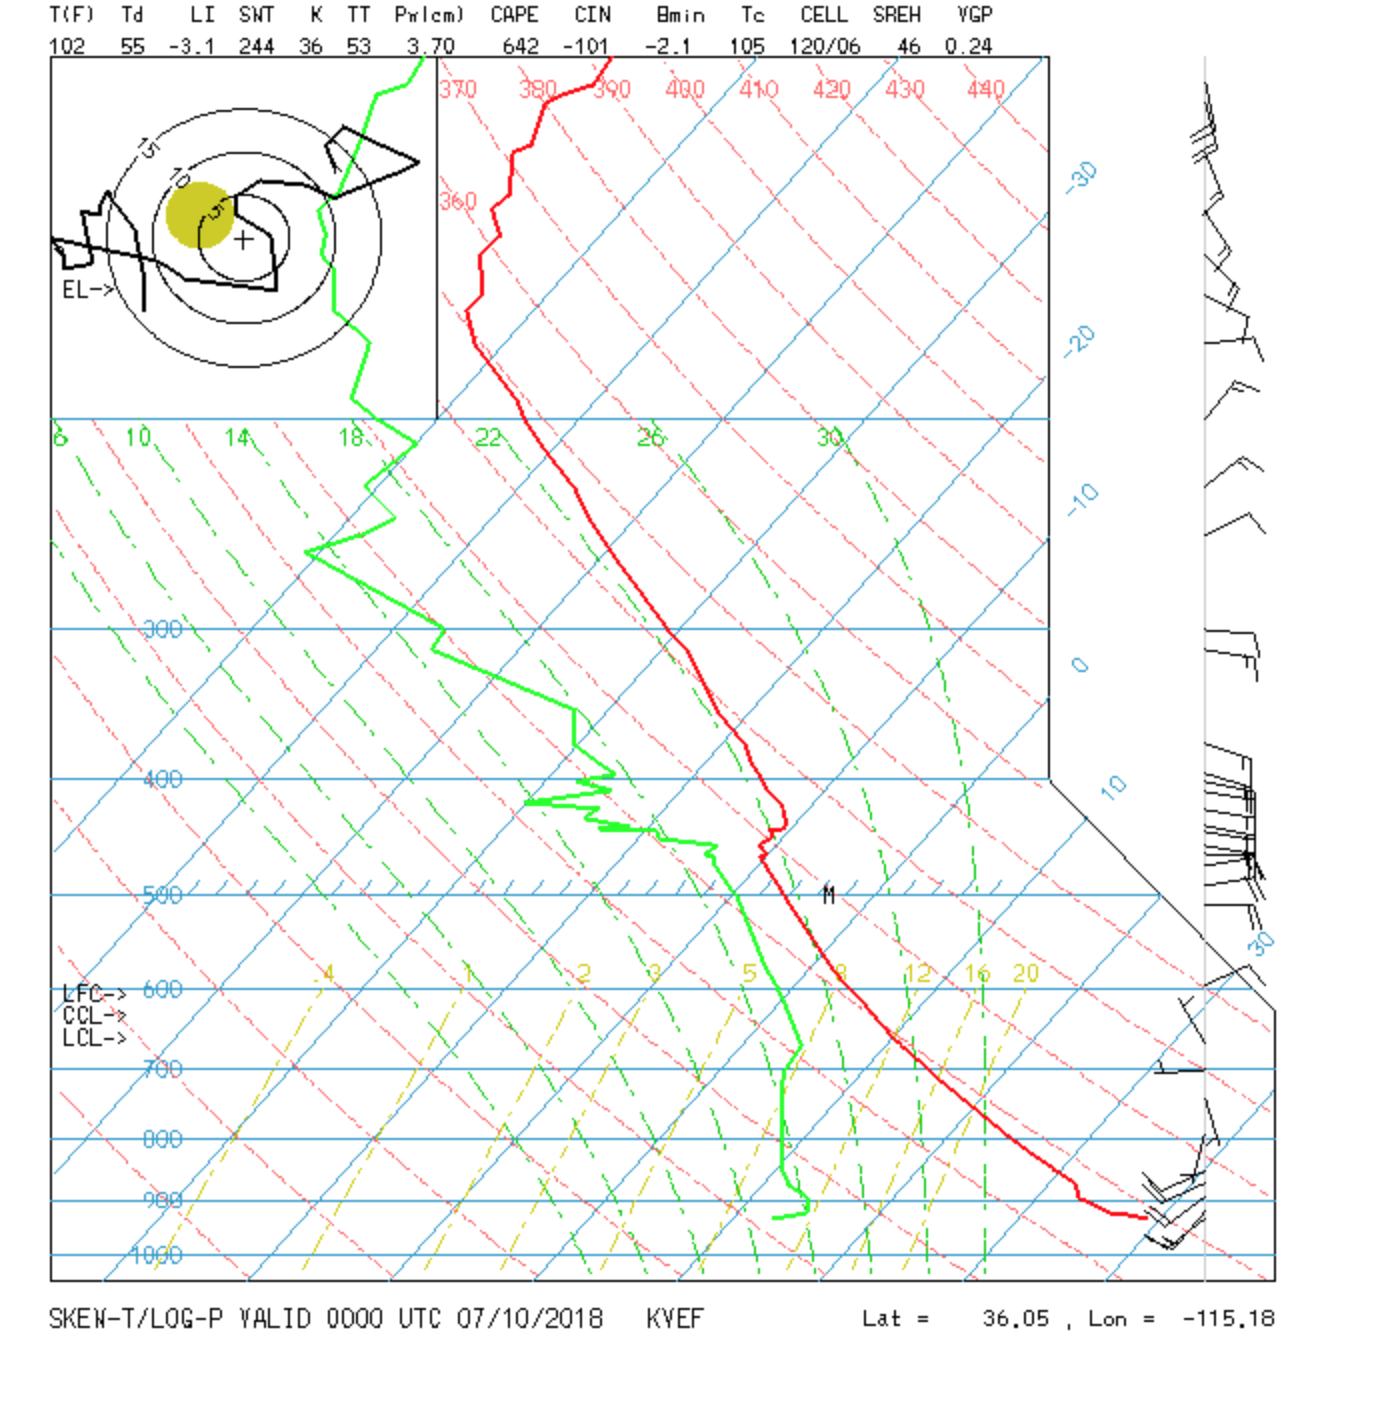
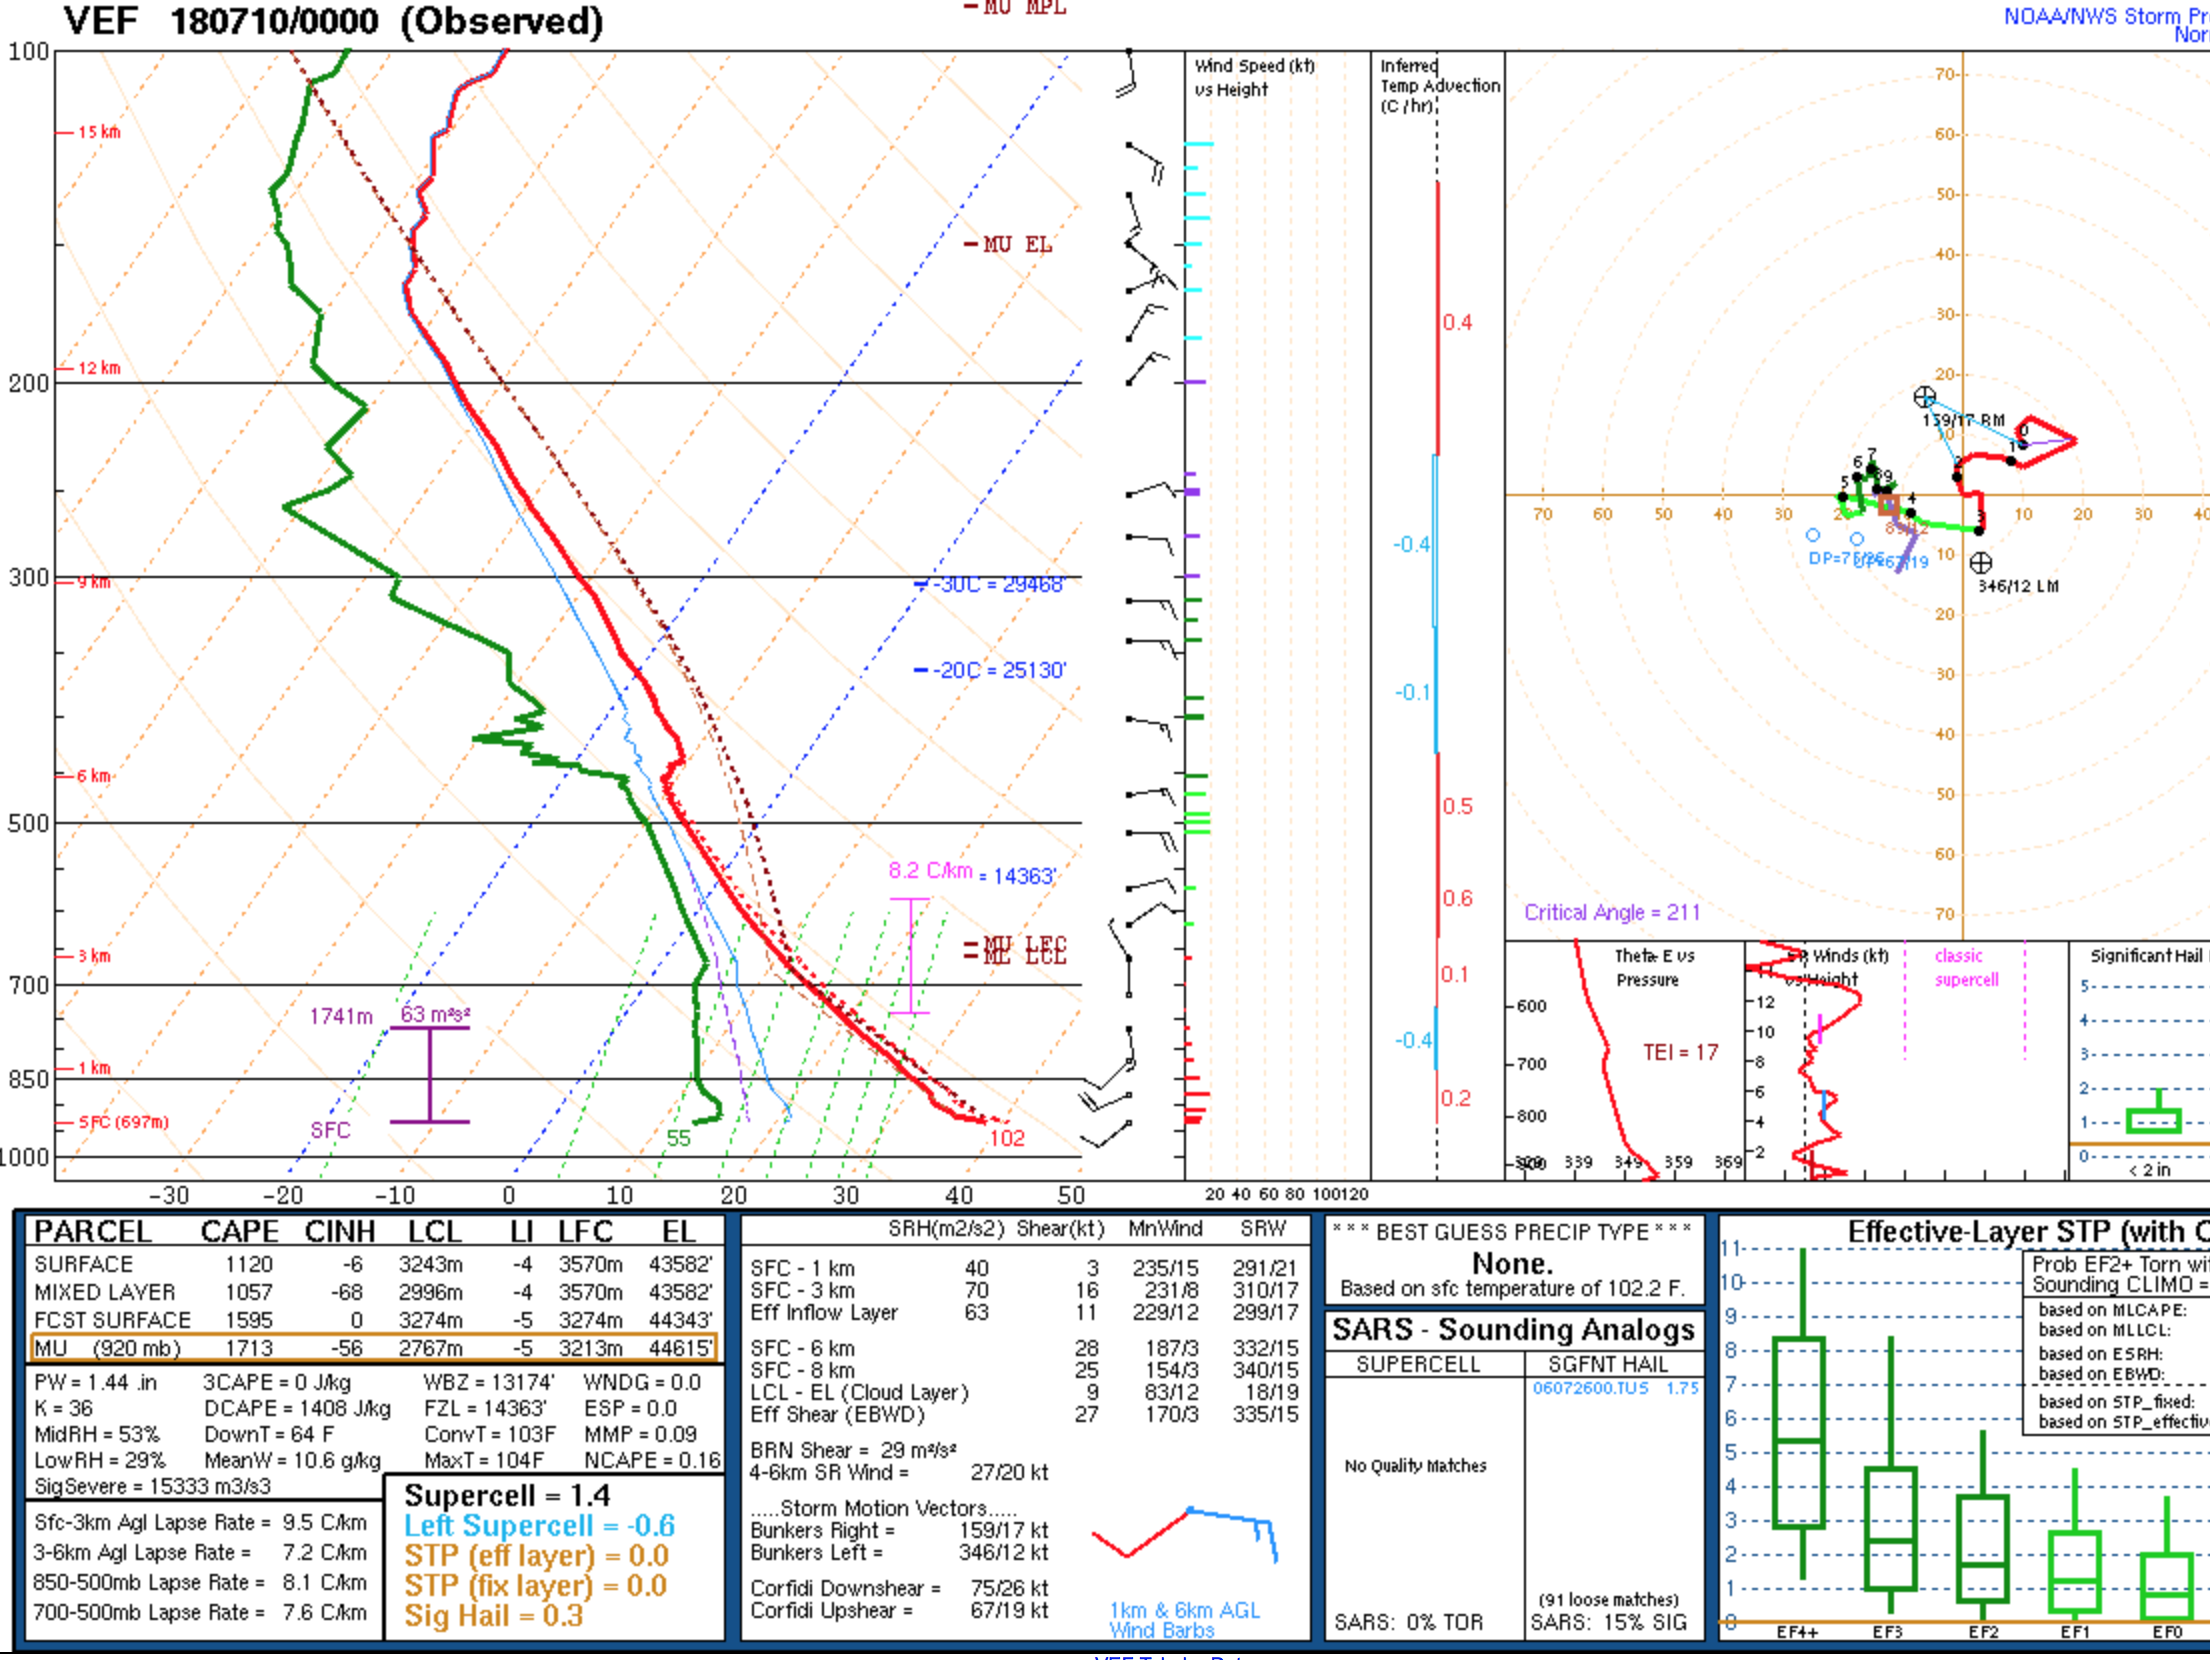
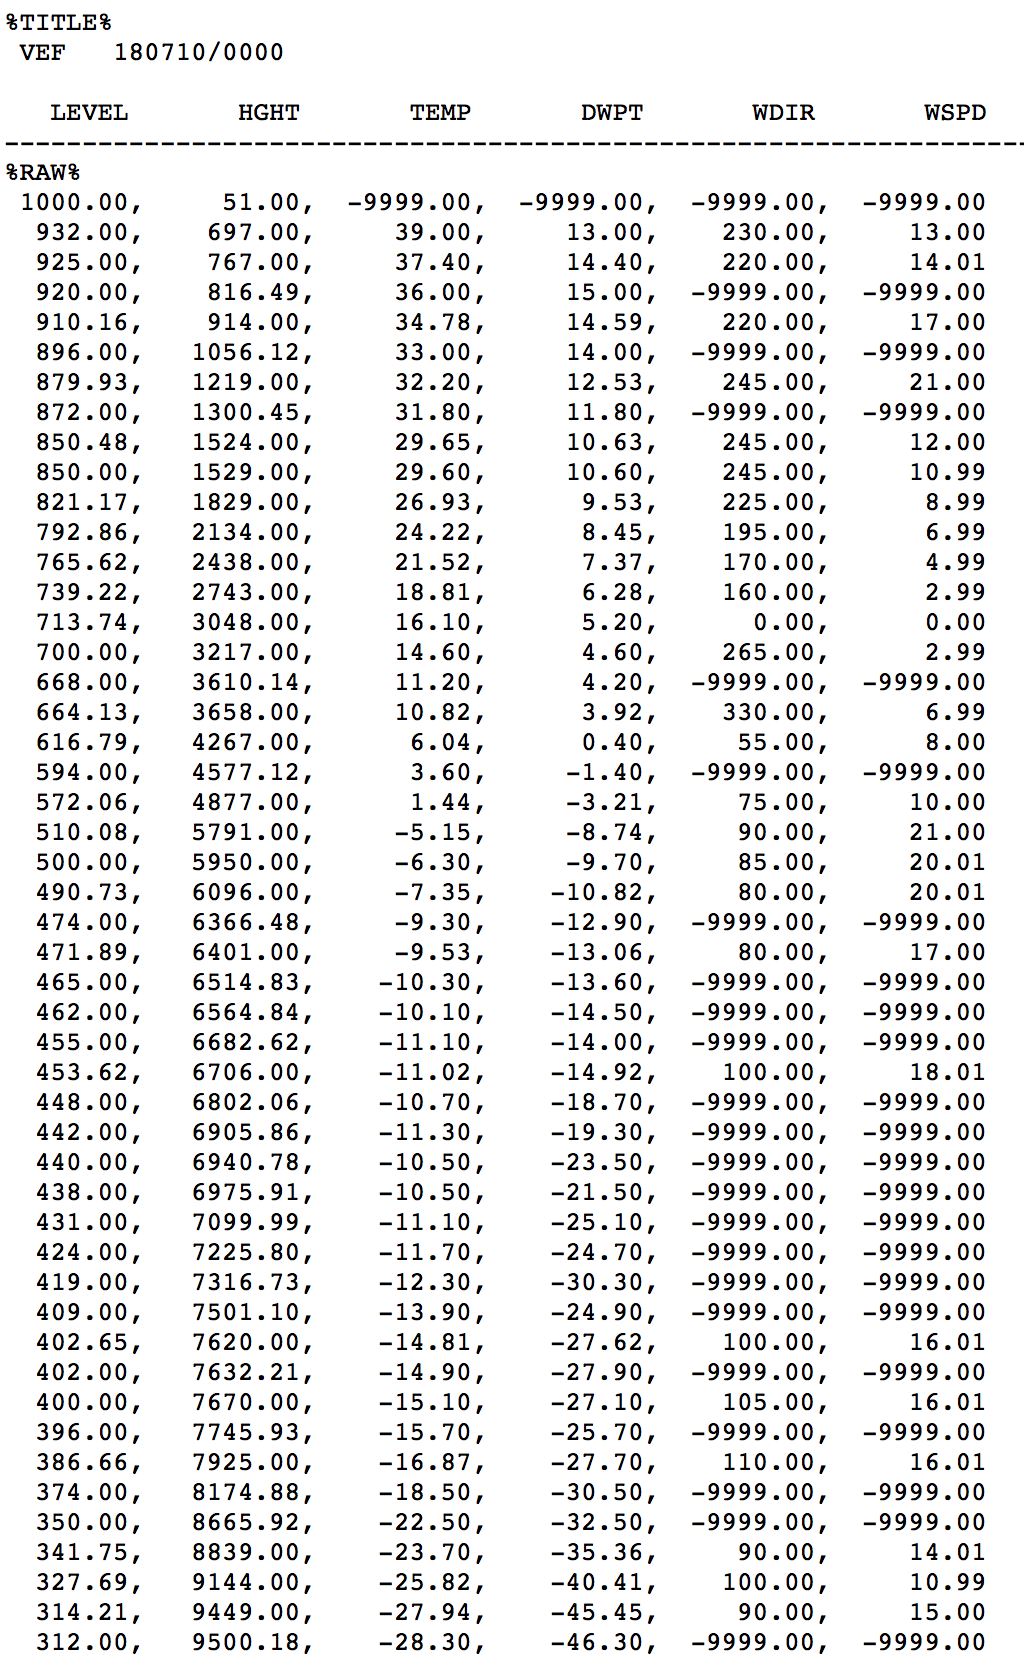
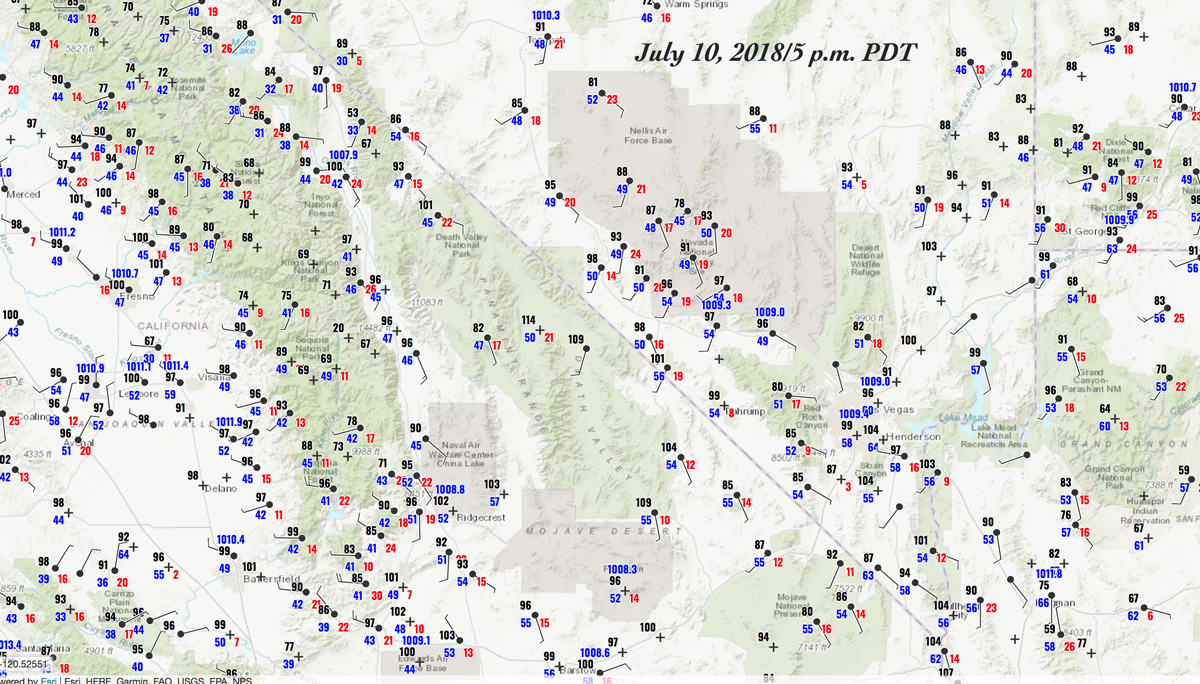
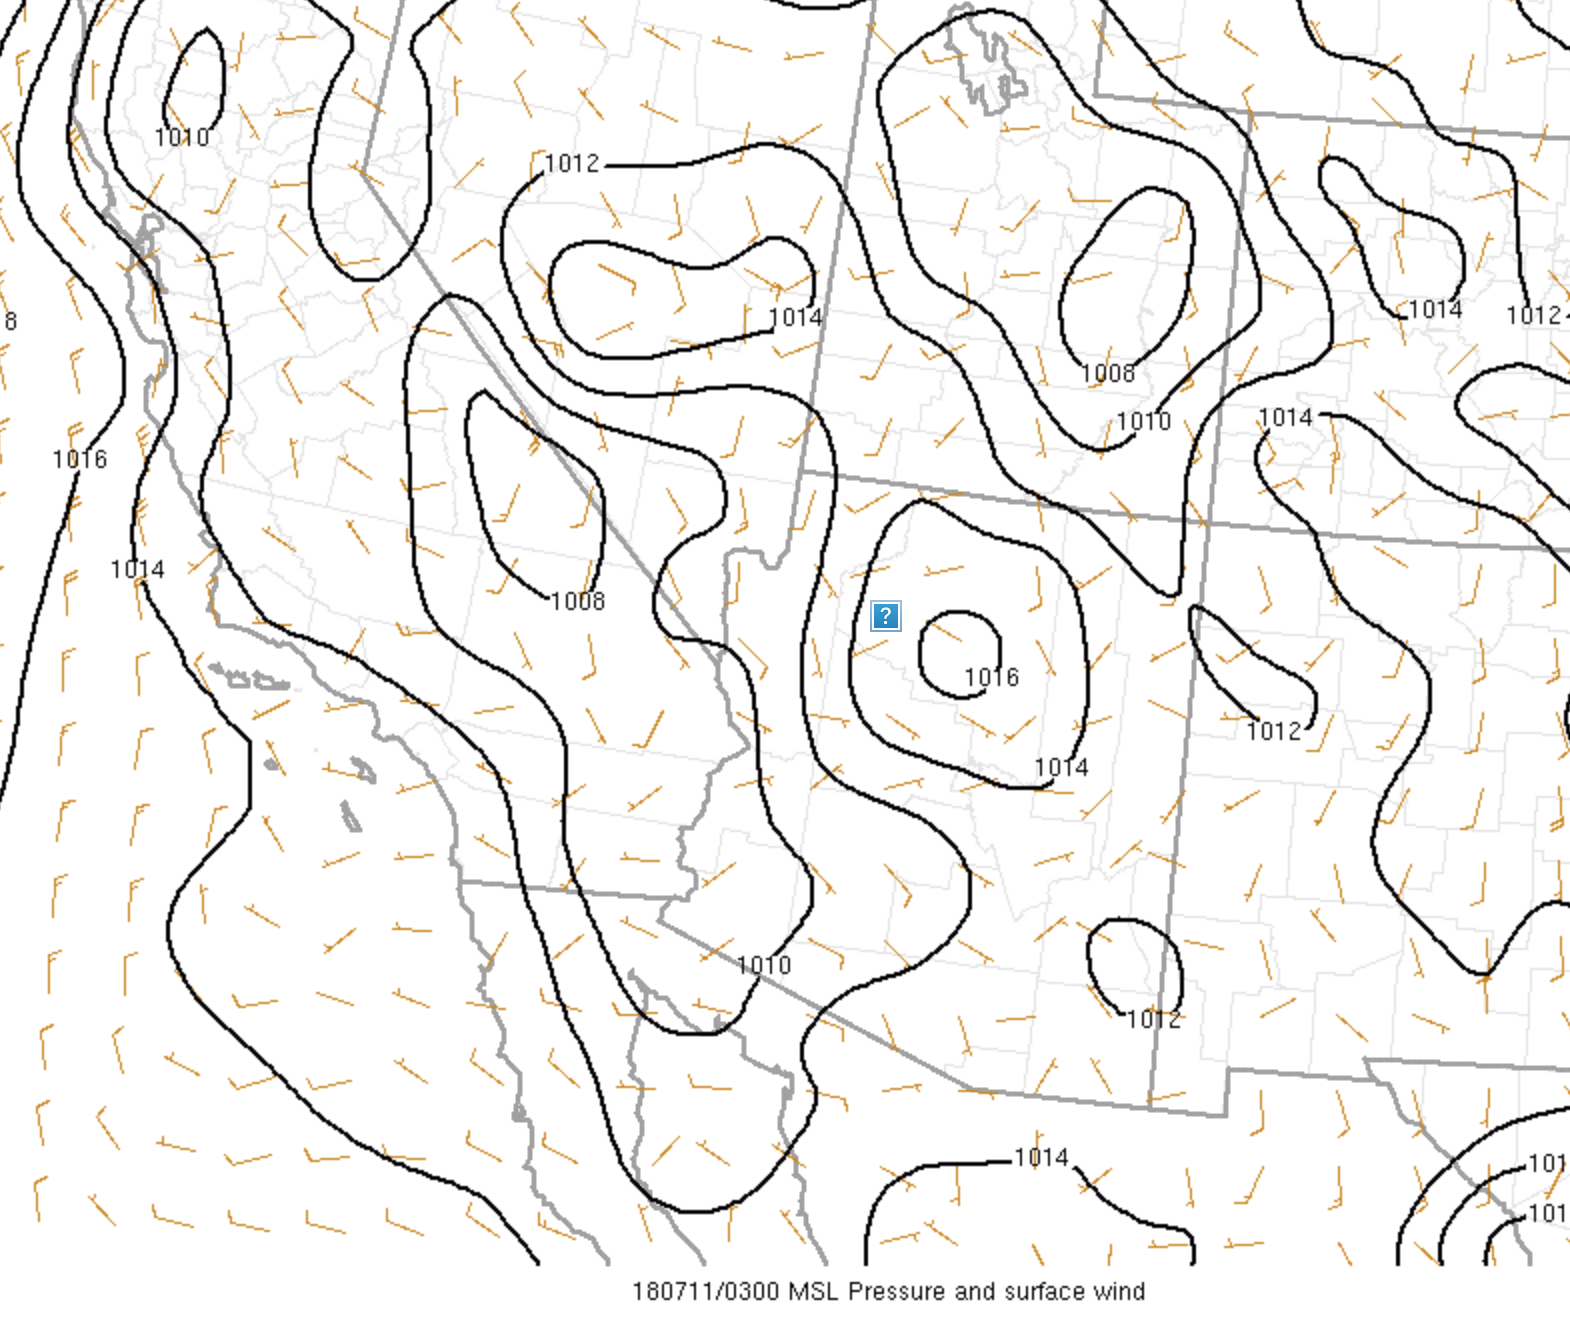
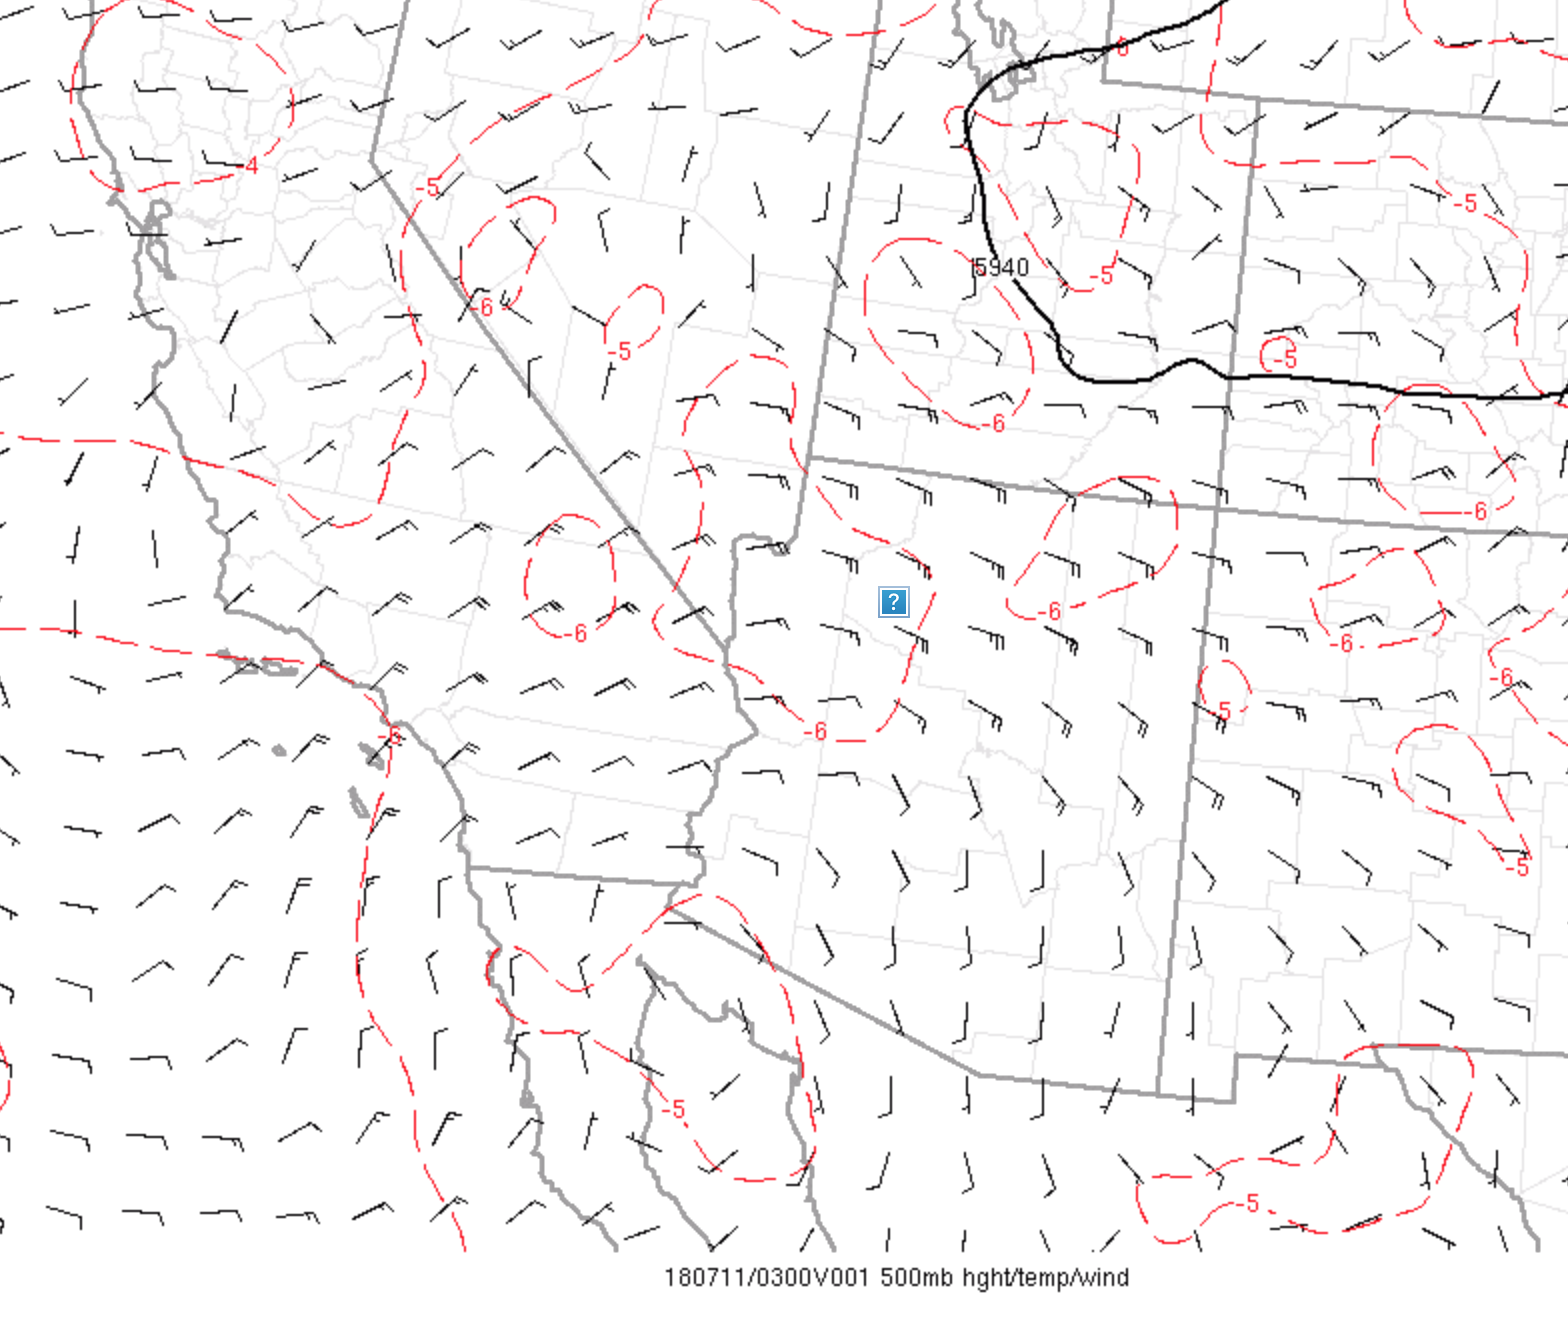
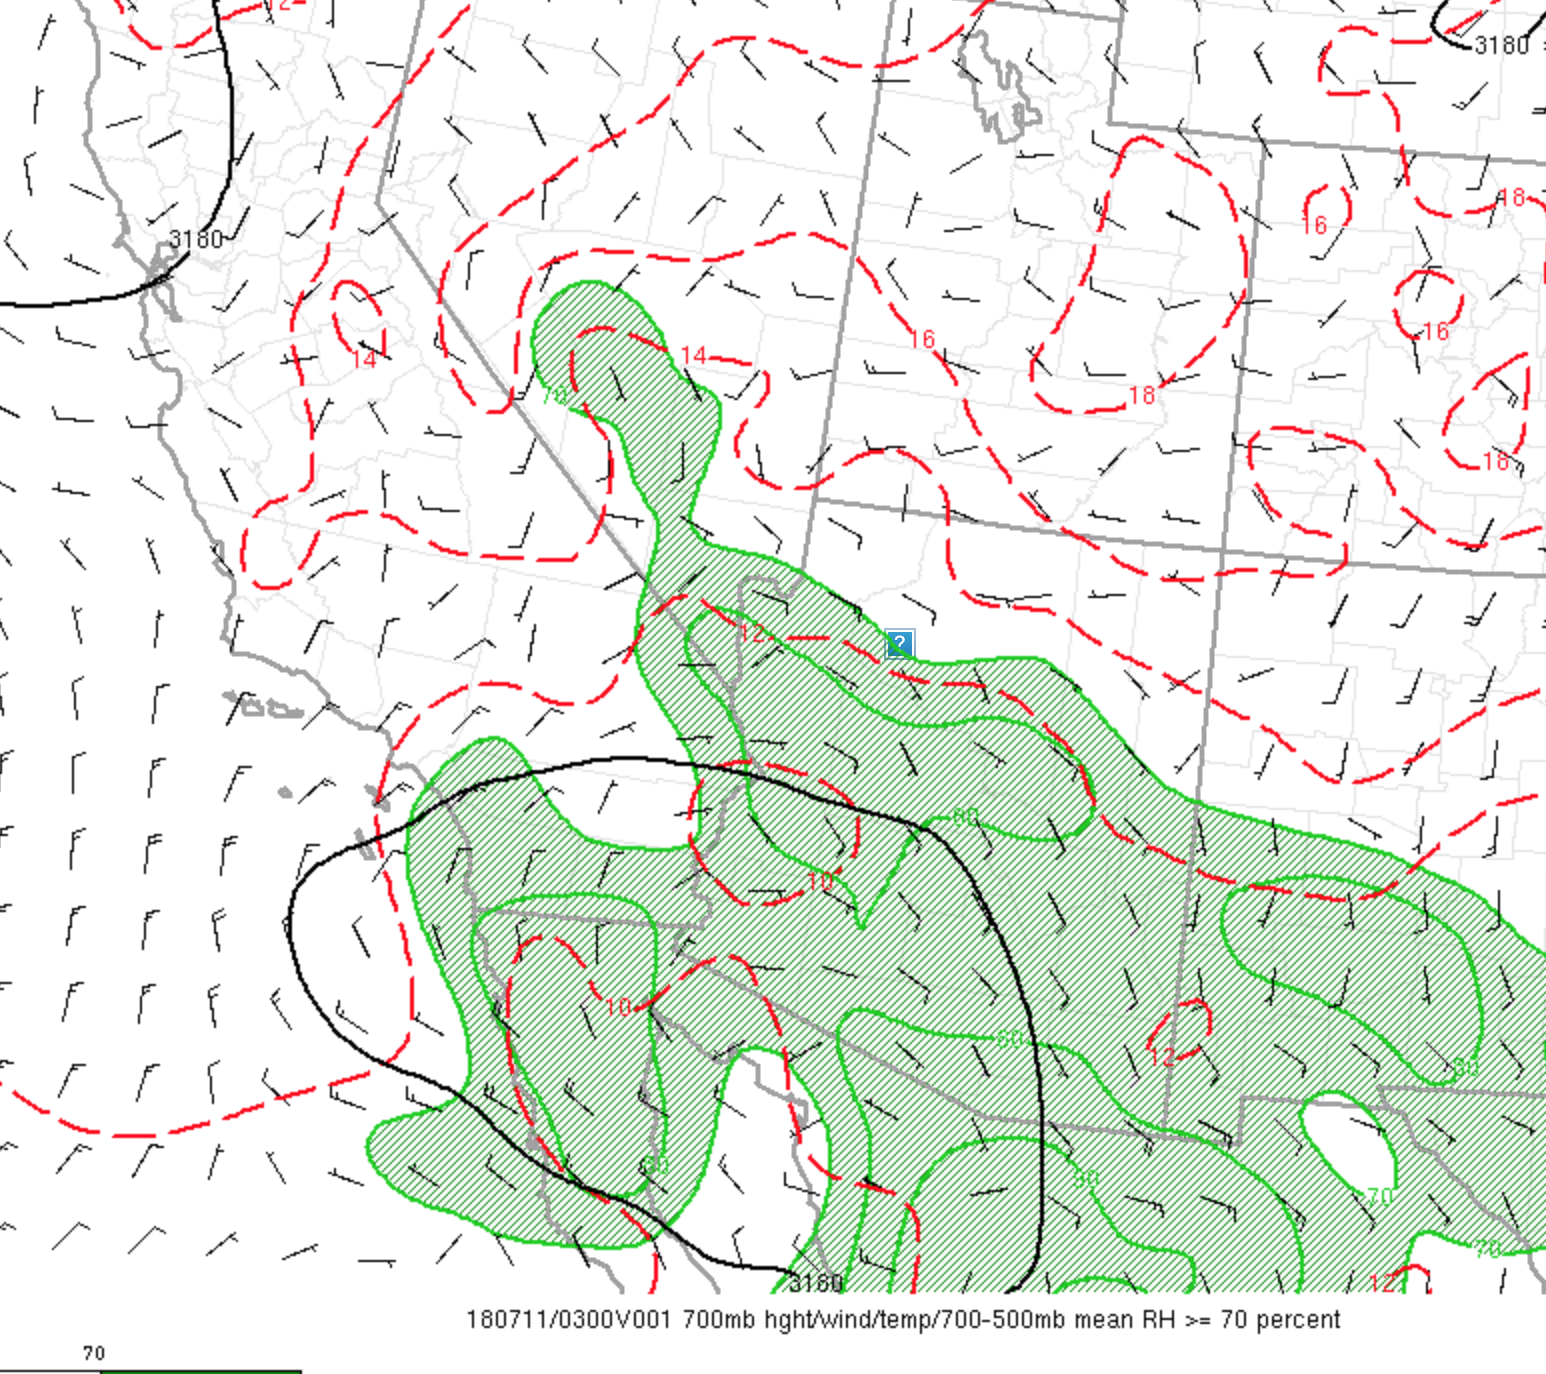
July 10
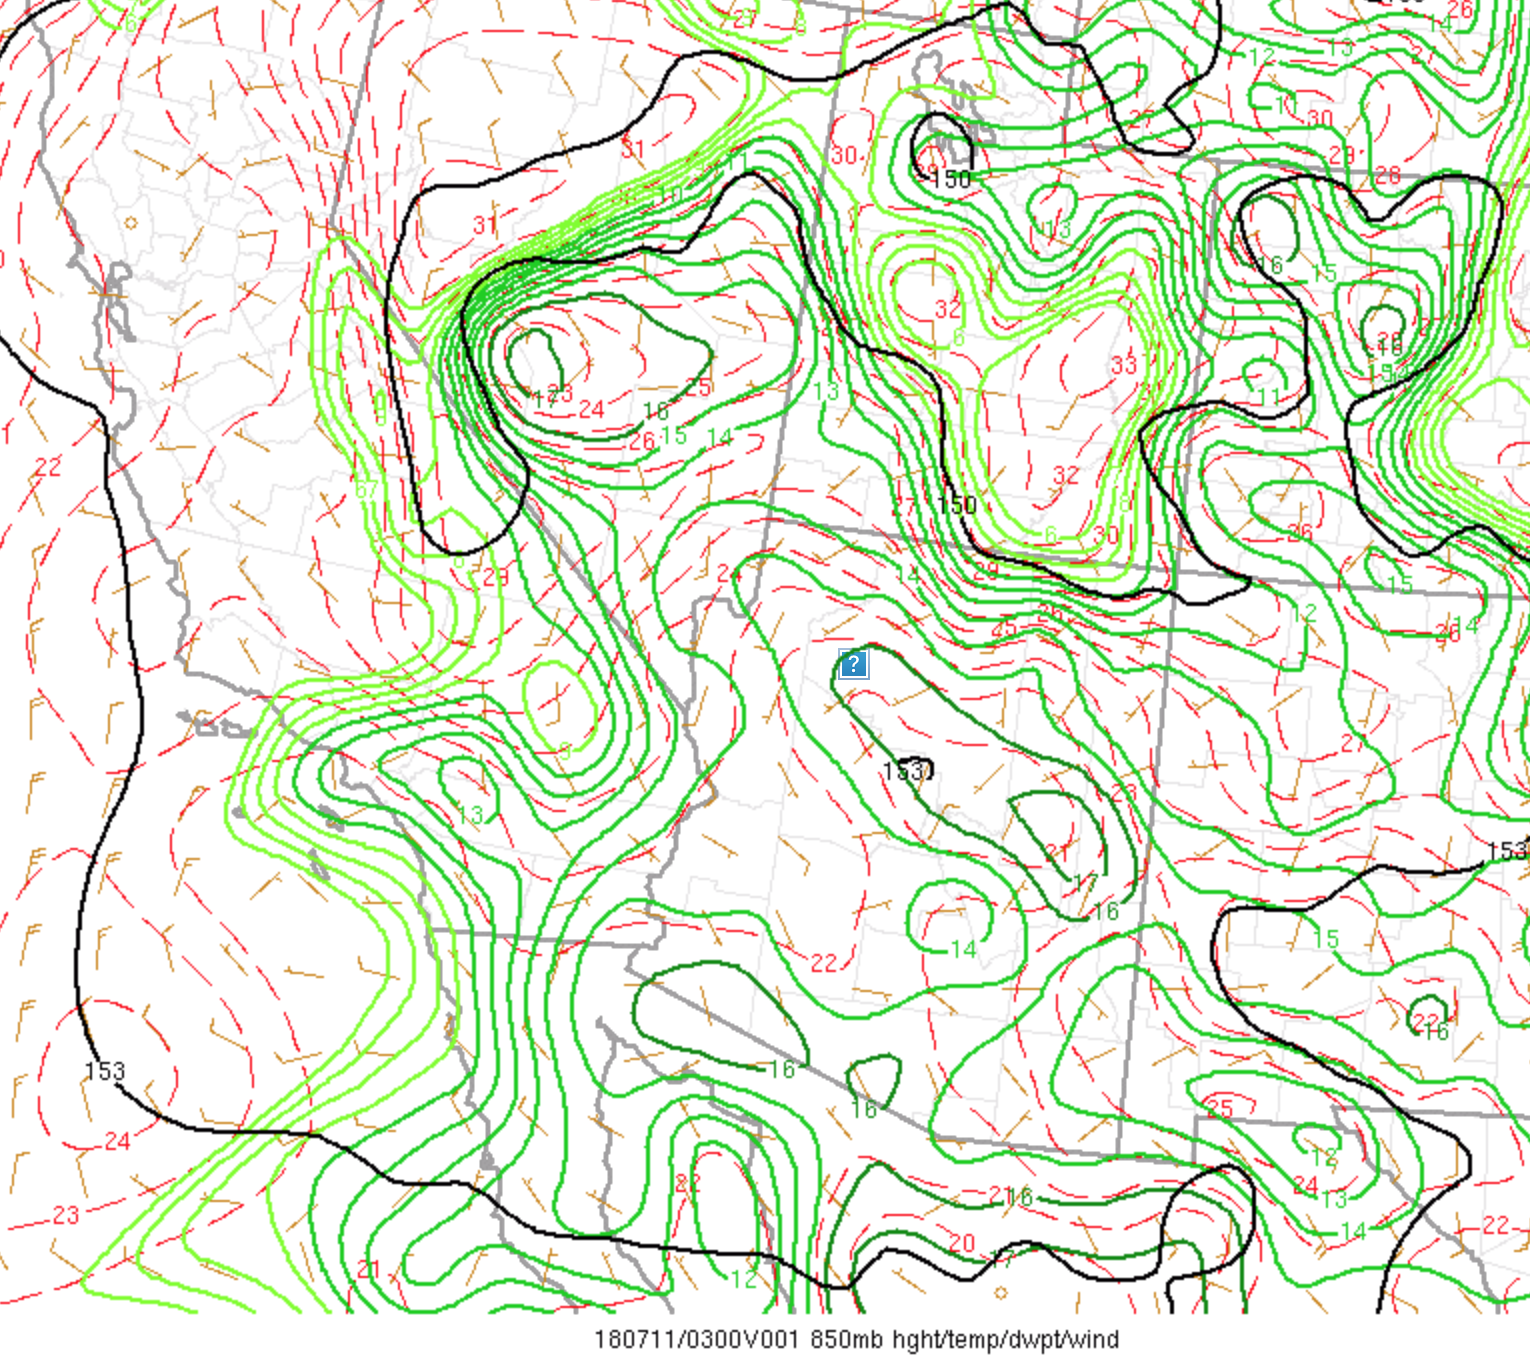
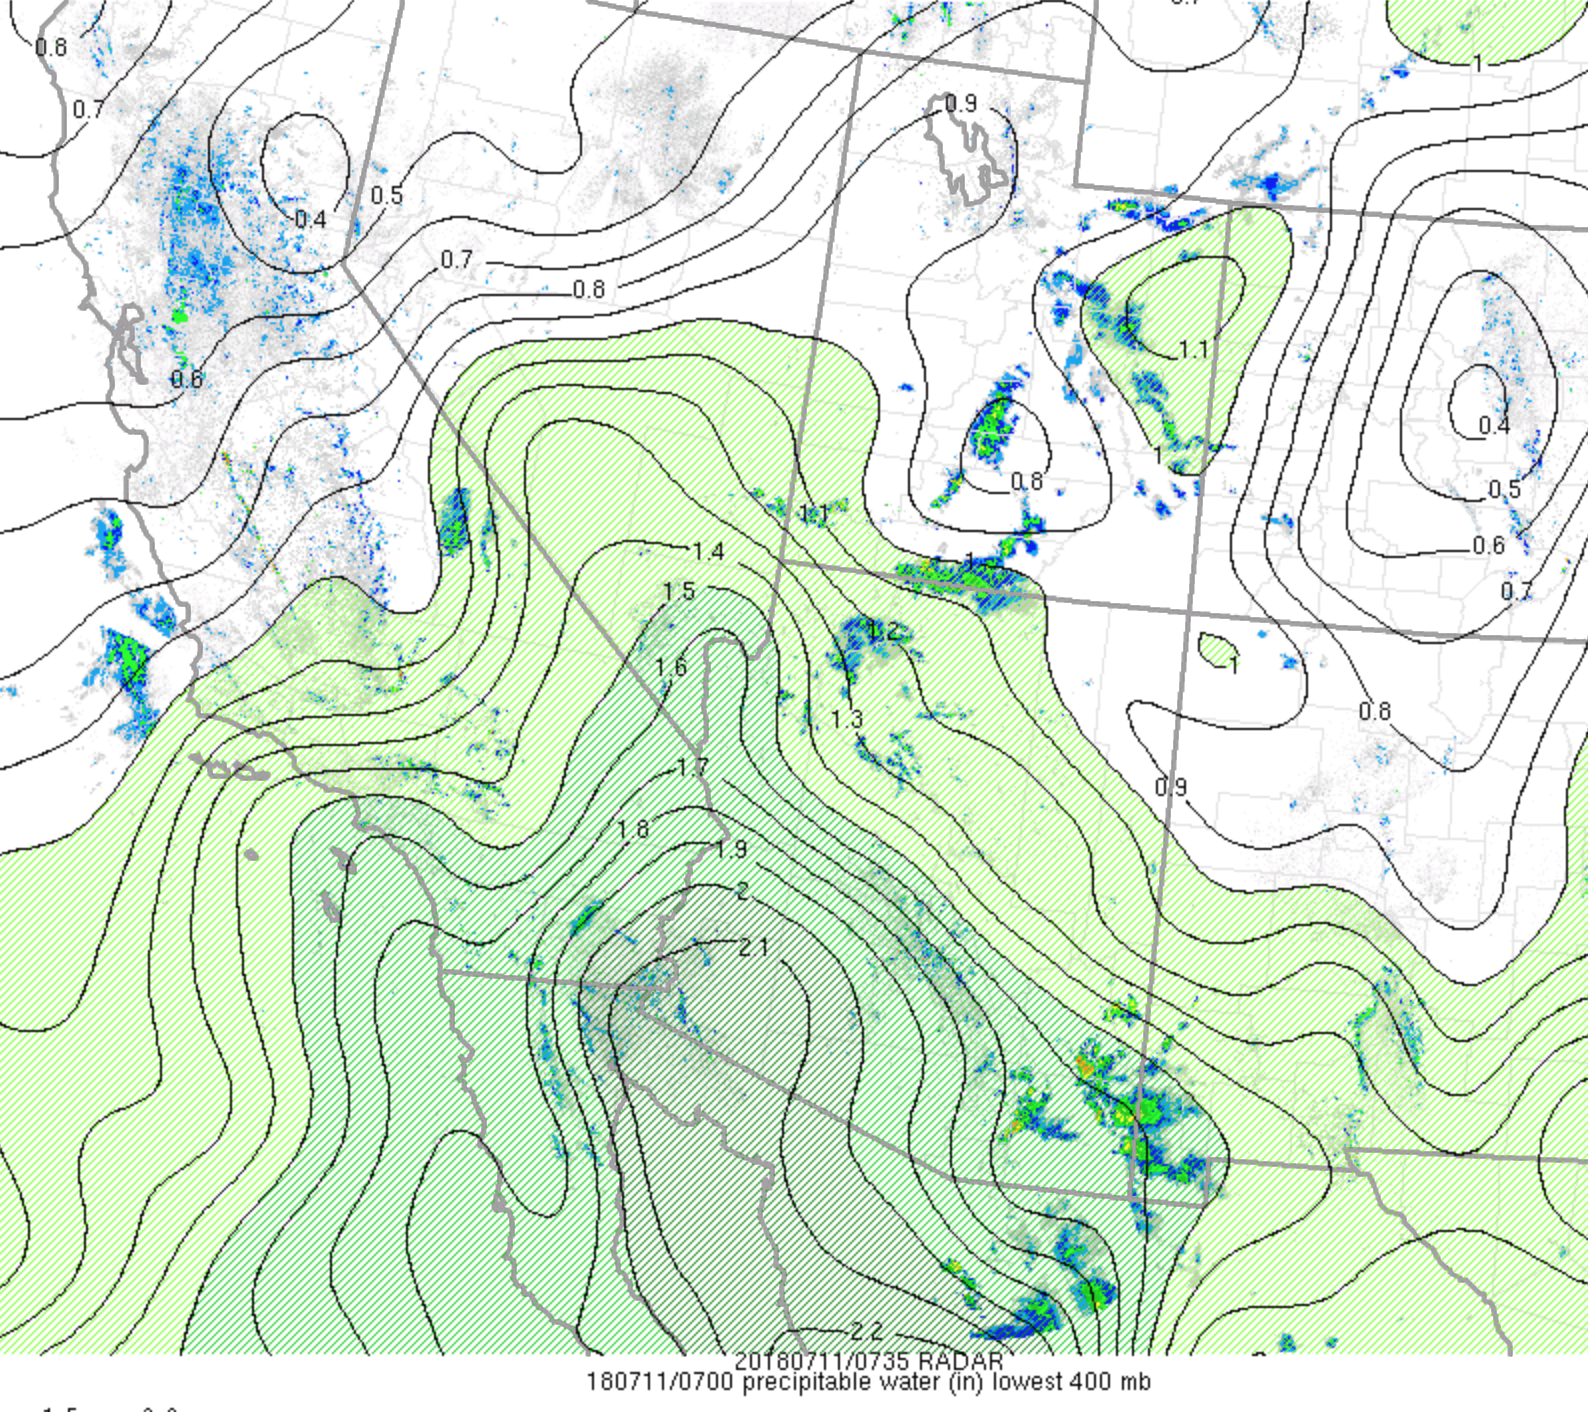
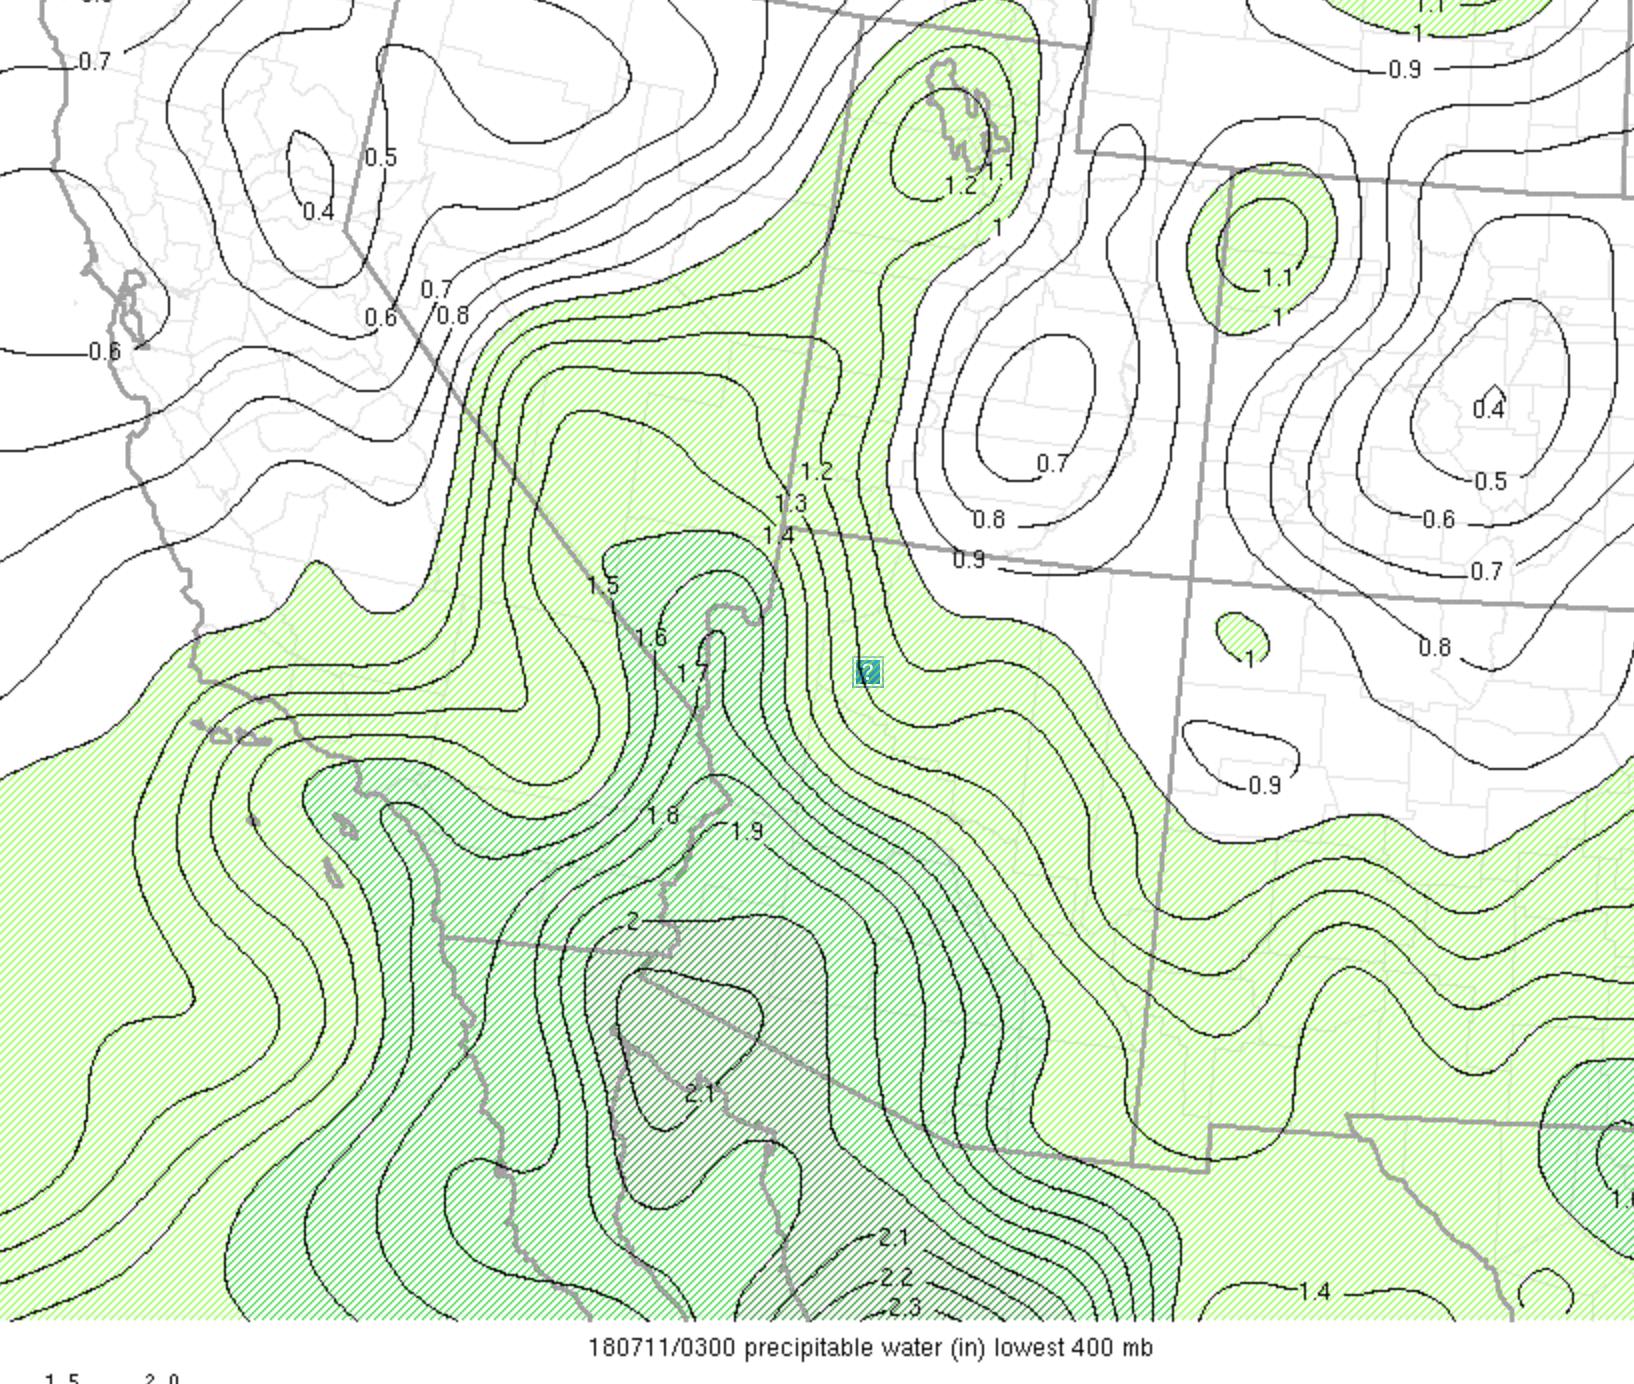
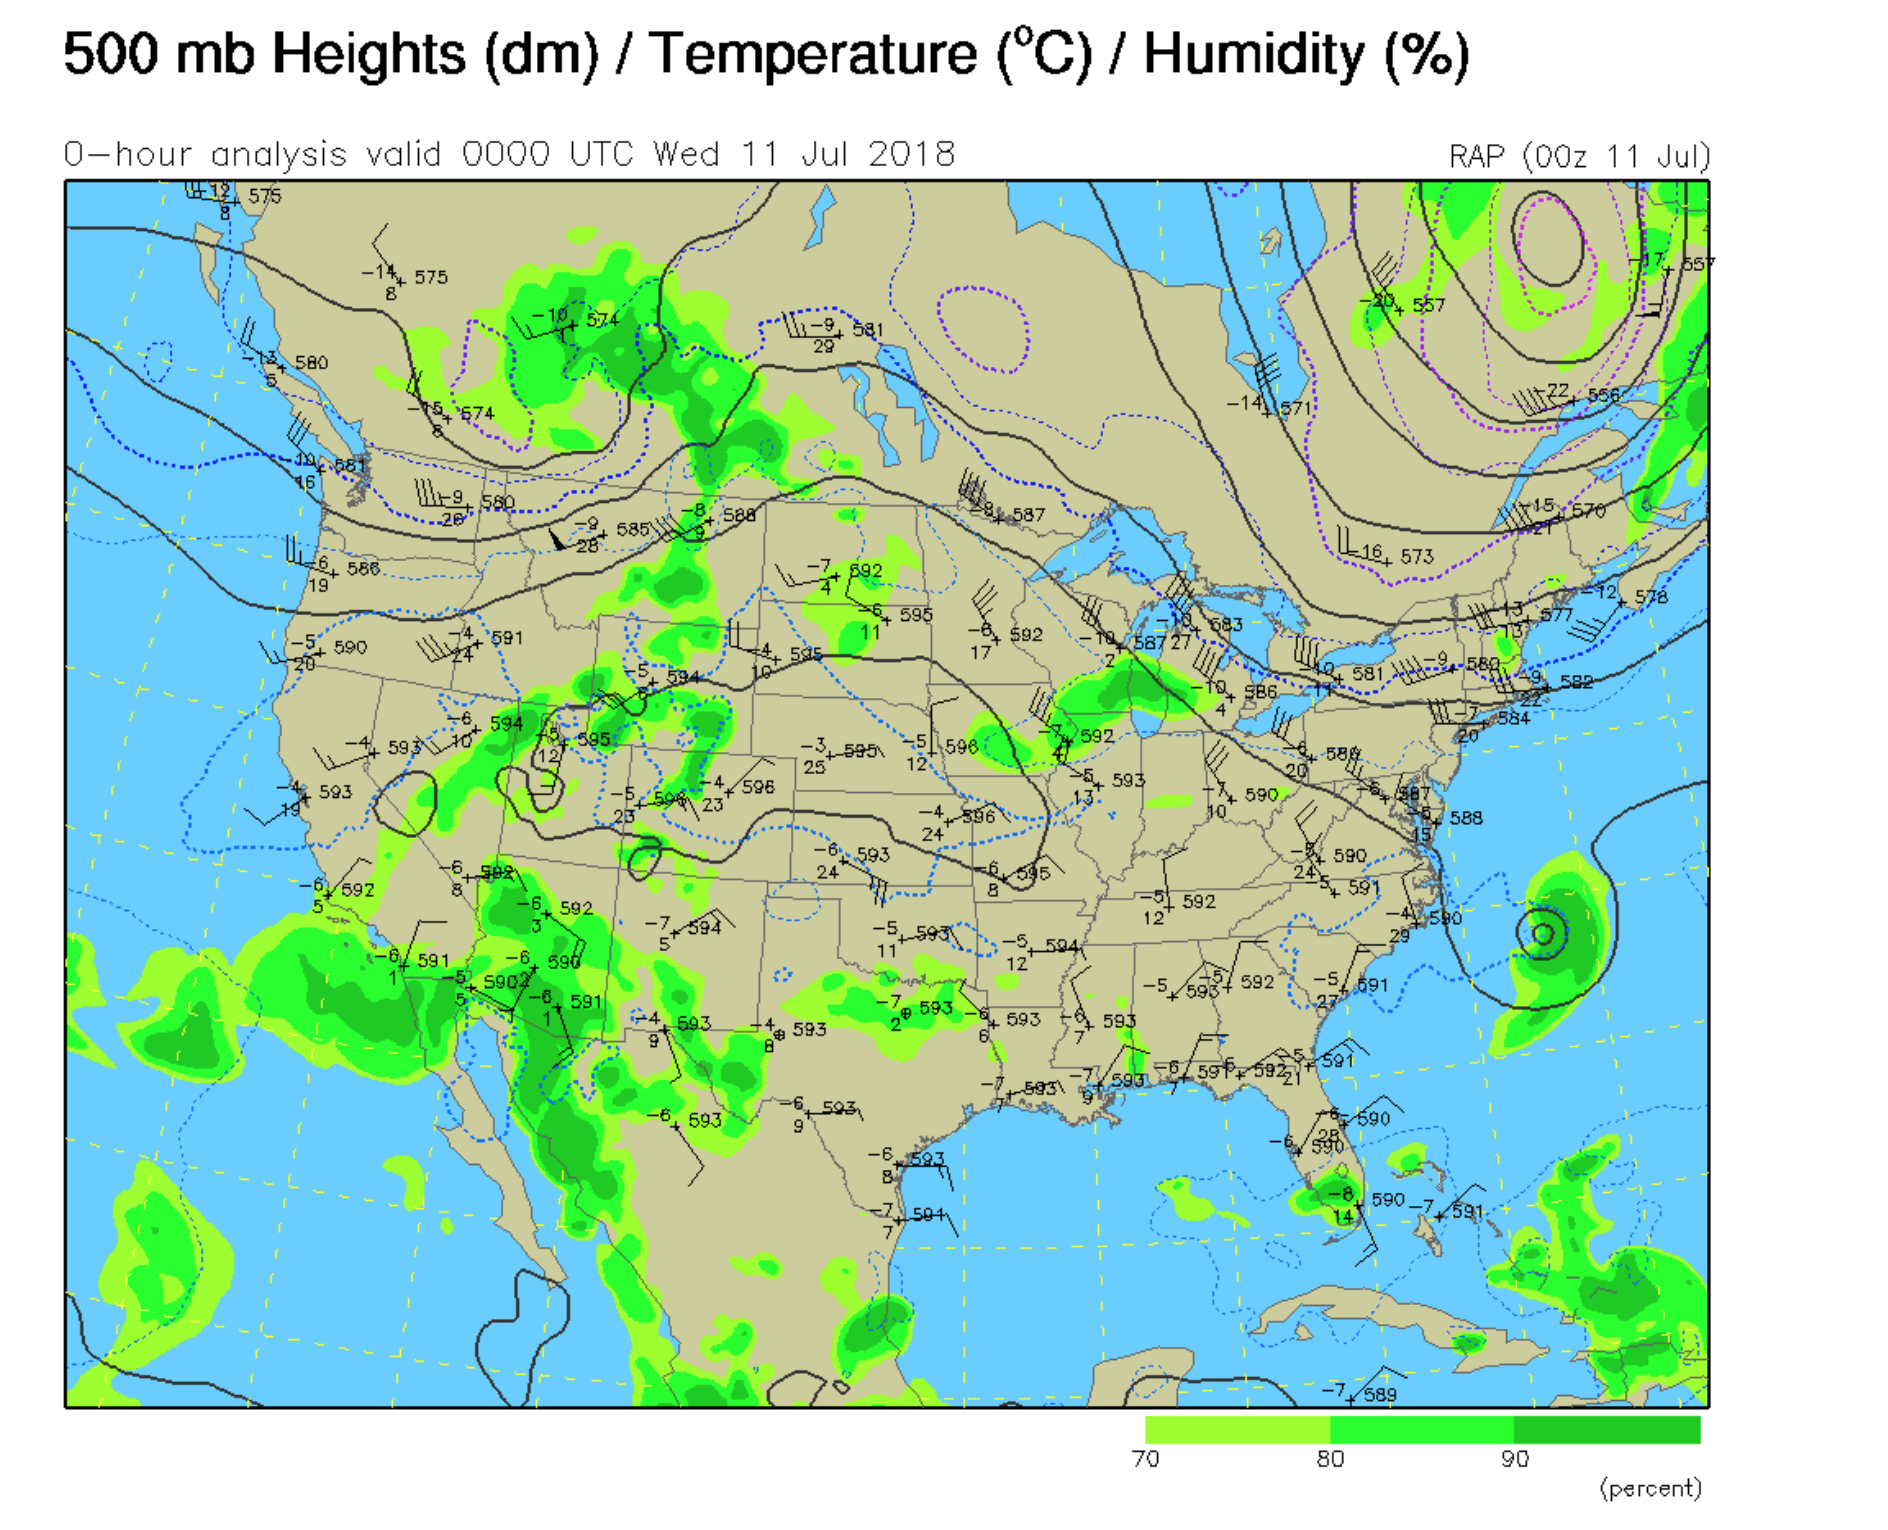
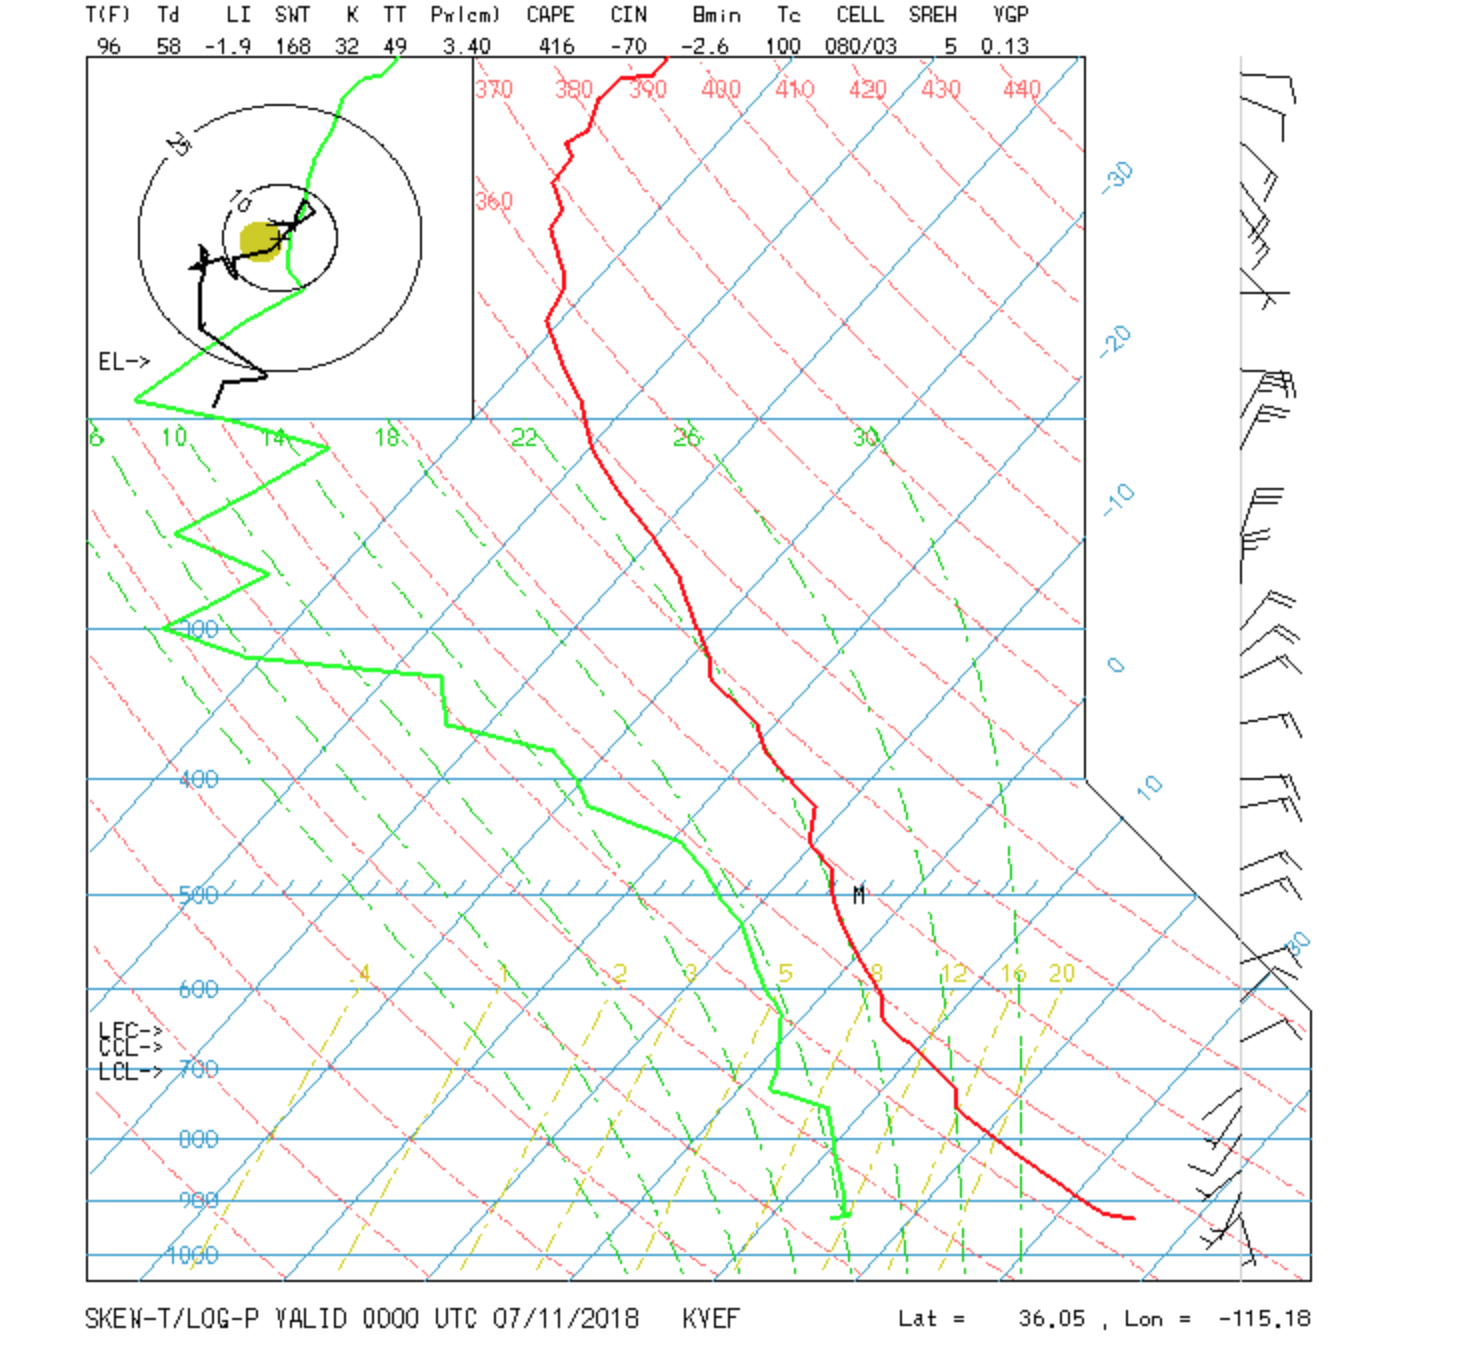
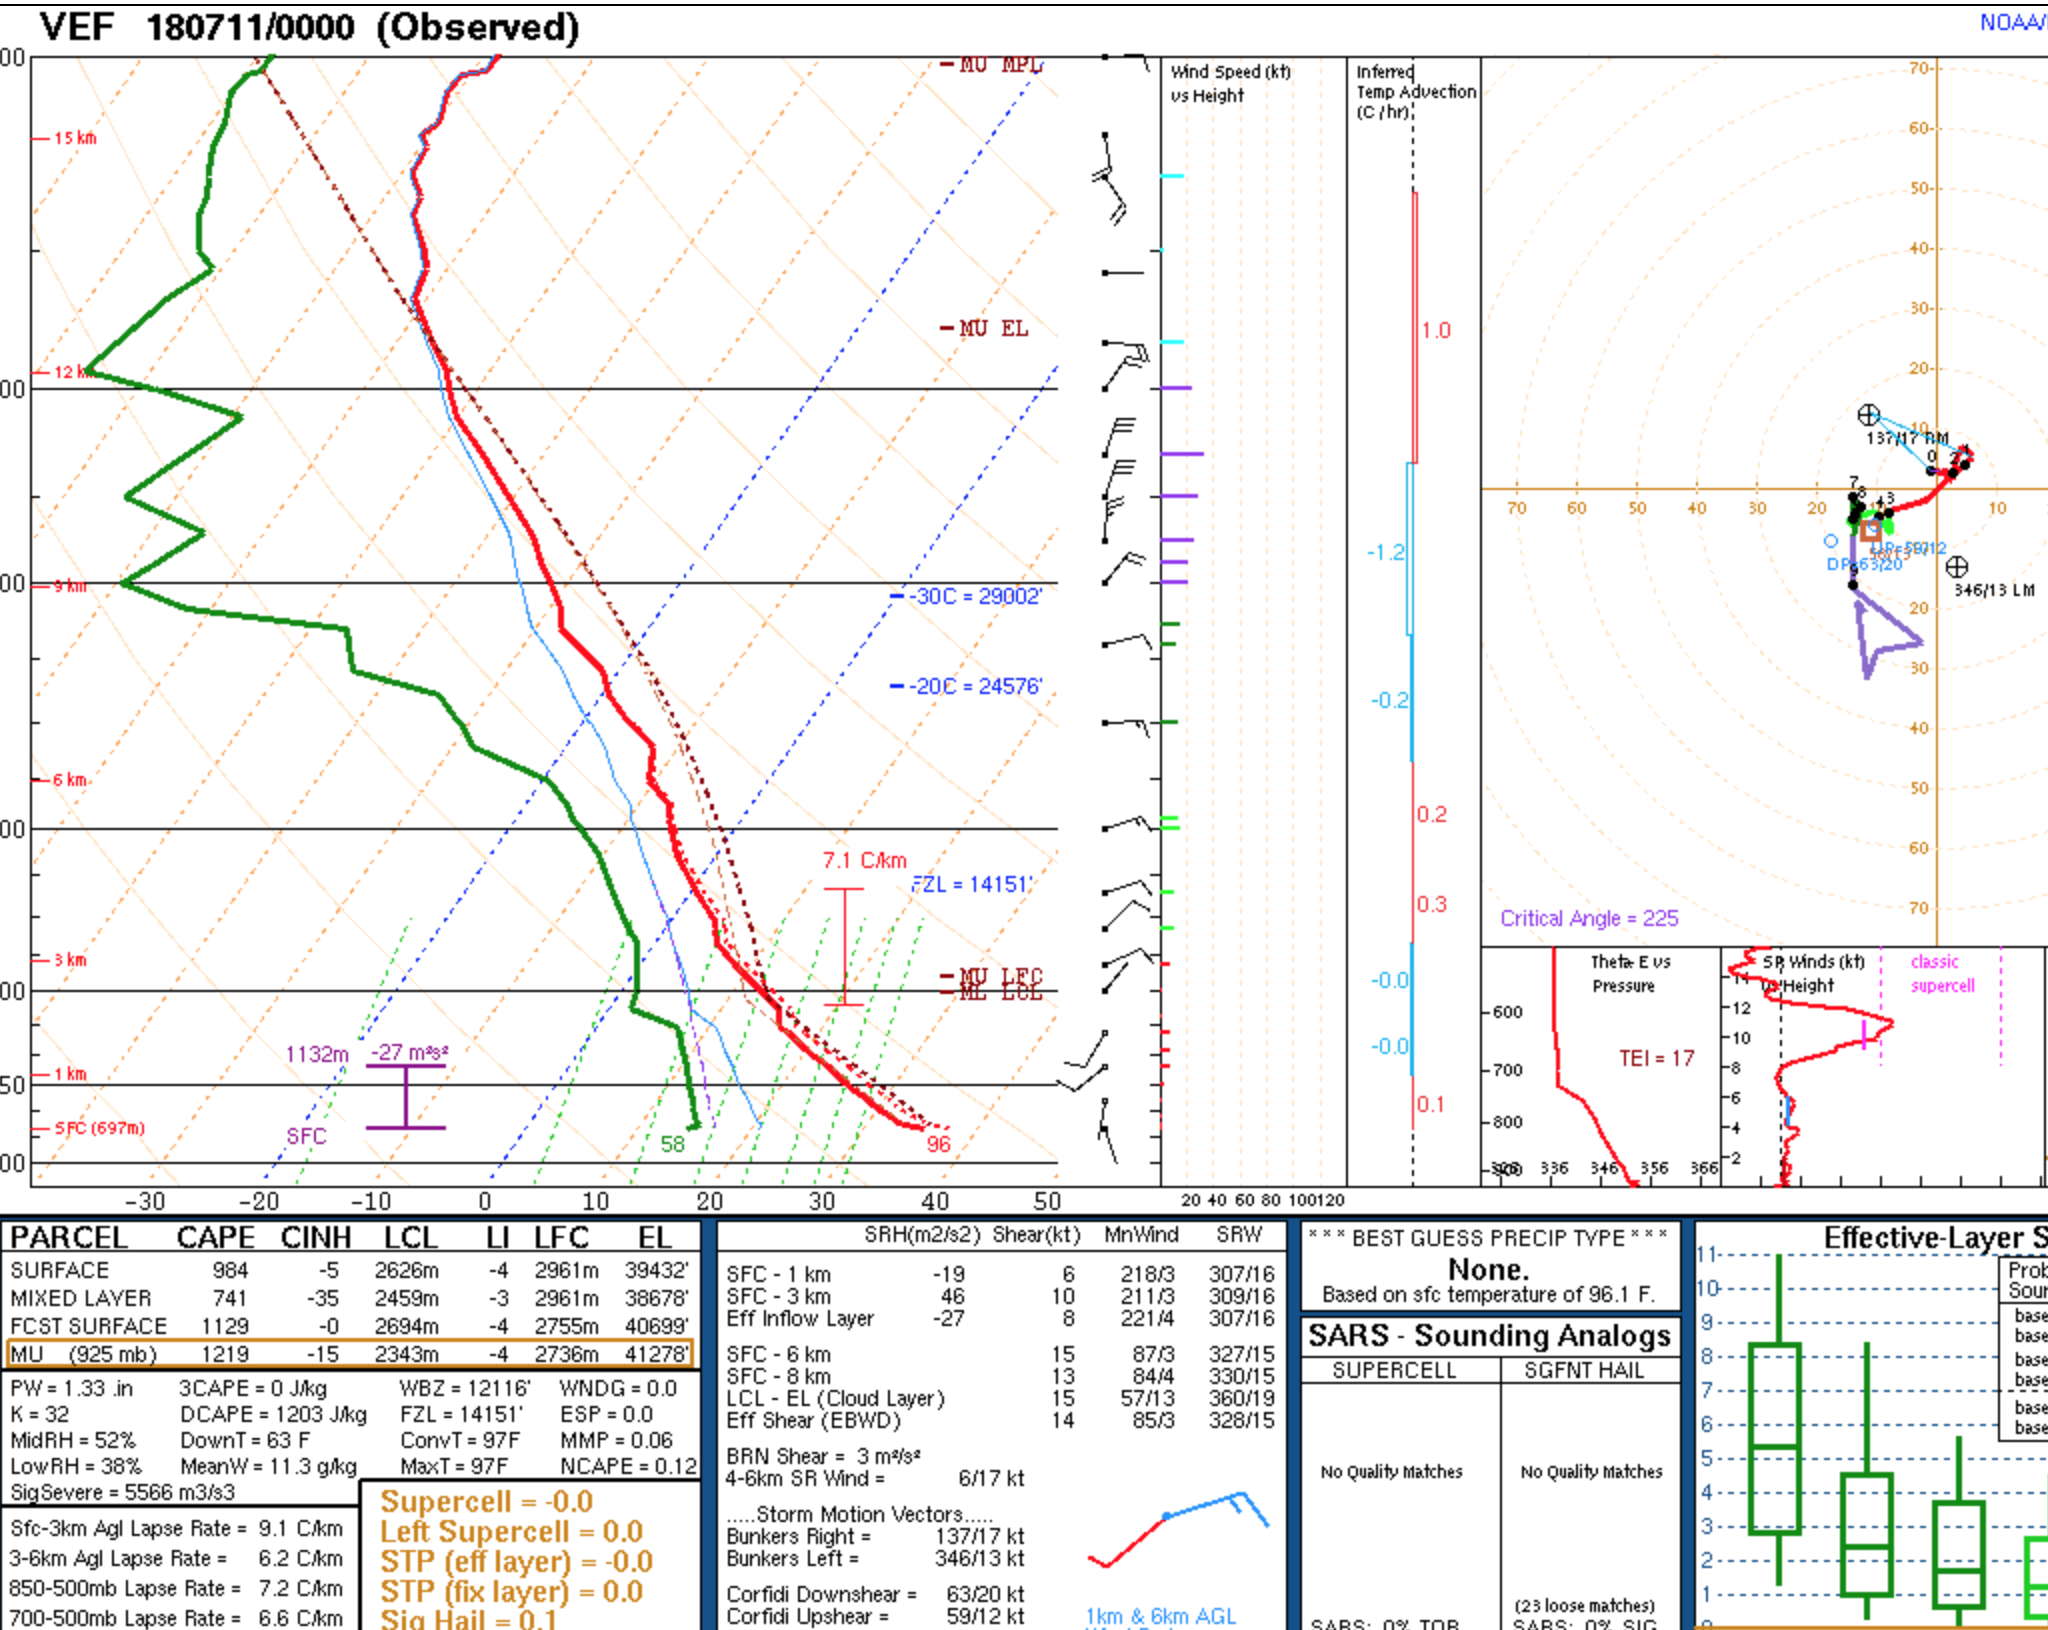
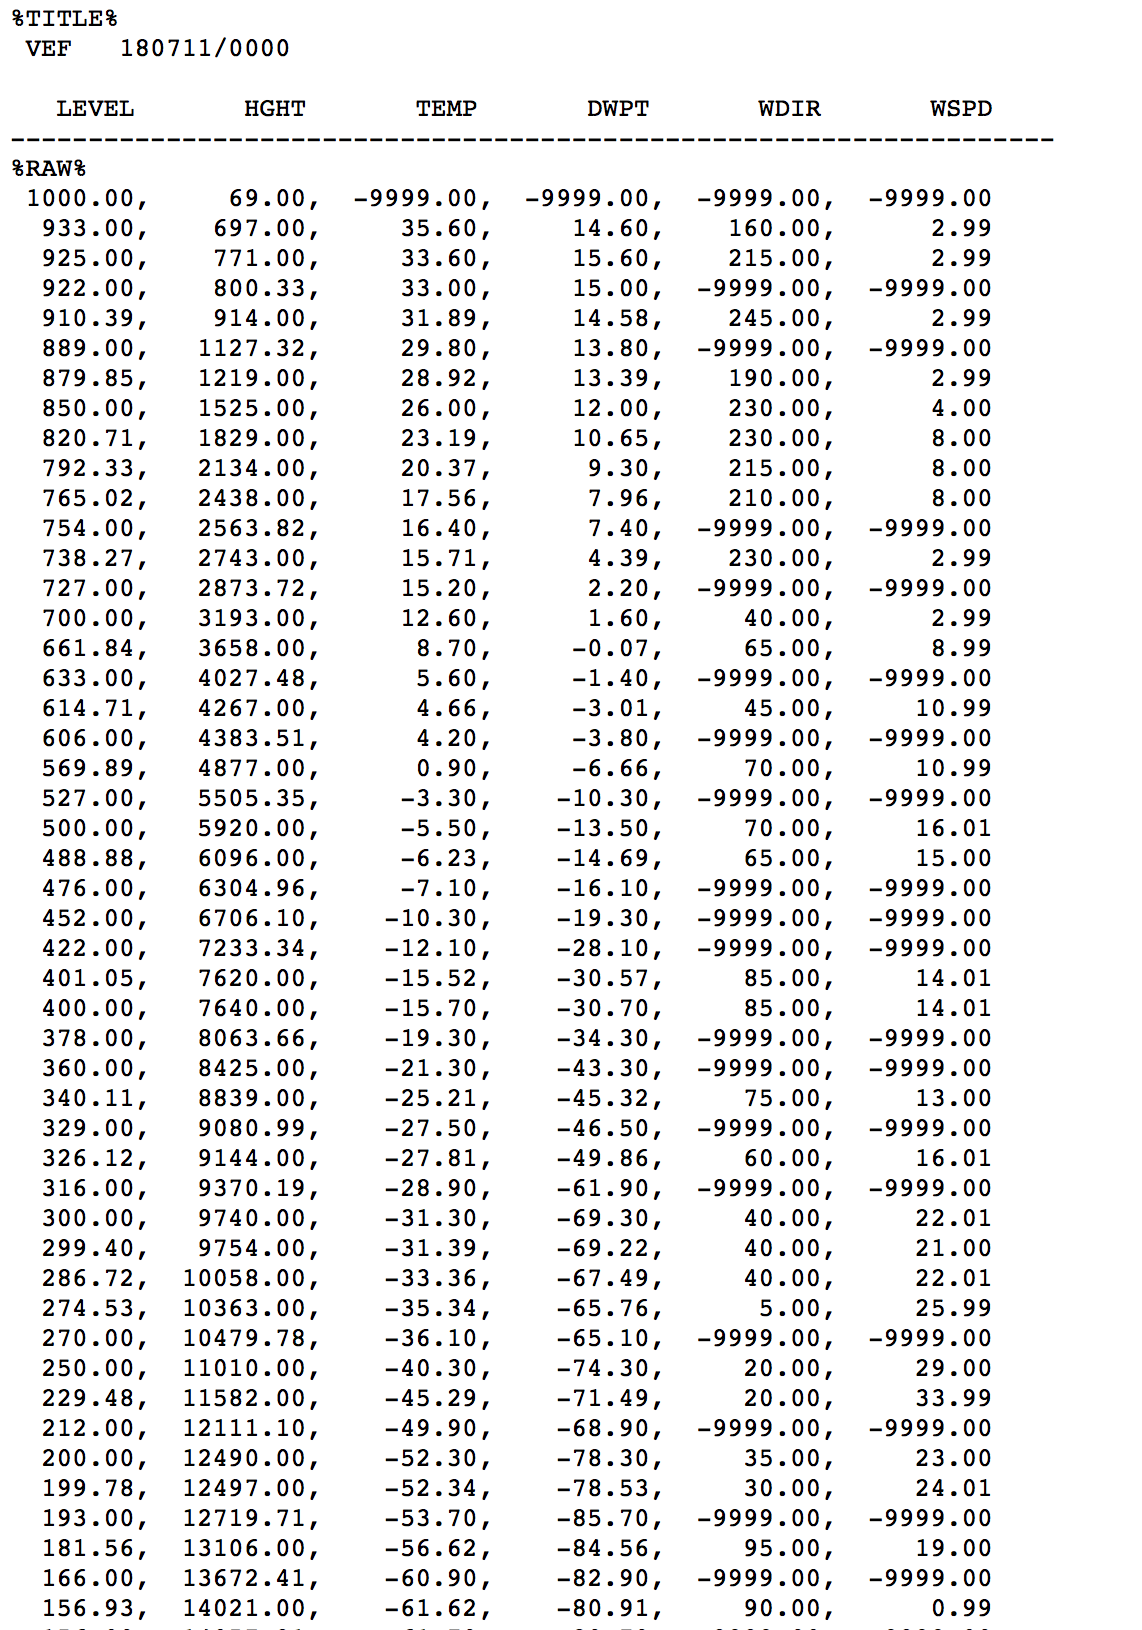
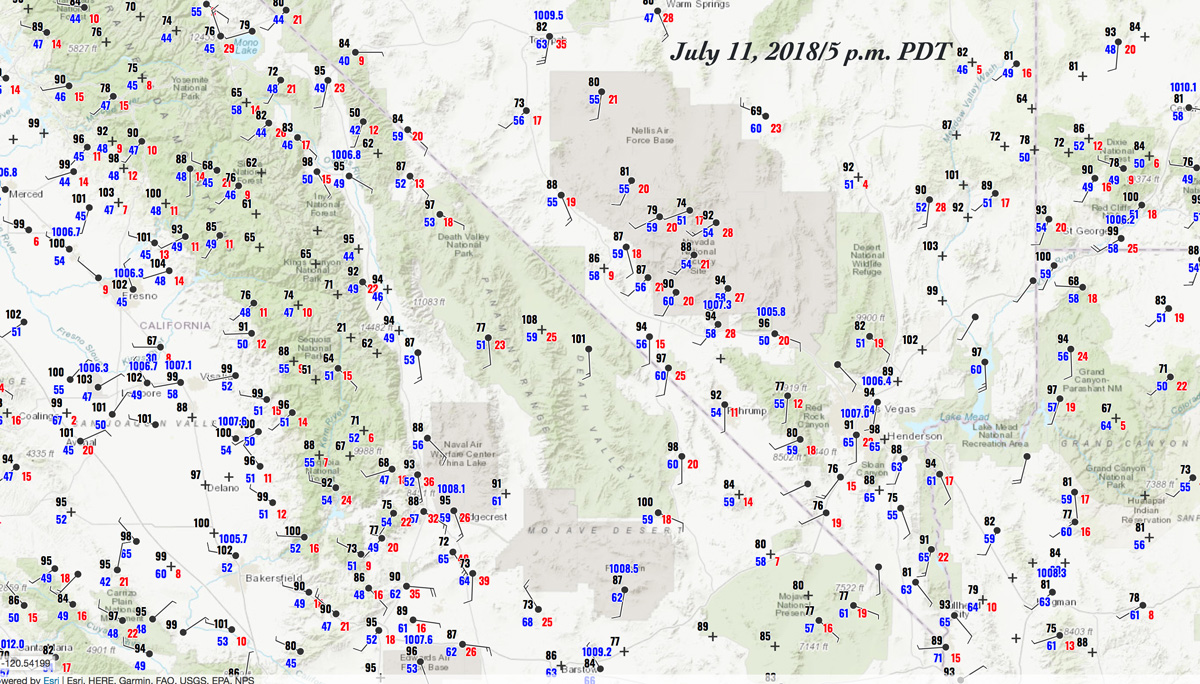
July 11
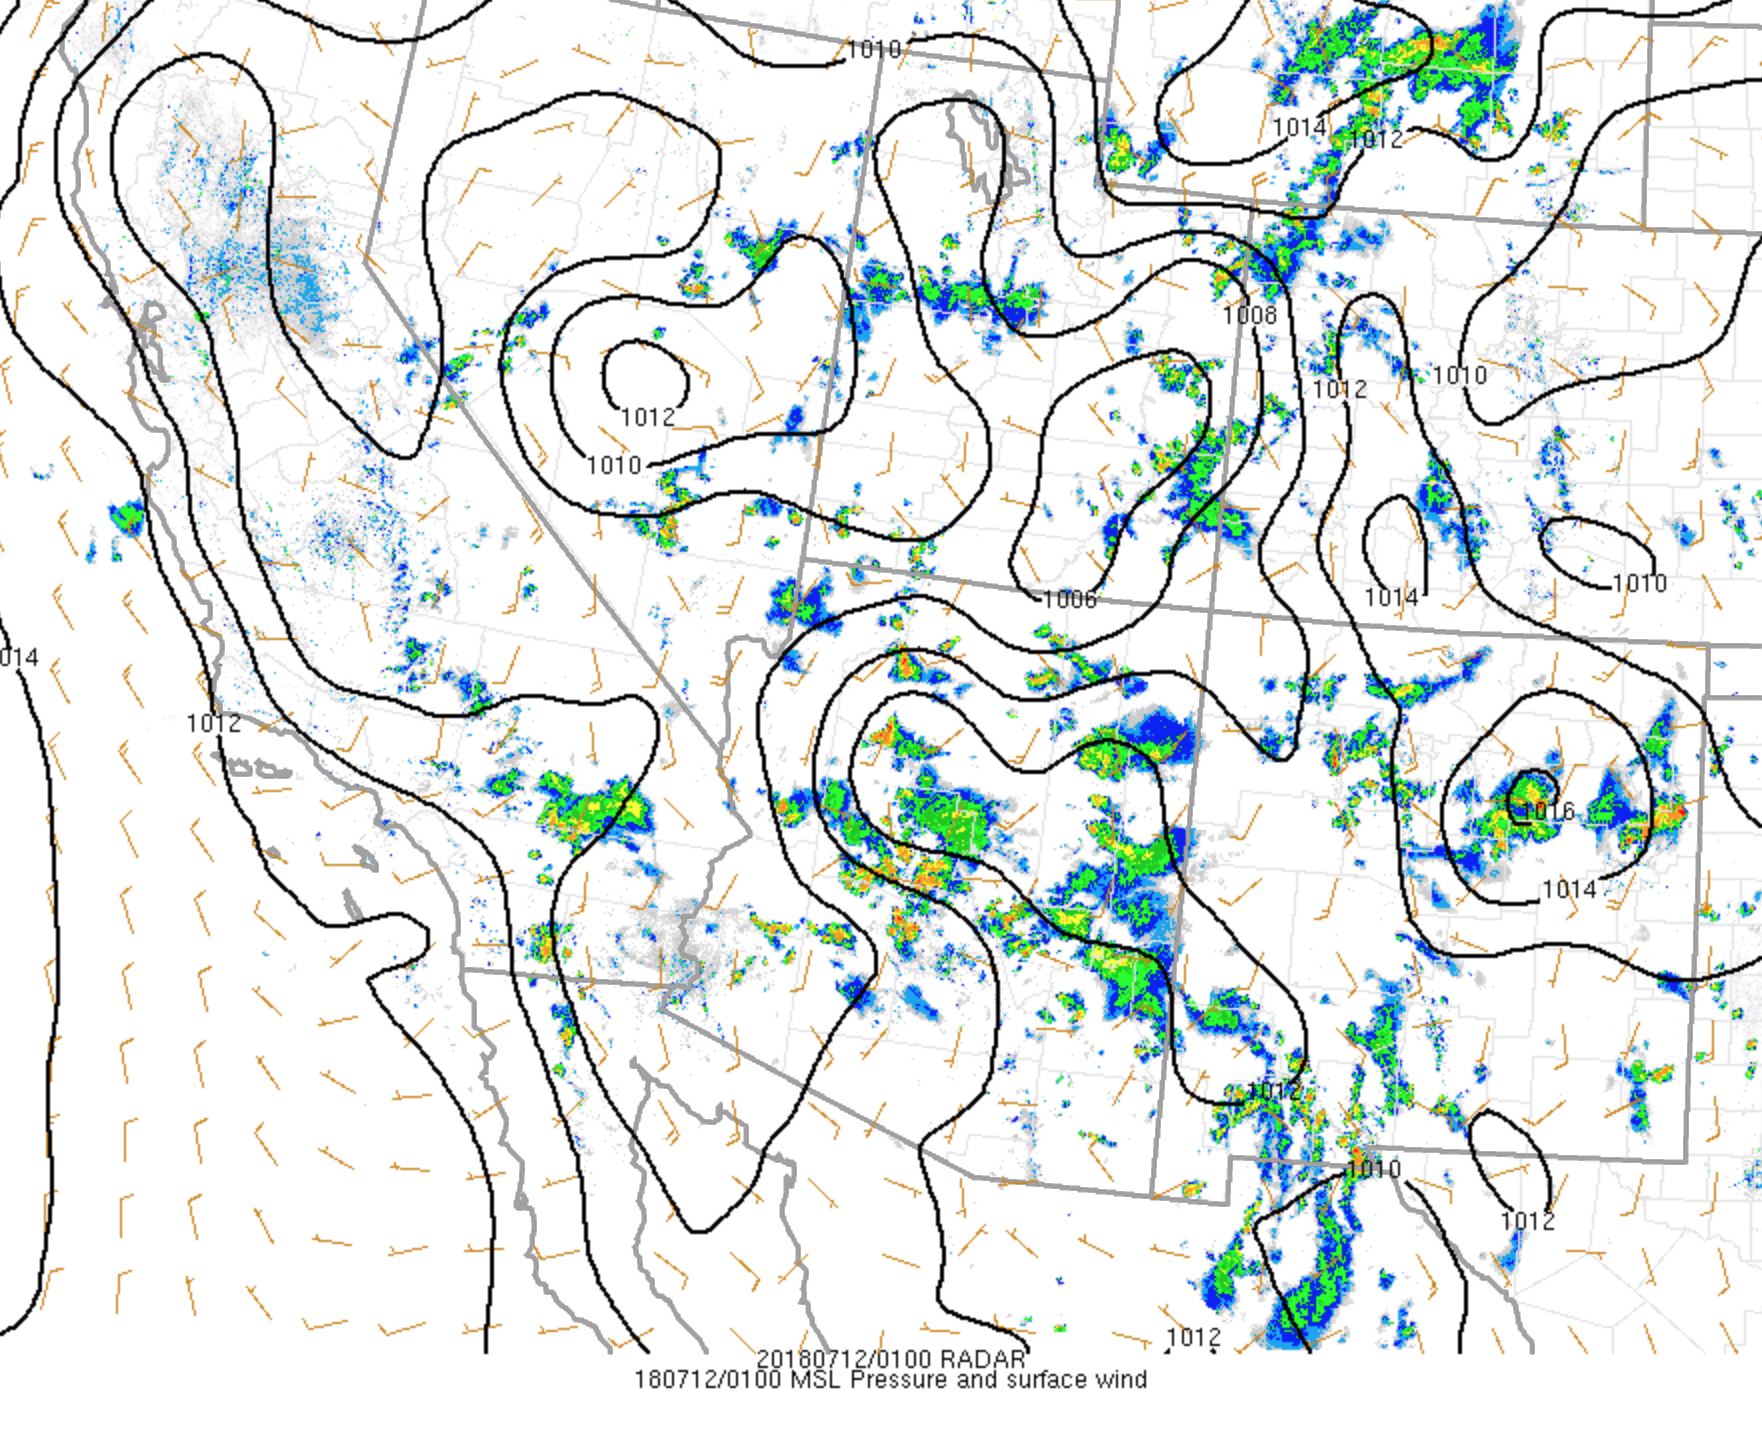
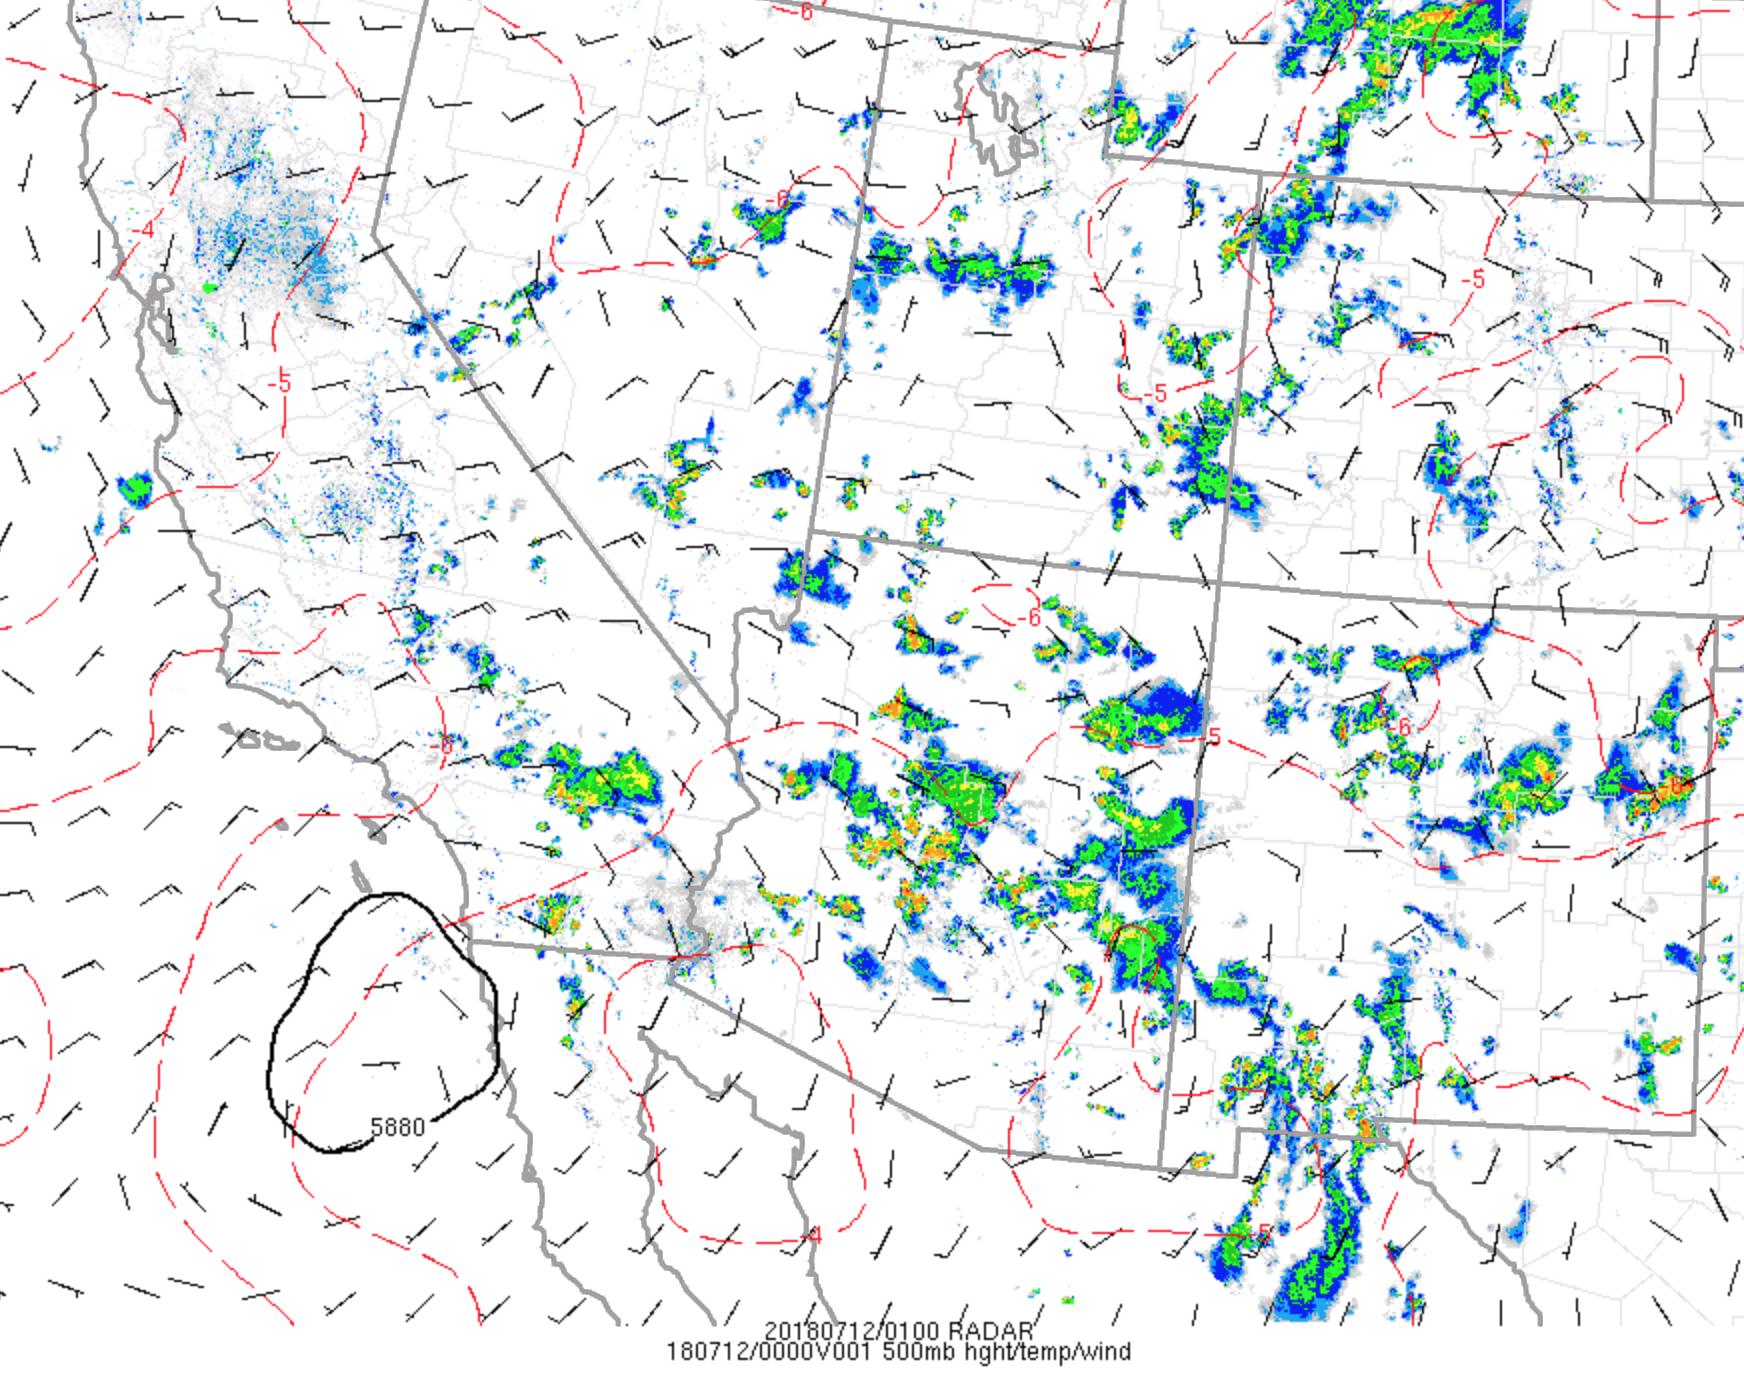
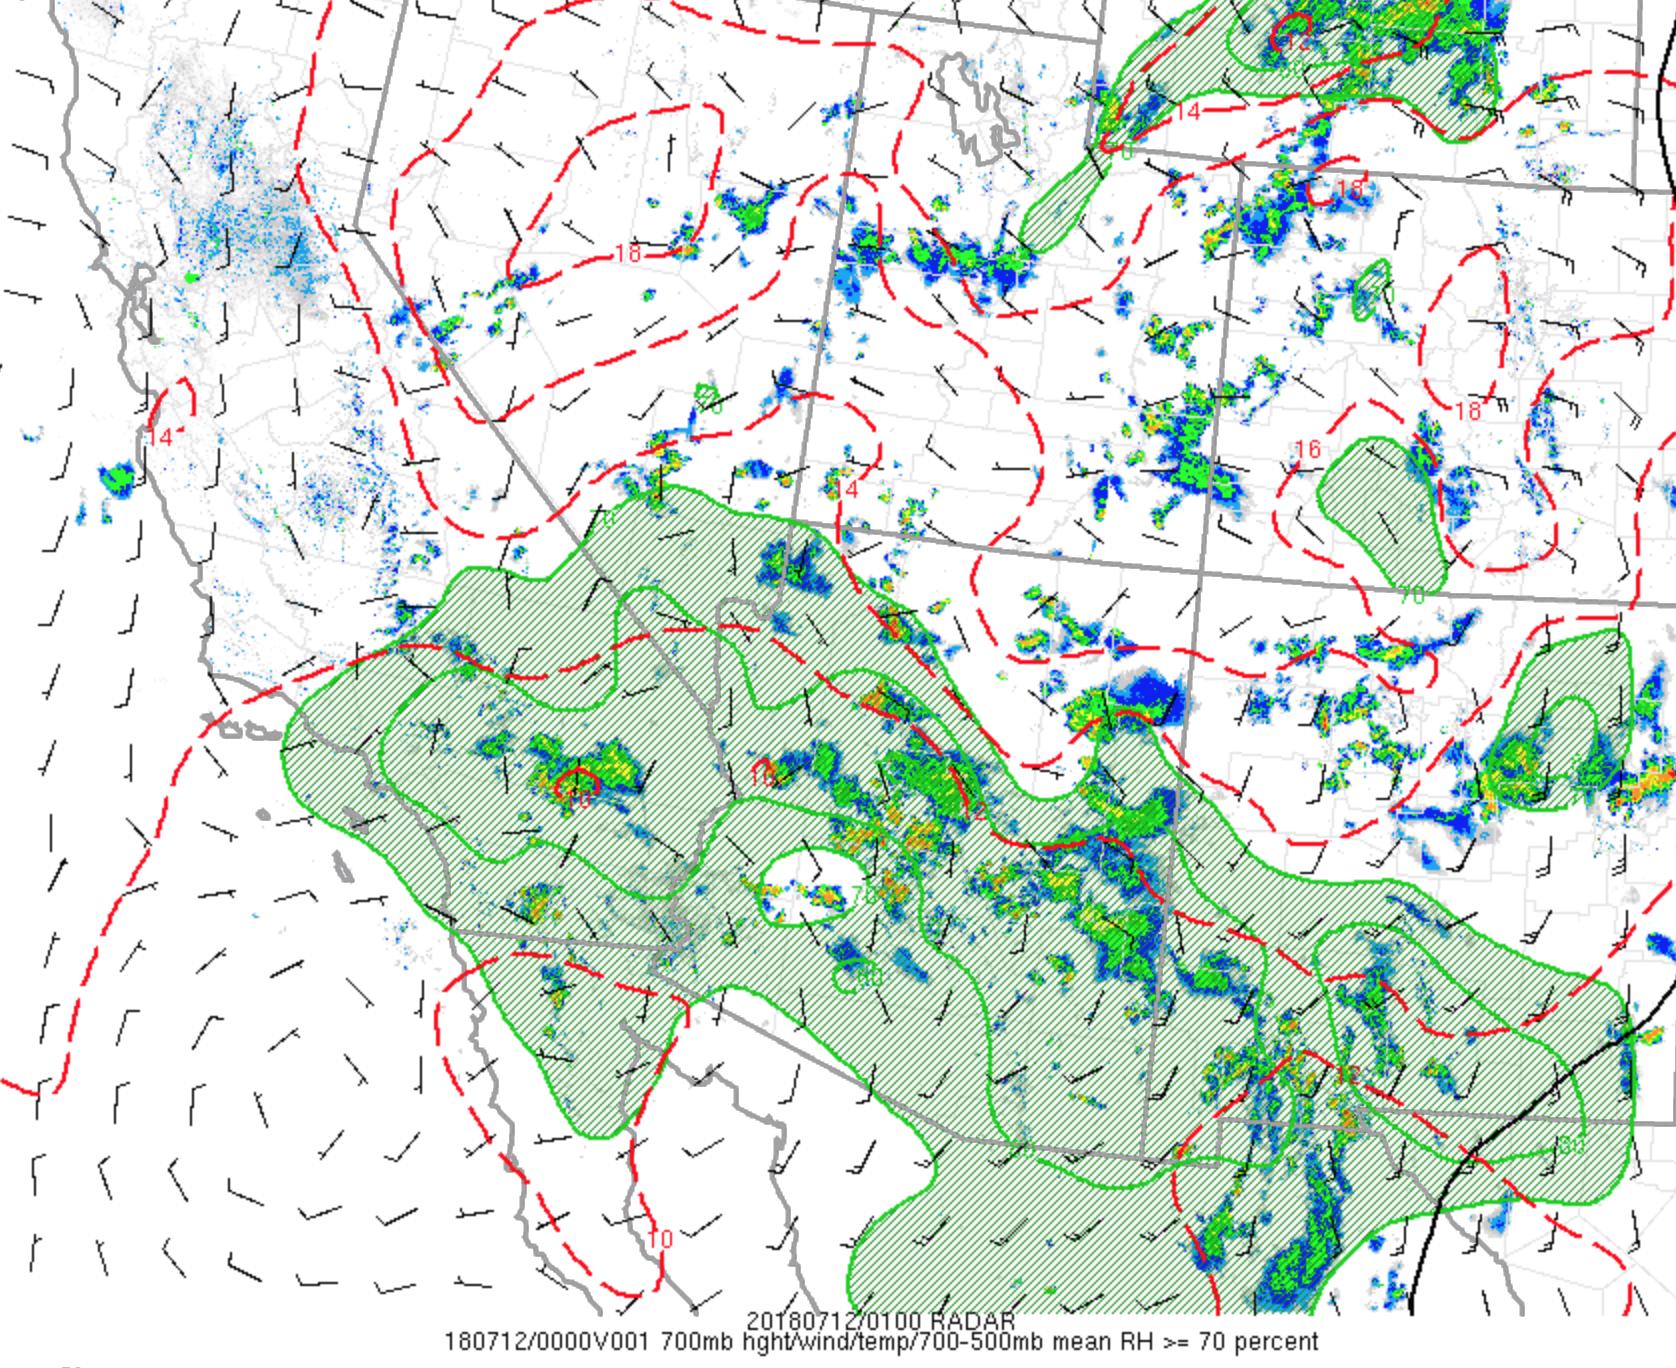
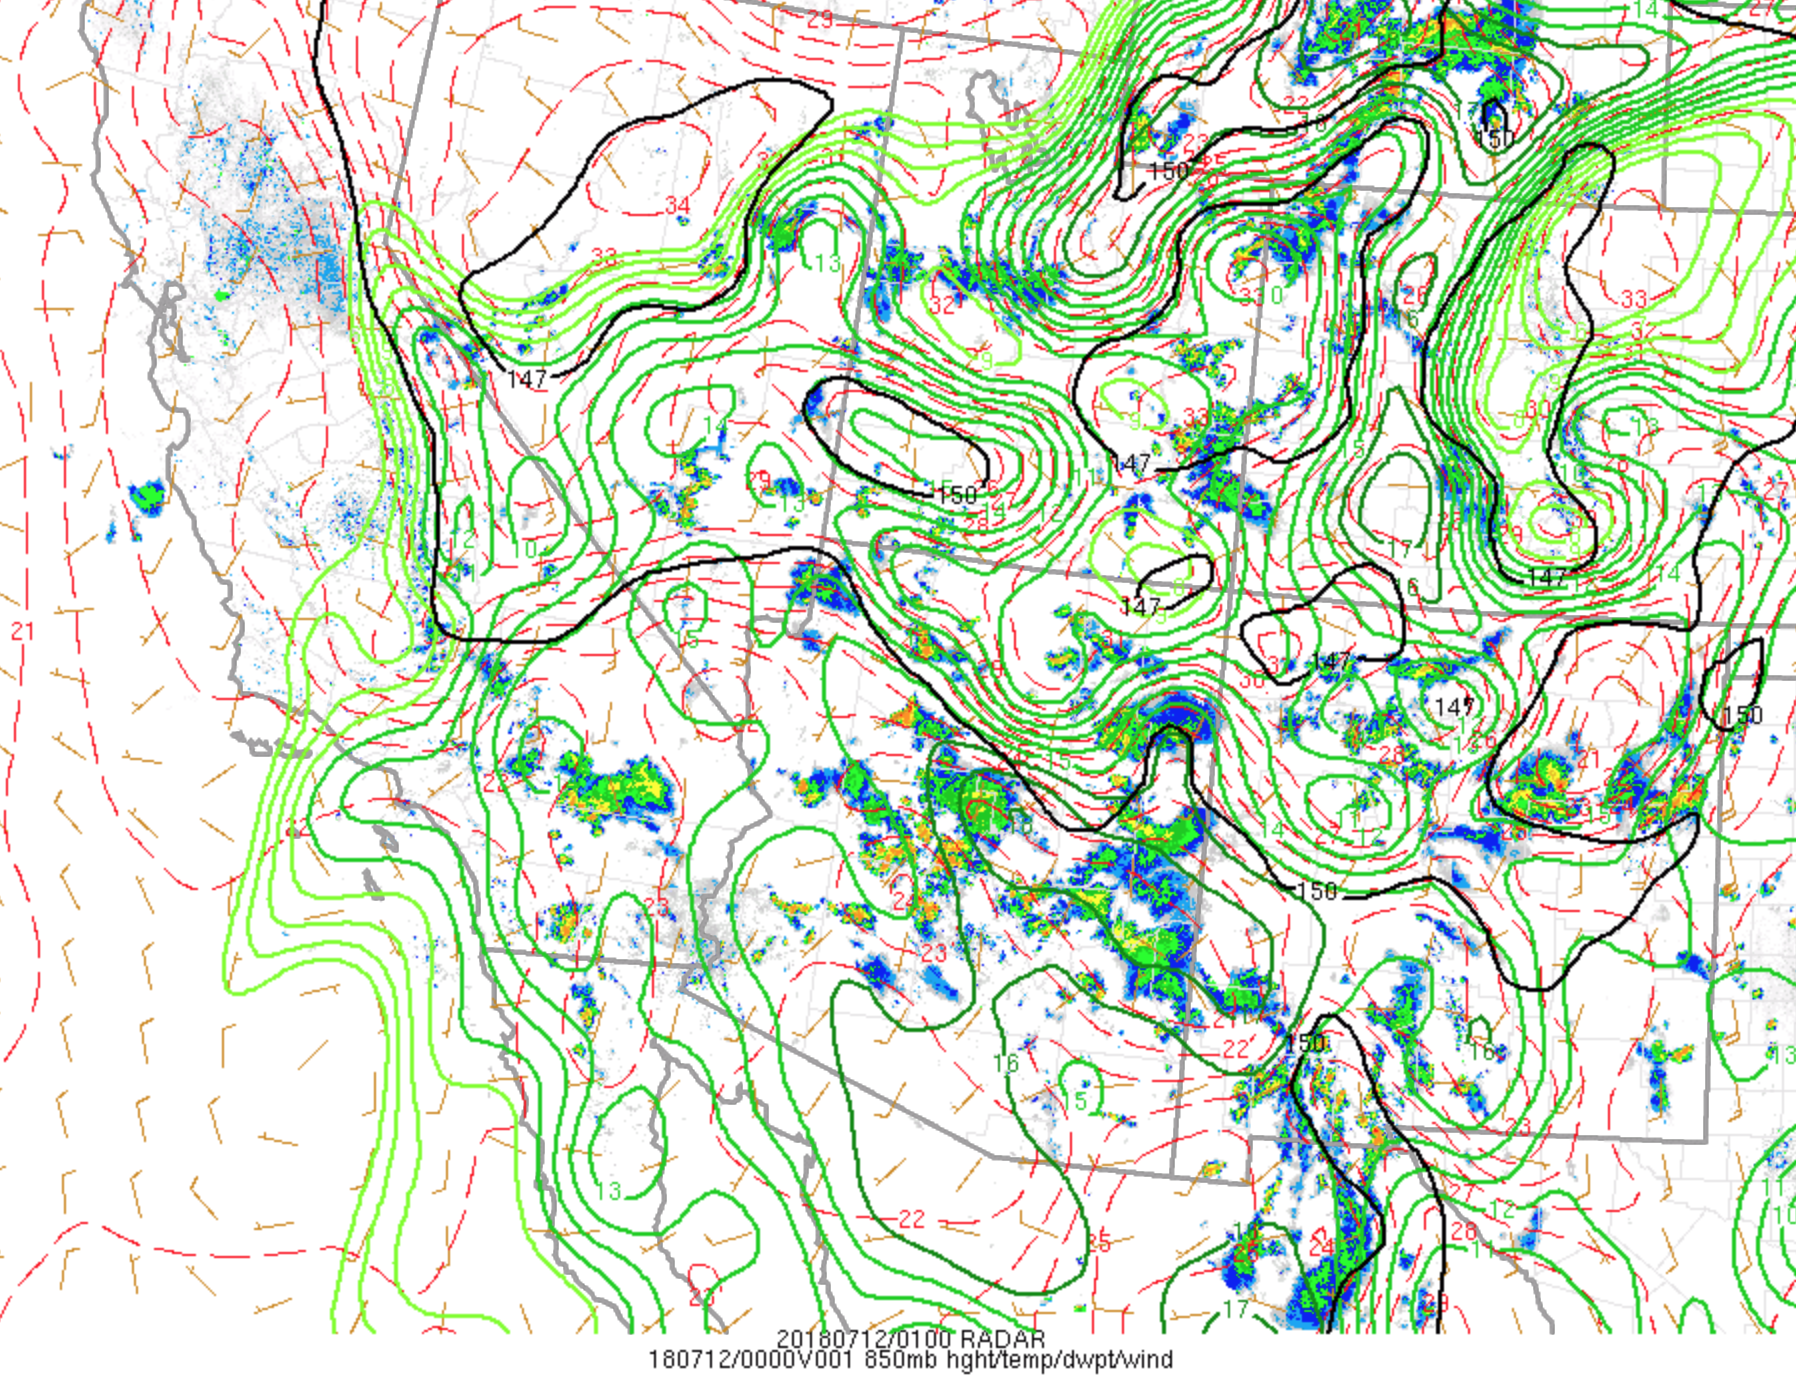
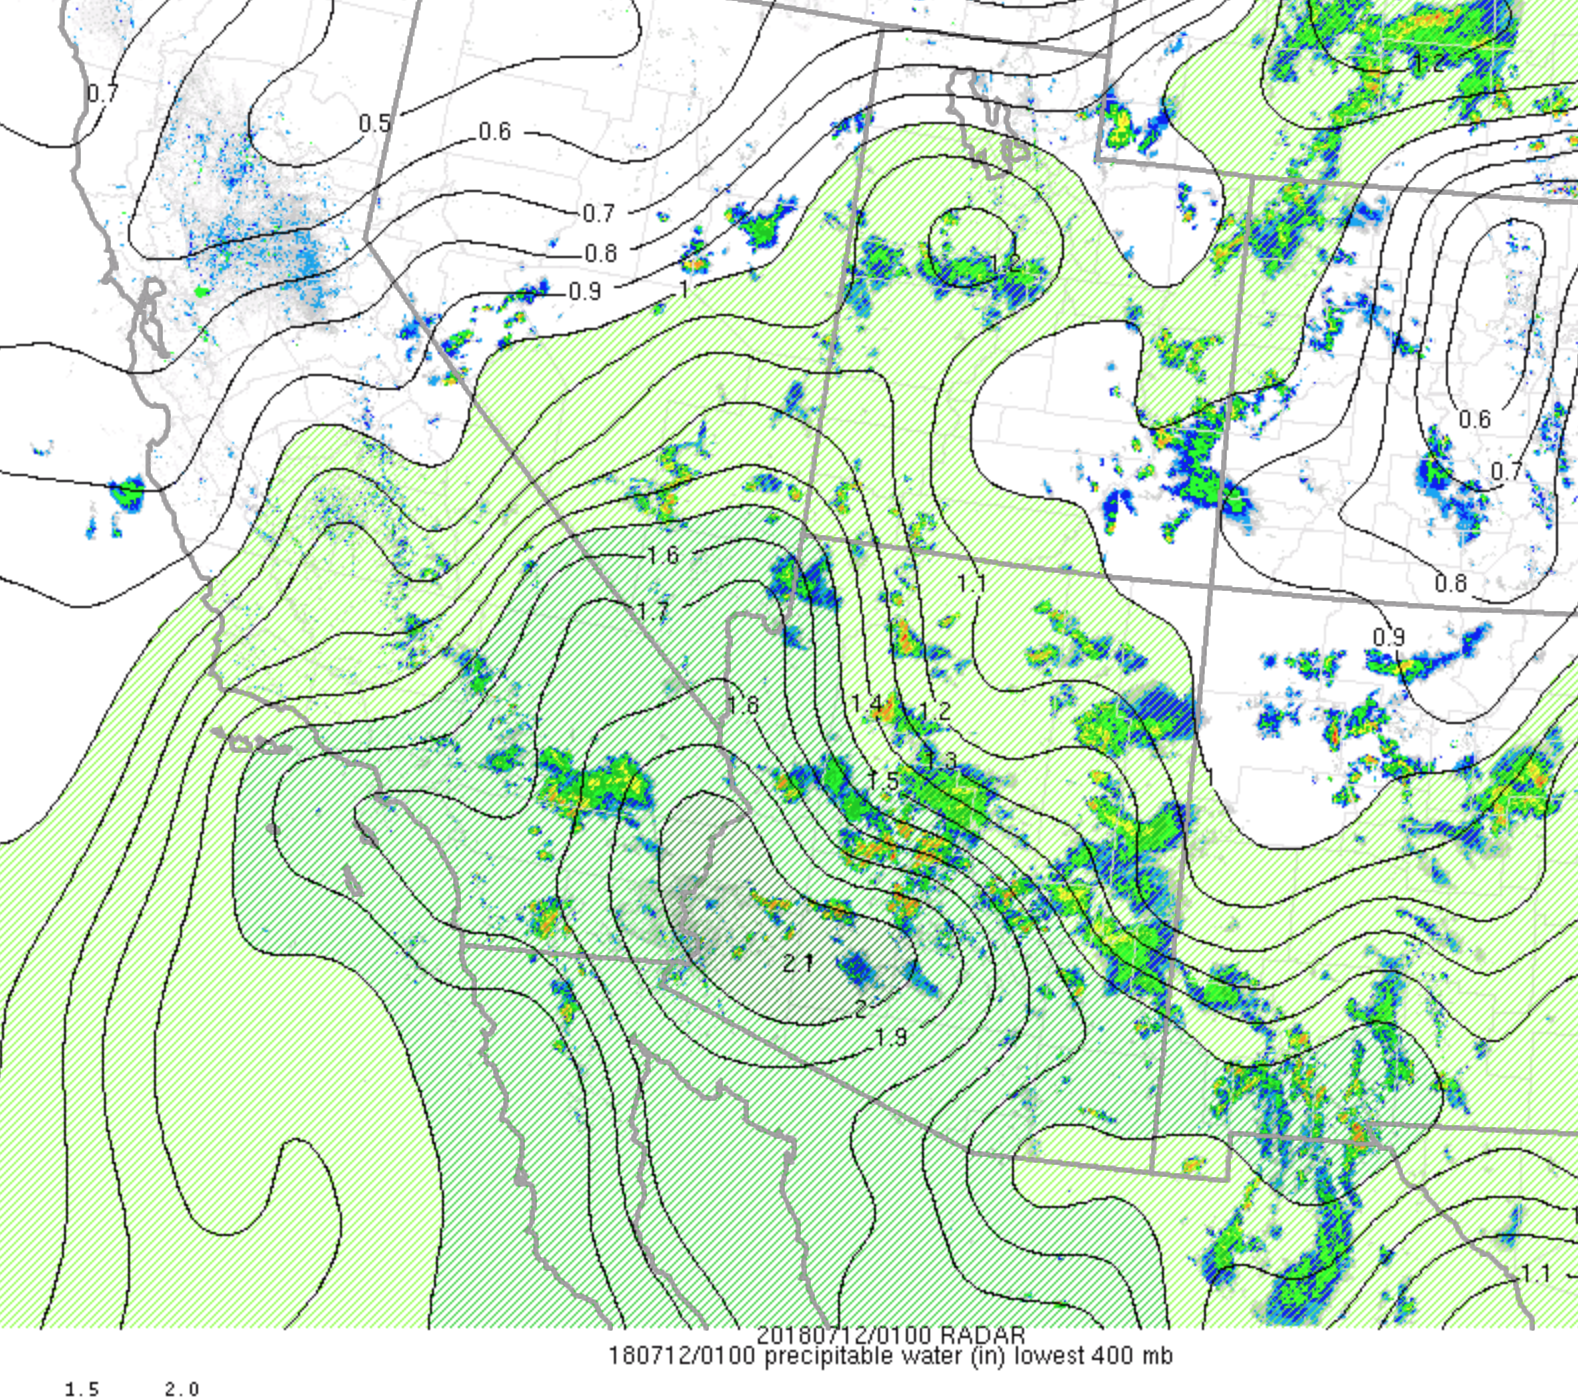
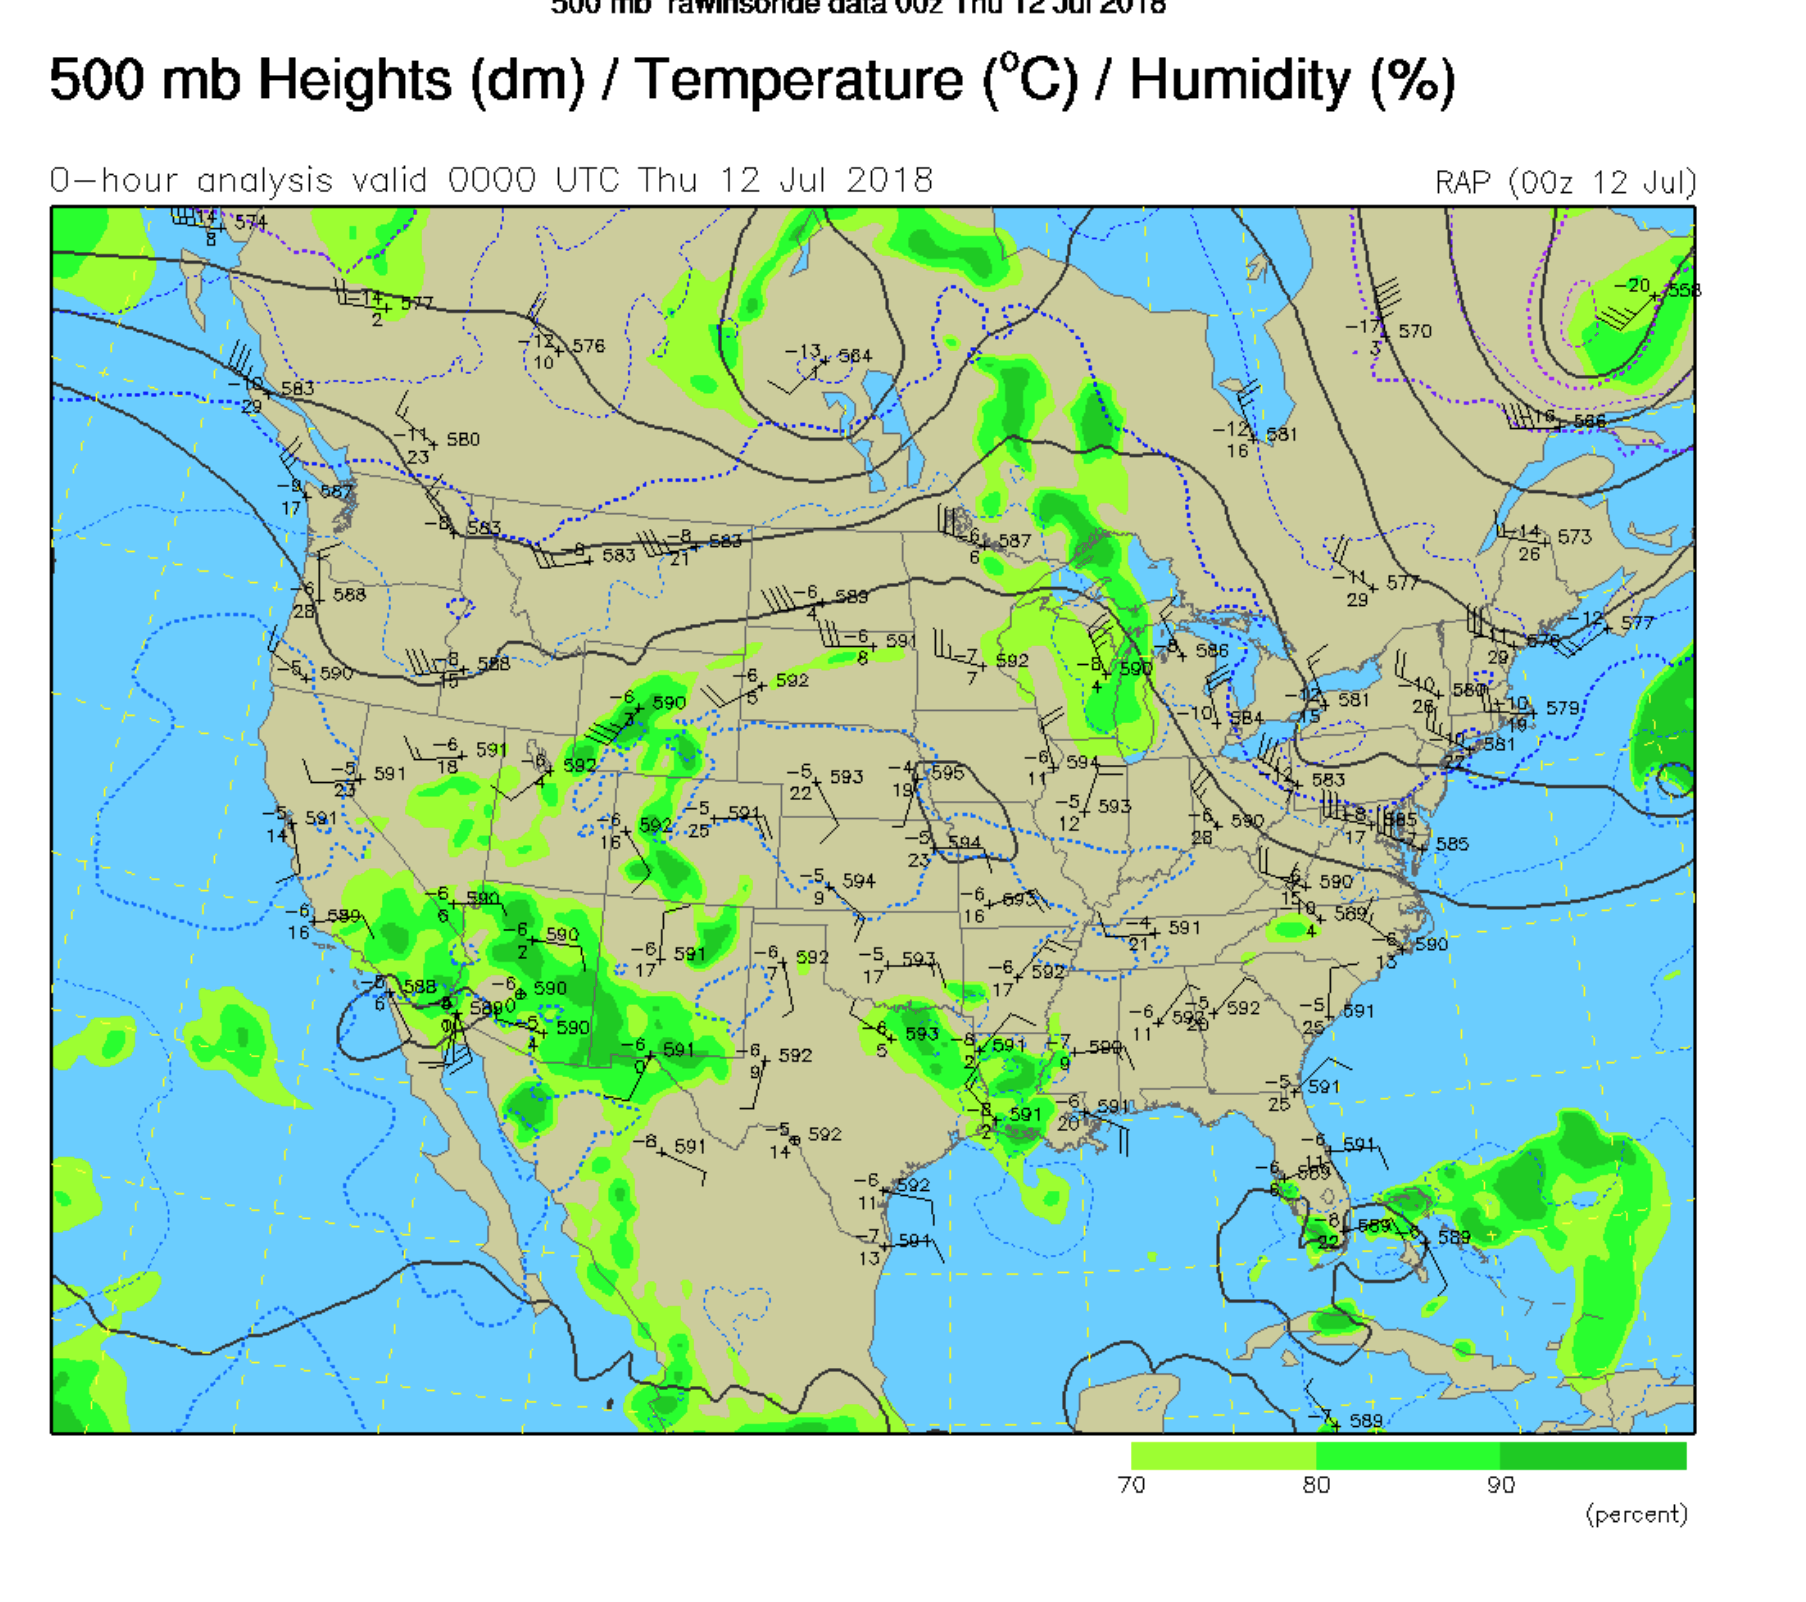
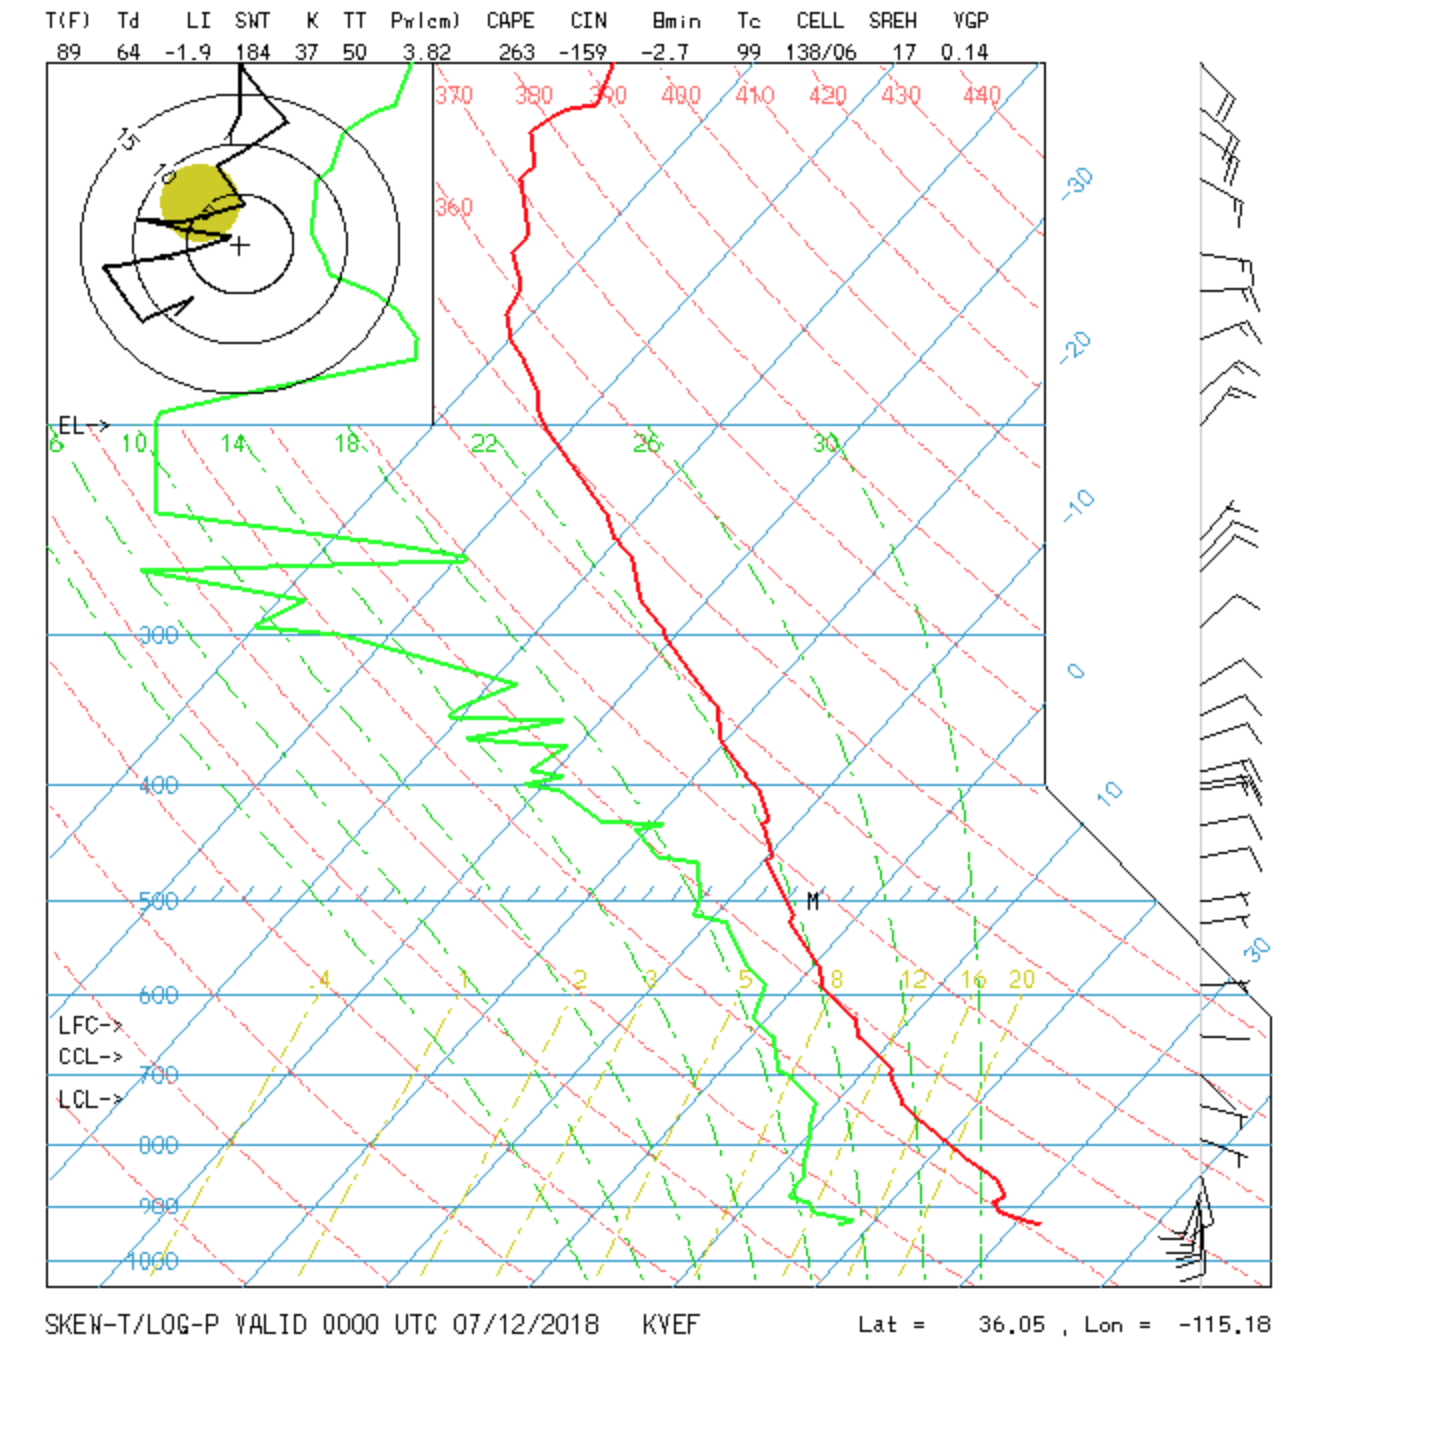
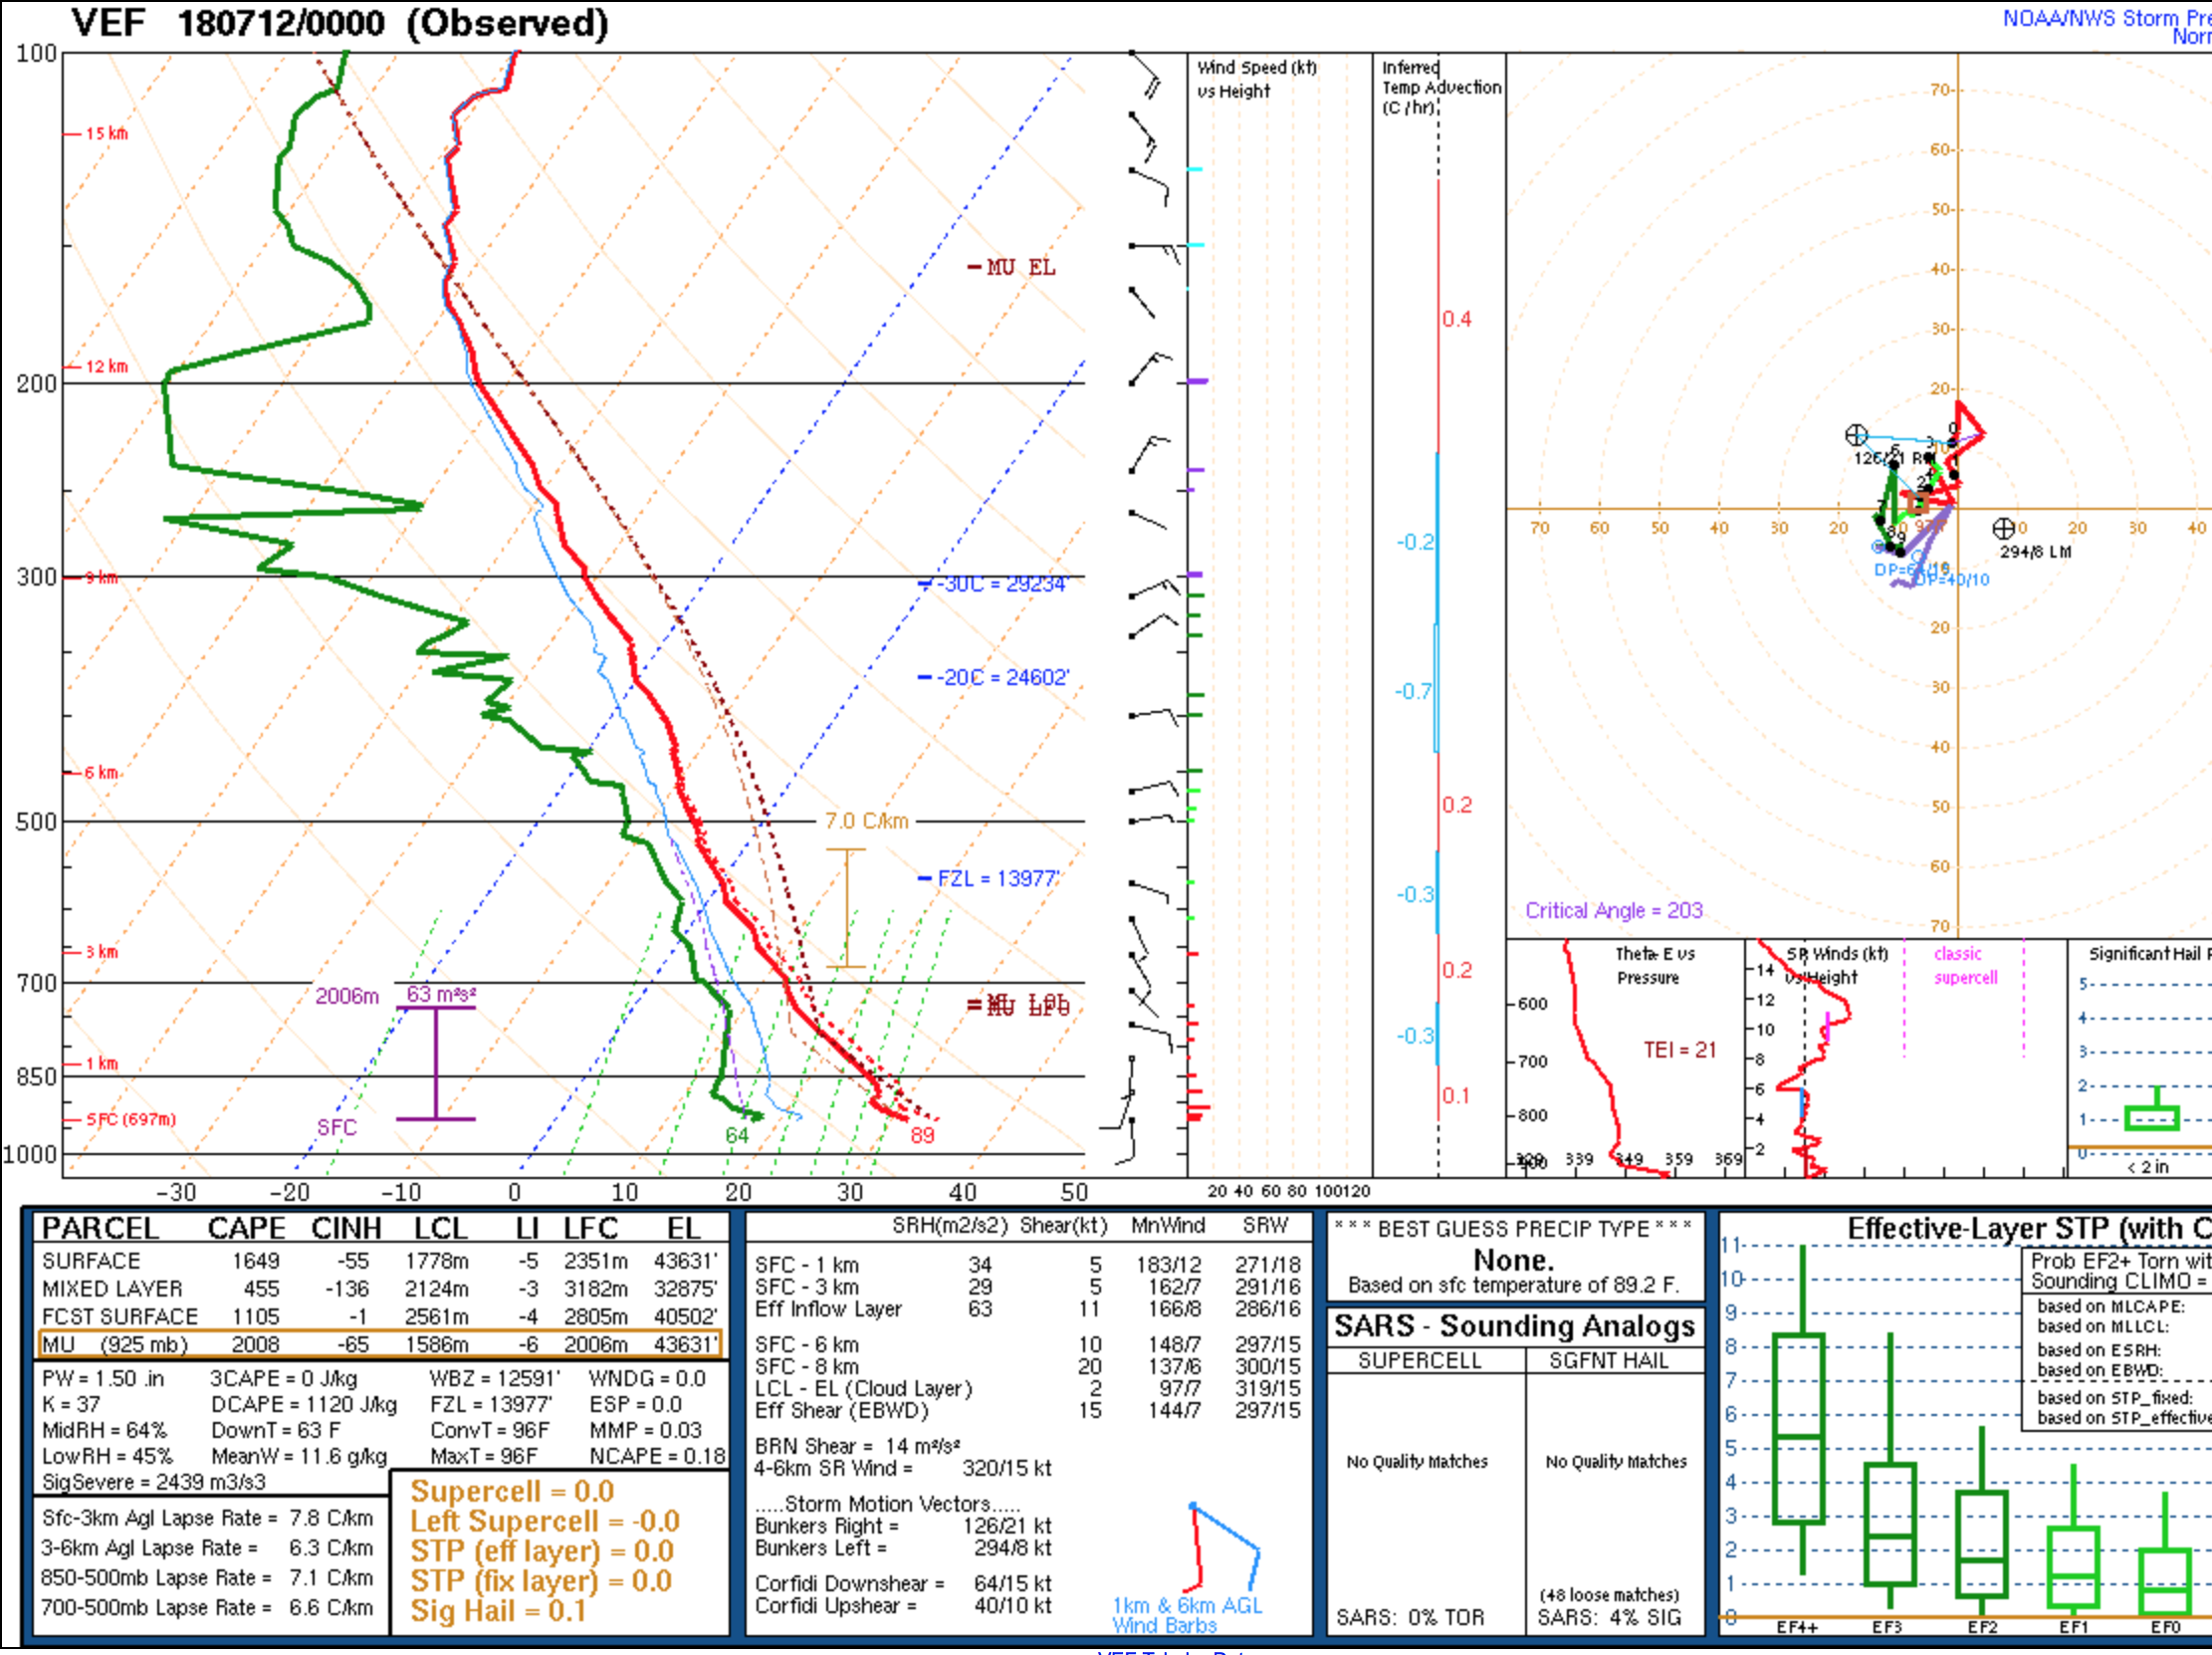
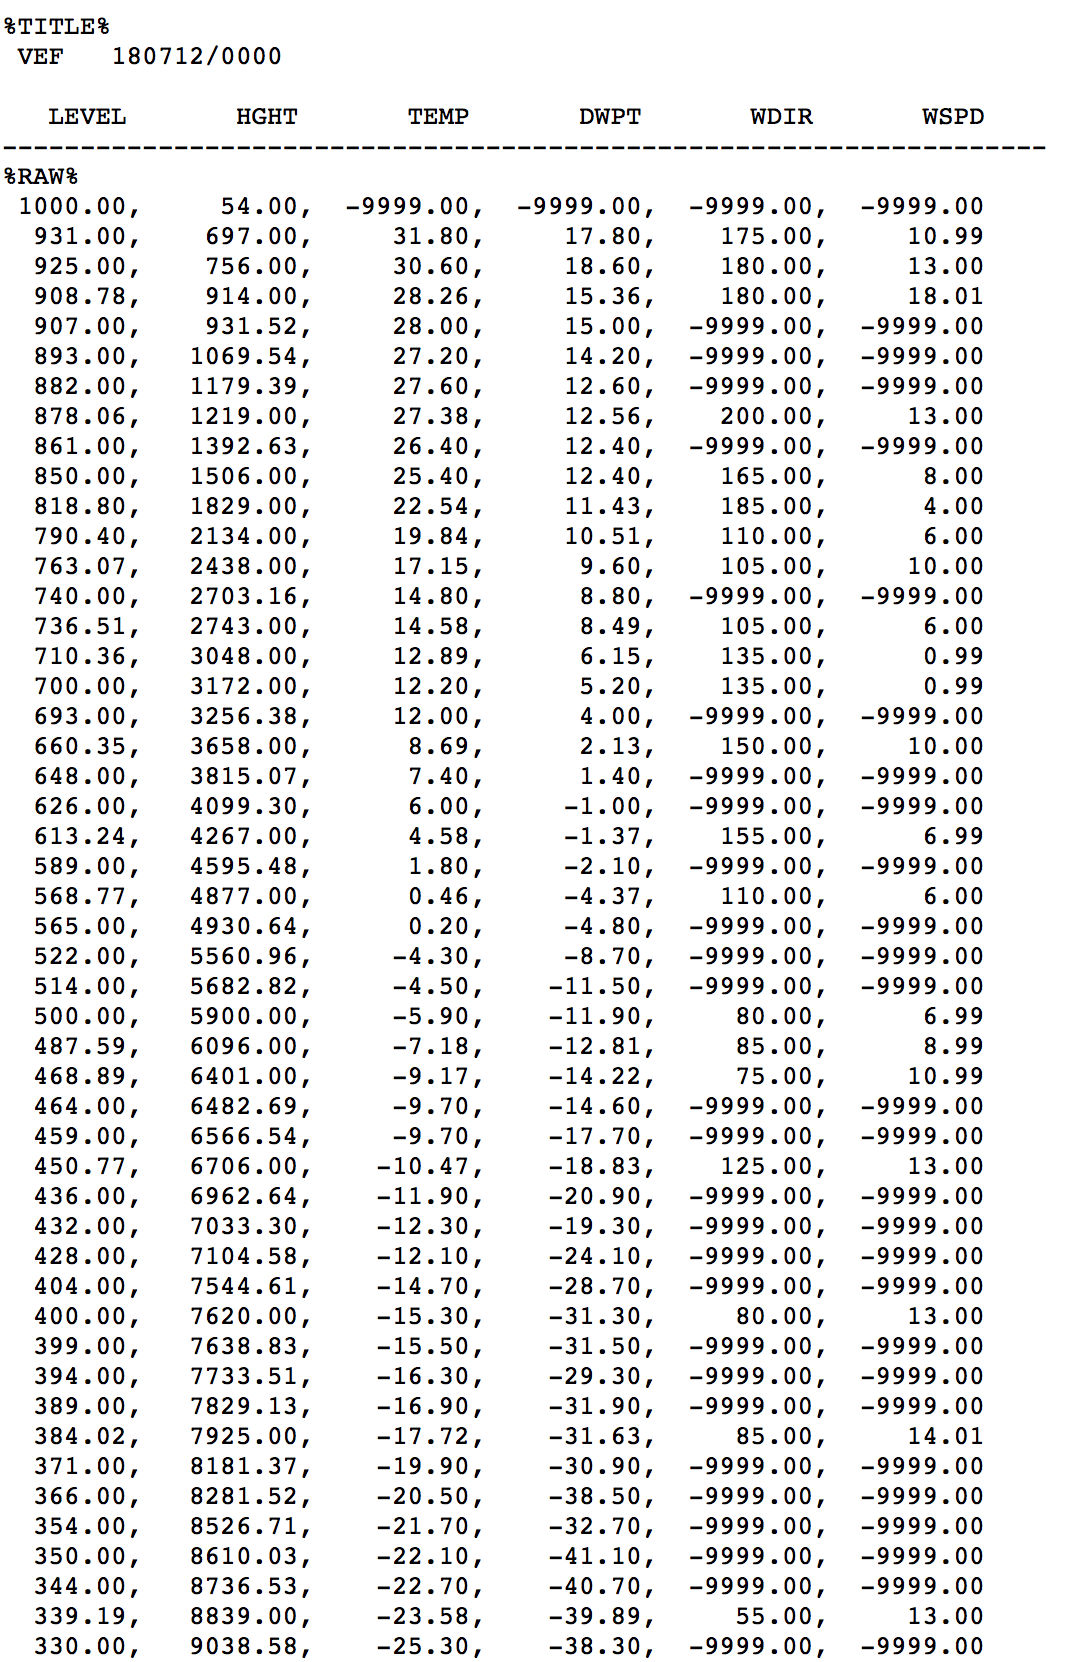
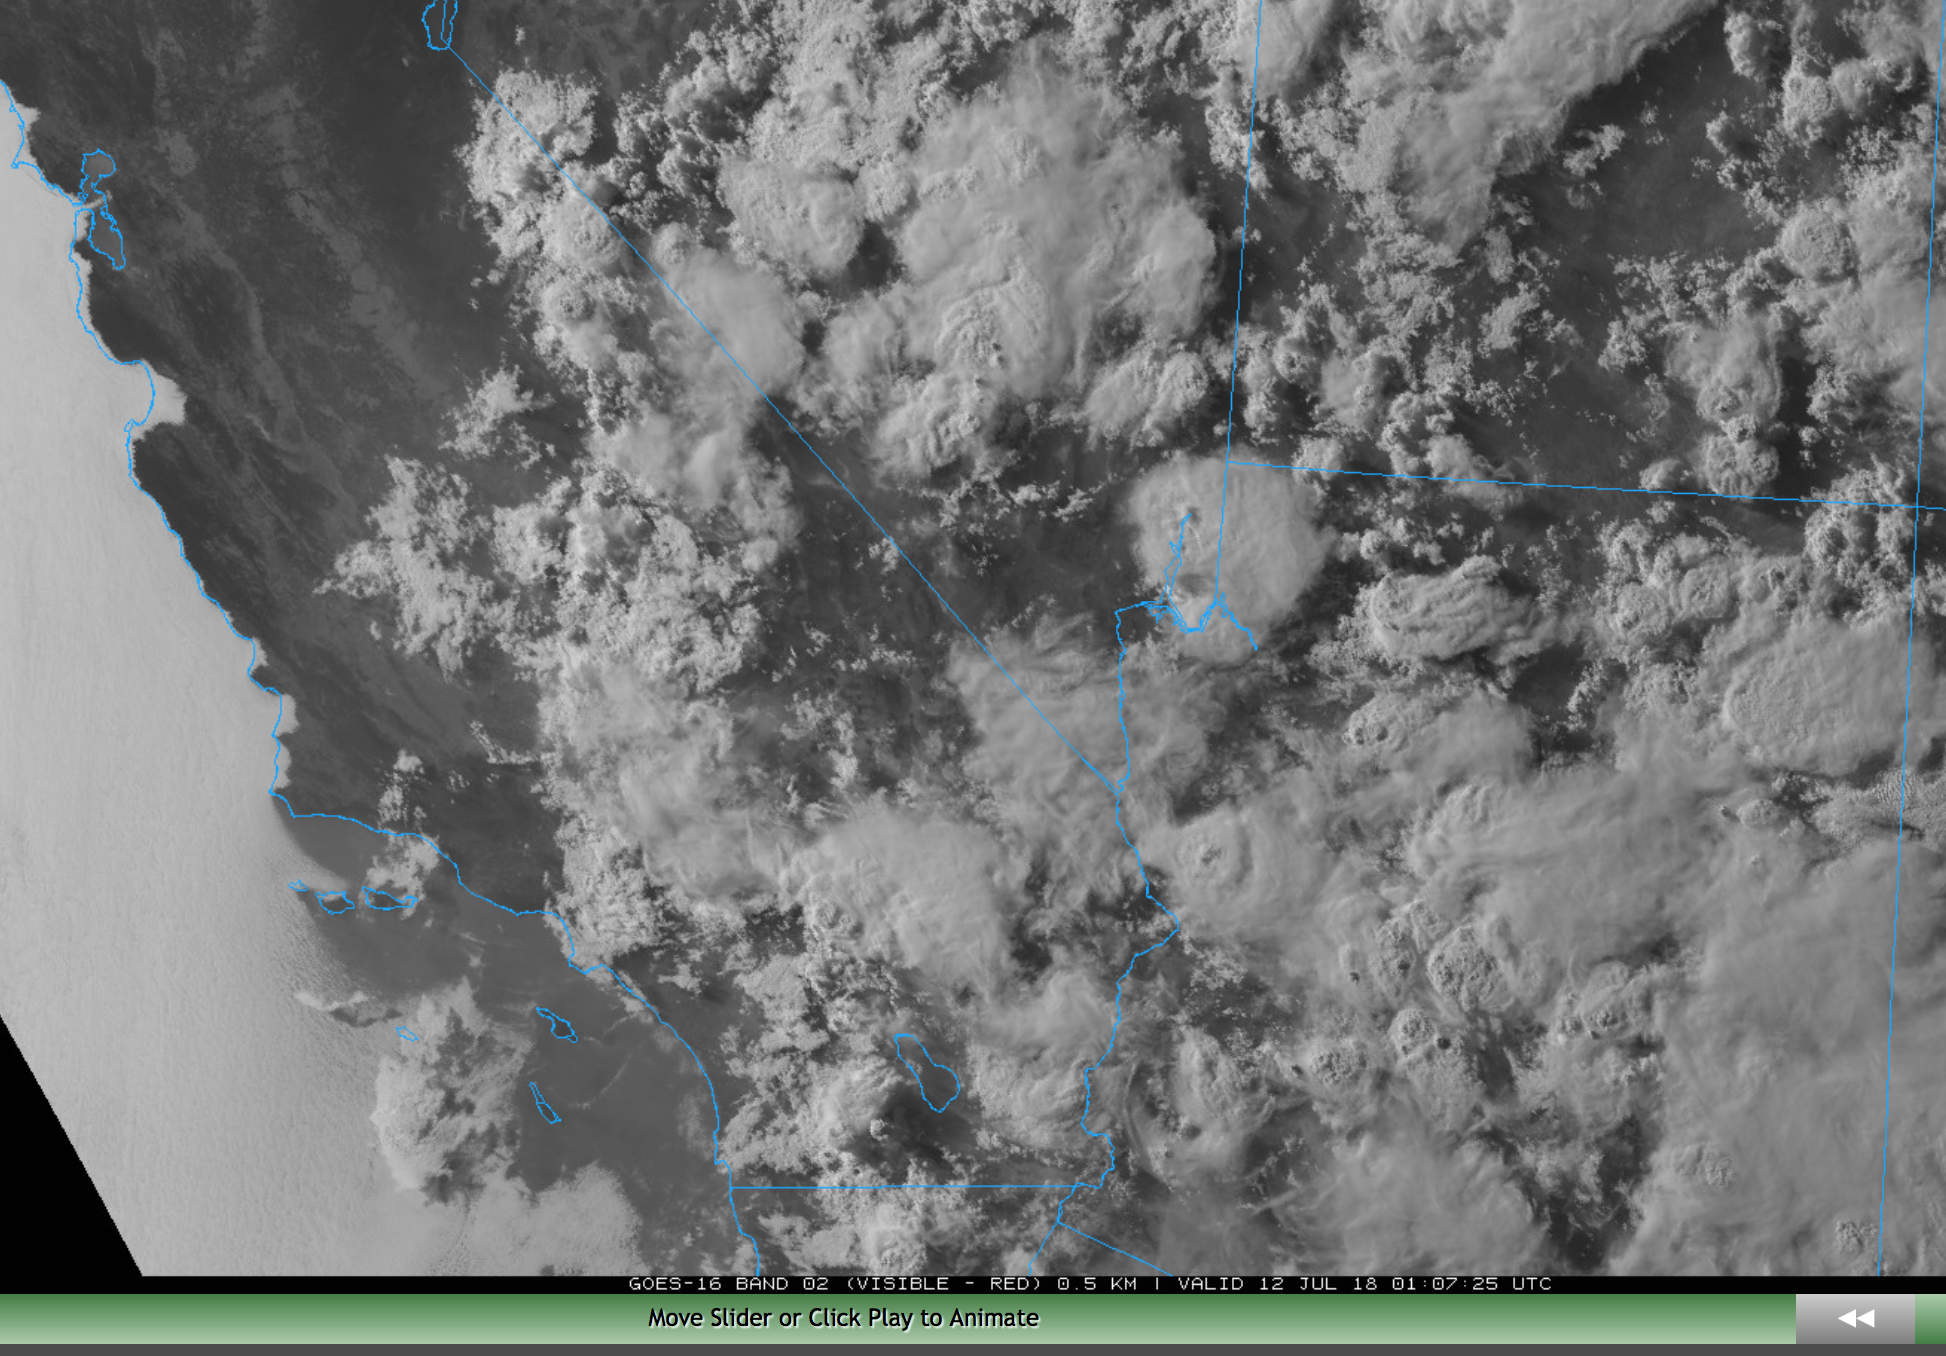
July 12
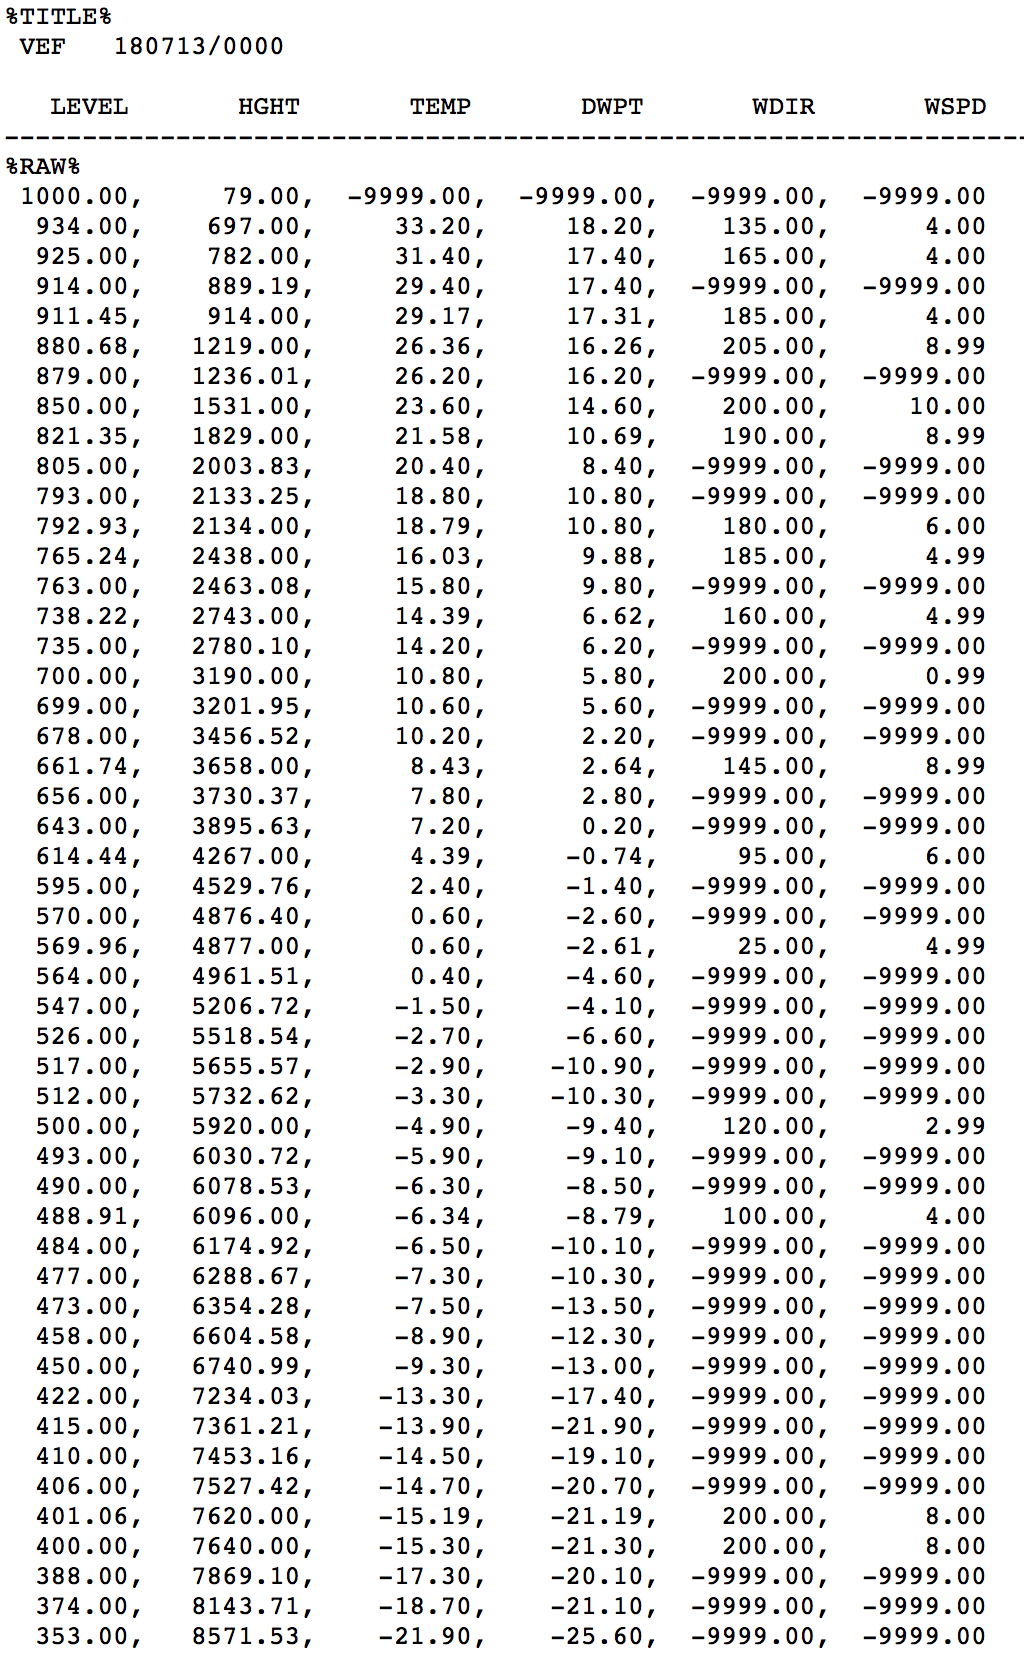
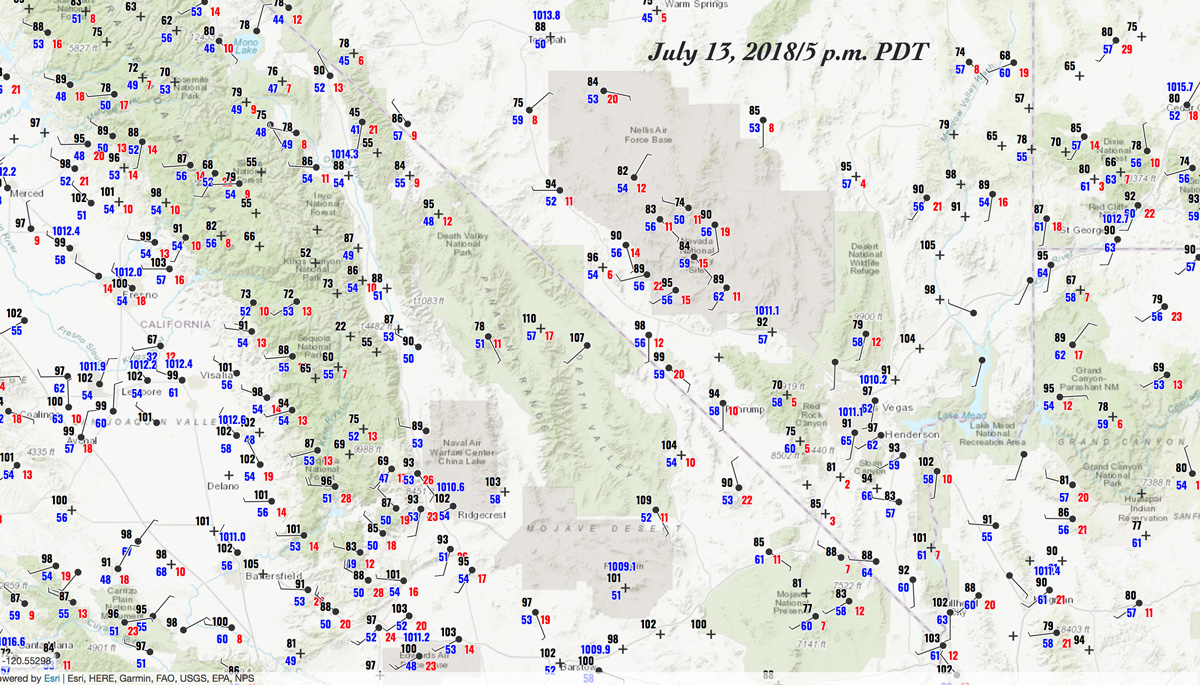
July 13
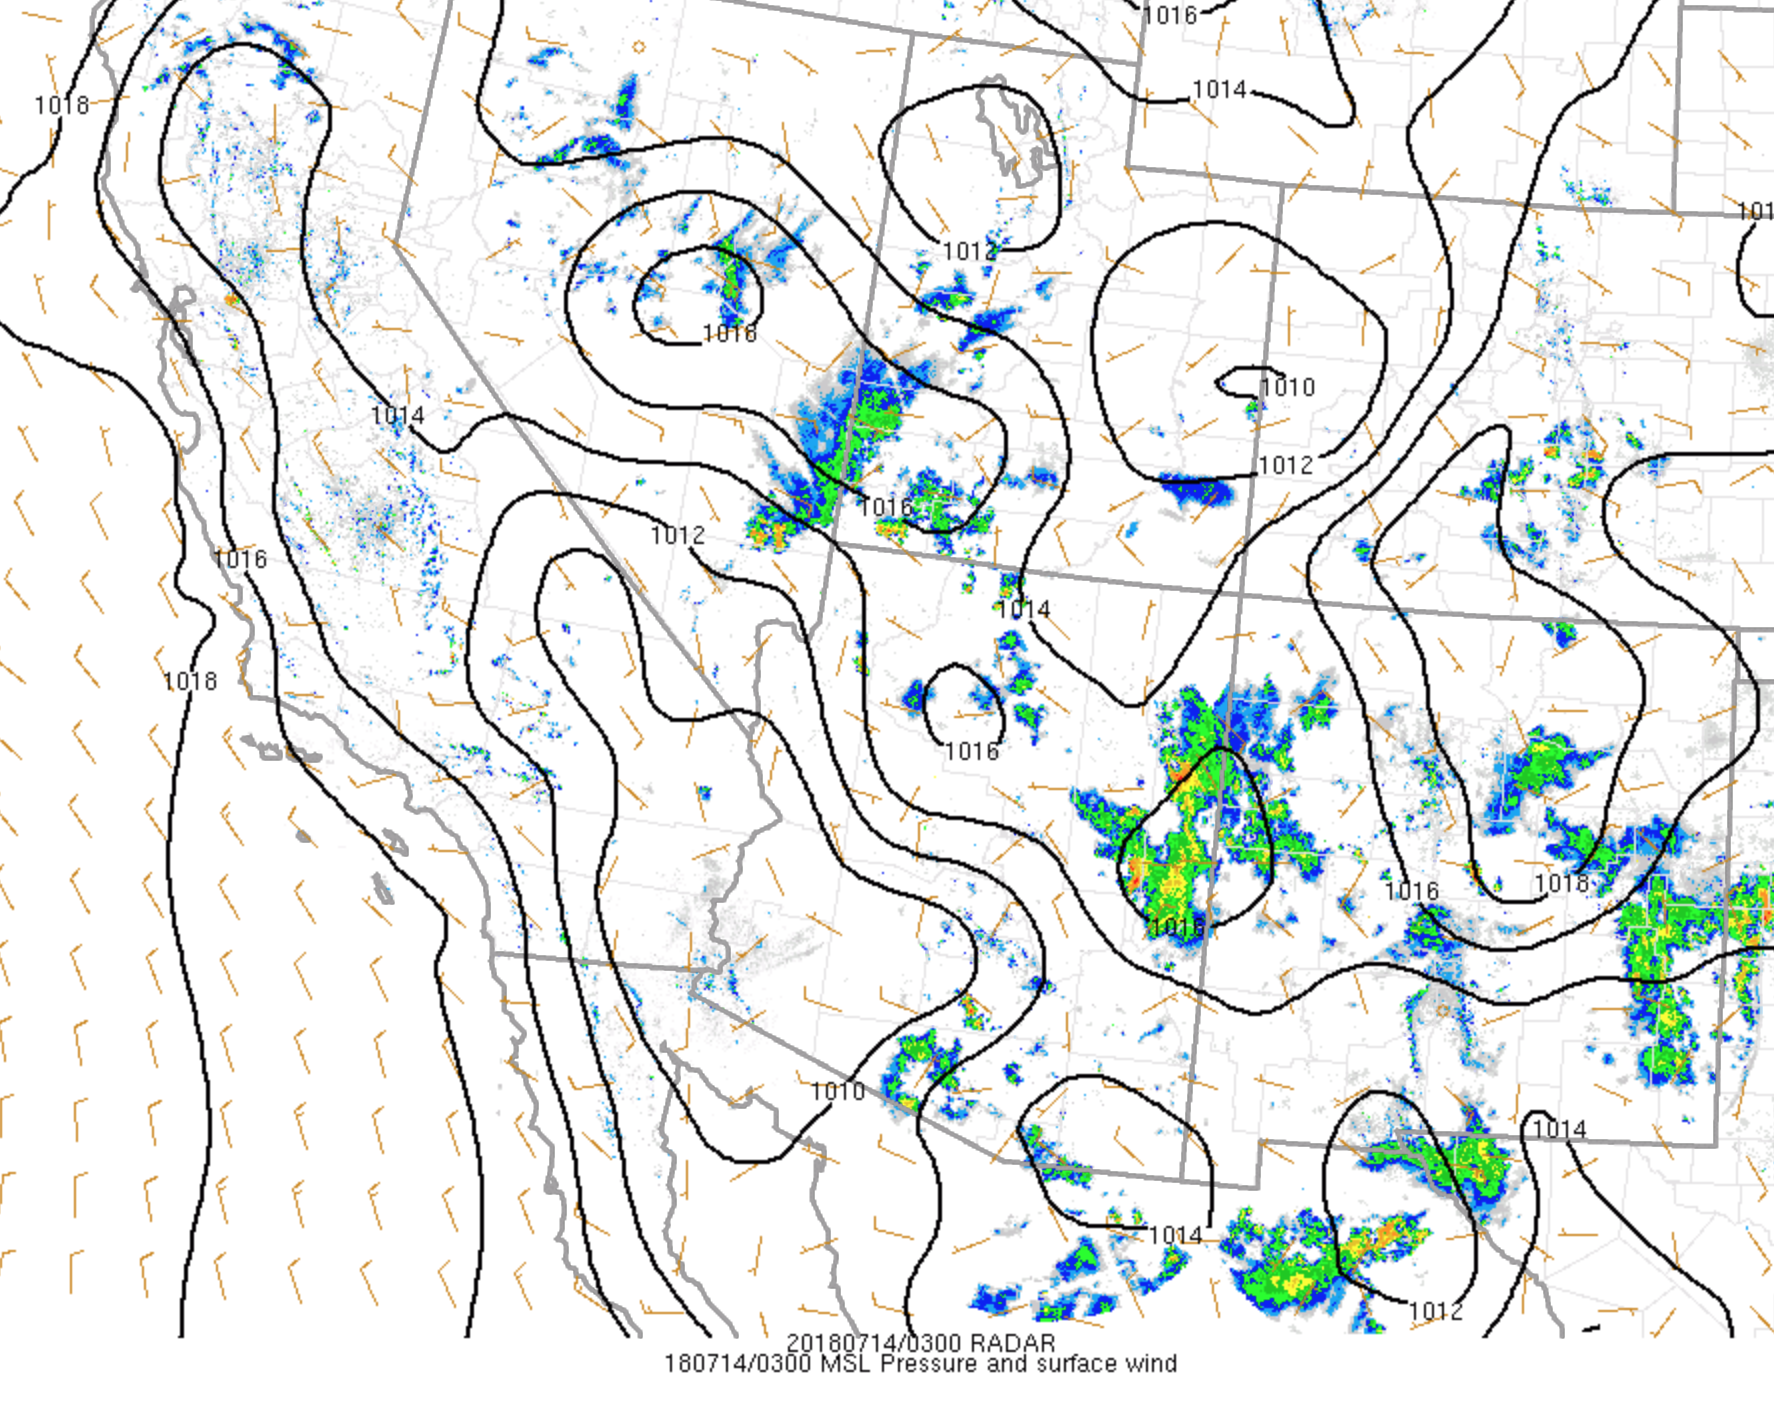
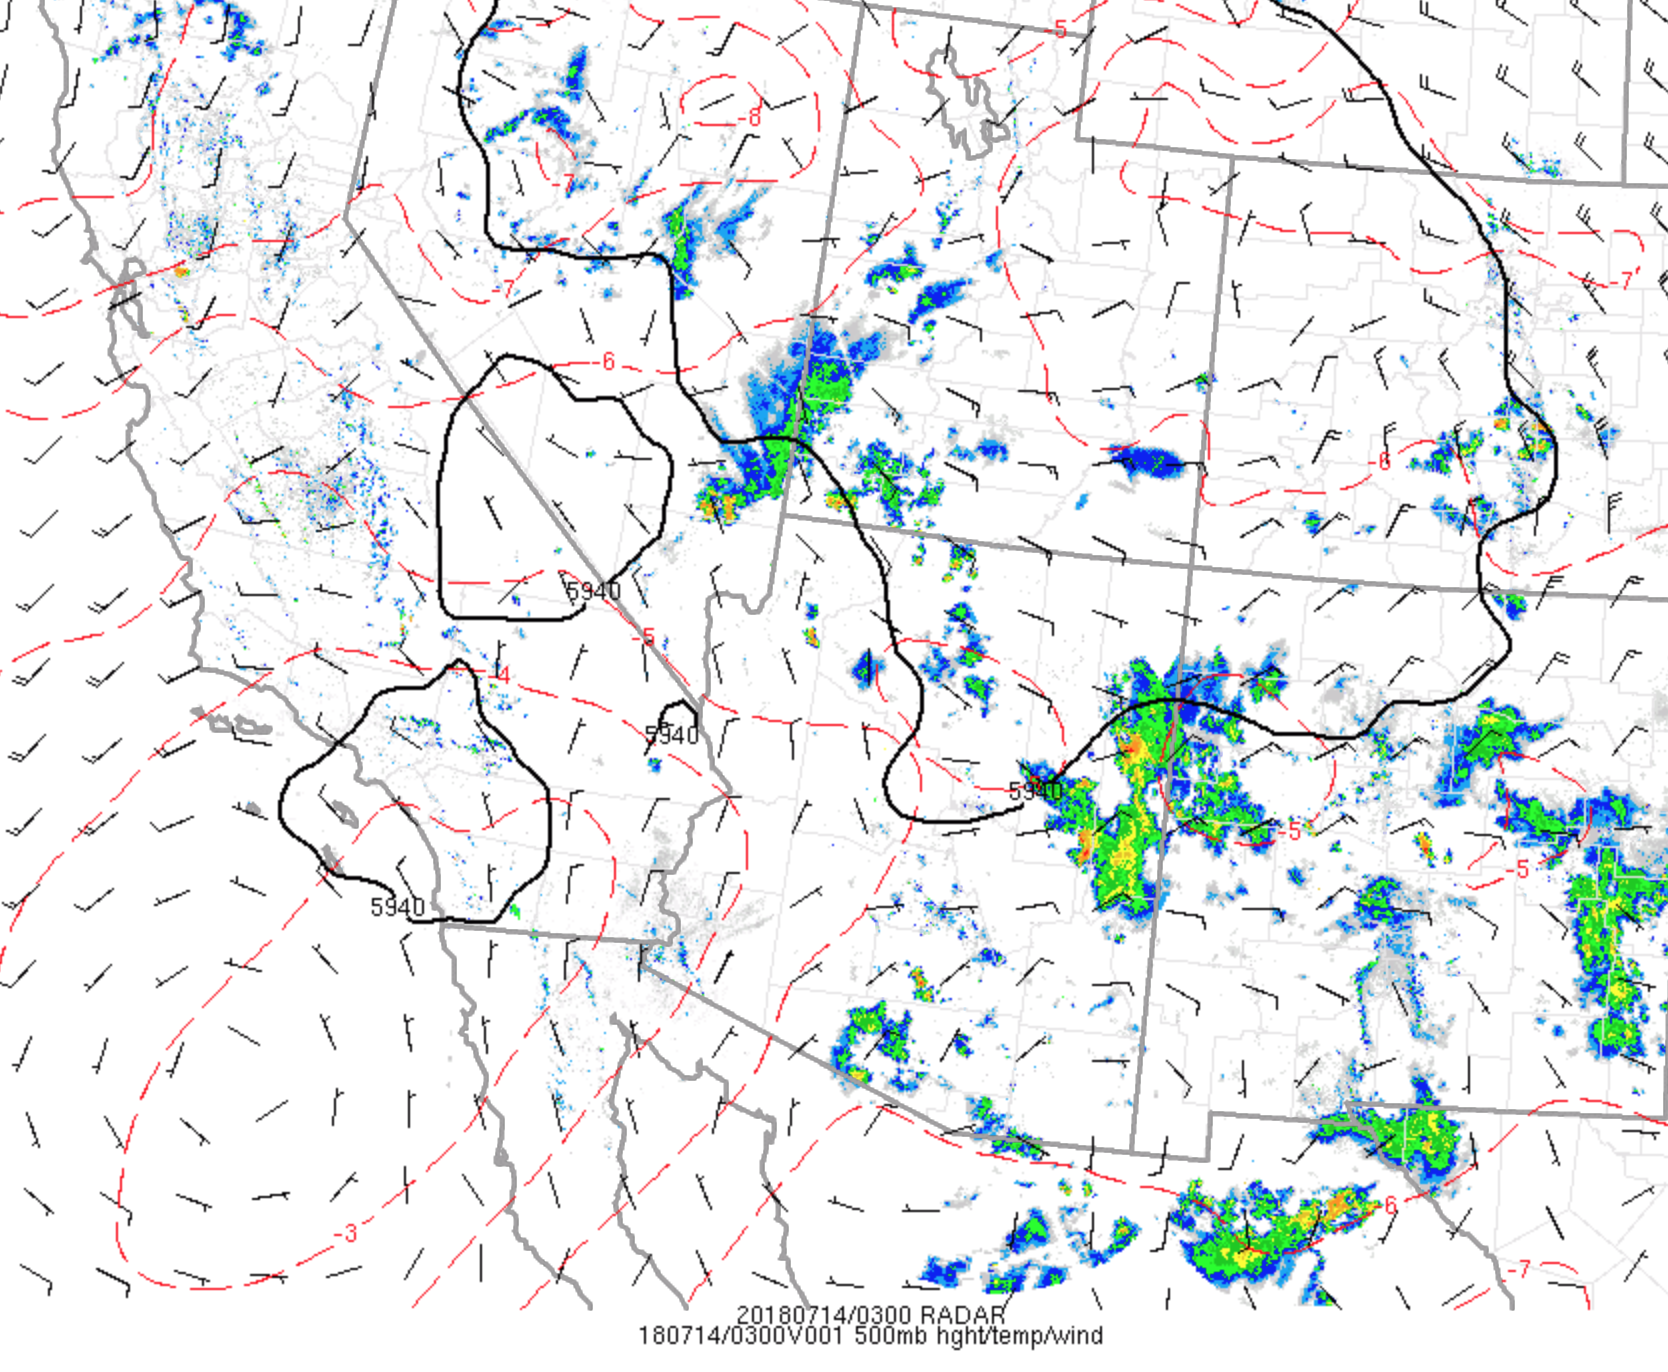
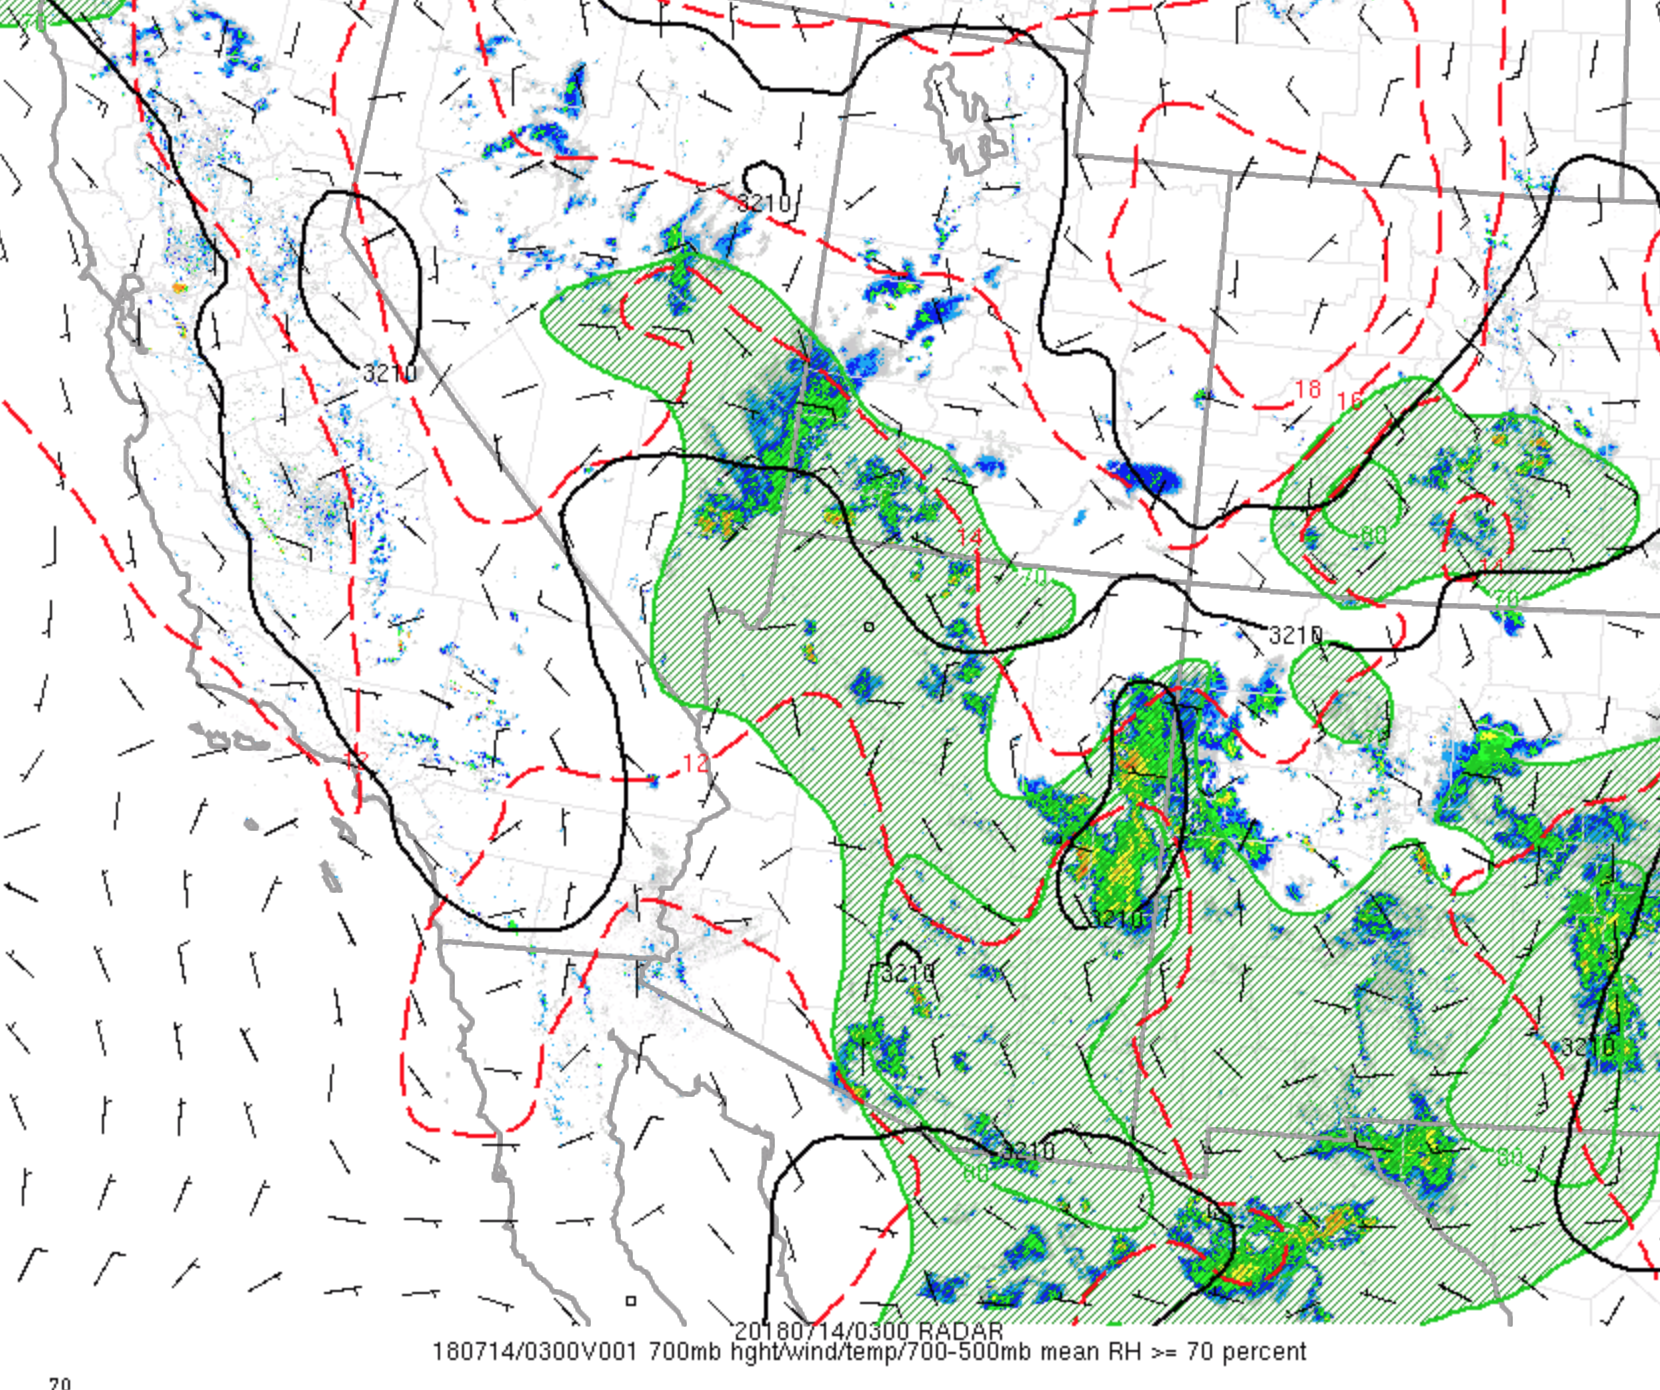
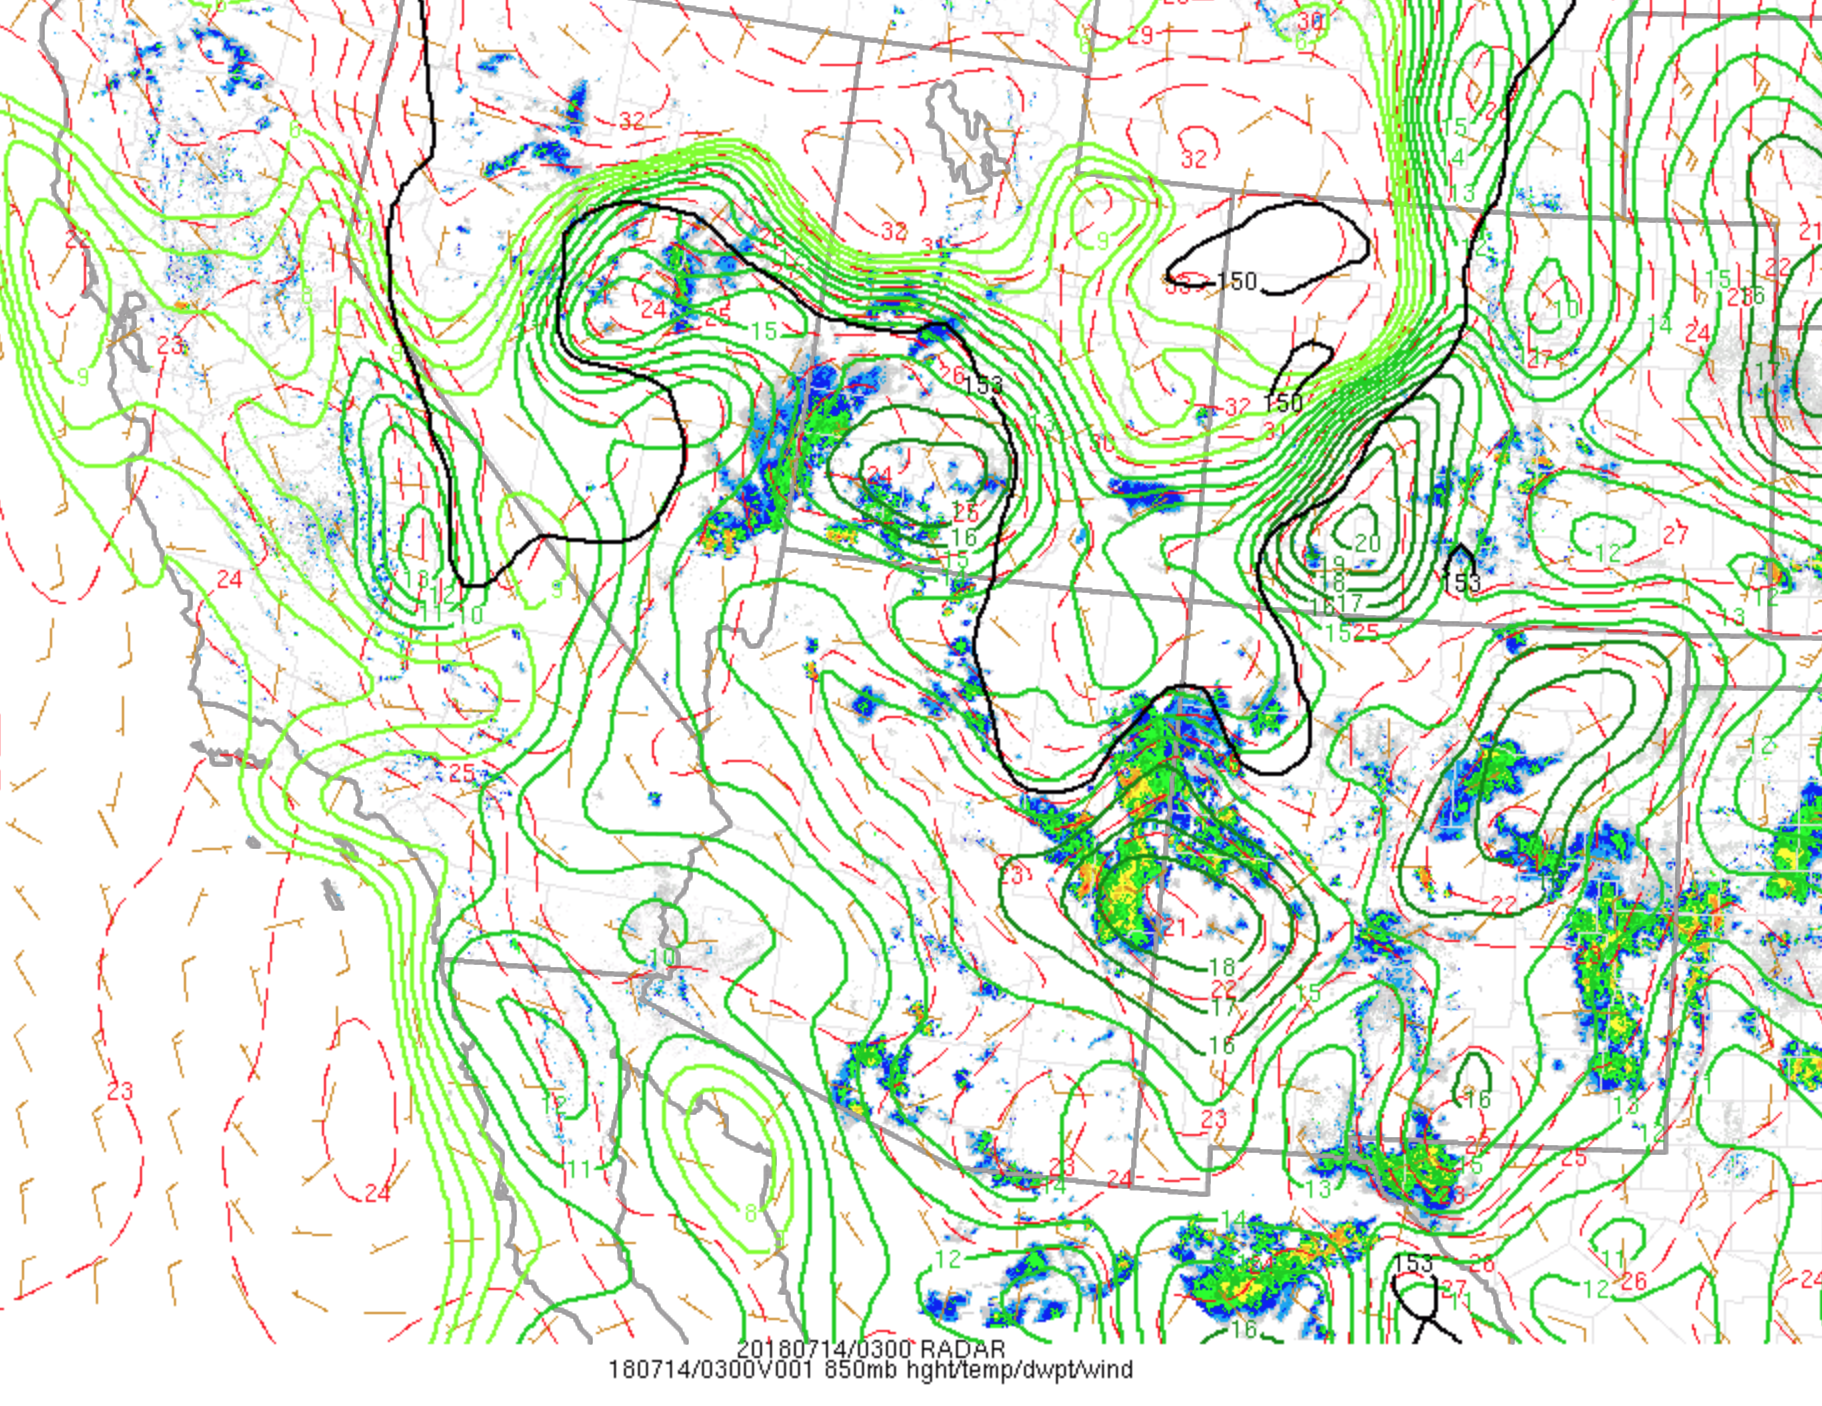
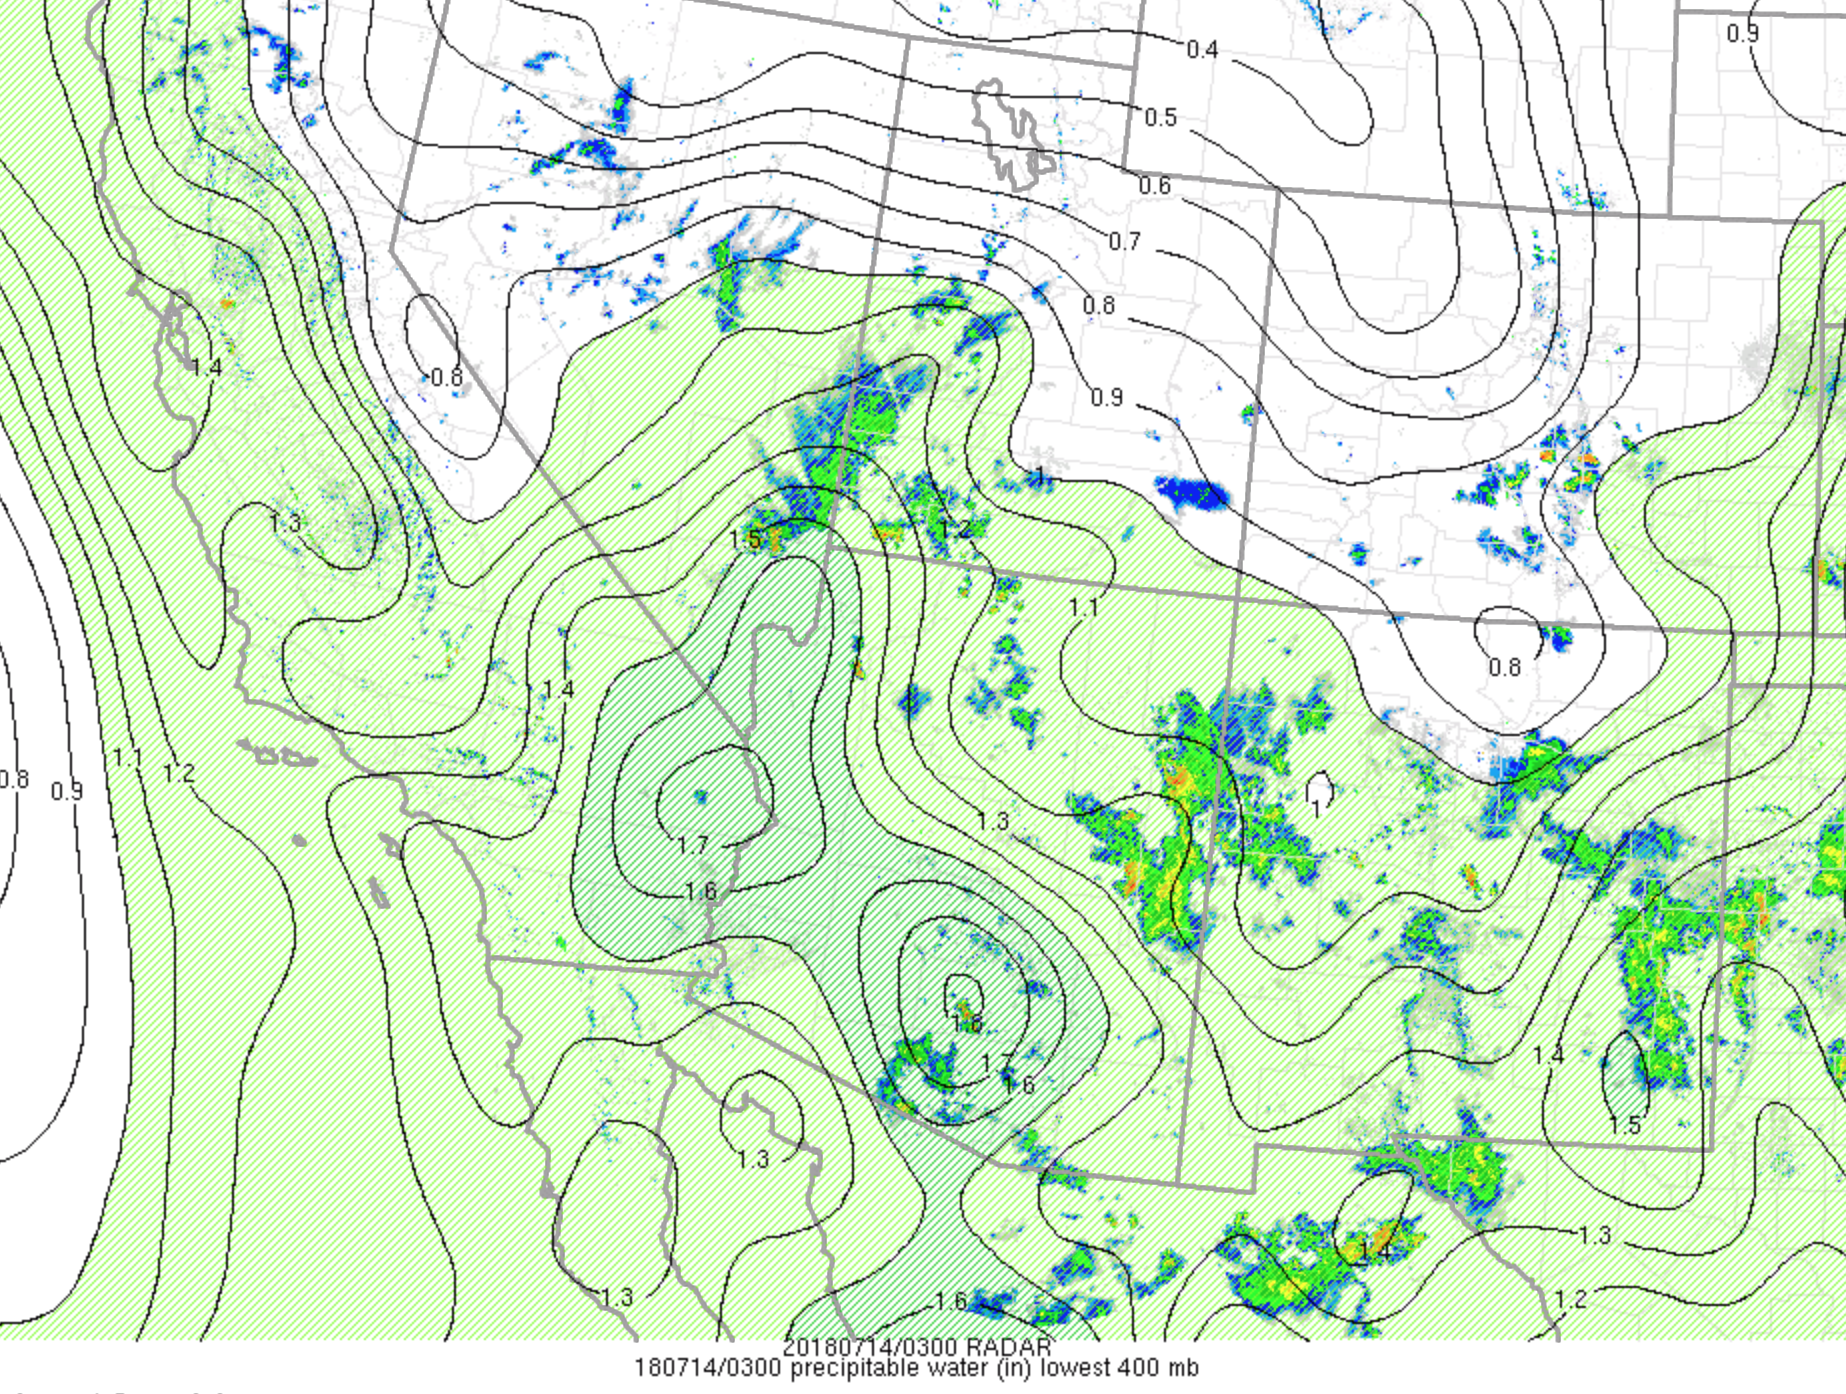
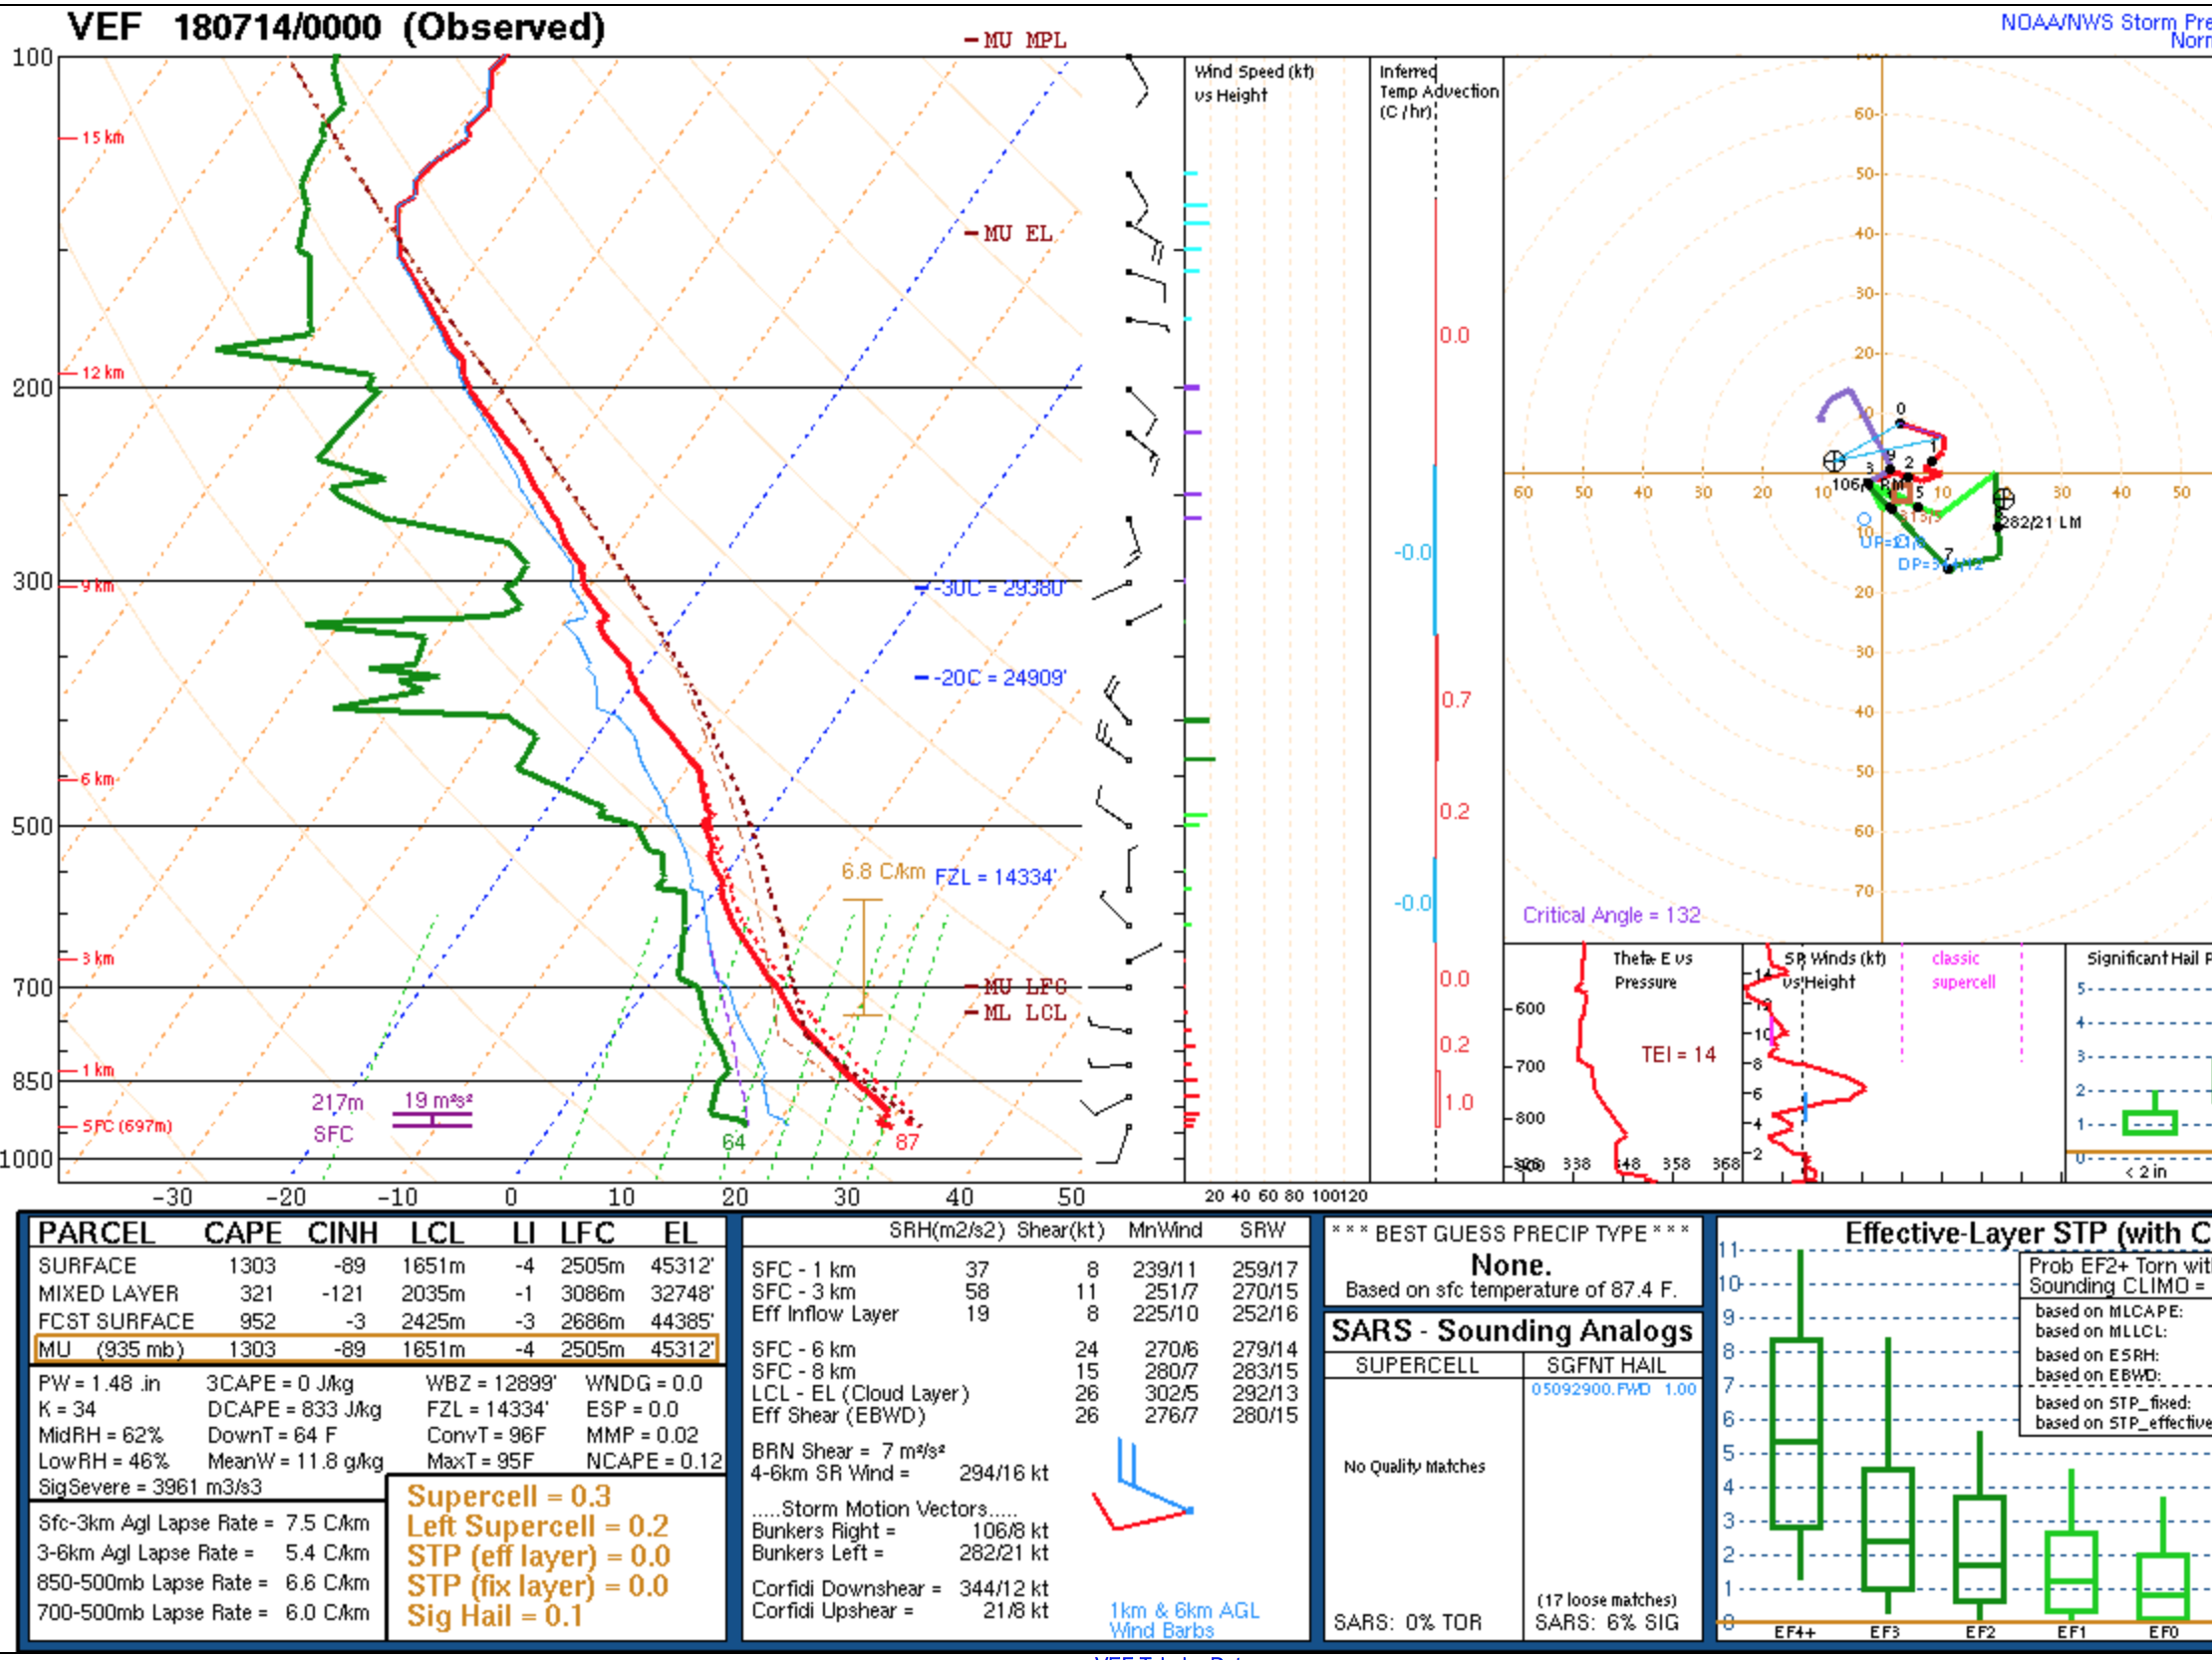
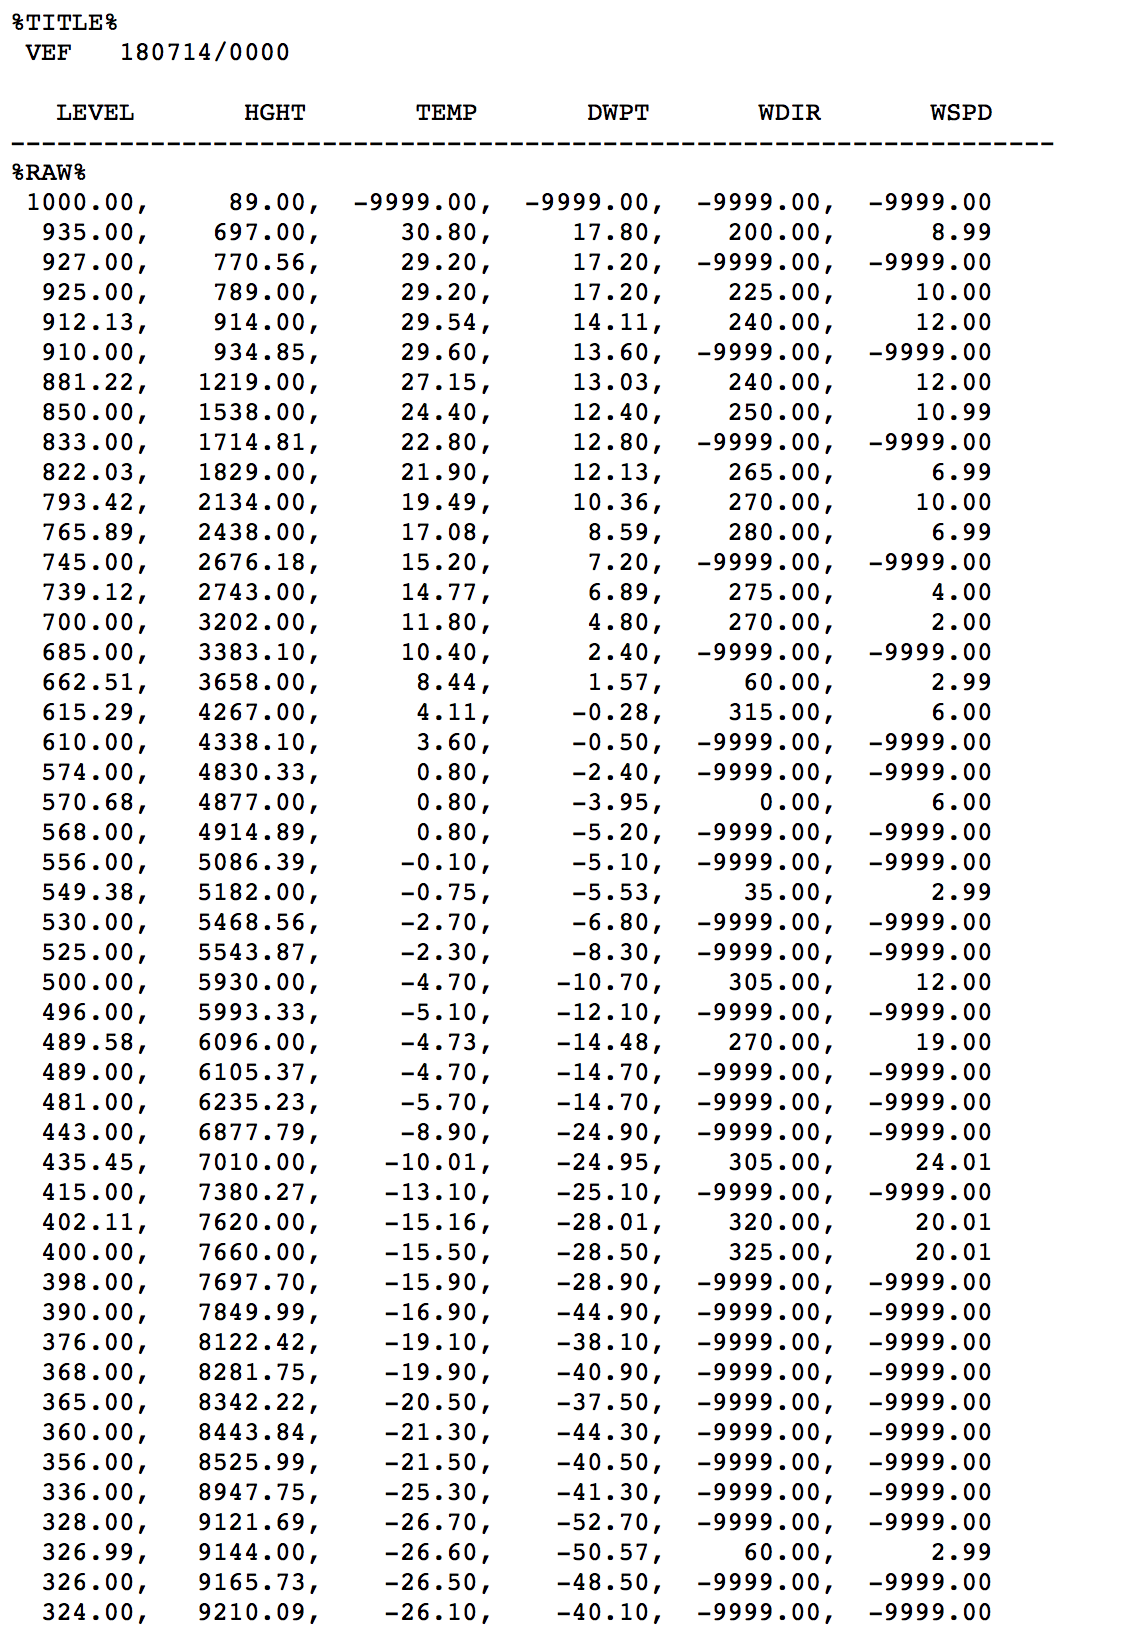
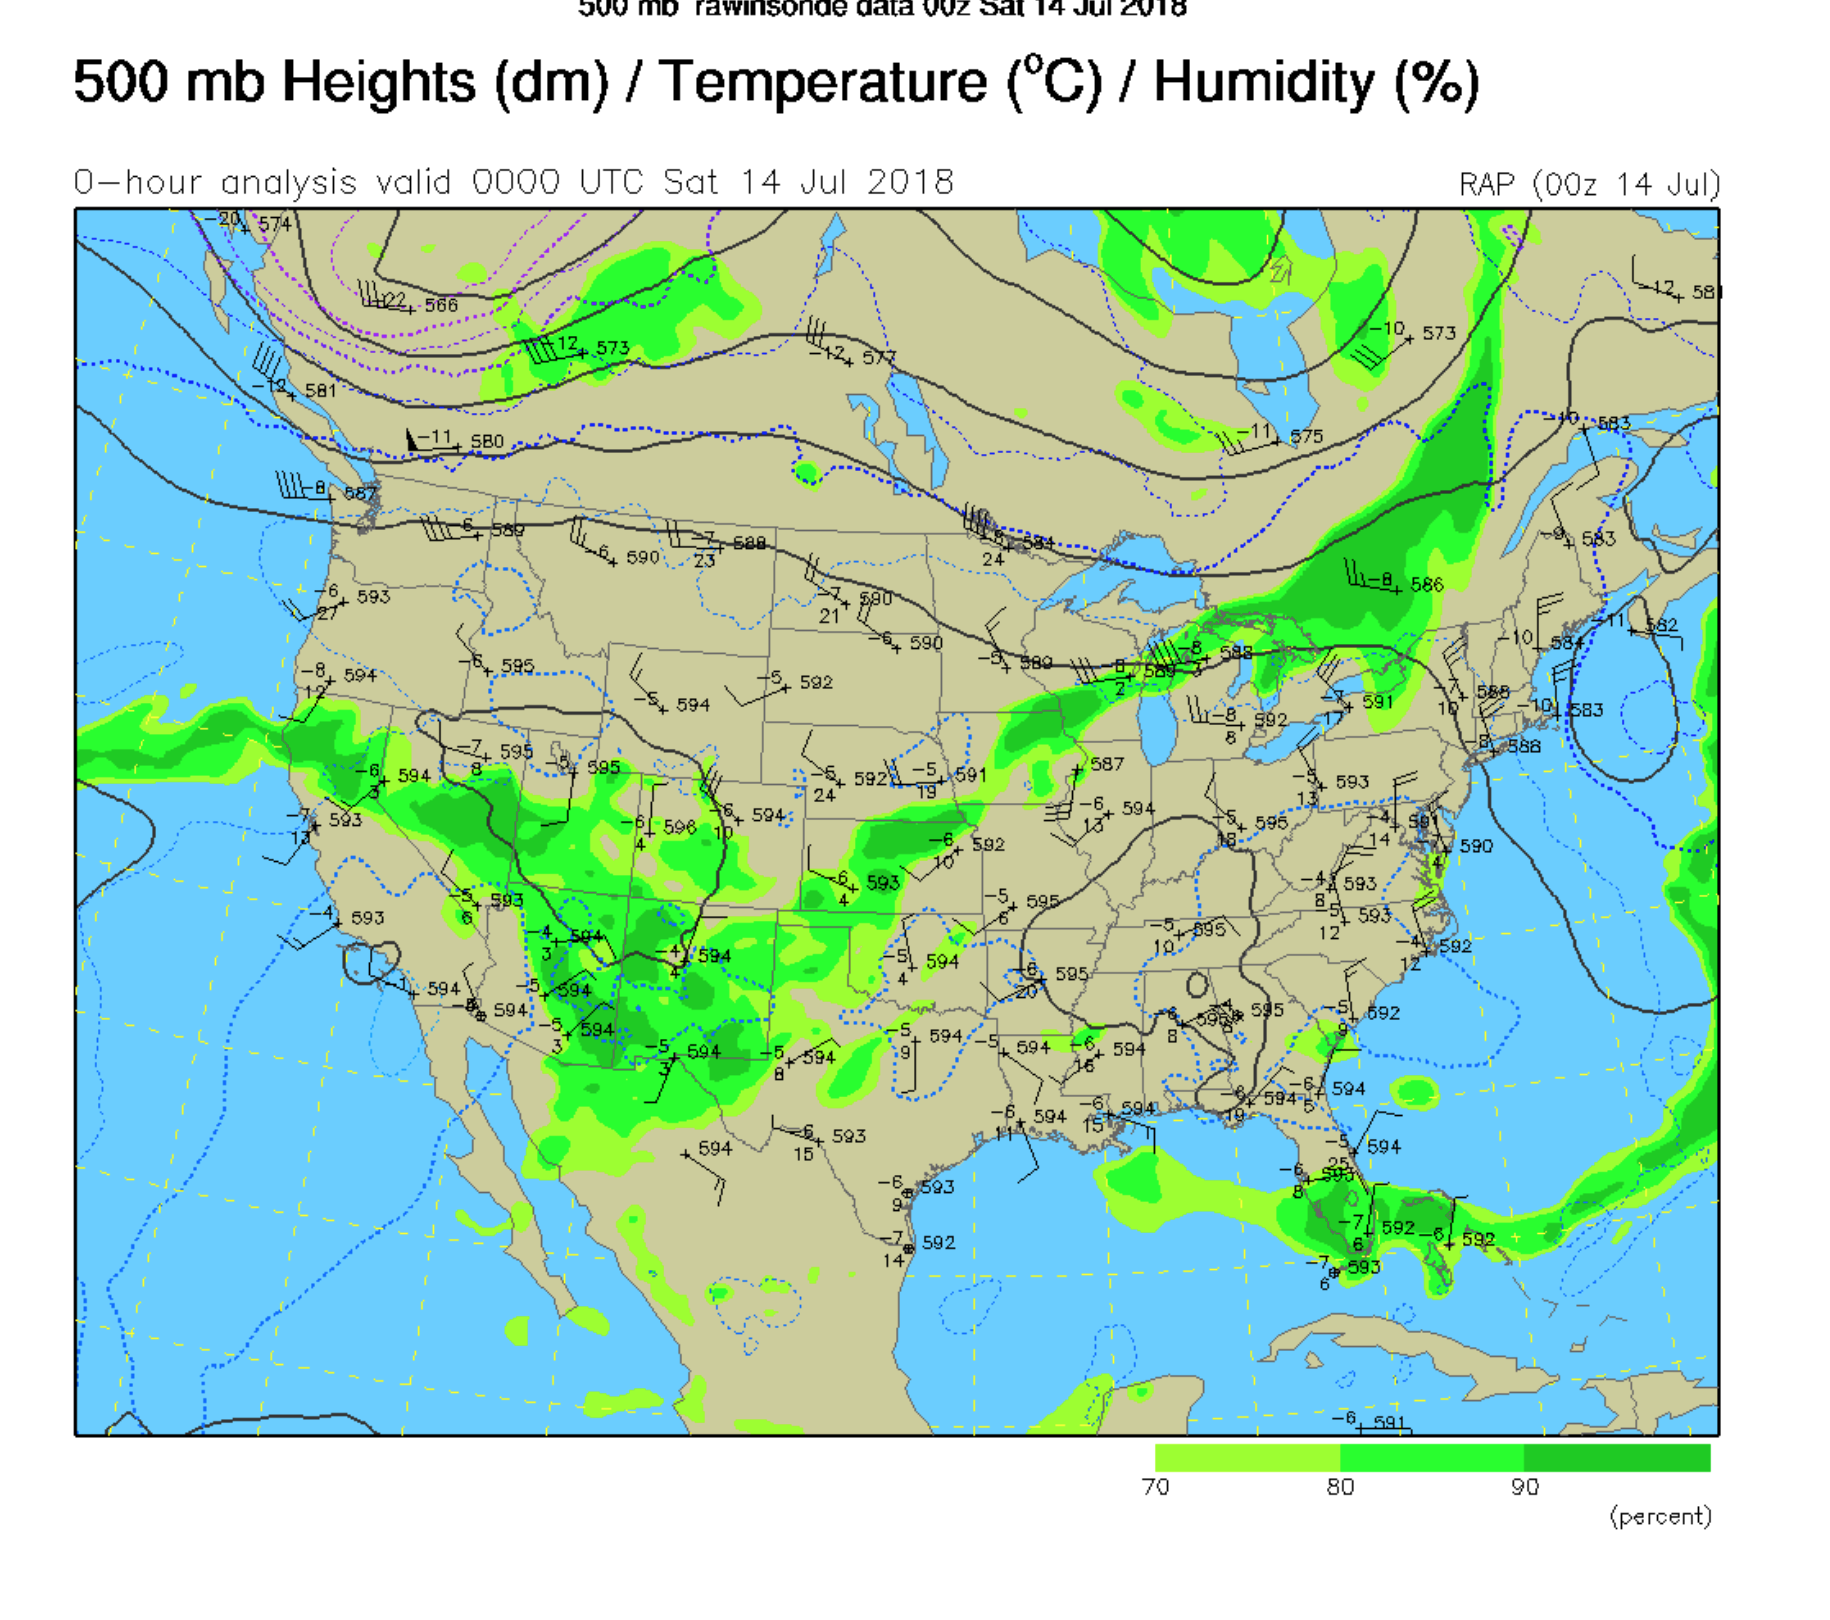
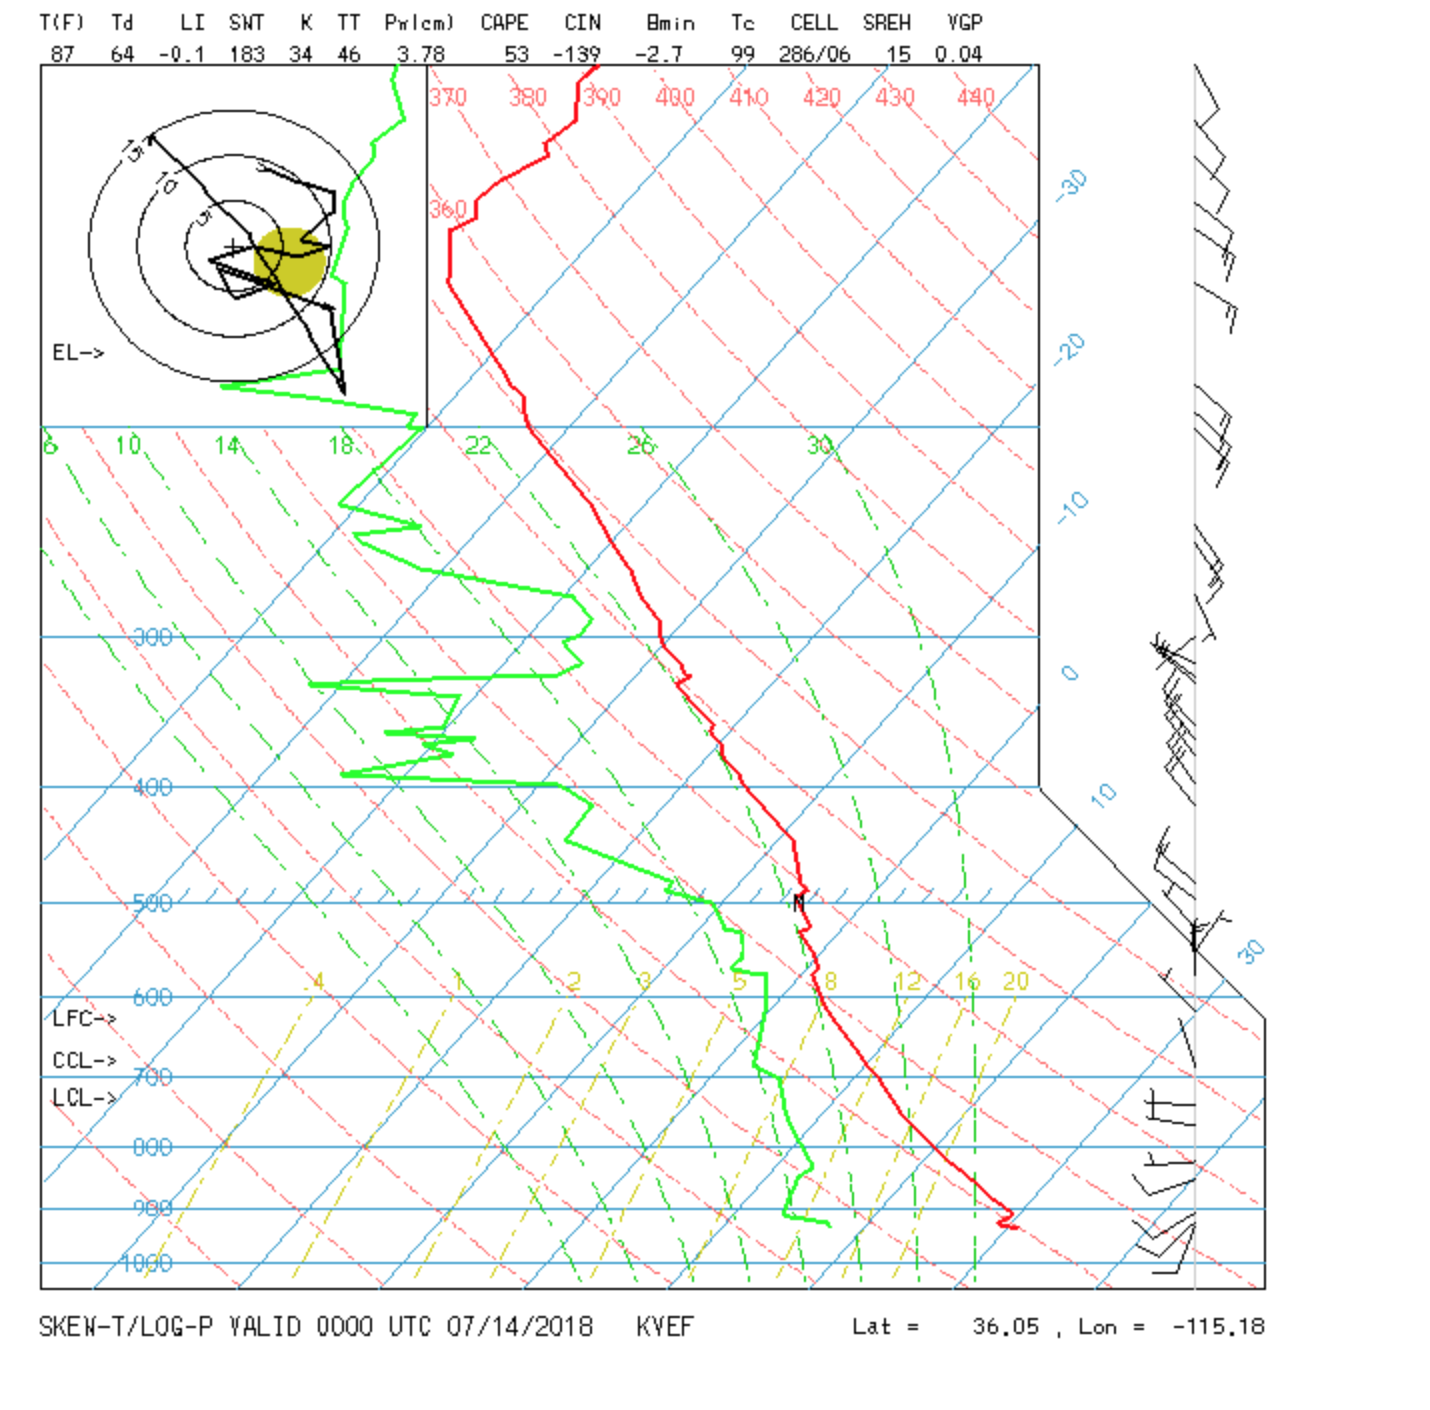
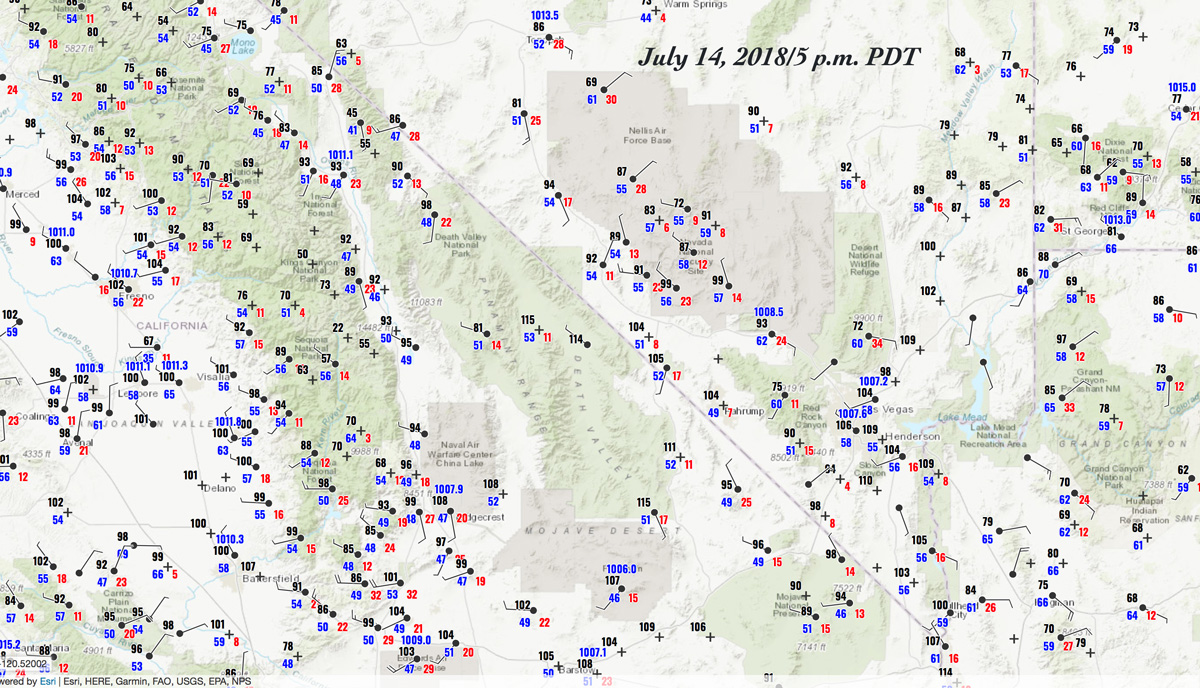
July 14
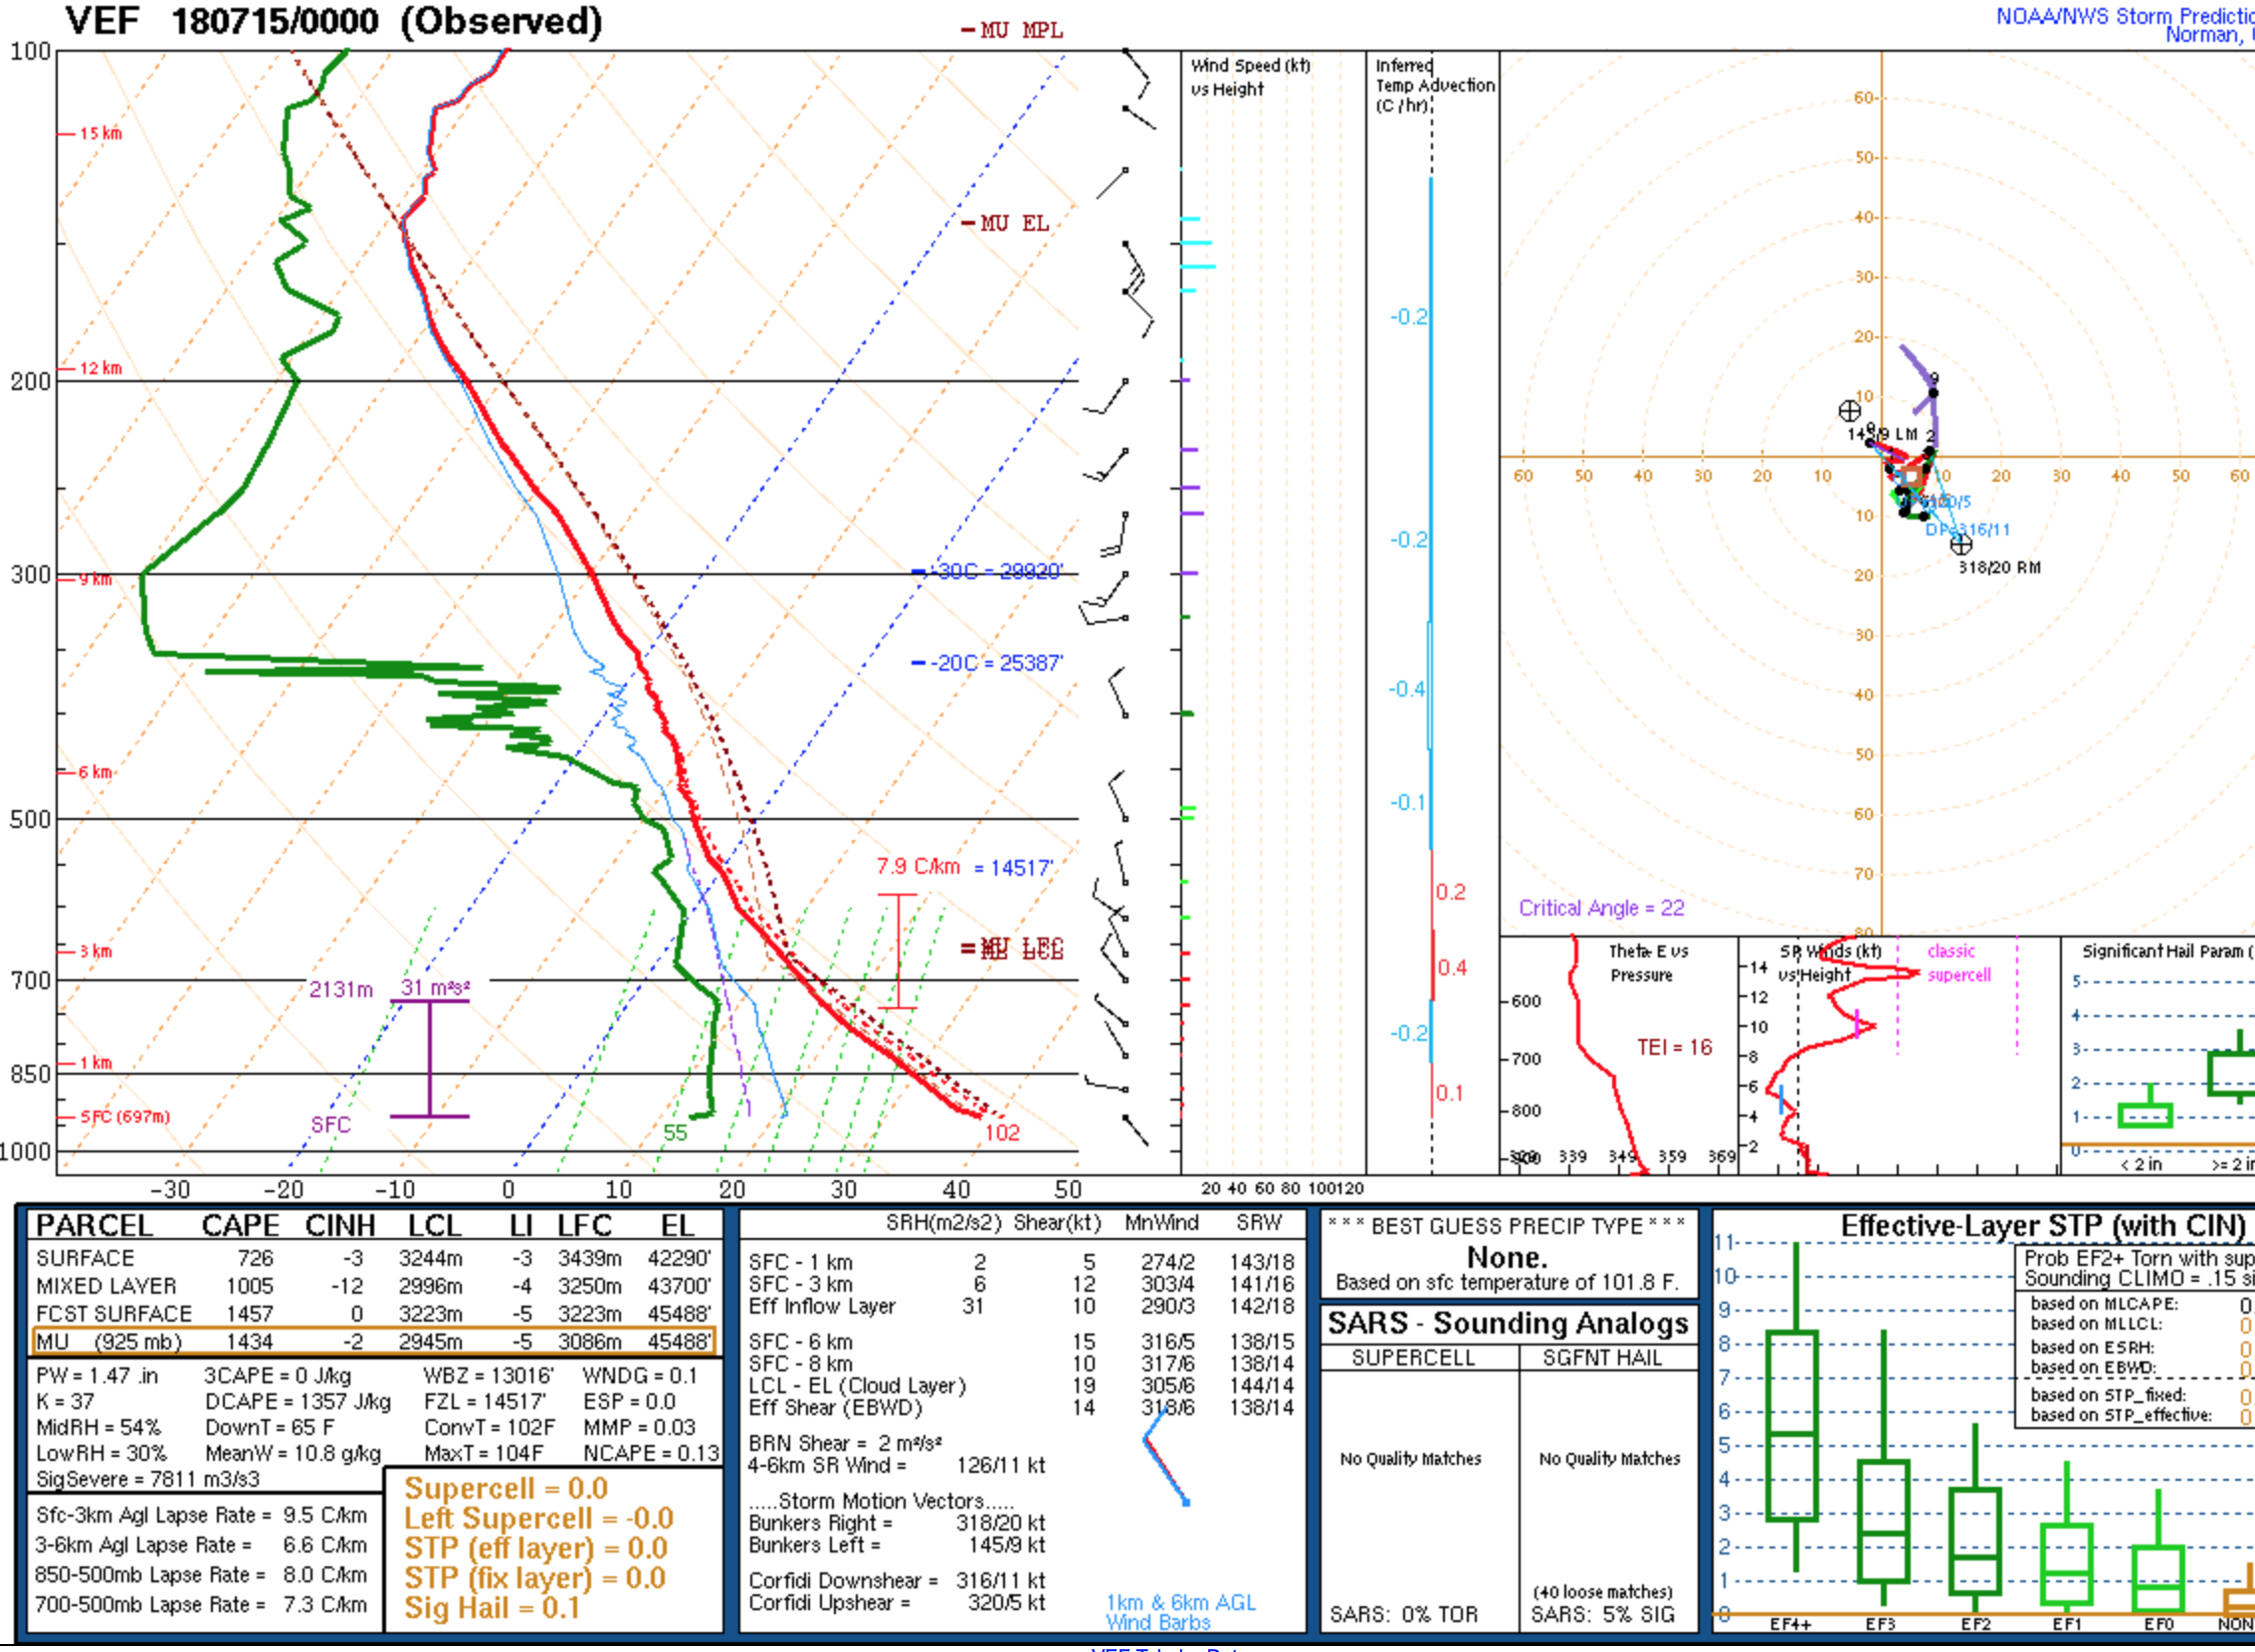
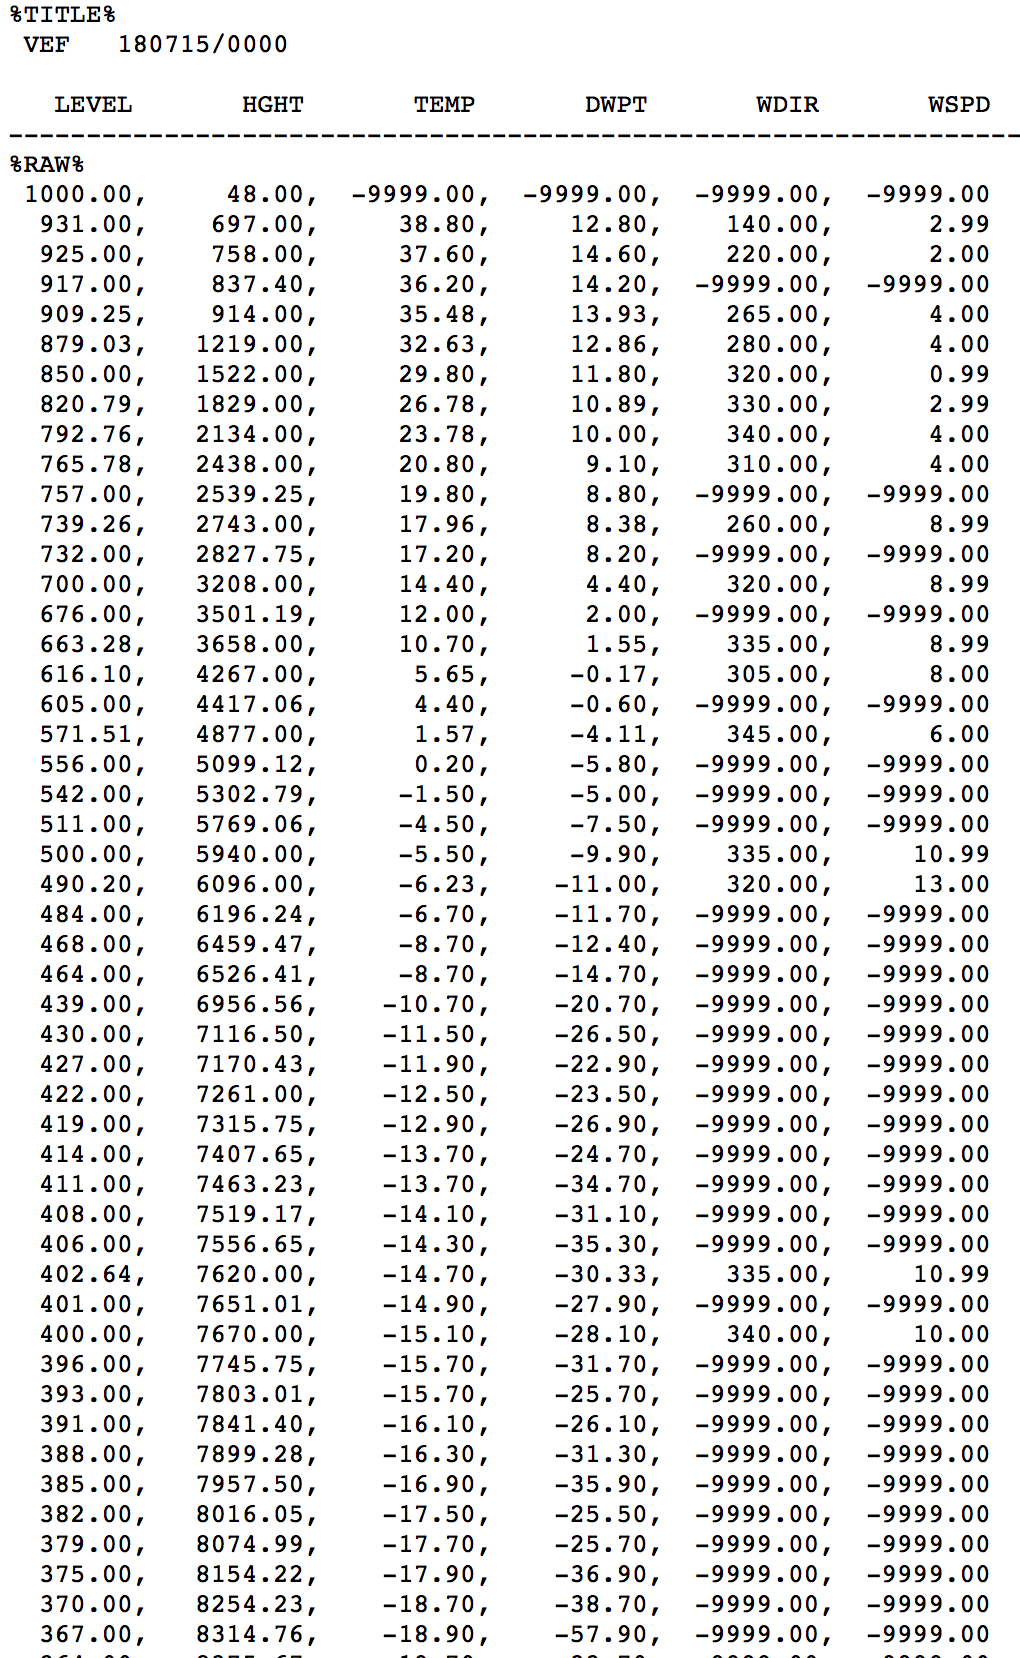
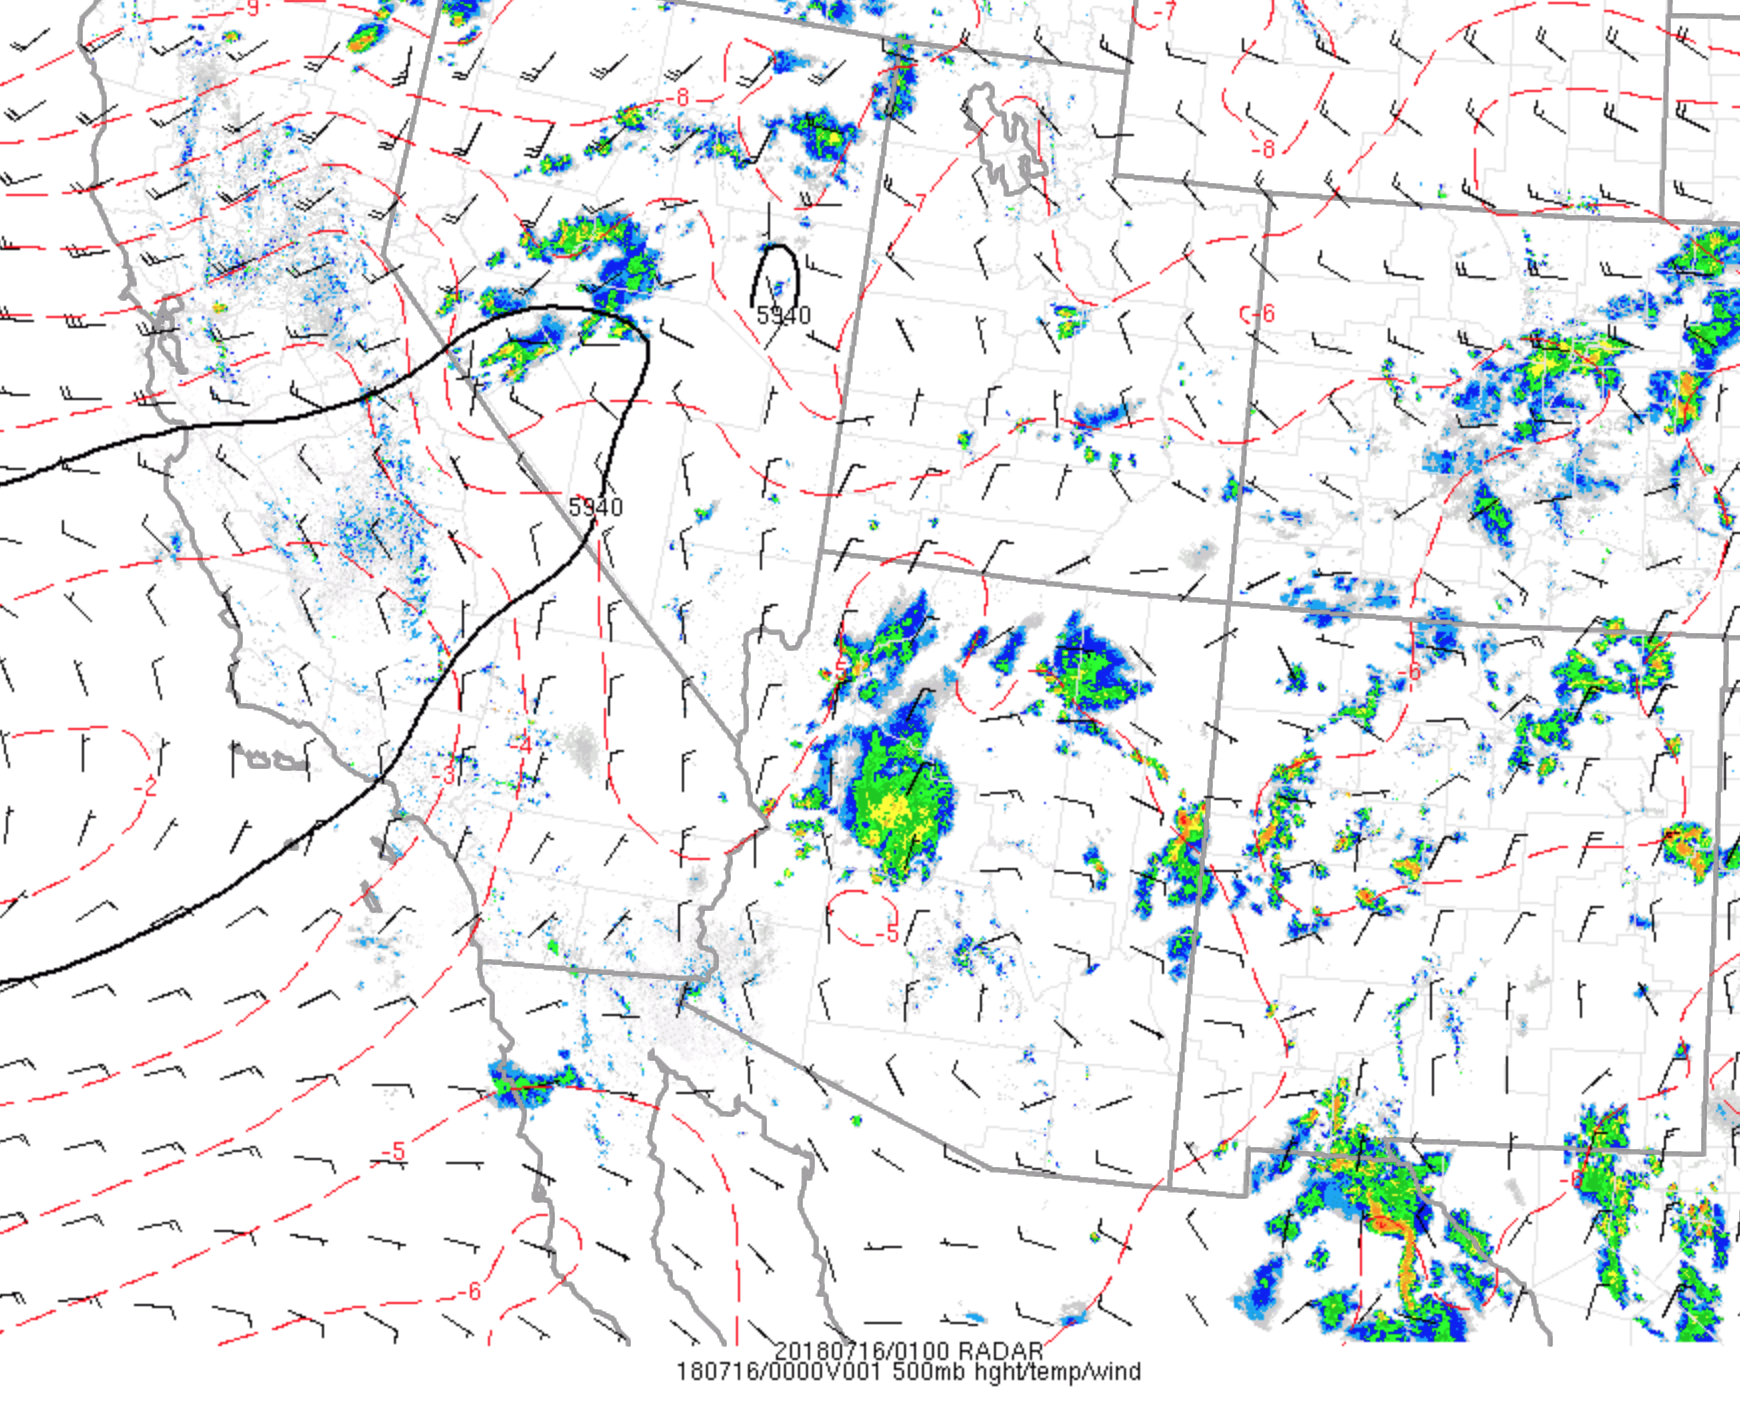
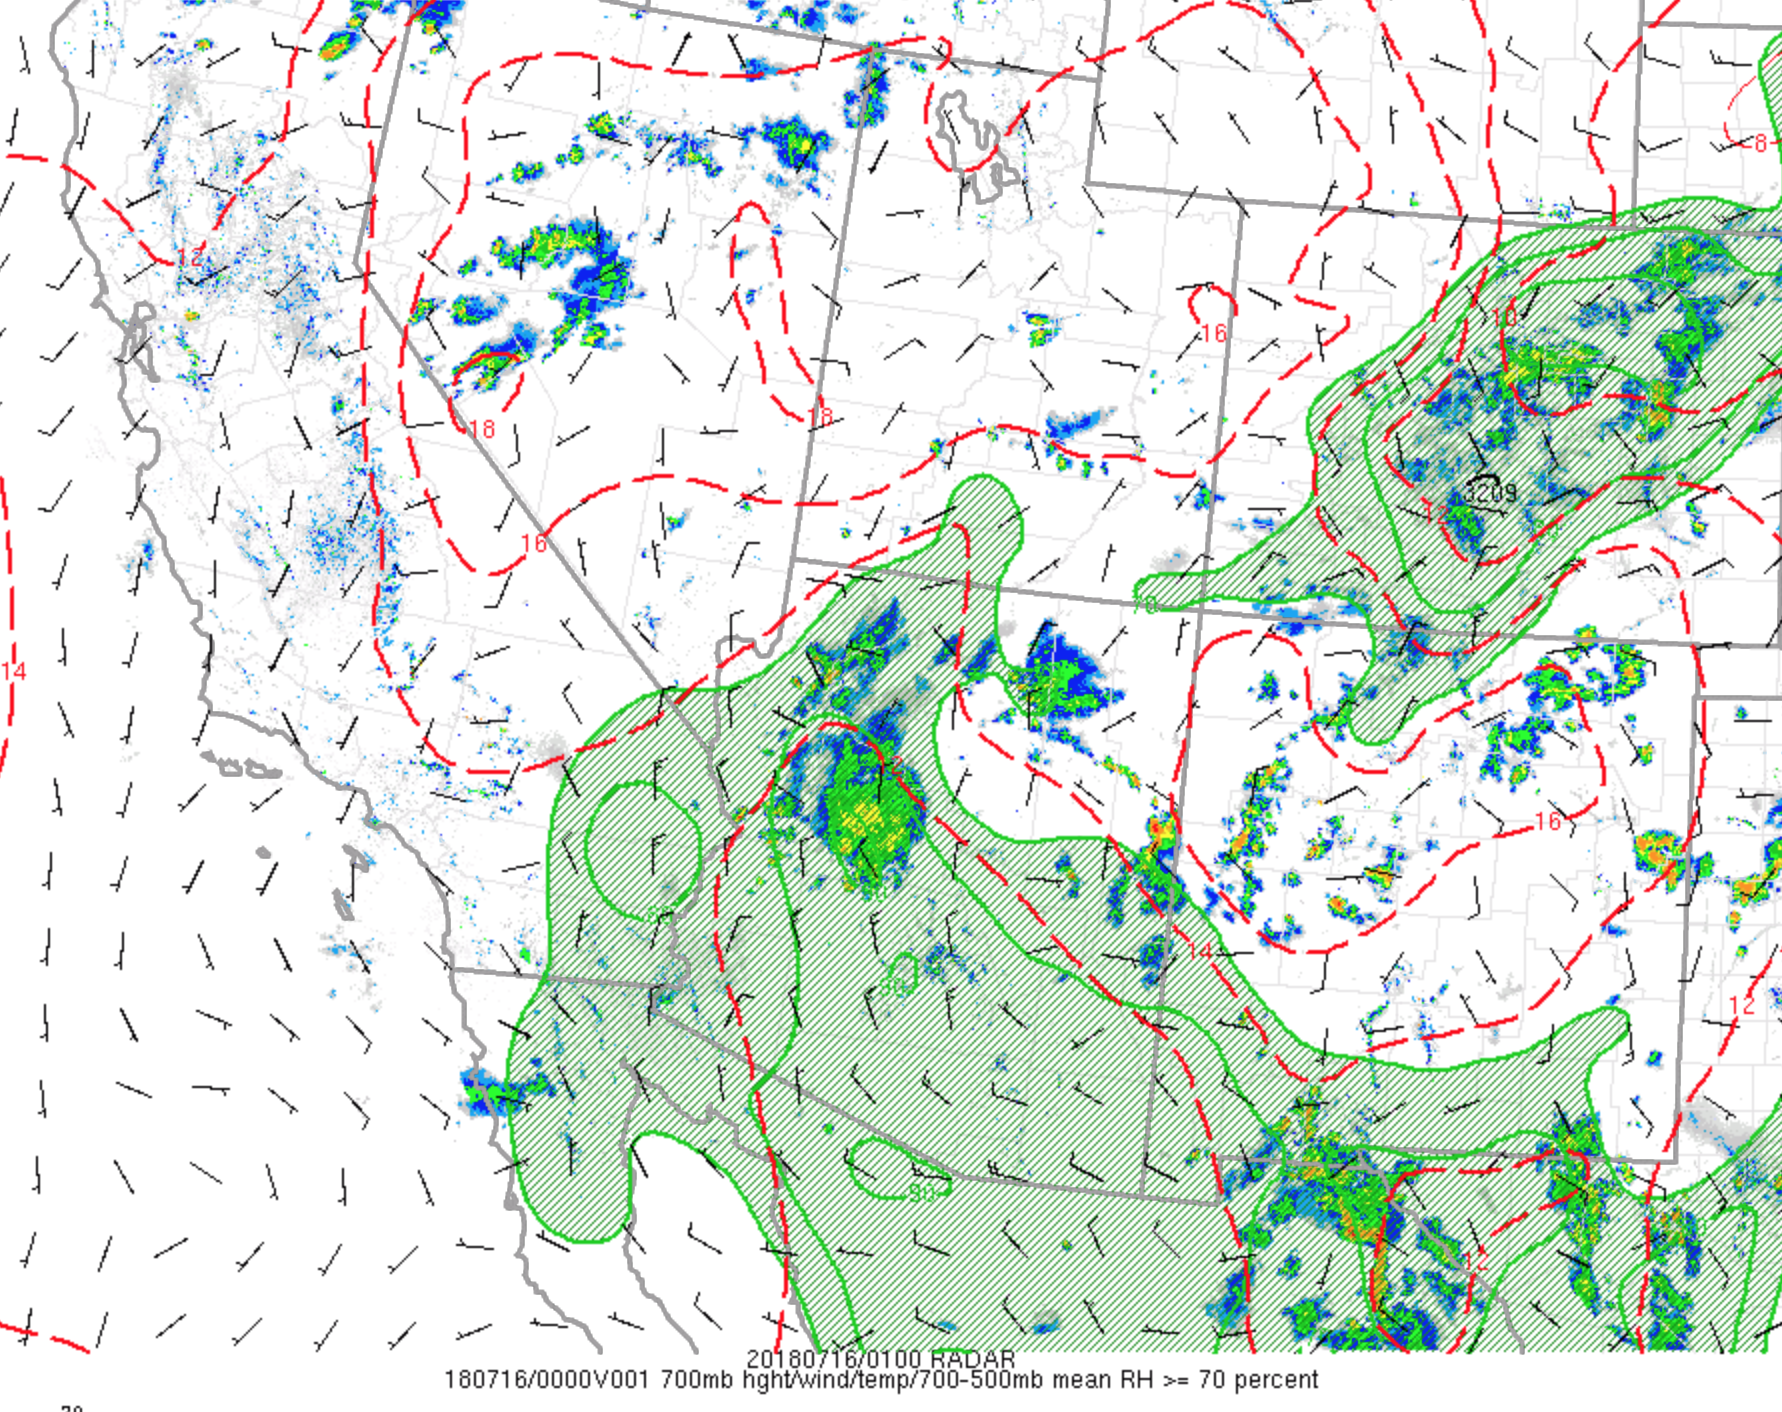
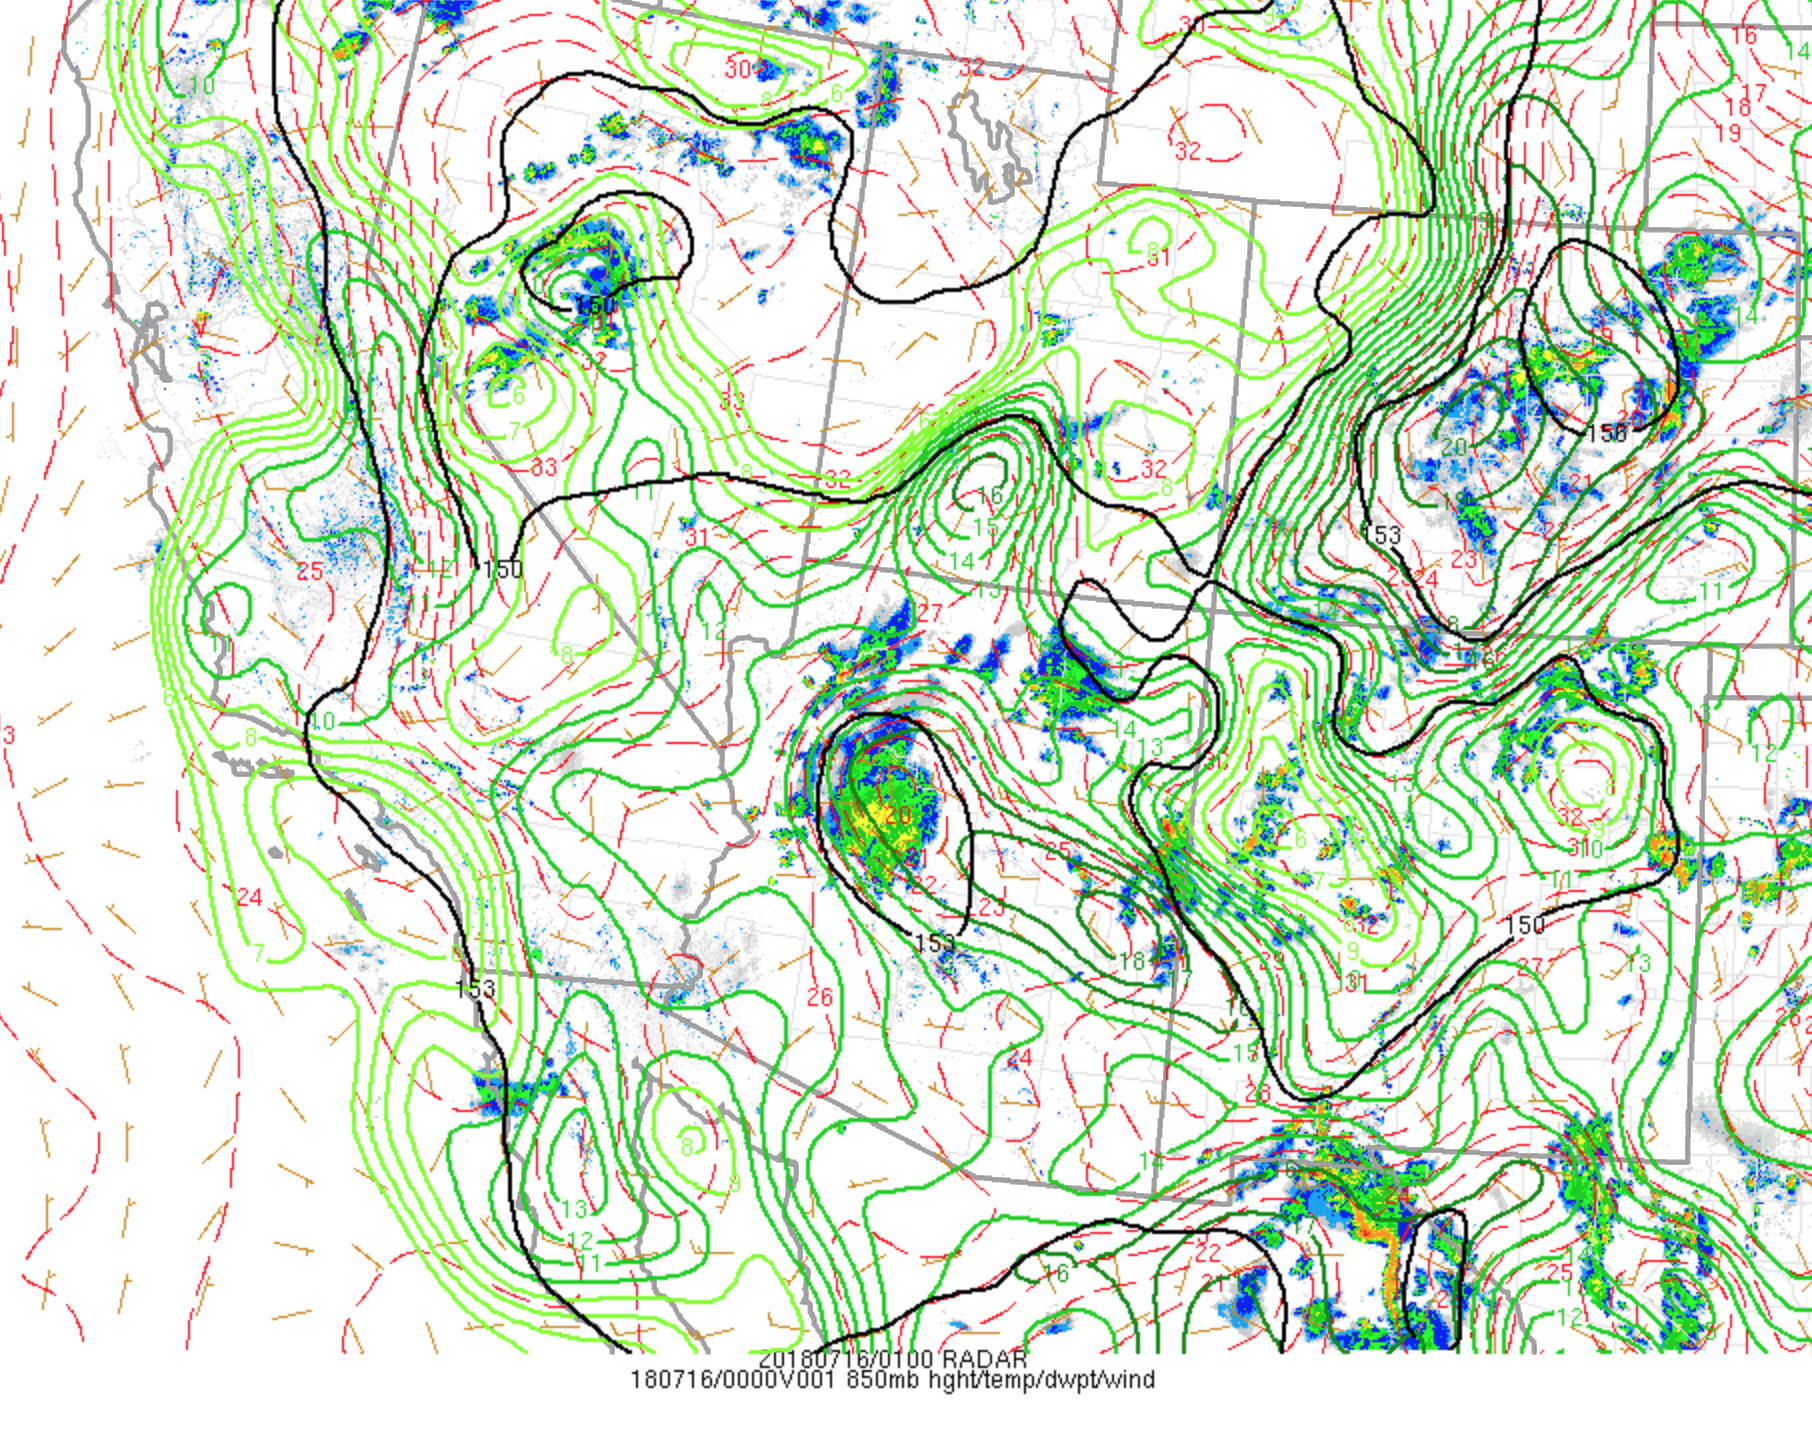
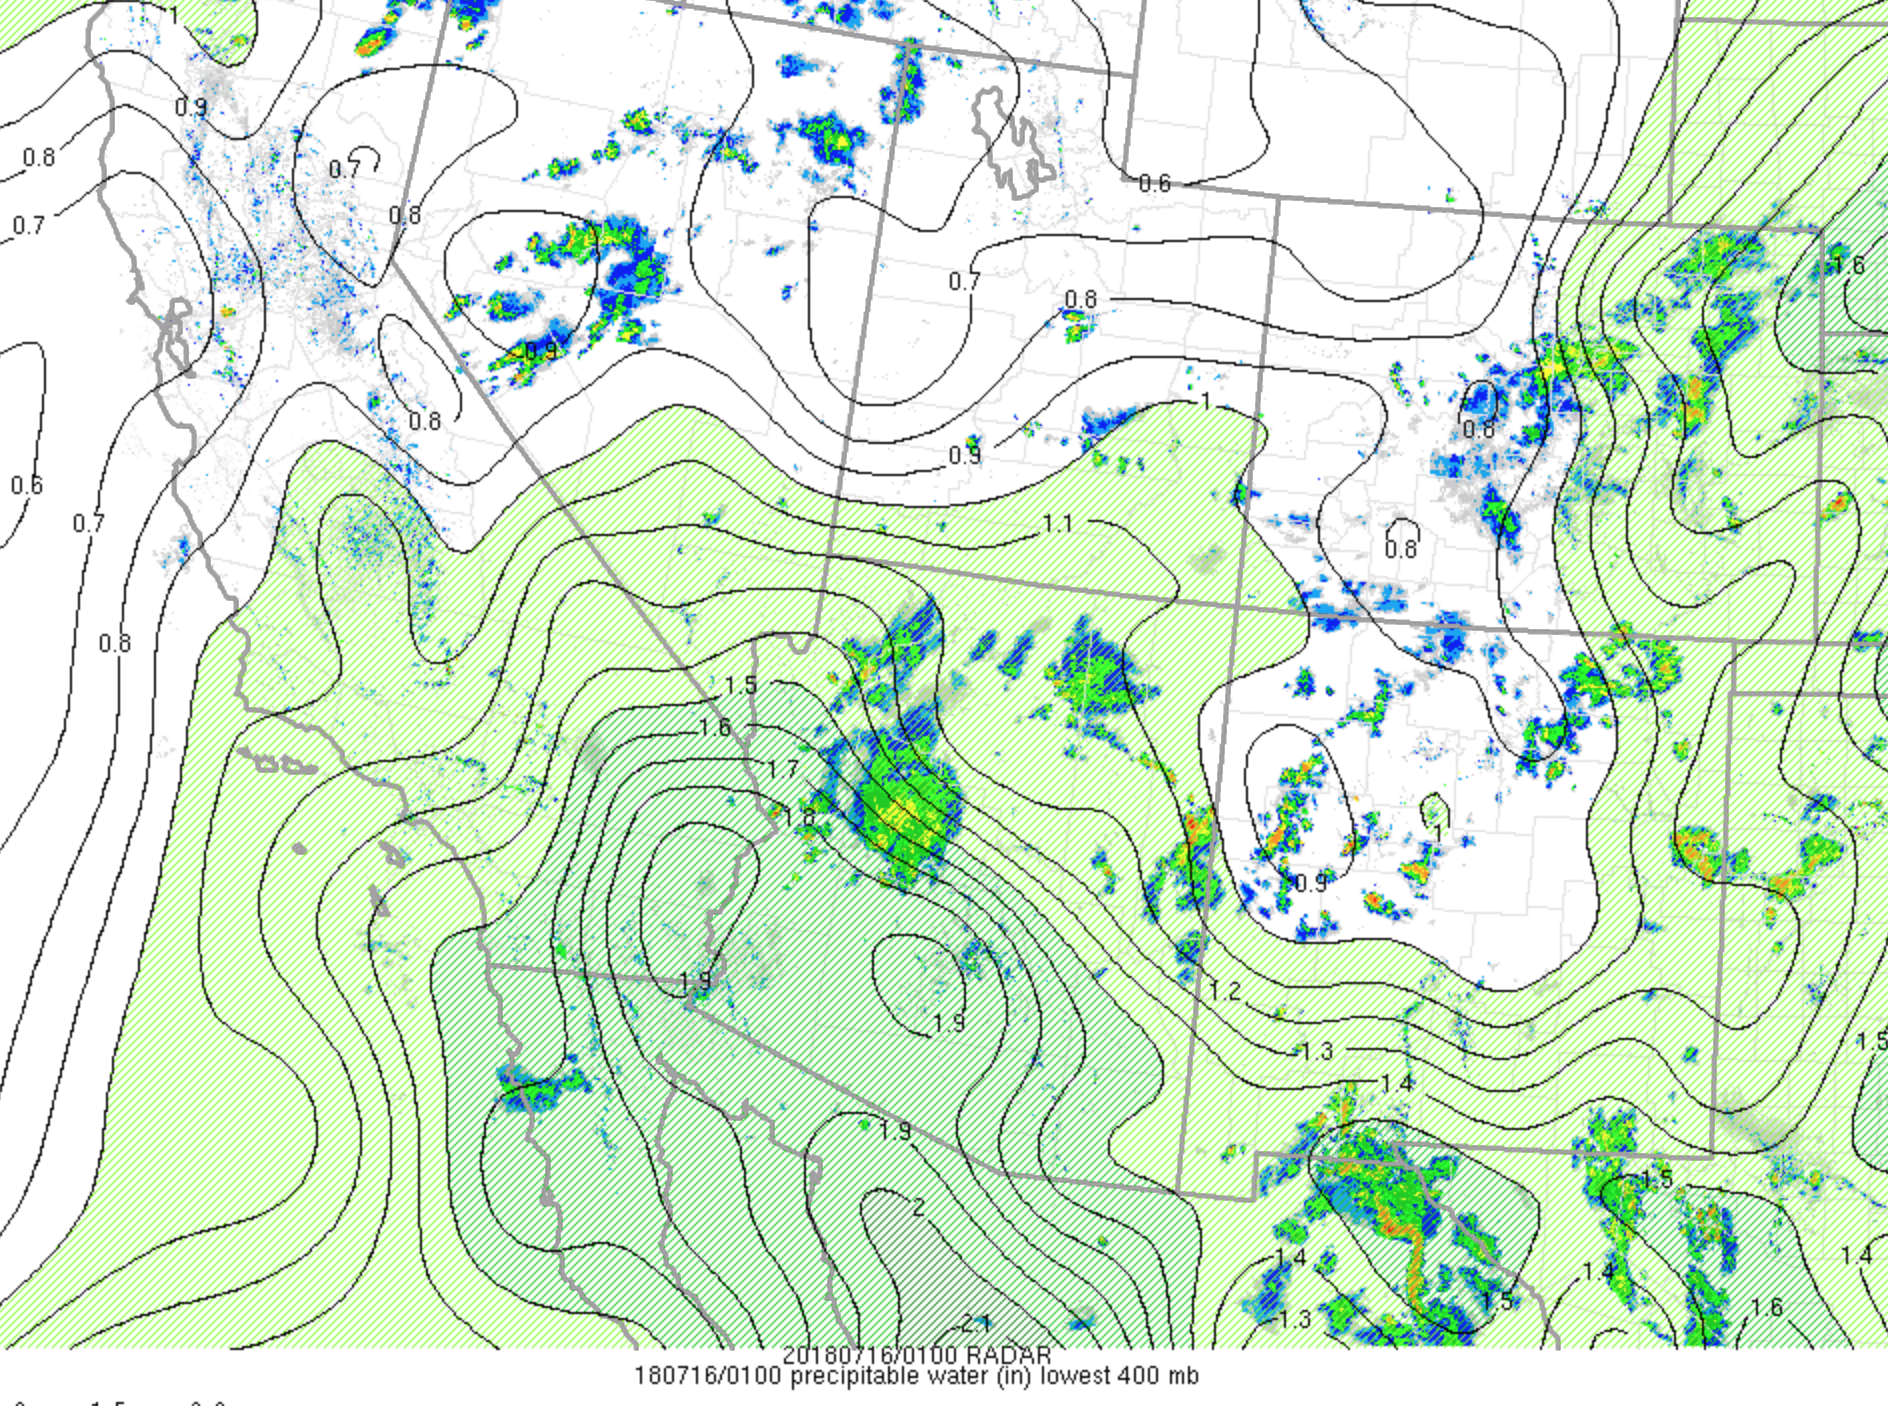
July 15
Leave a Reply
You must be logged in to post a comment.