
July 2018 was one of the hottest months on record in the Death Valley region. These daily maps and graphics were saved to document the month’s weather.
Part 2, July 16 to July 31!
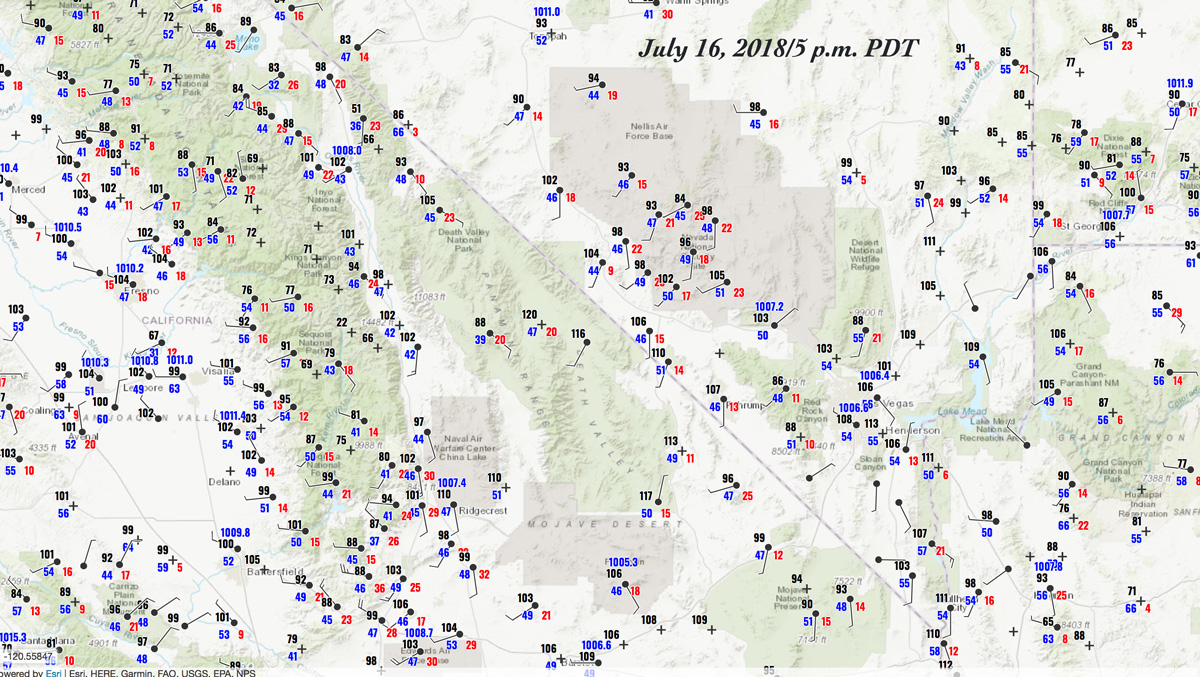
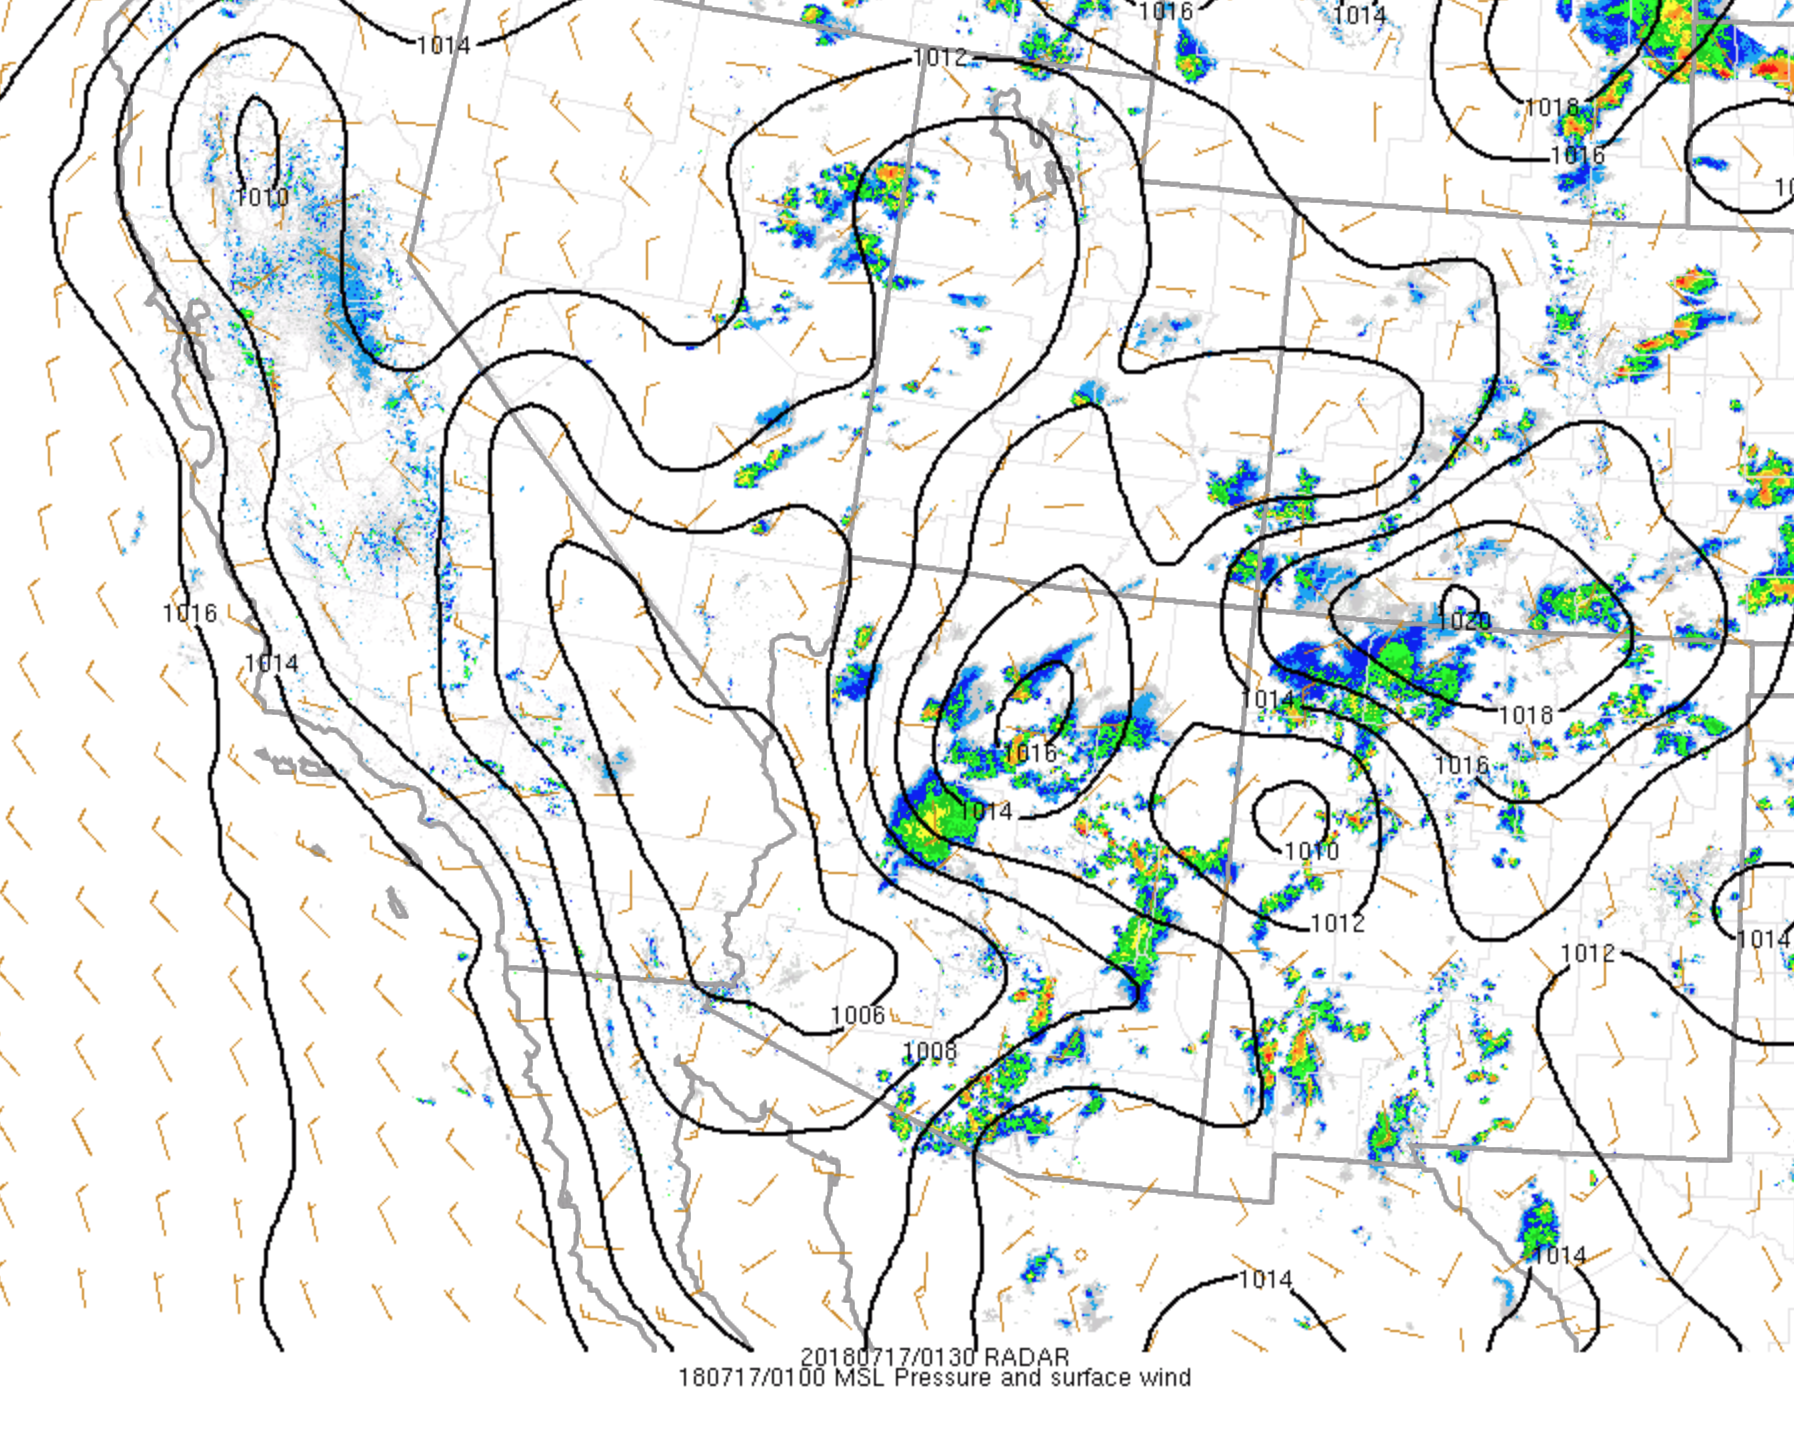
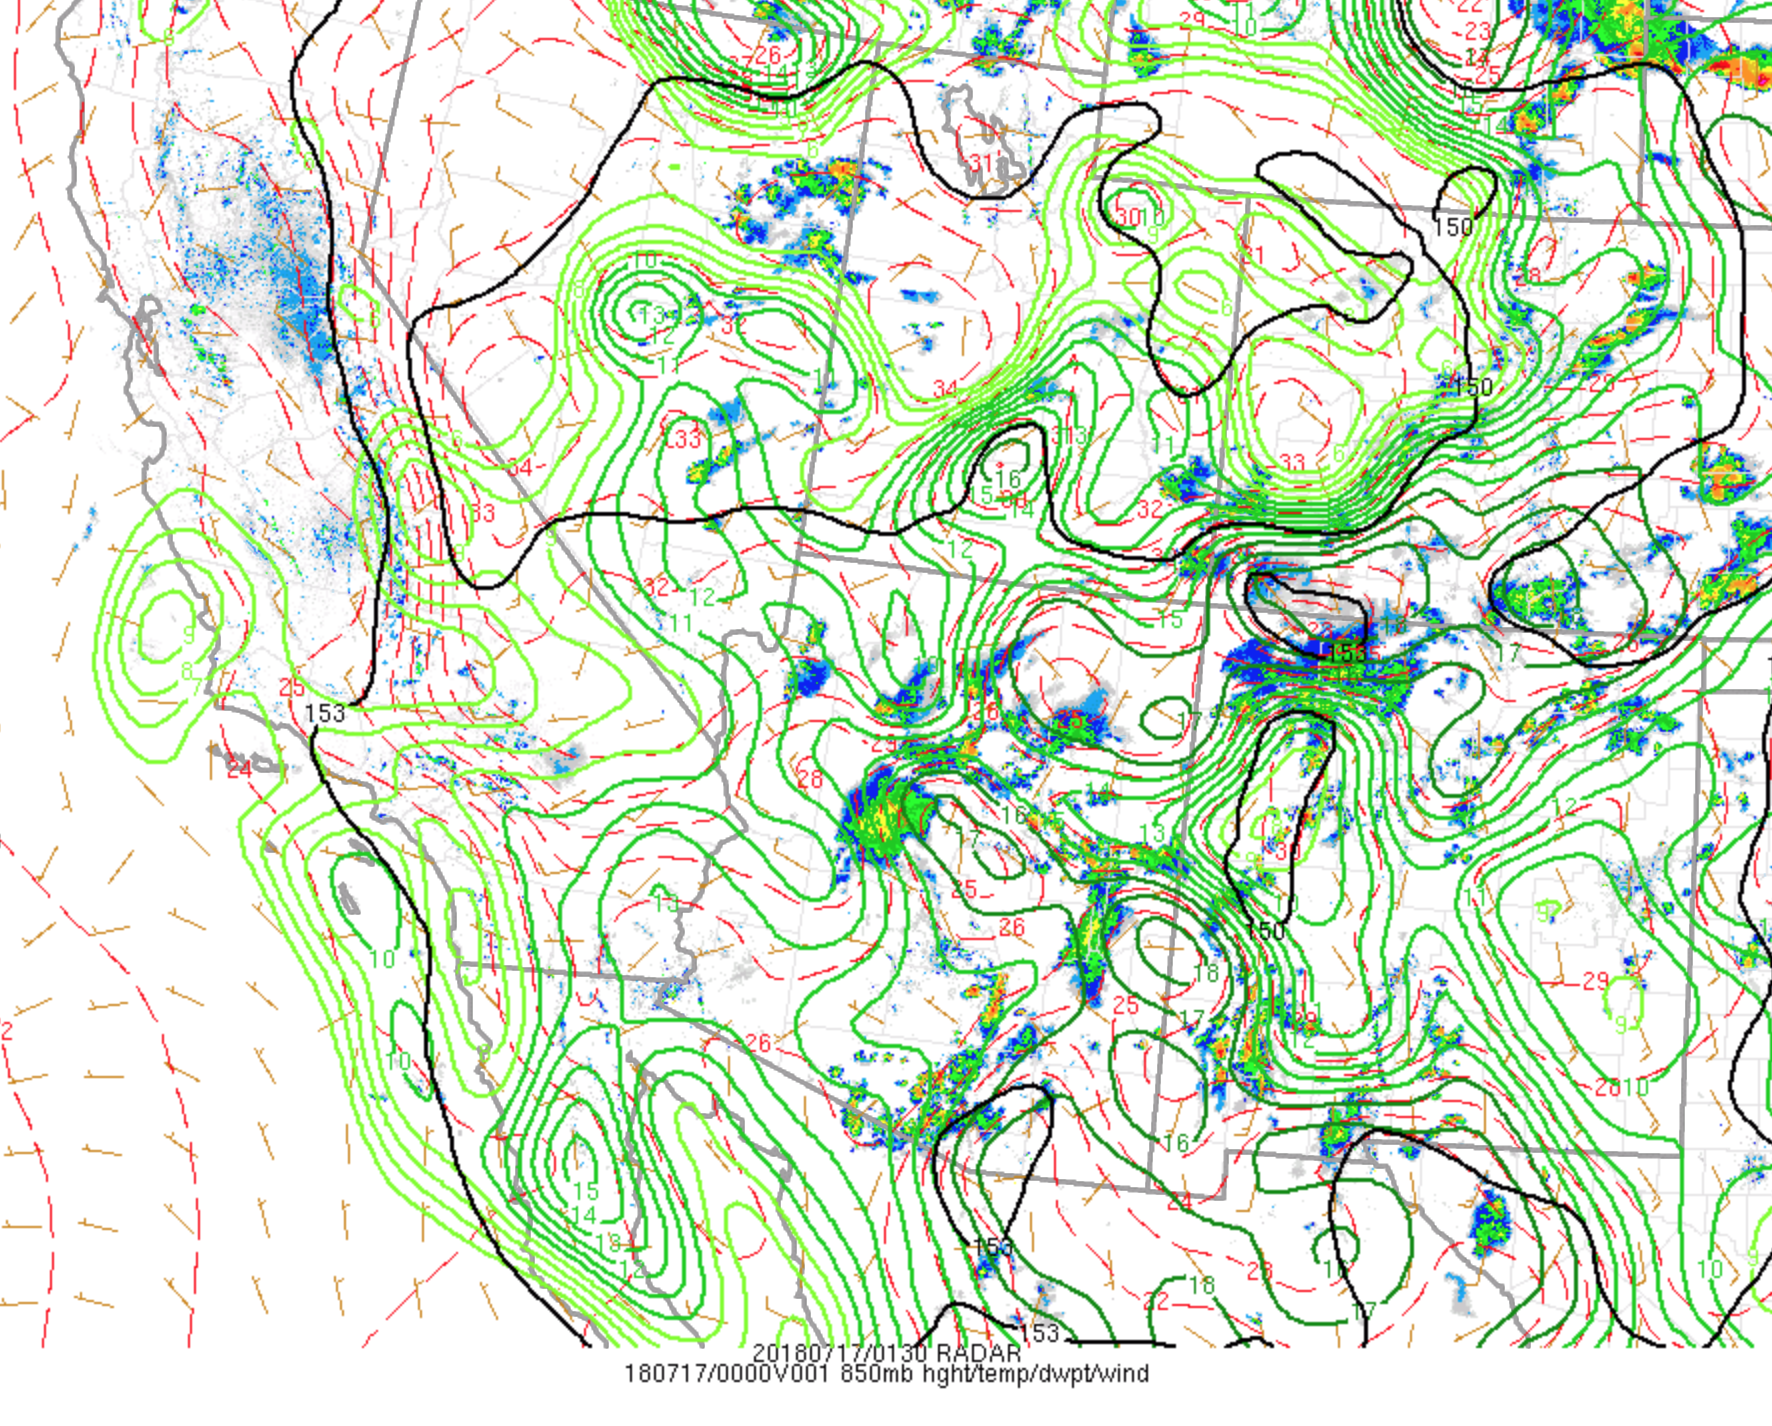
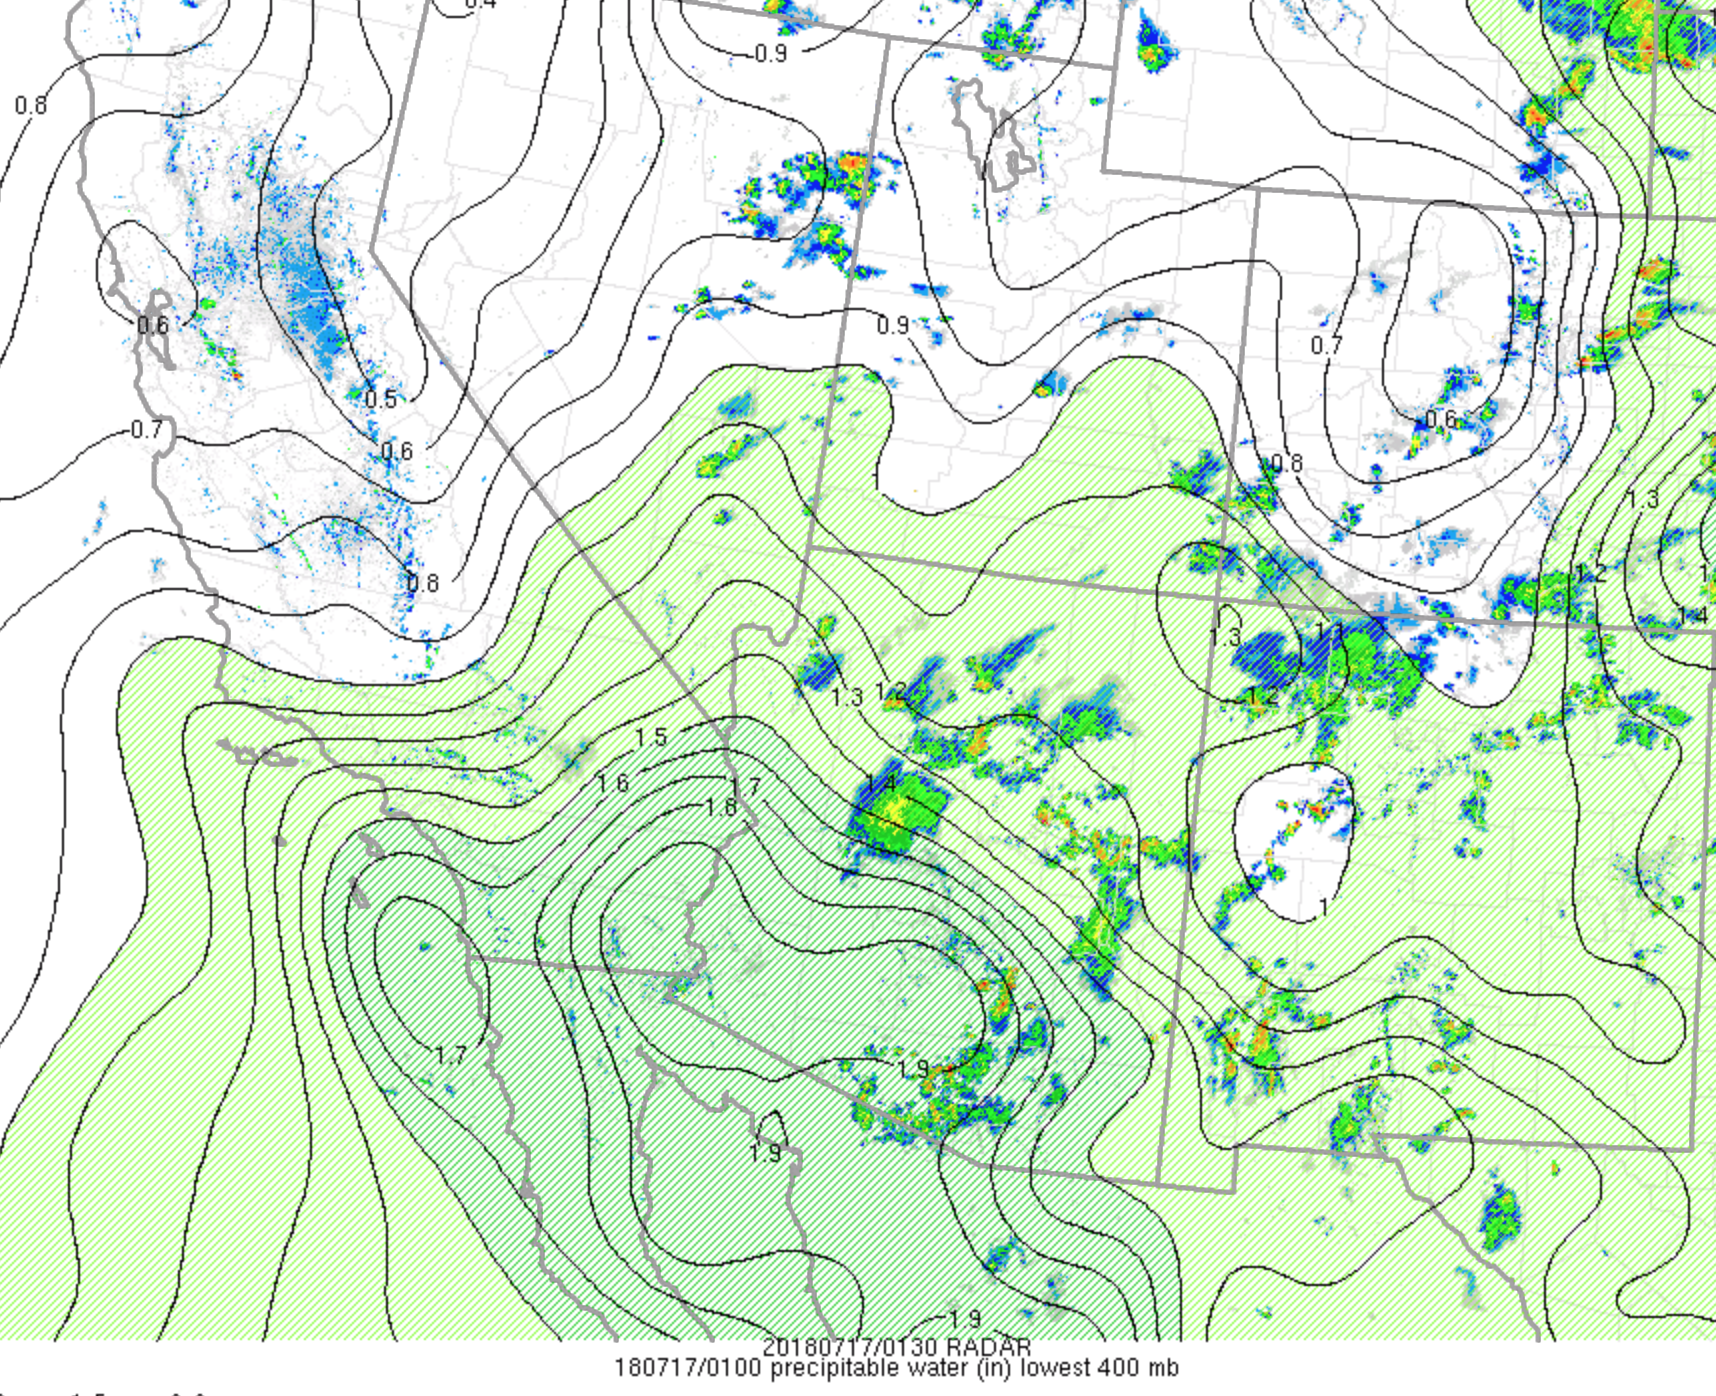
July 16


July 17


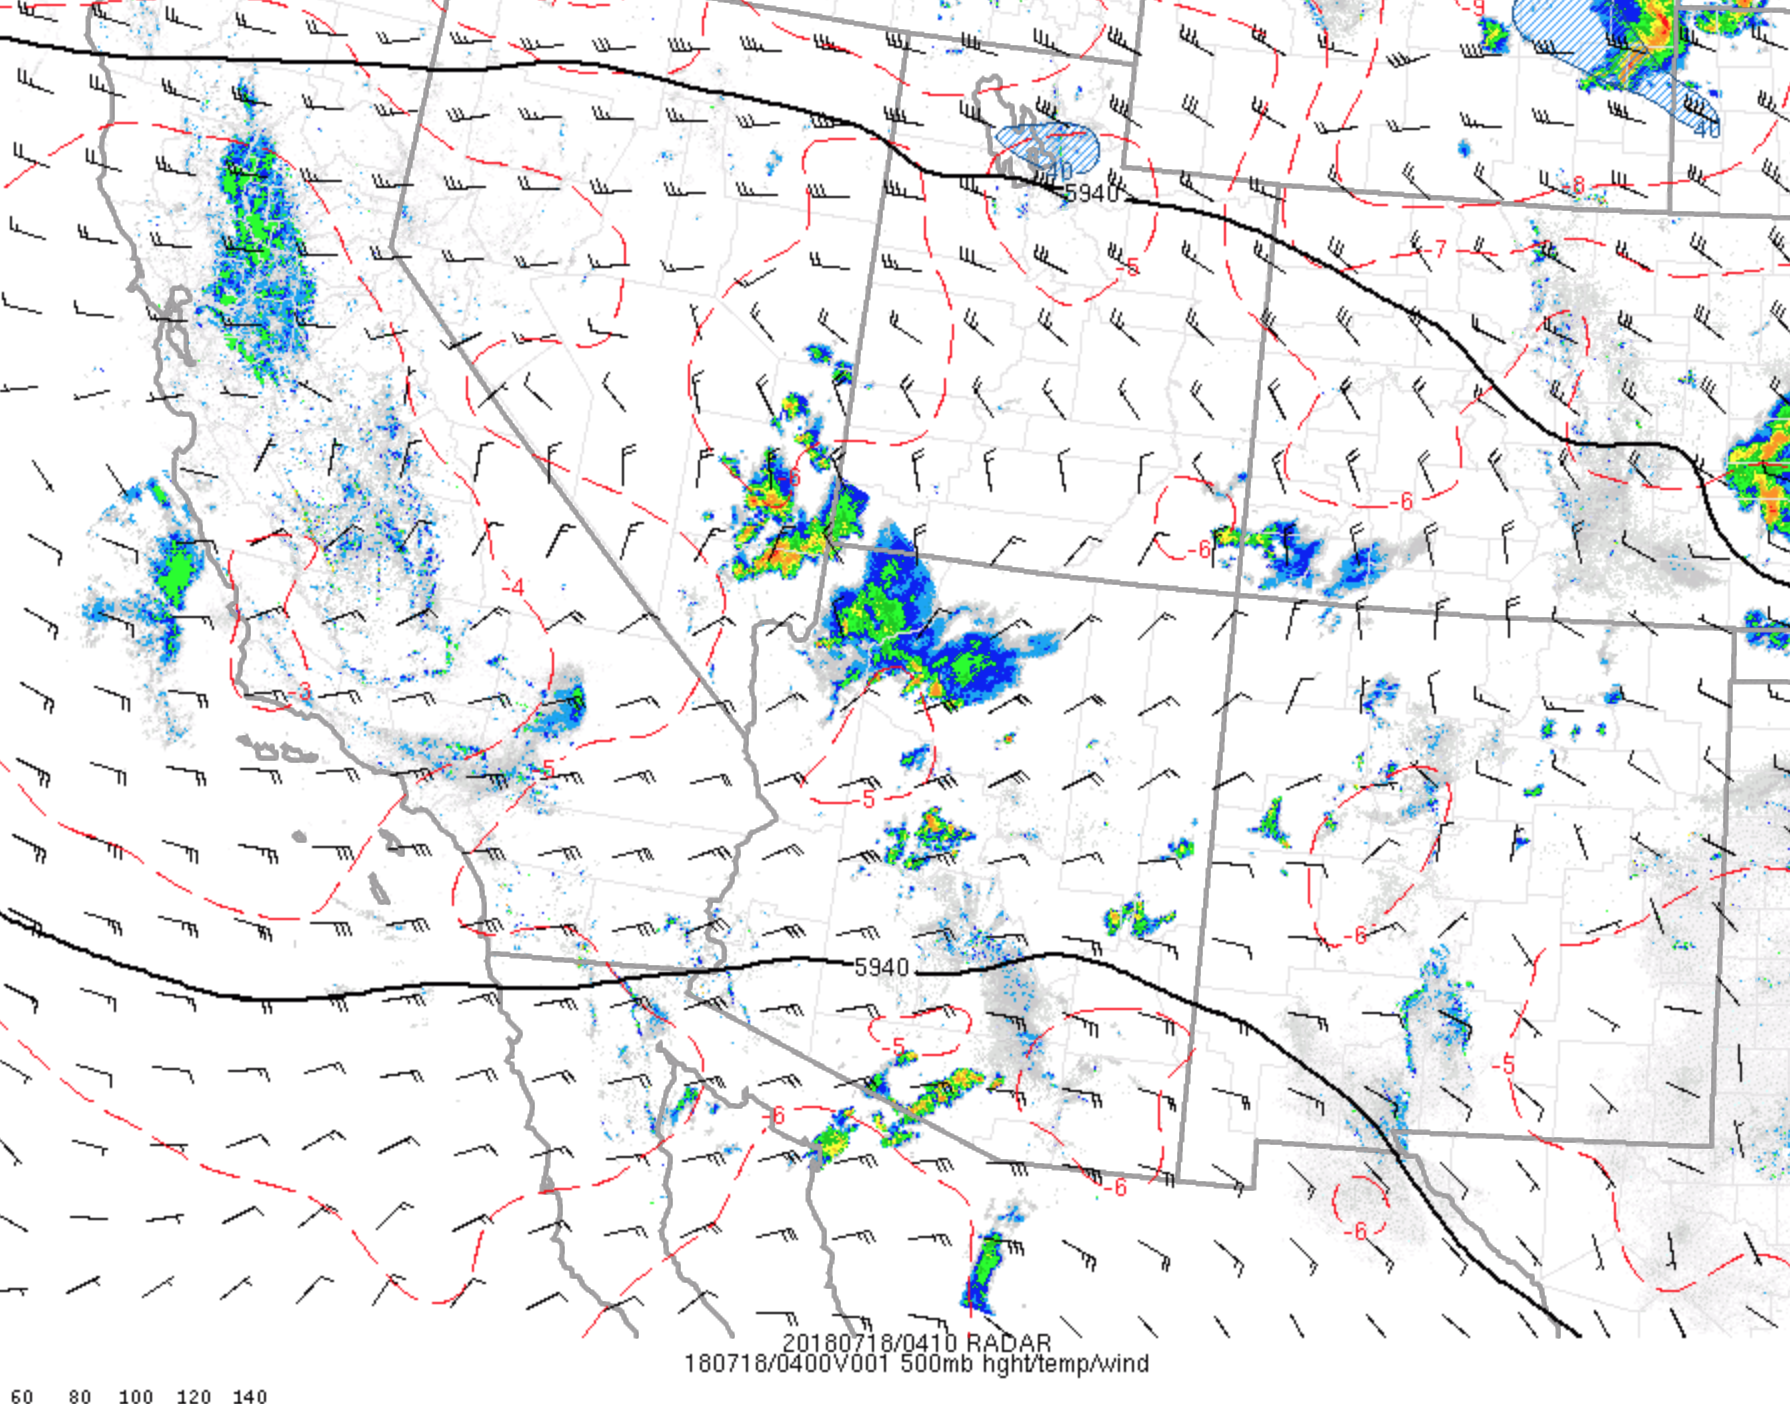
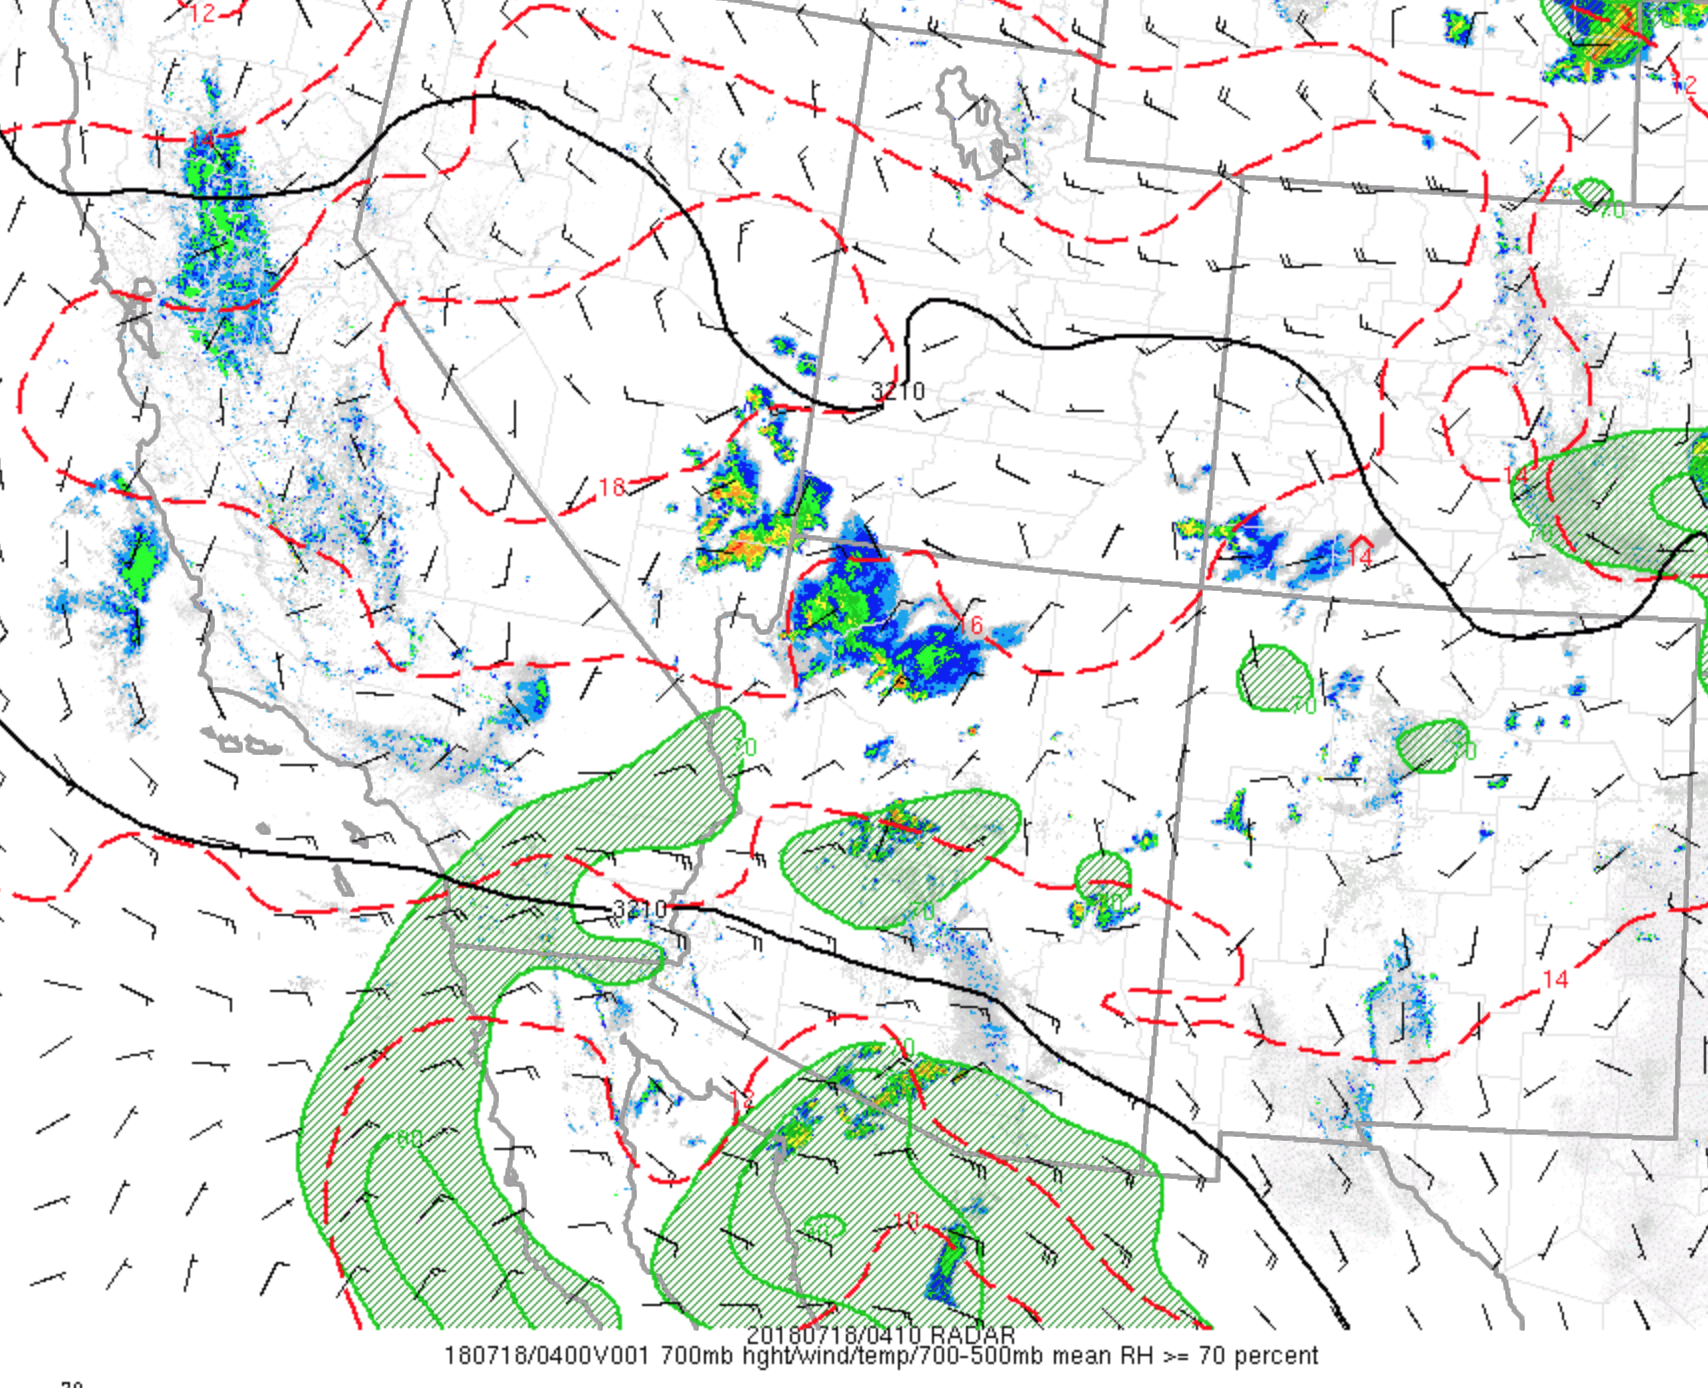

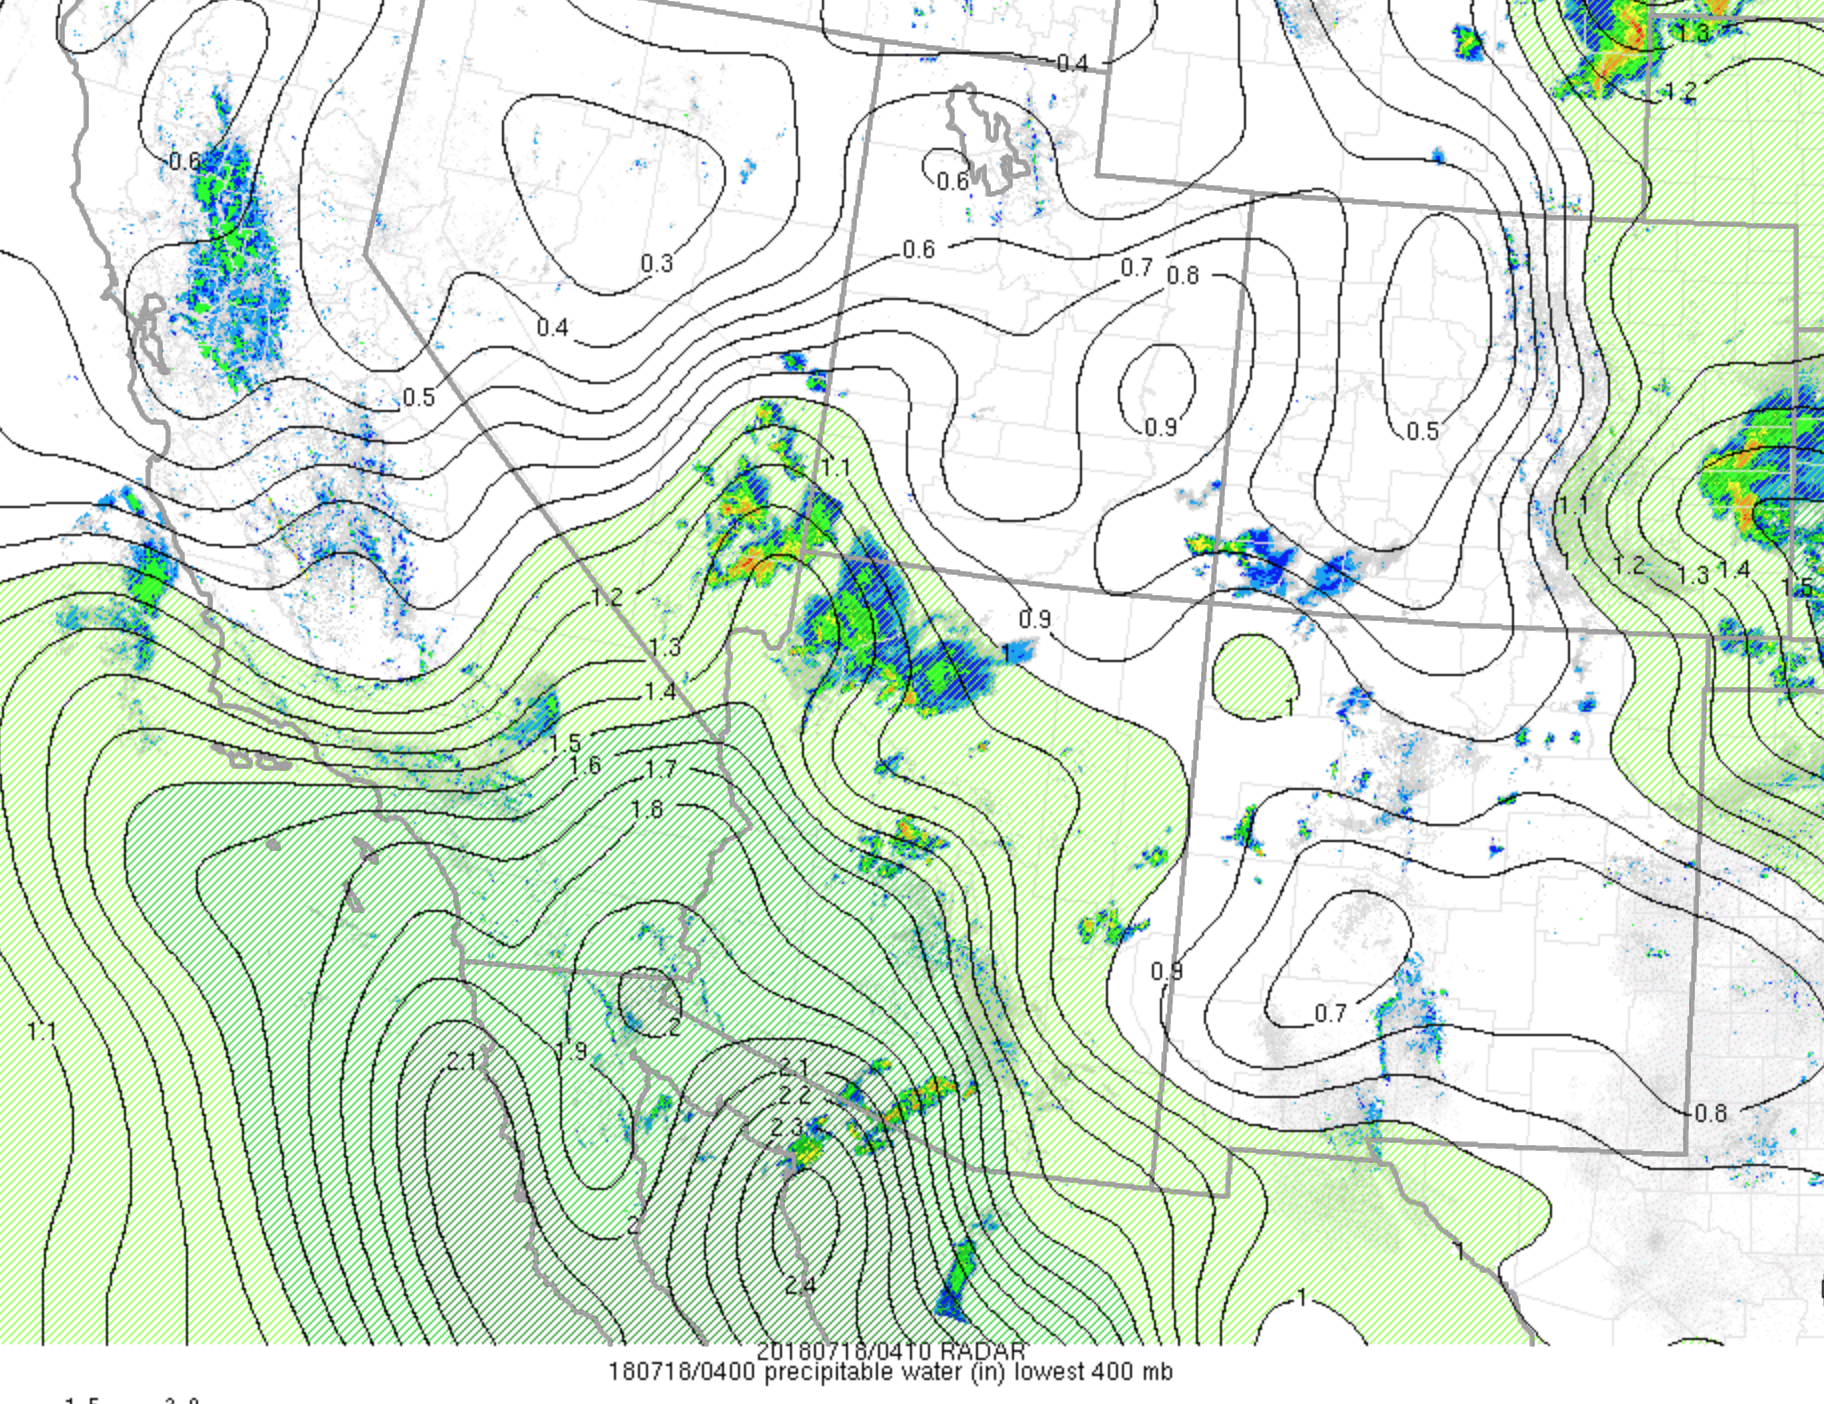
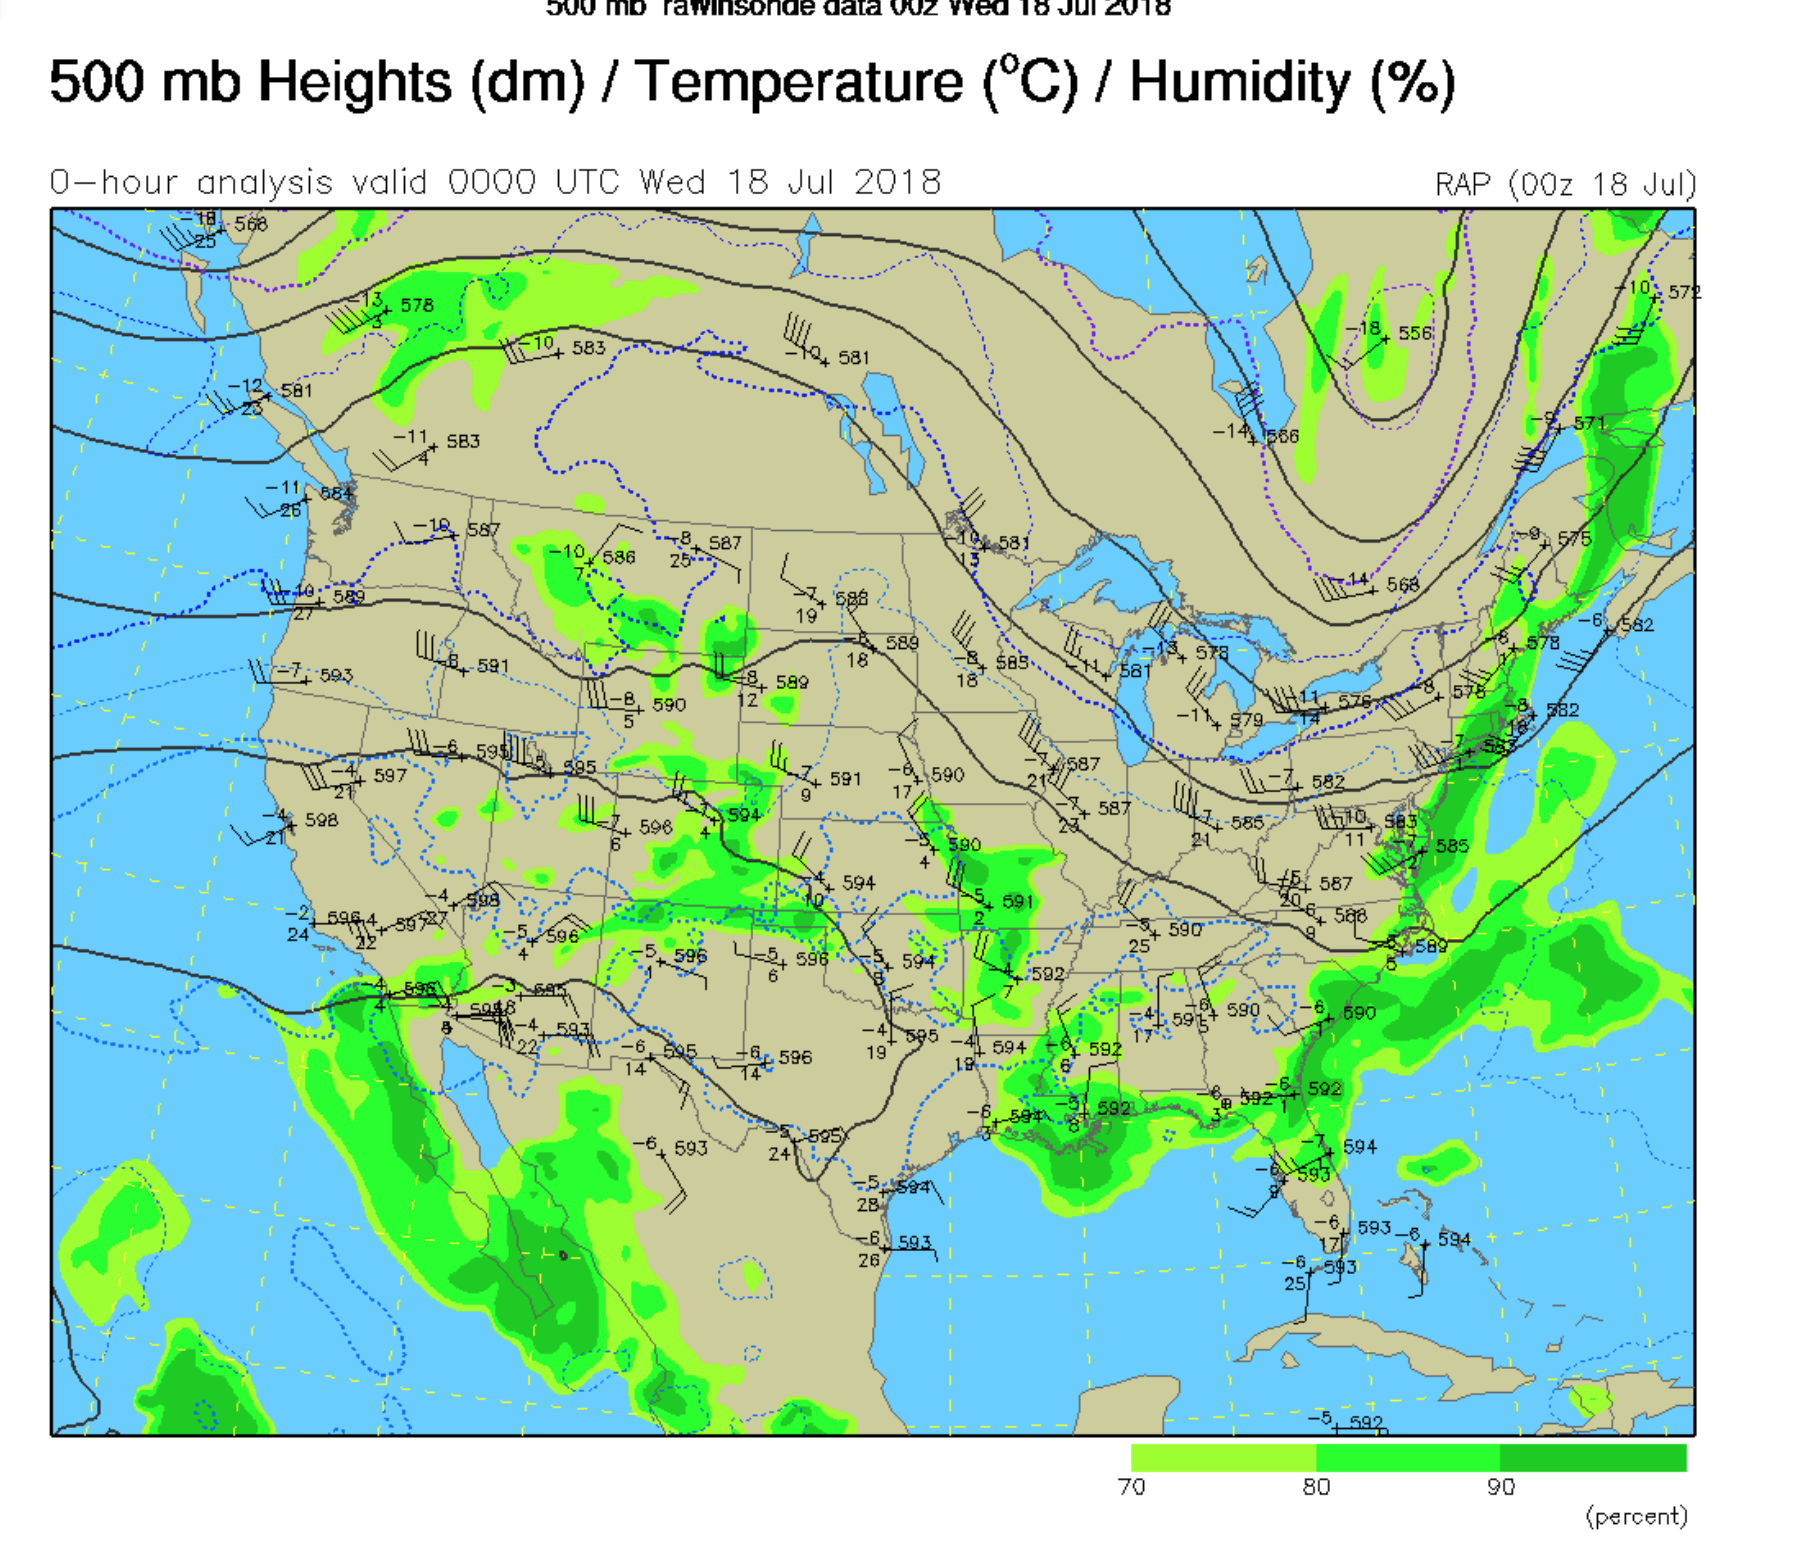
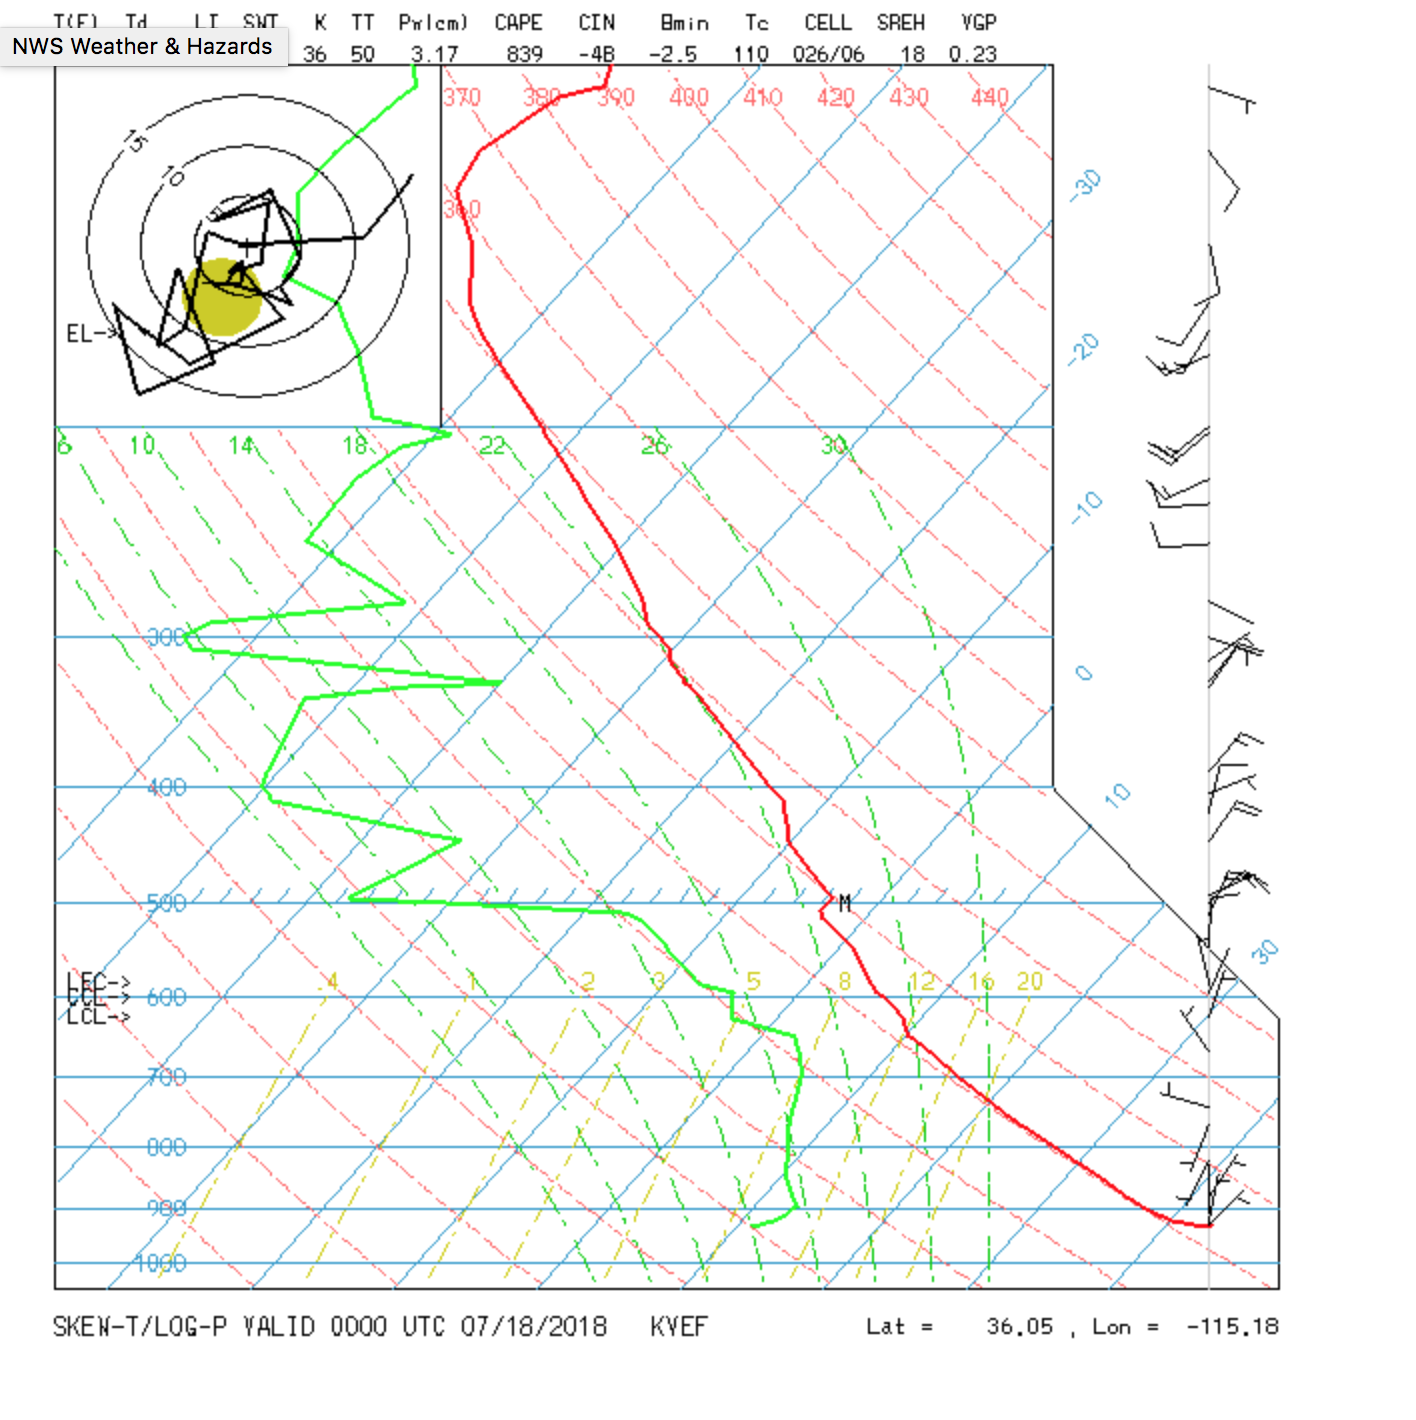

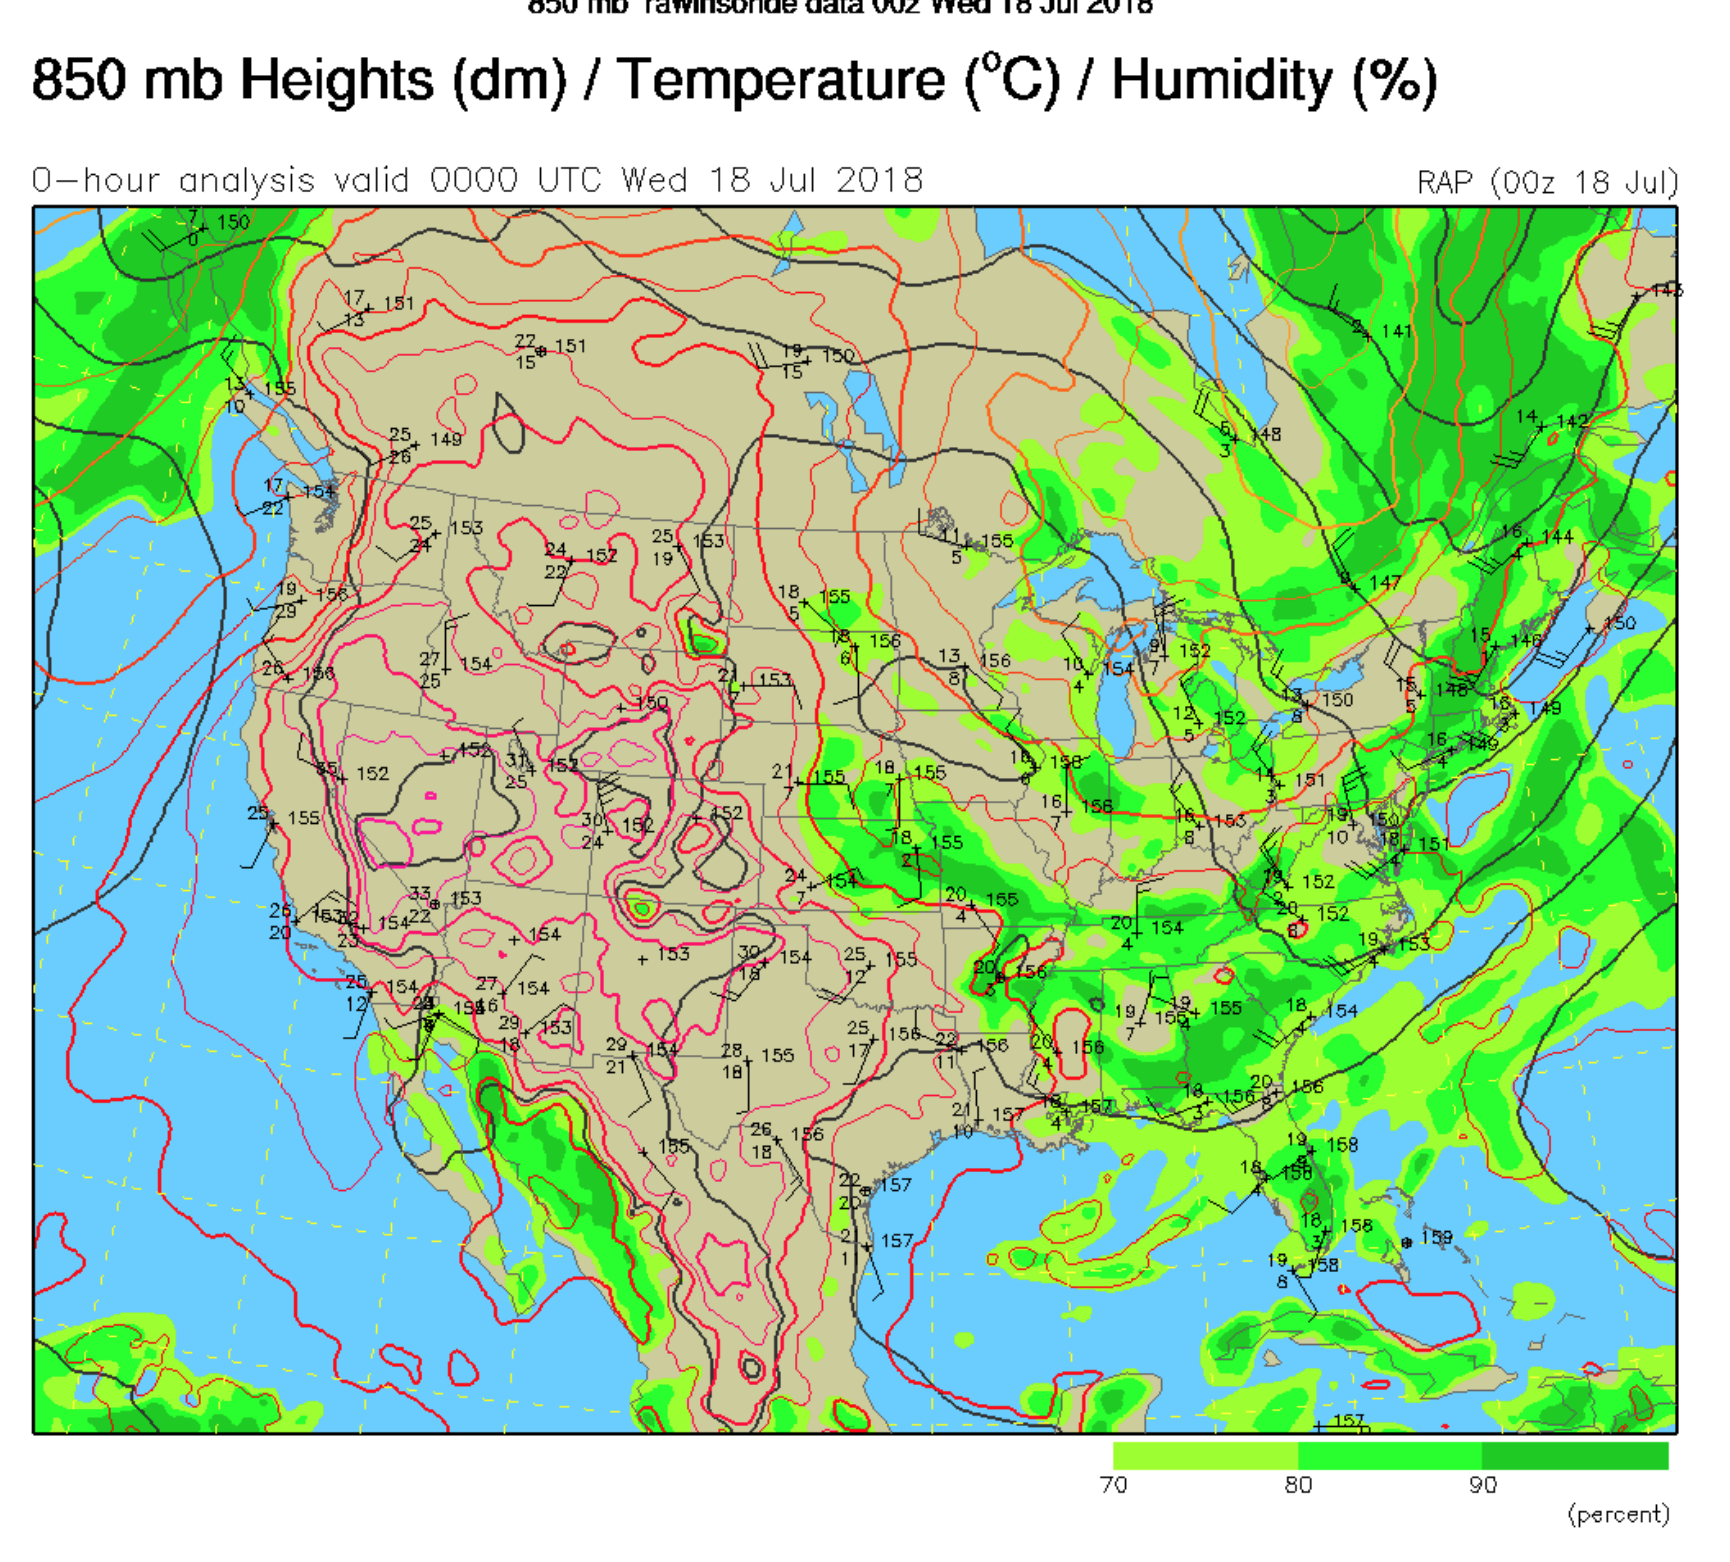
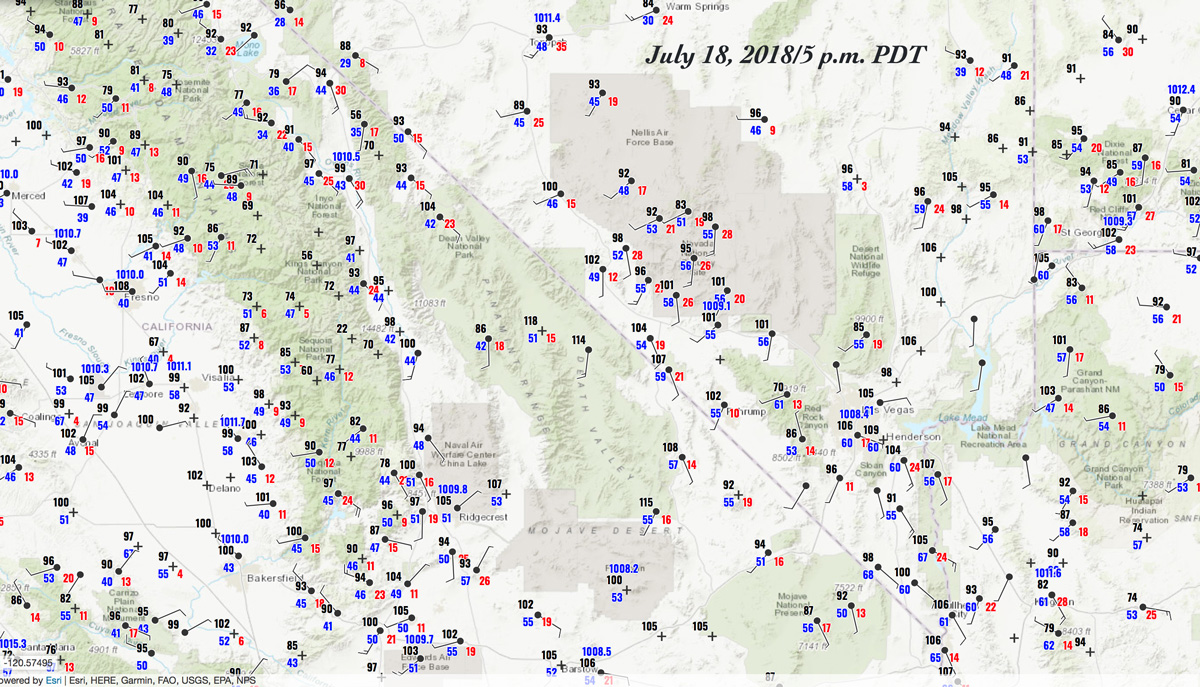
July 18
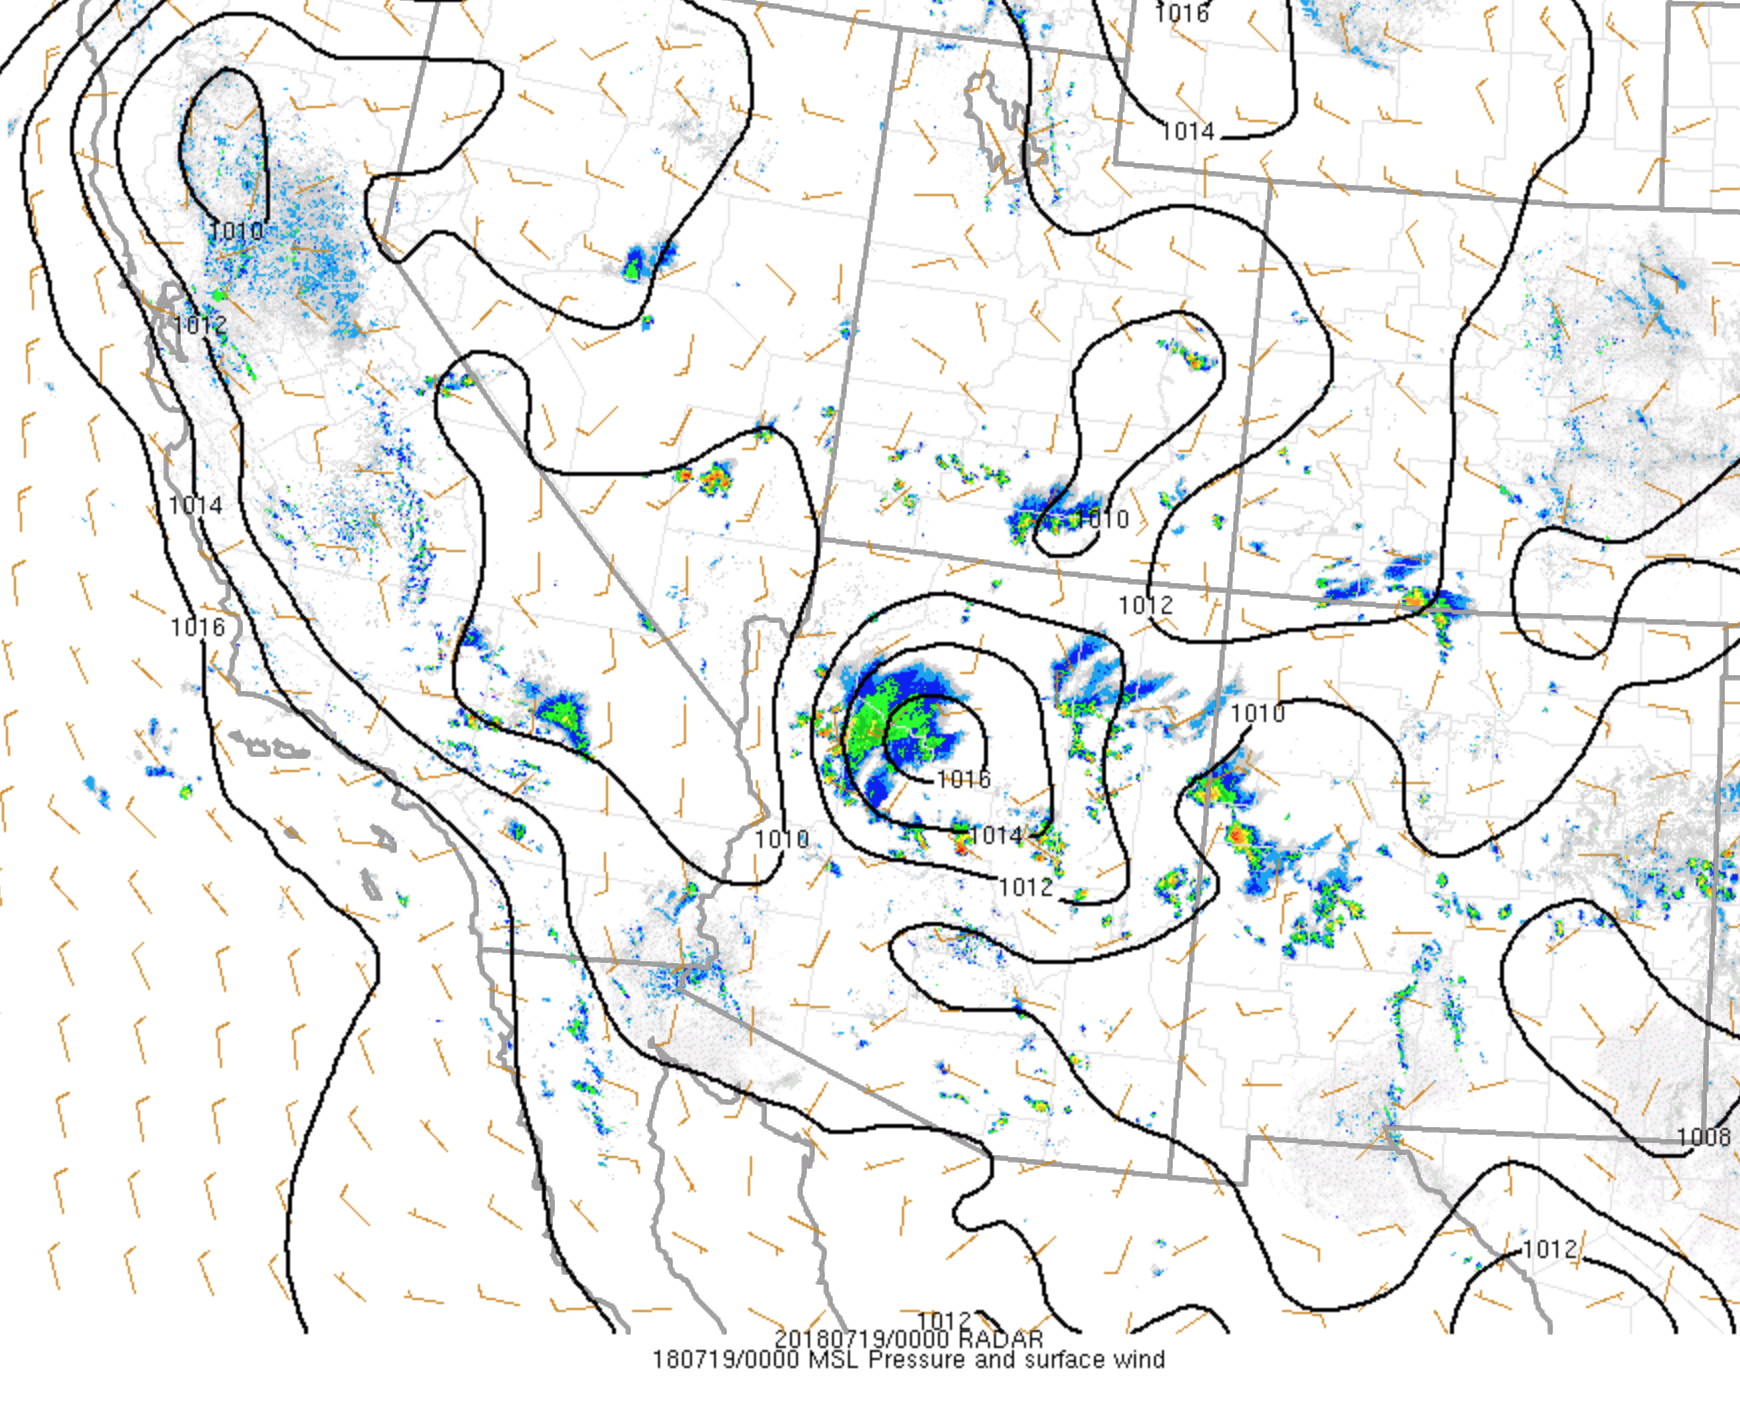
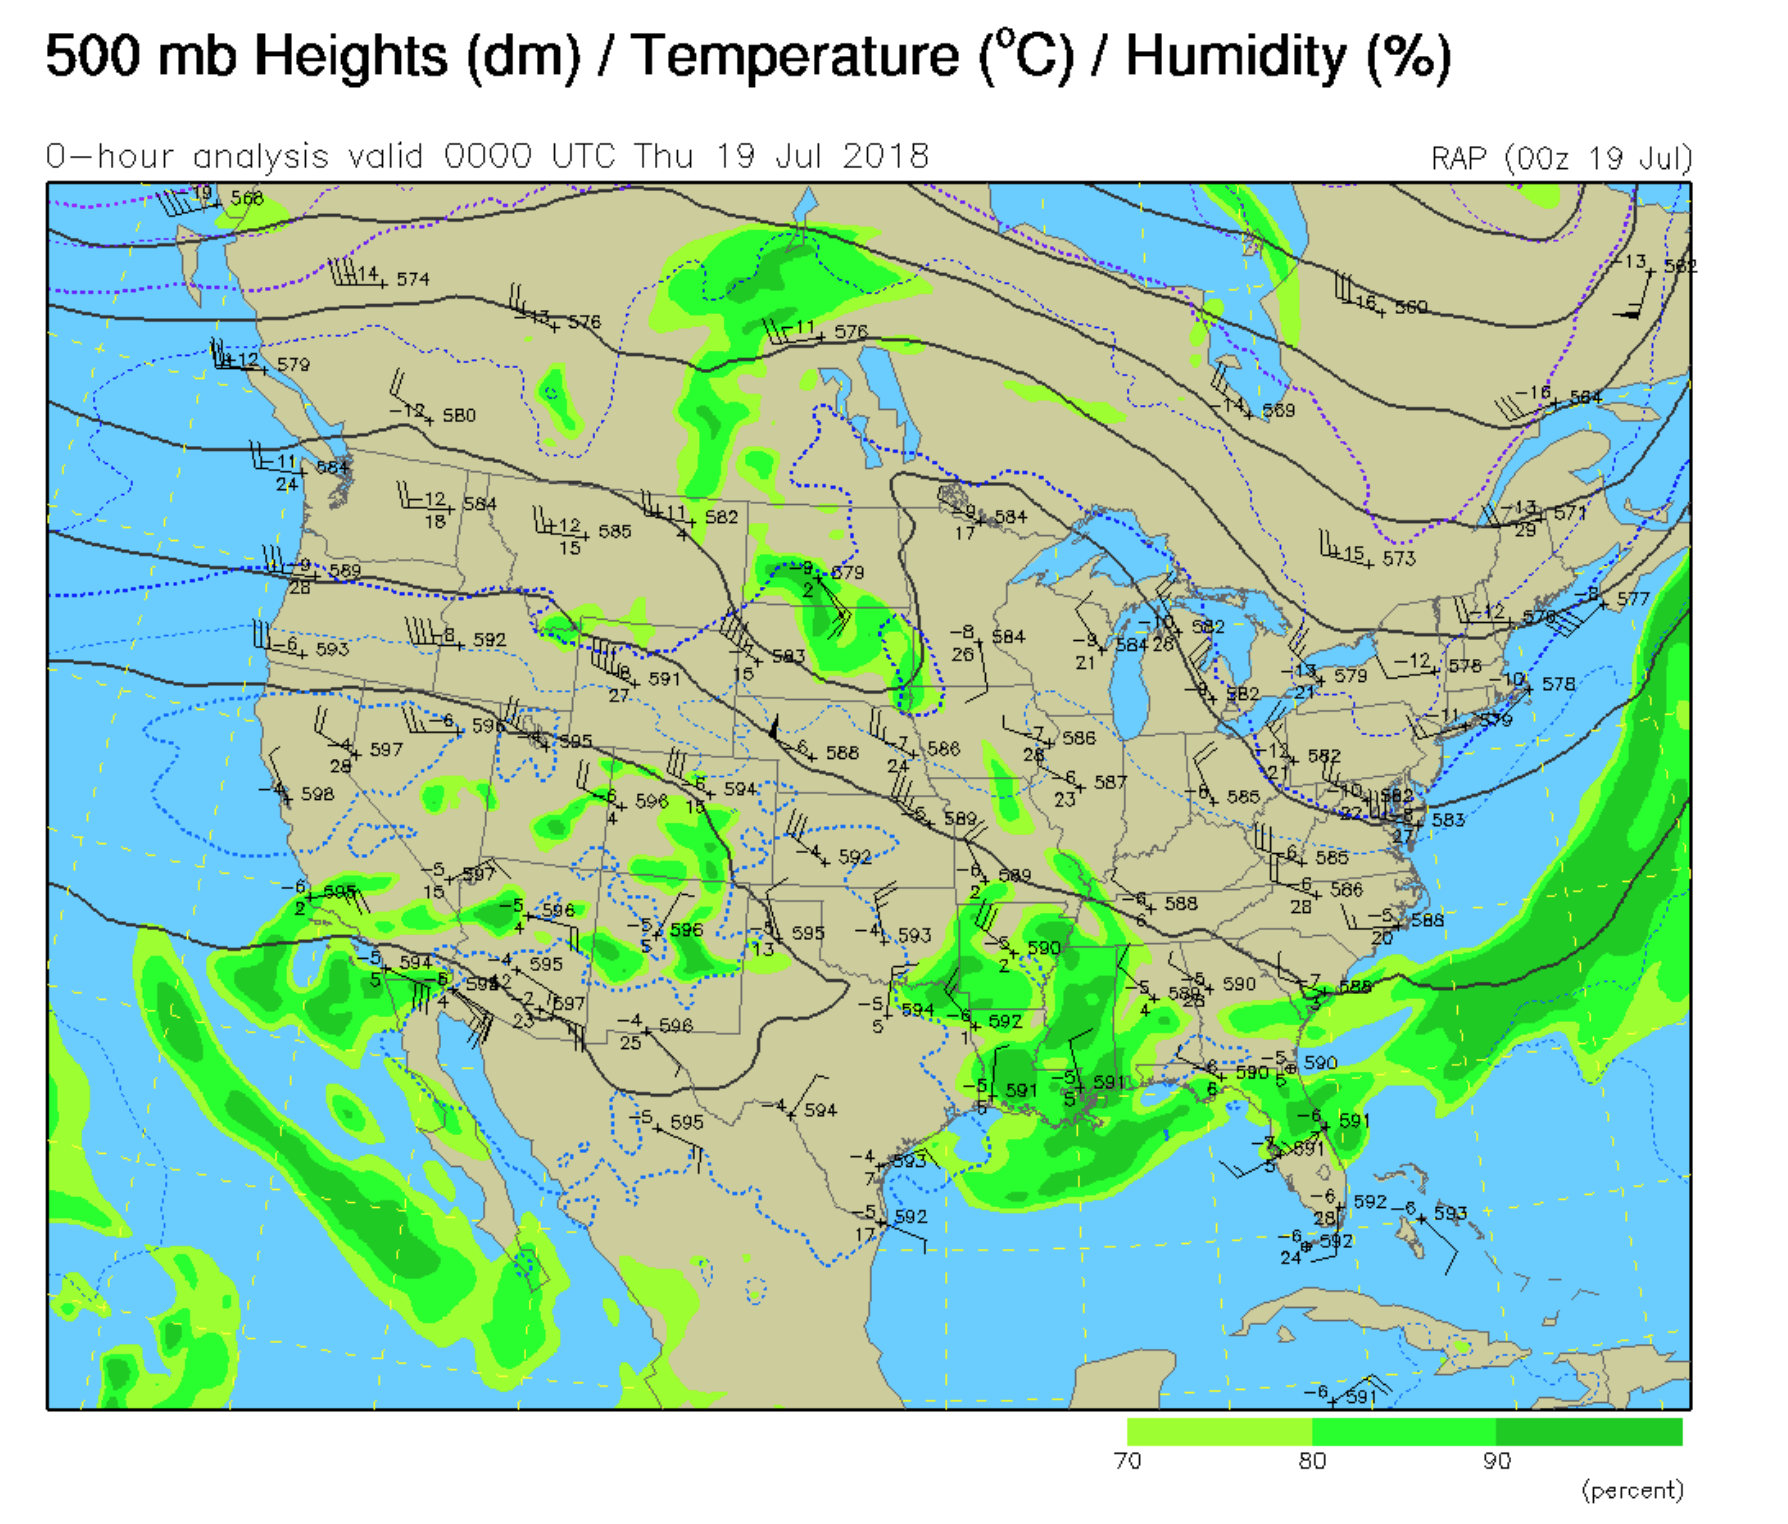

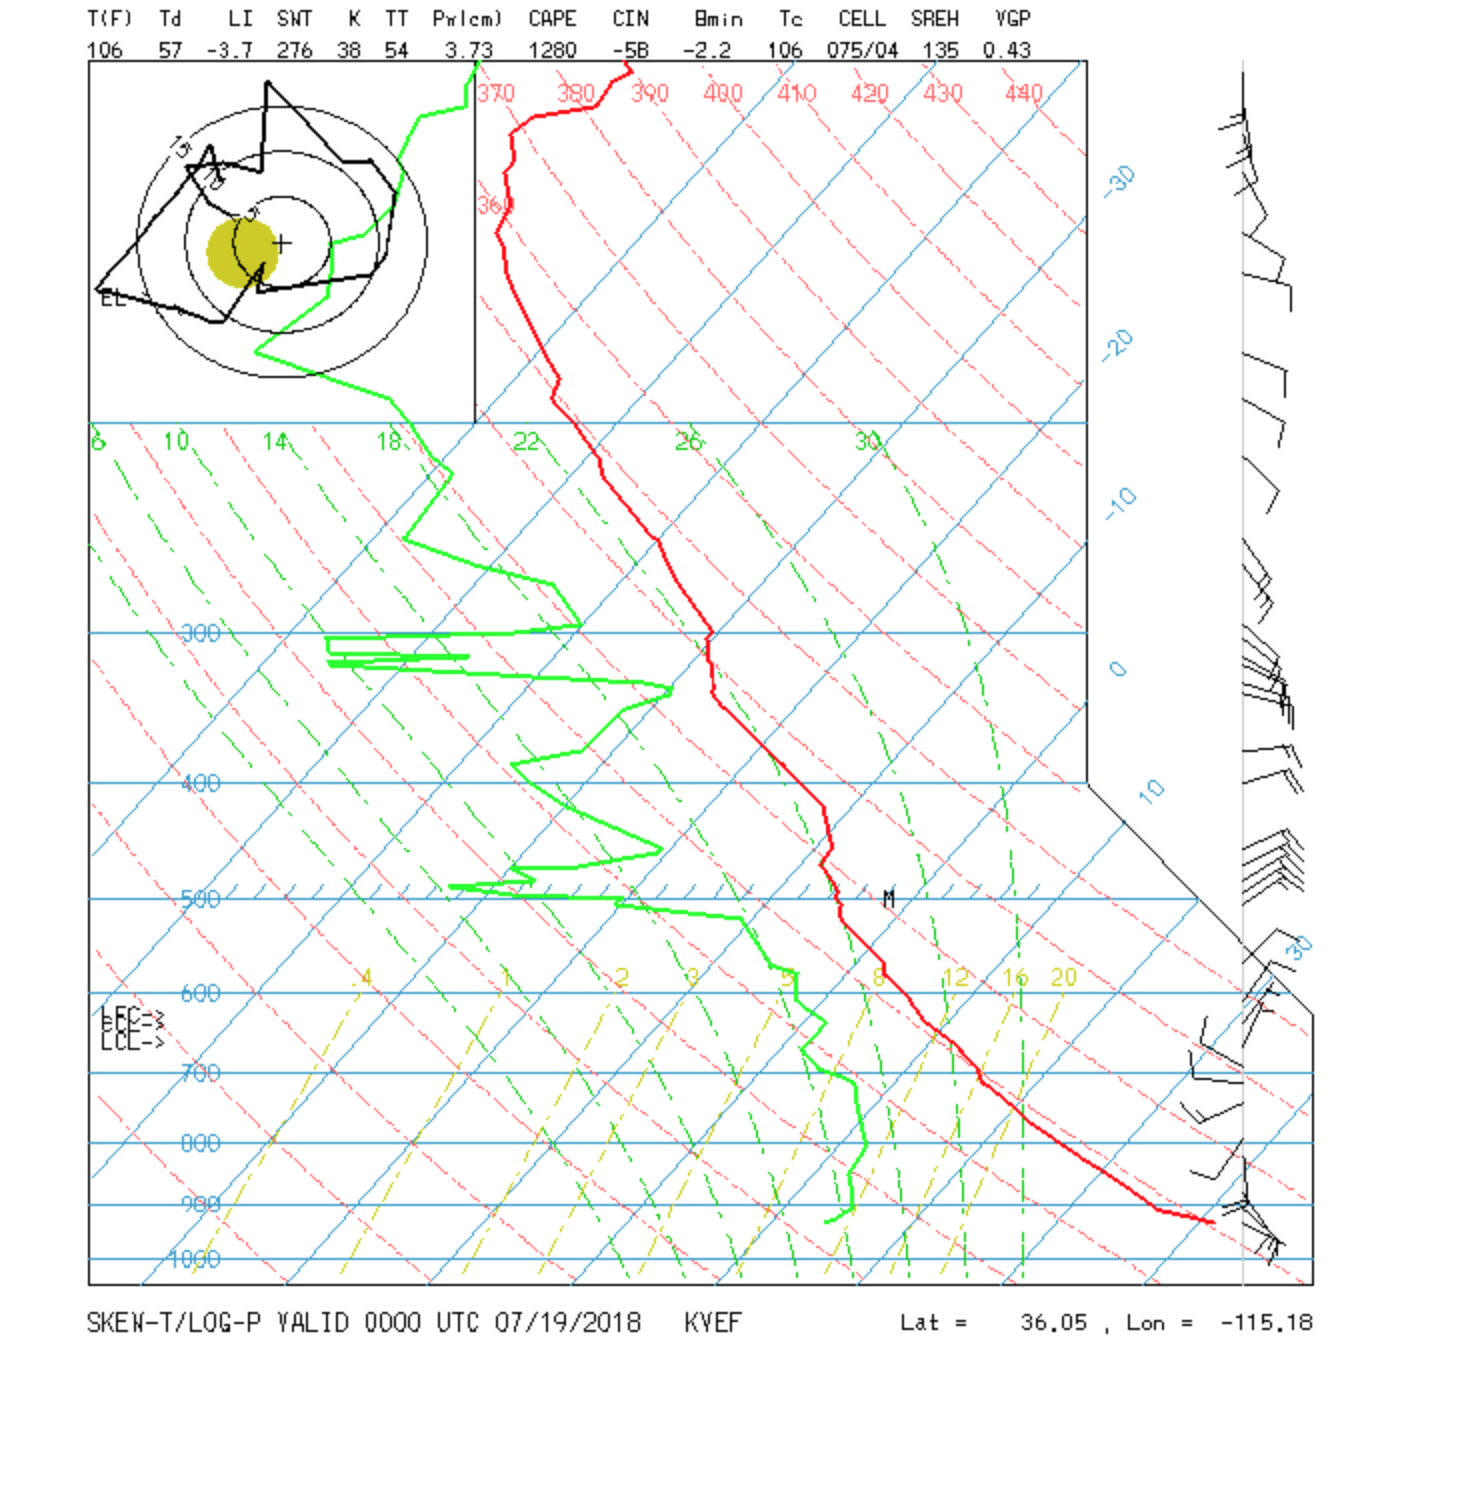
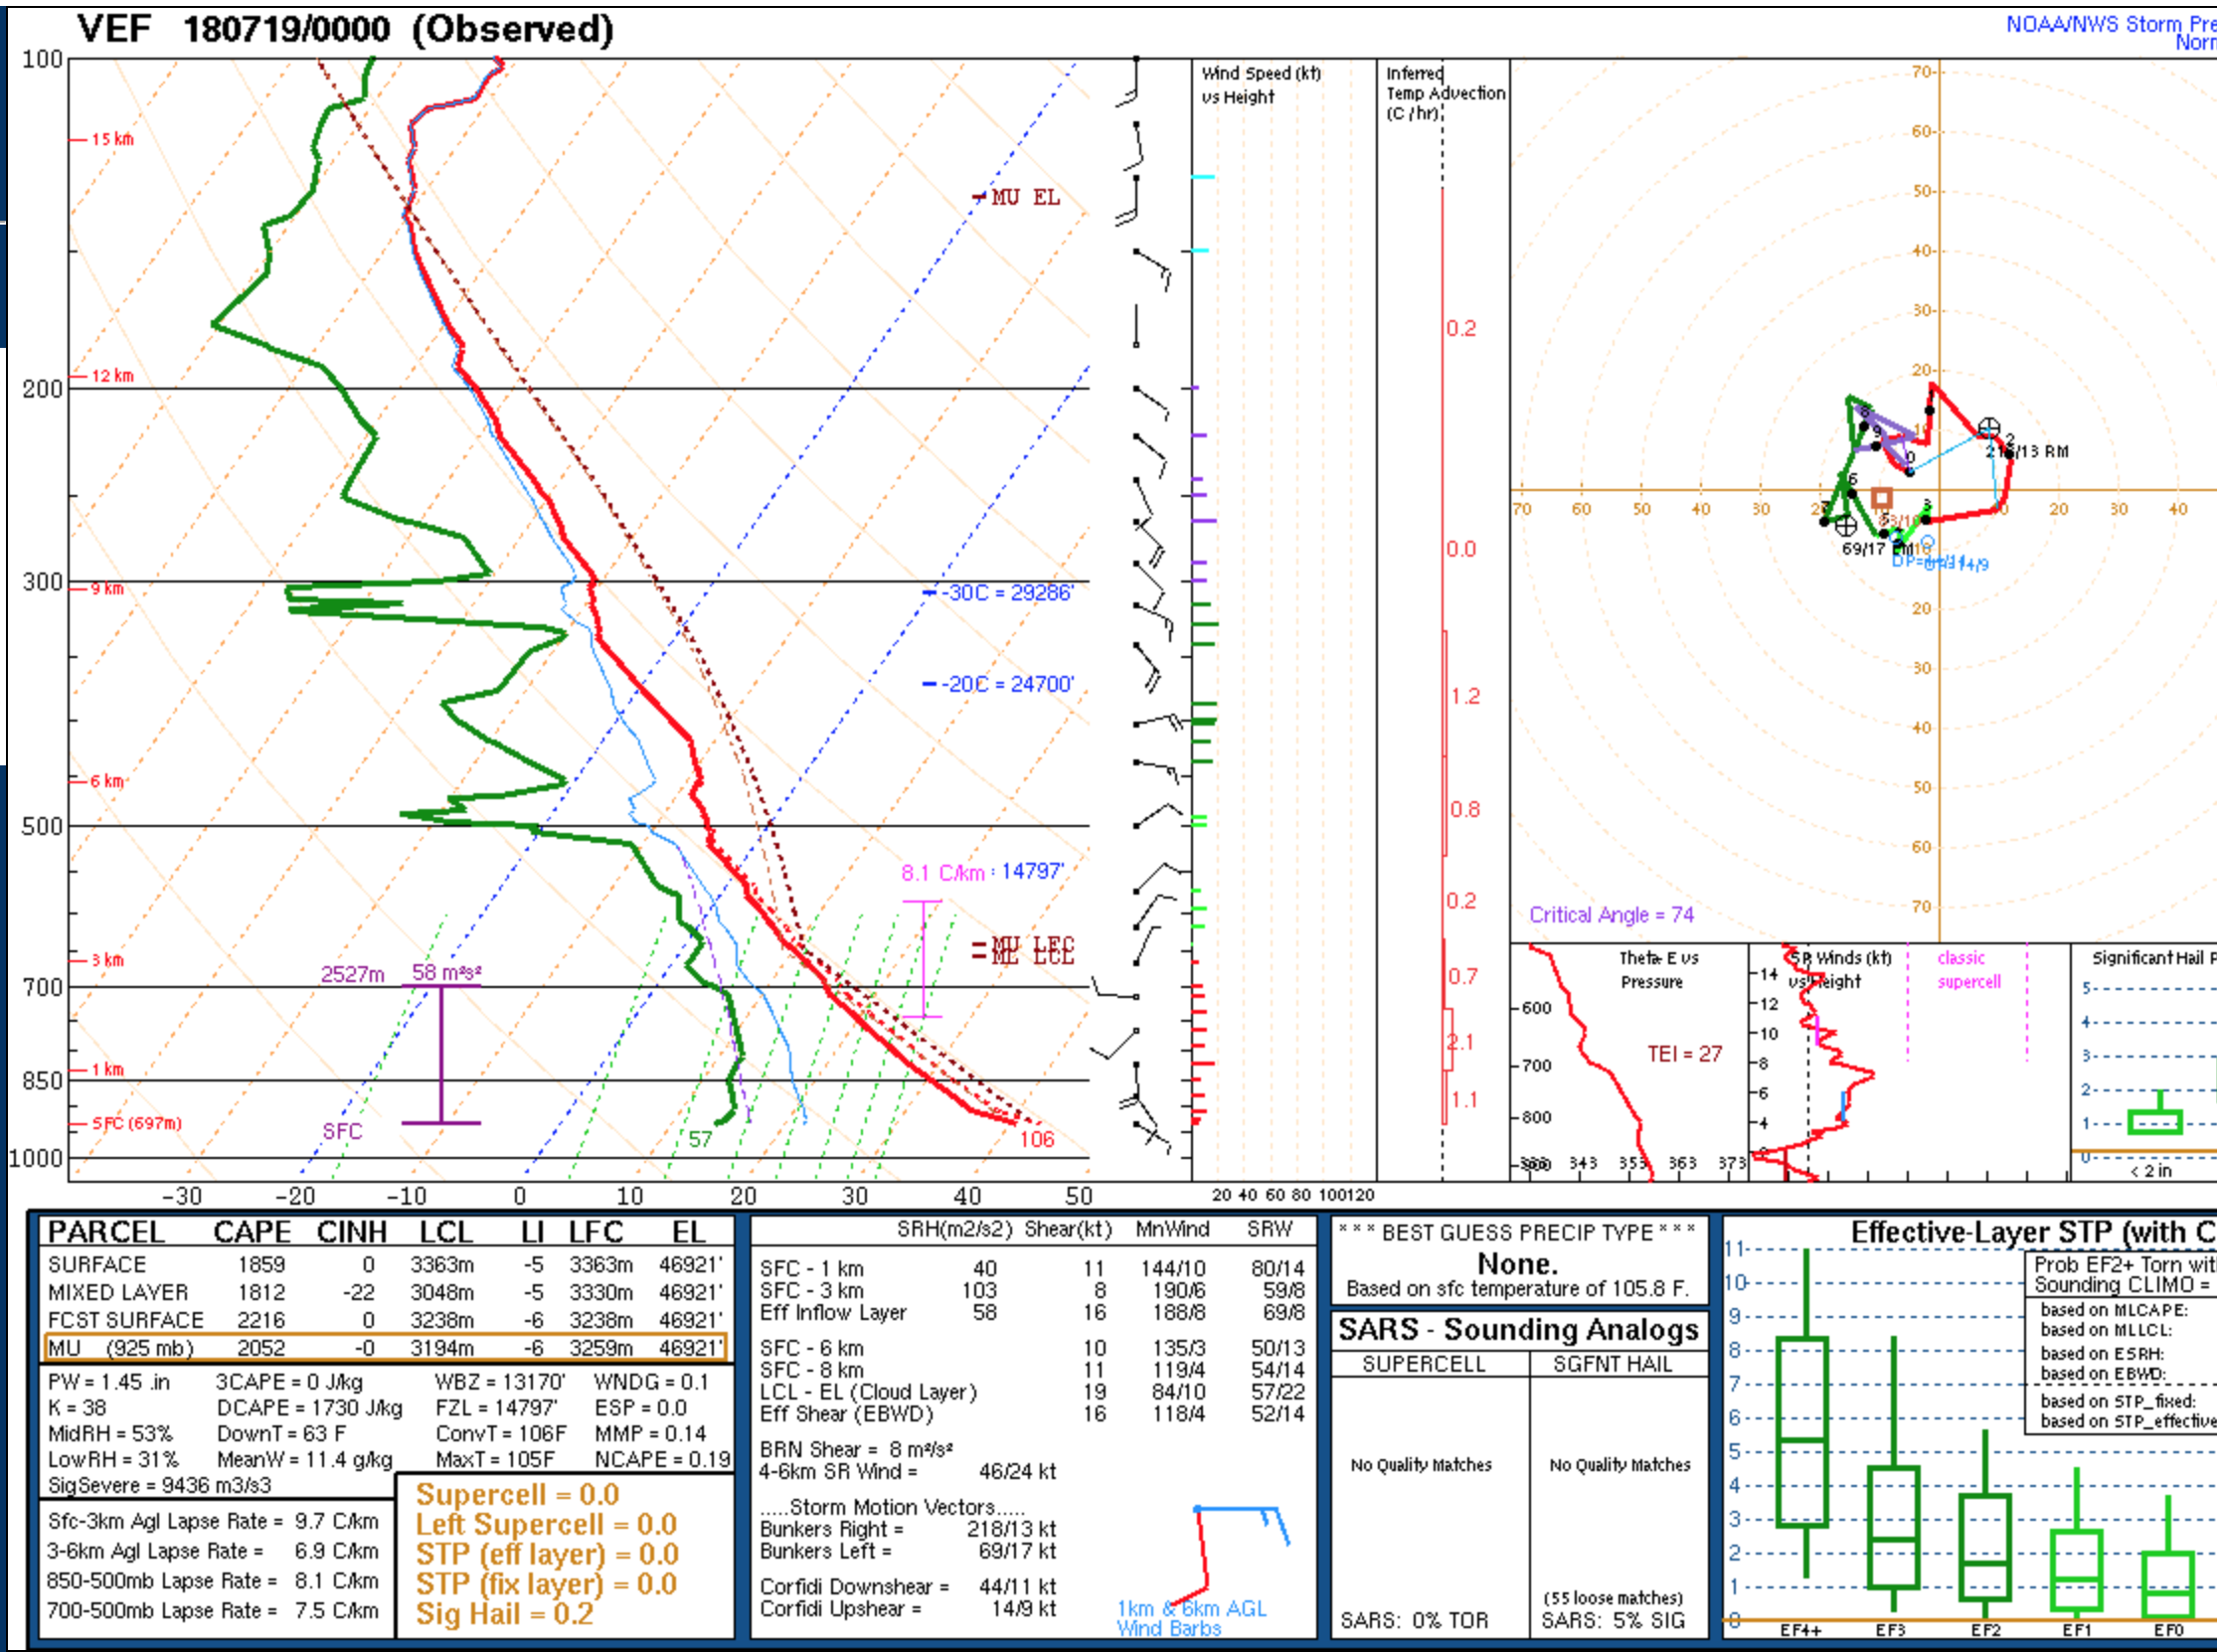
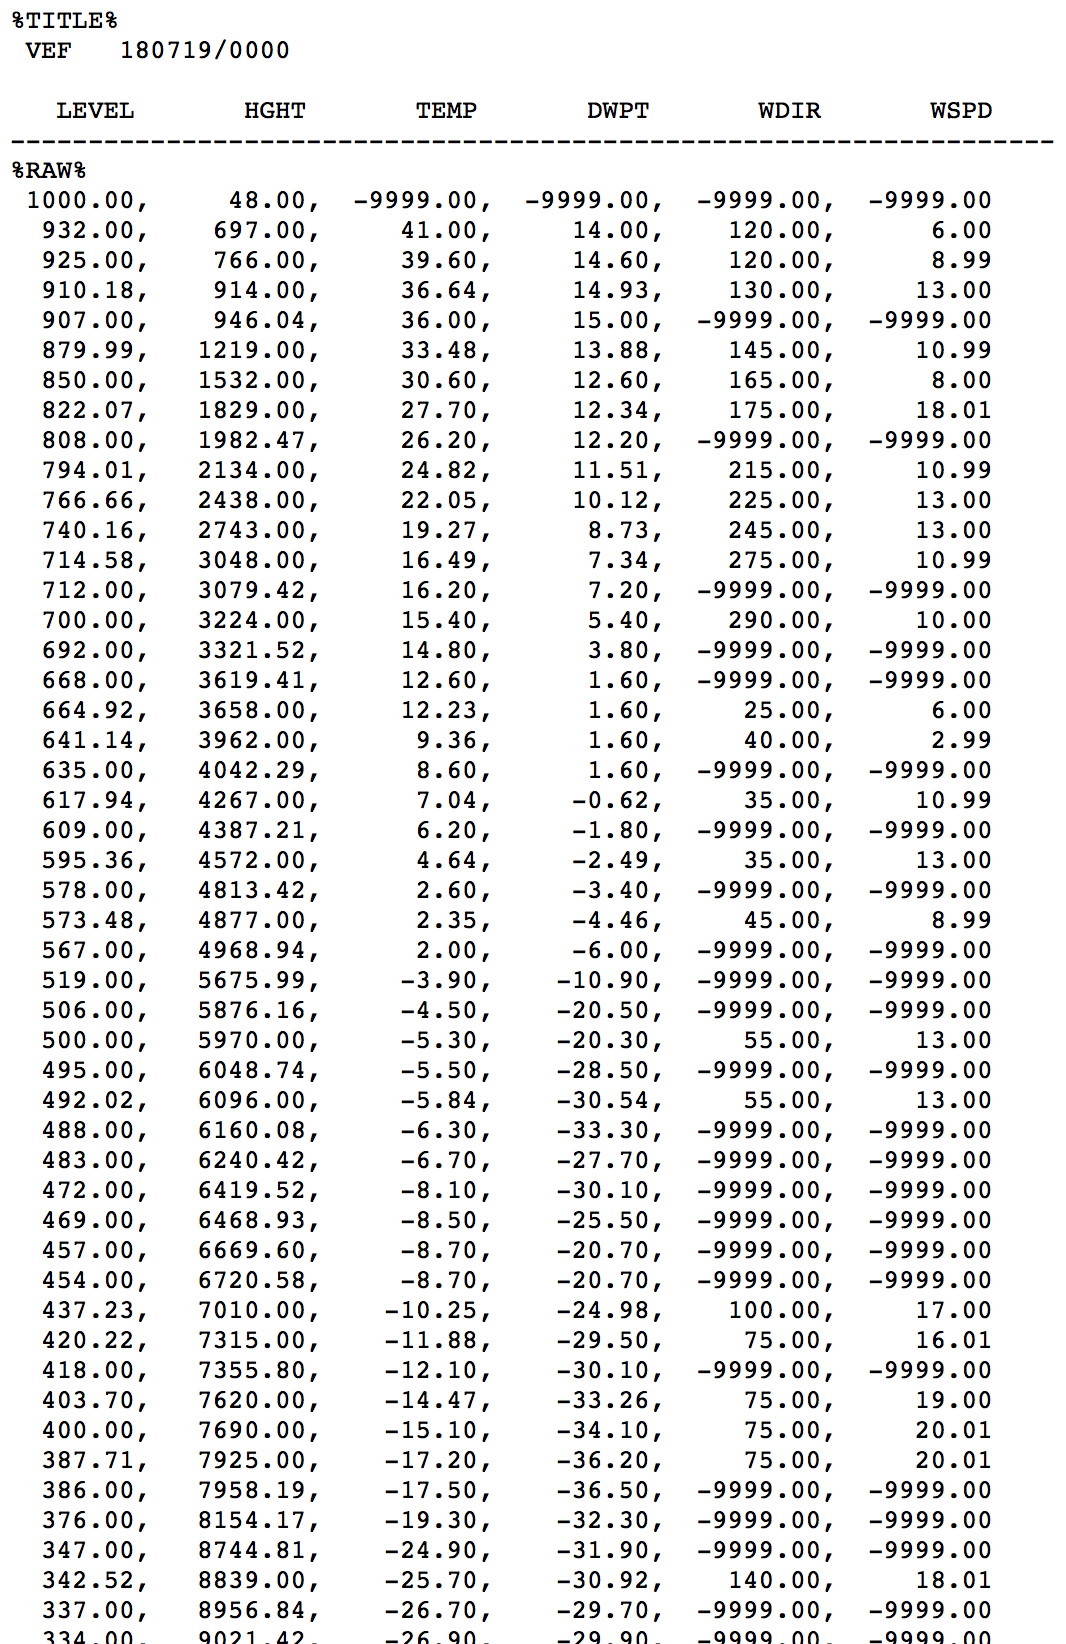
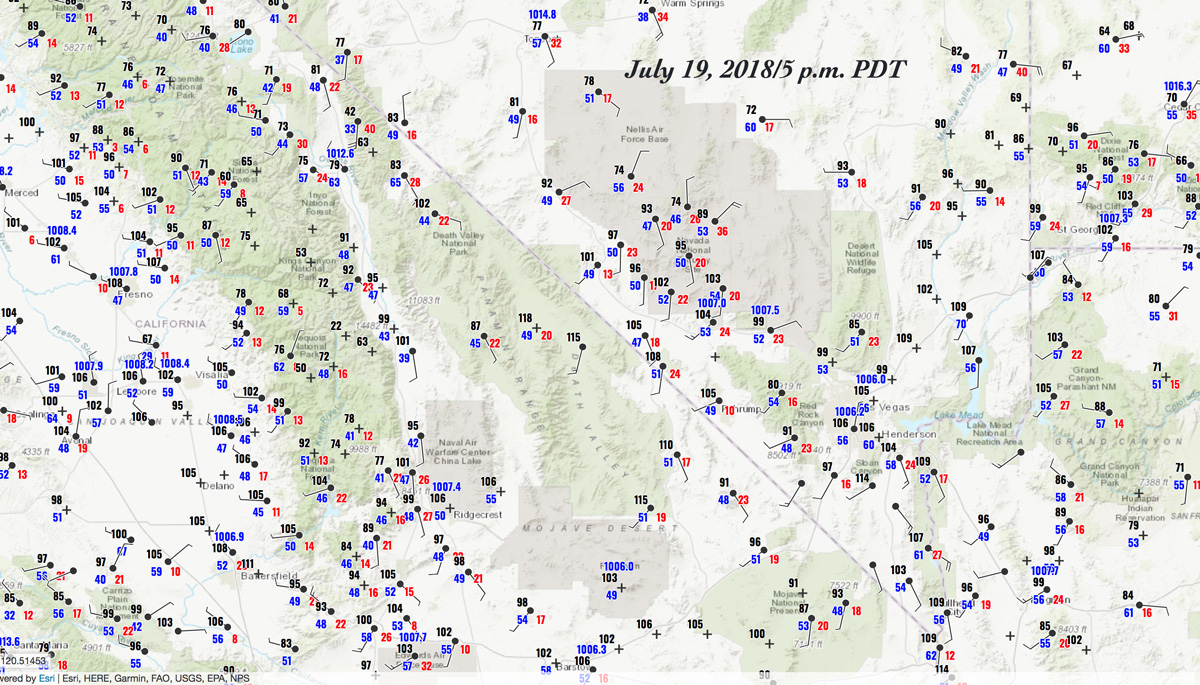
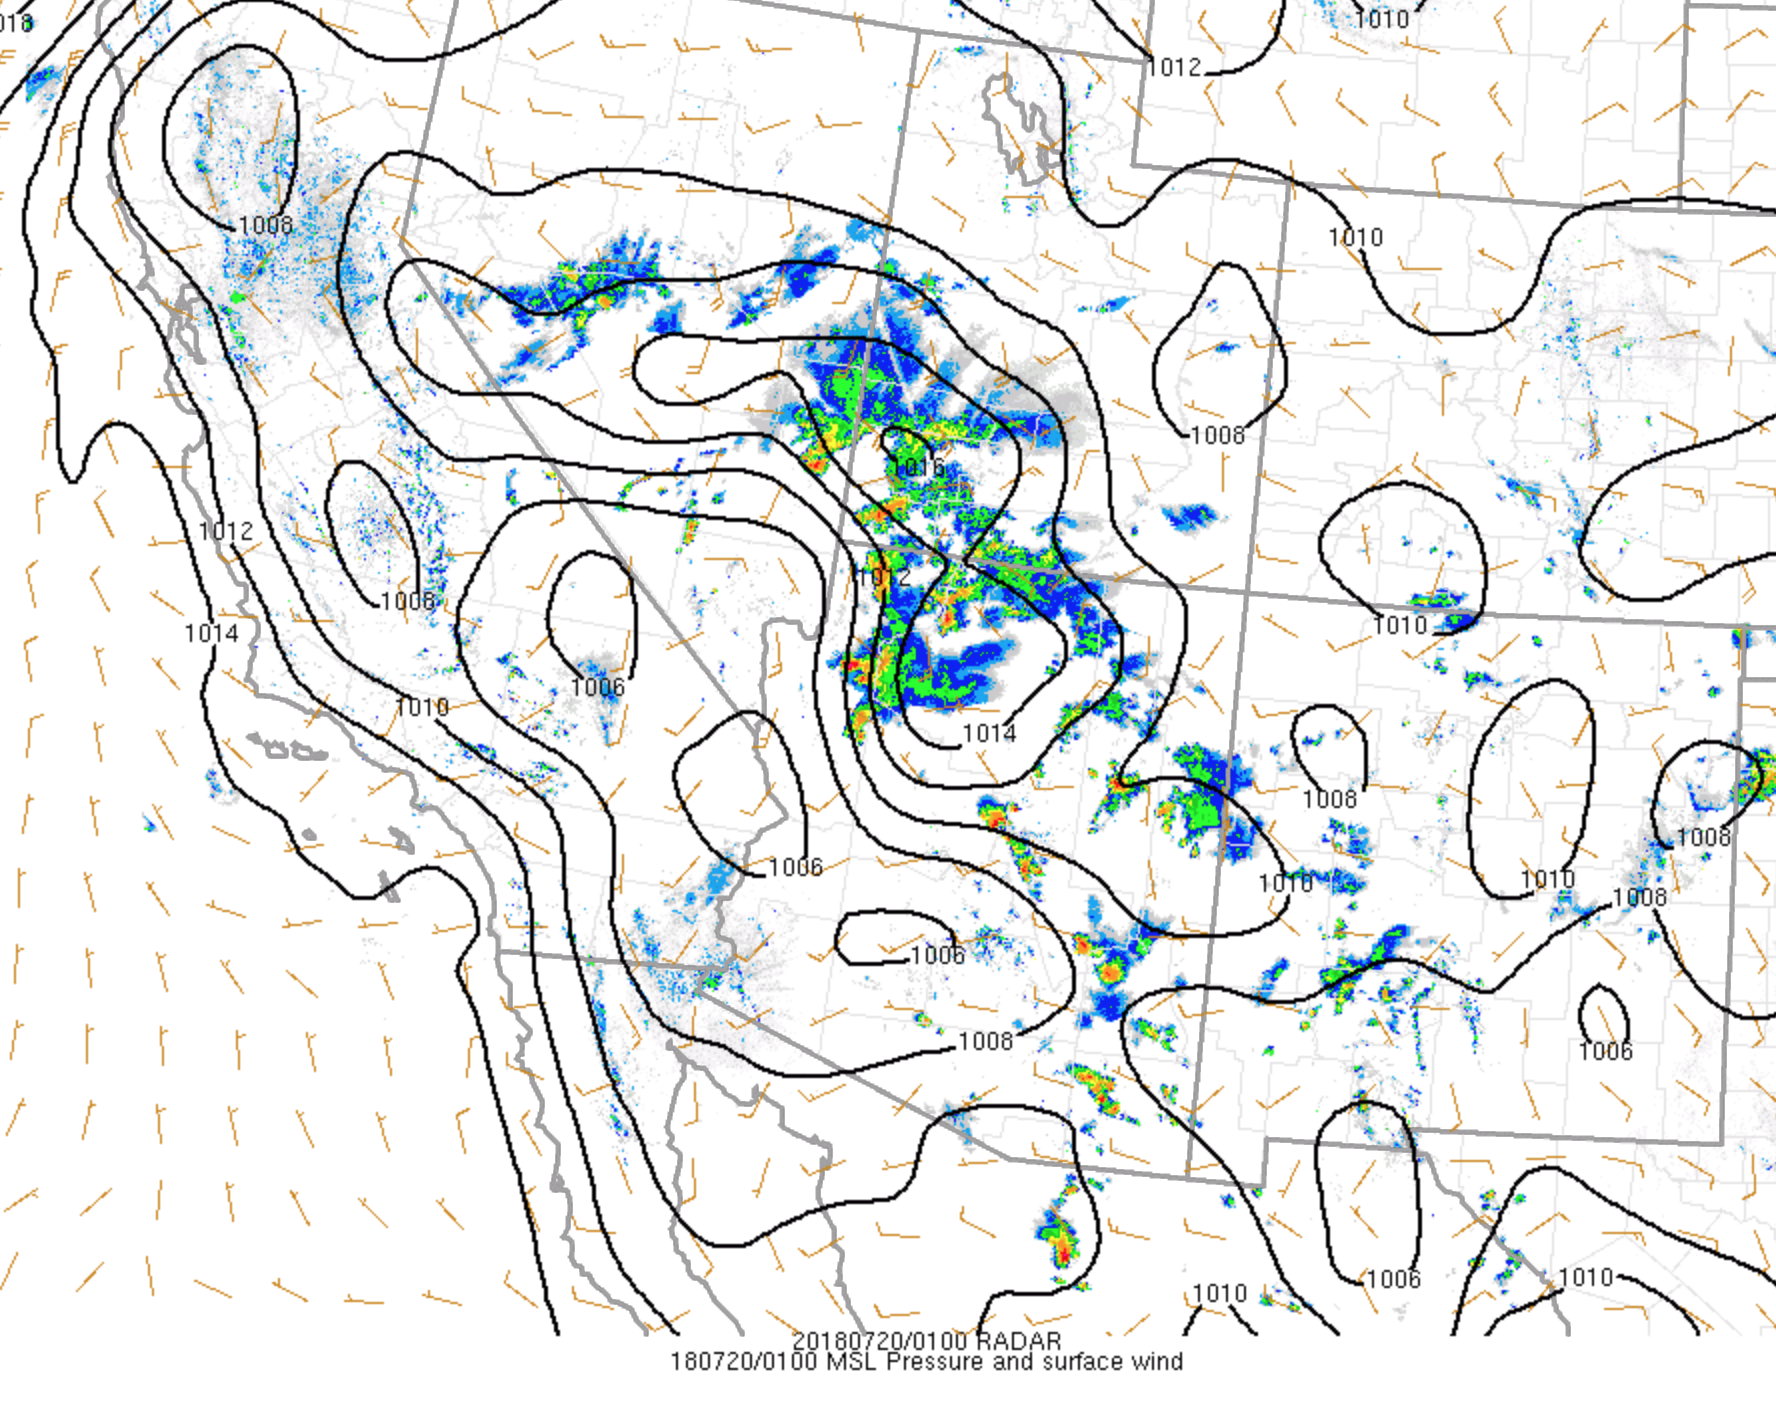
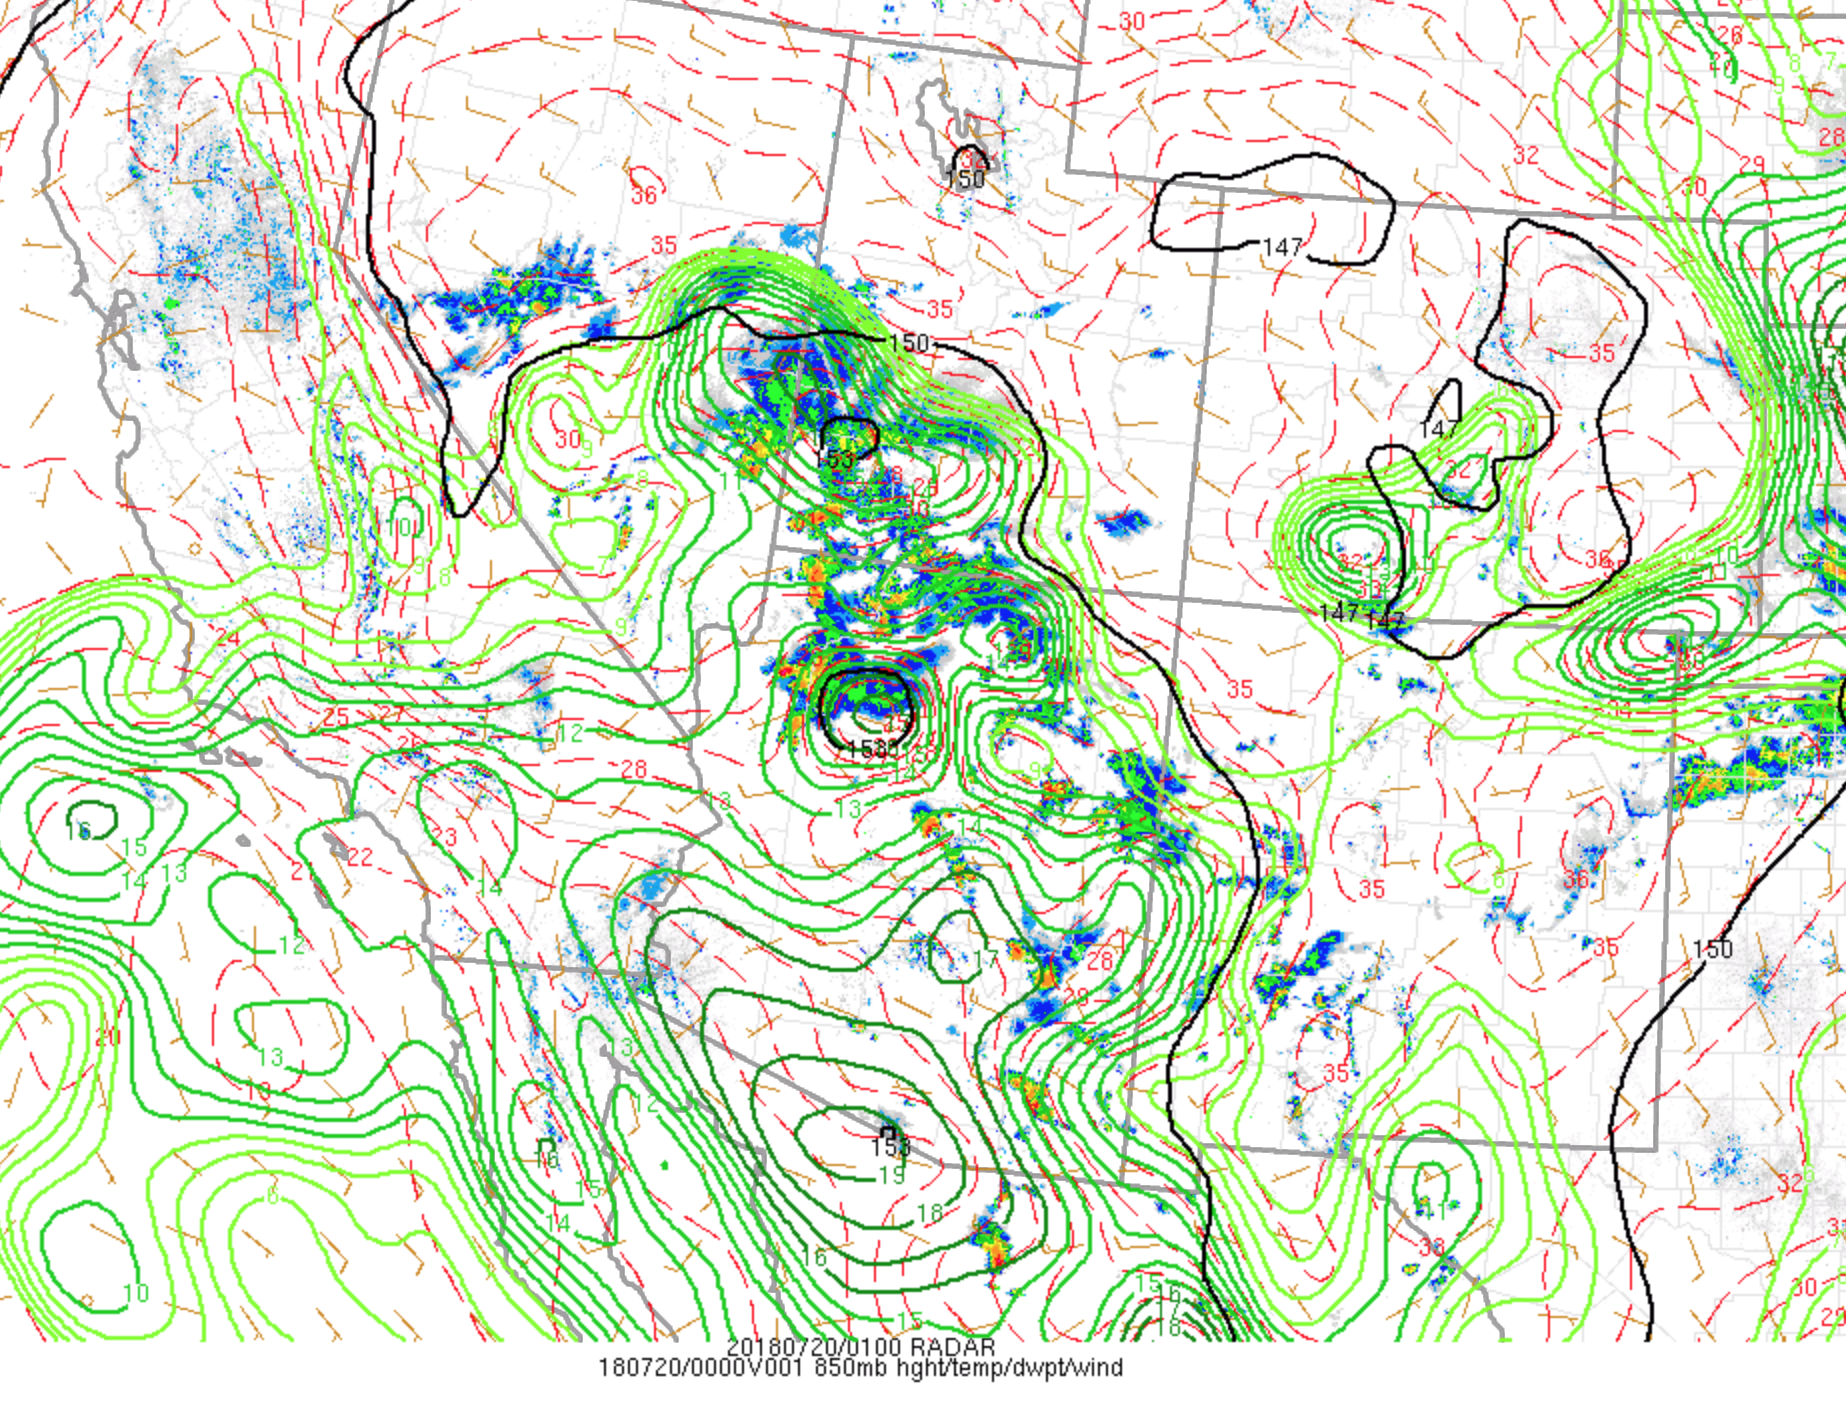
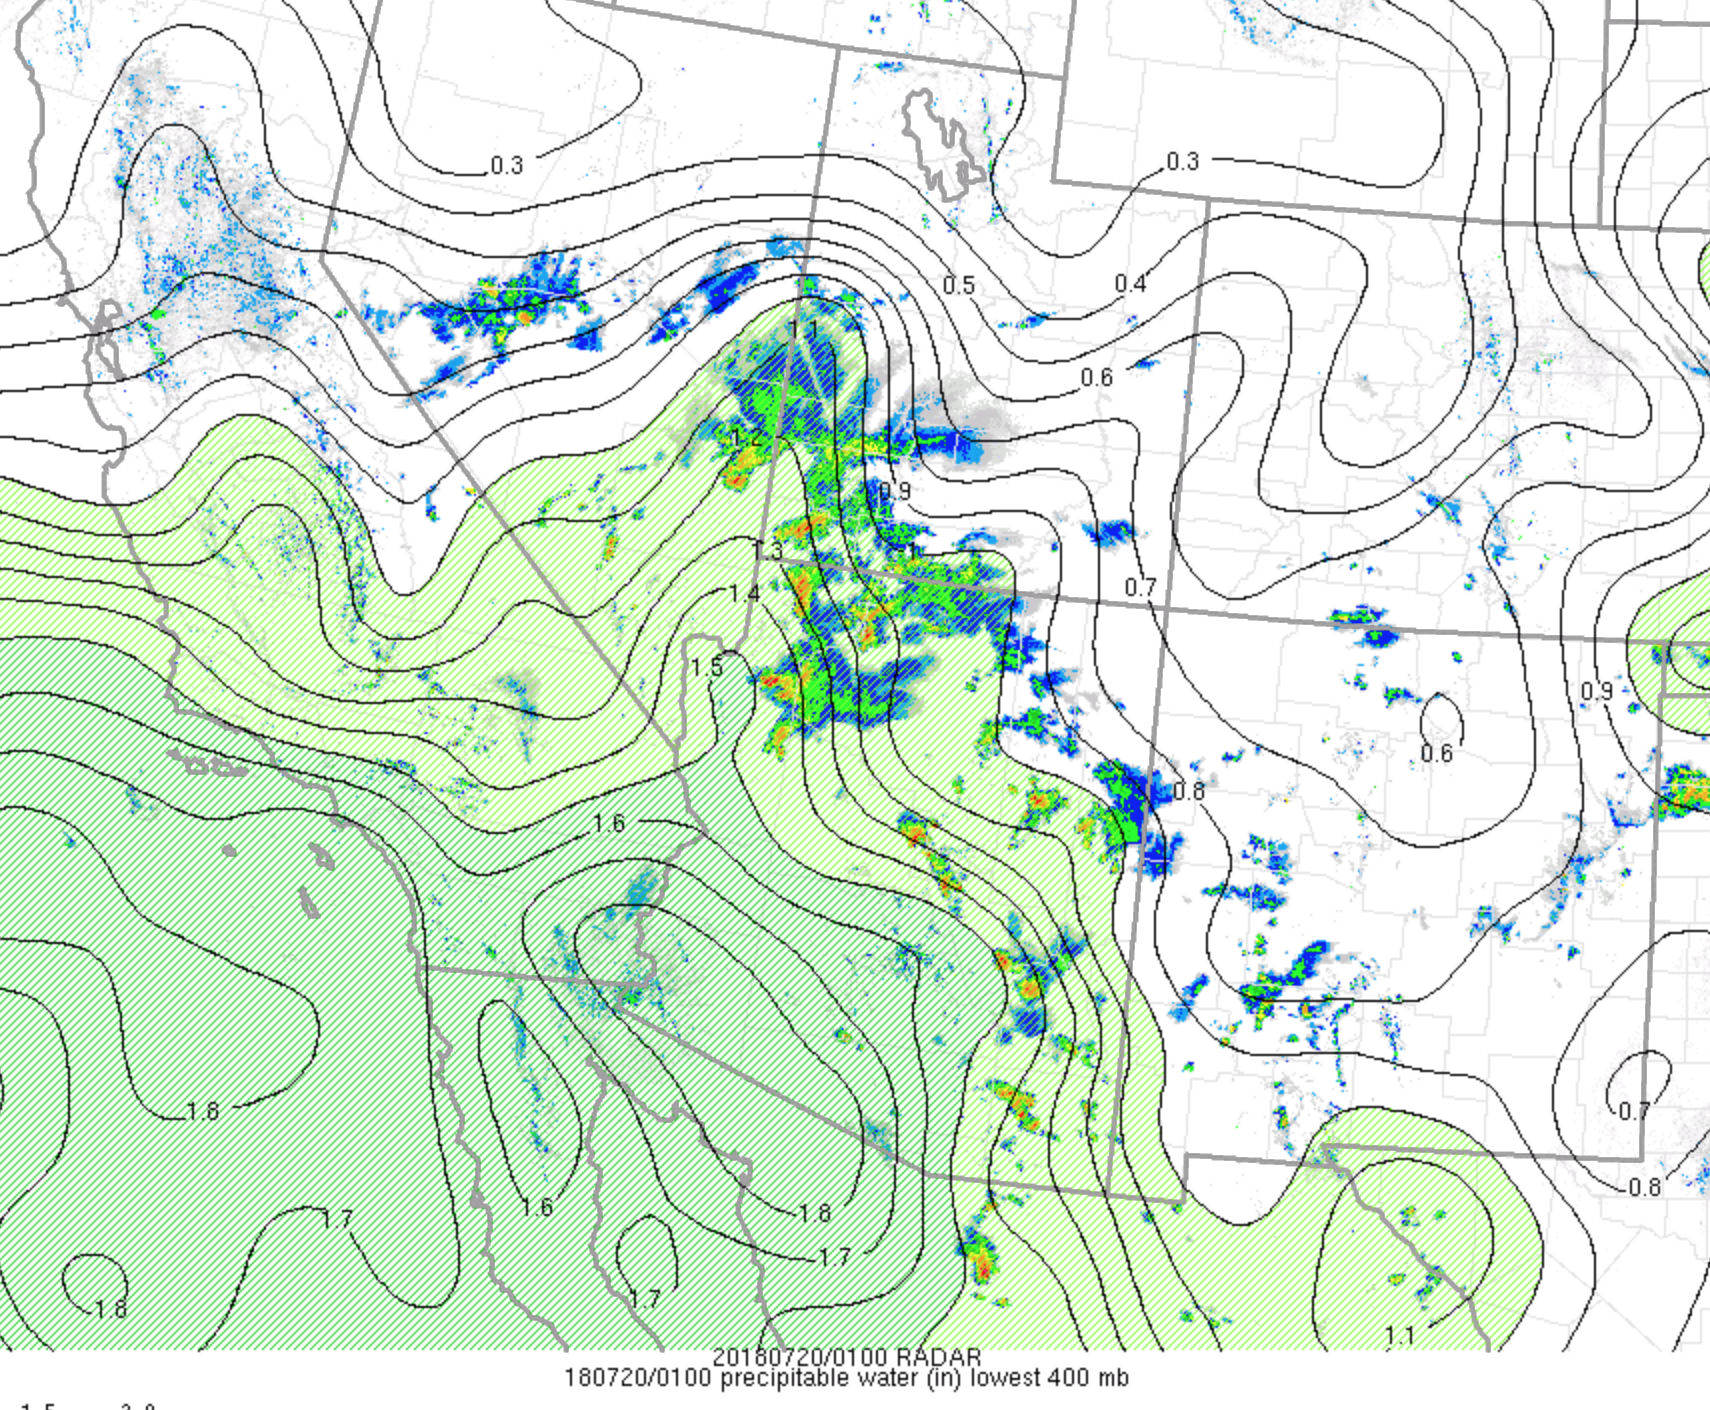
July 19


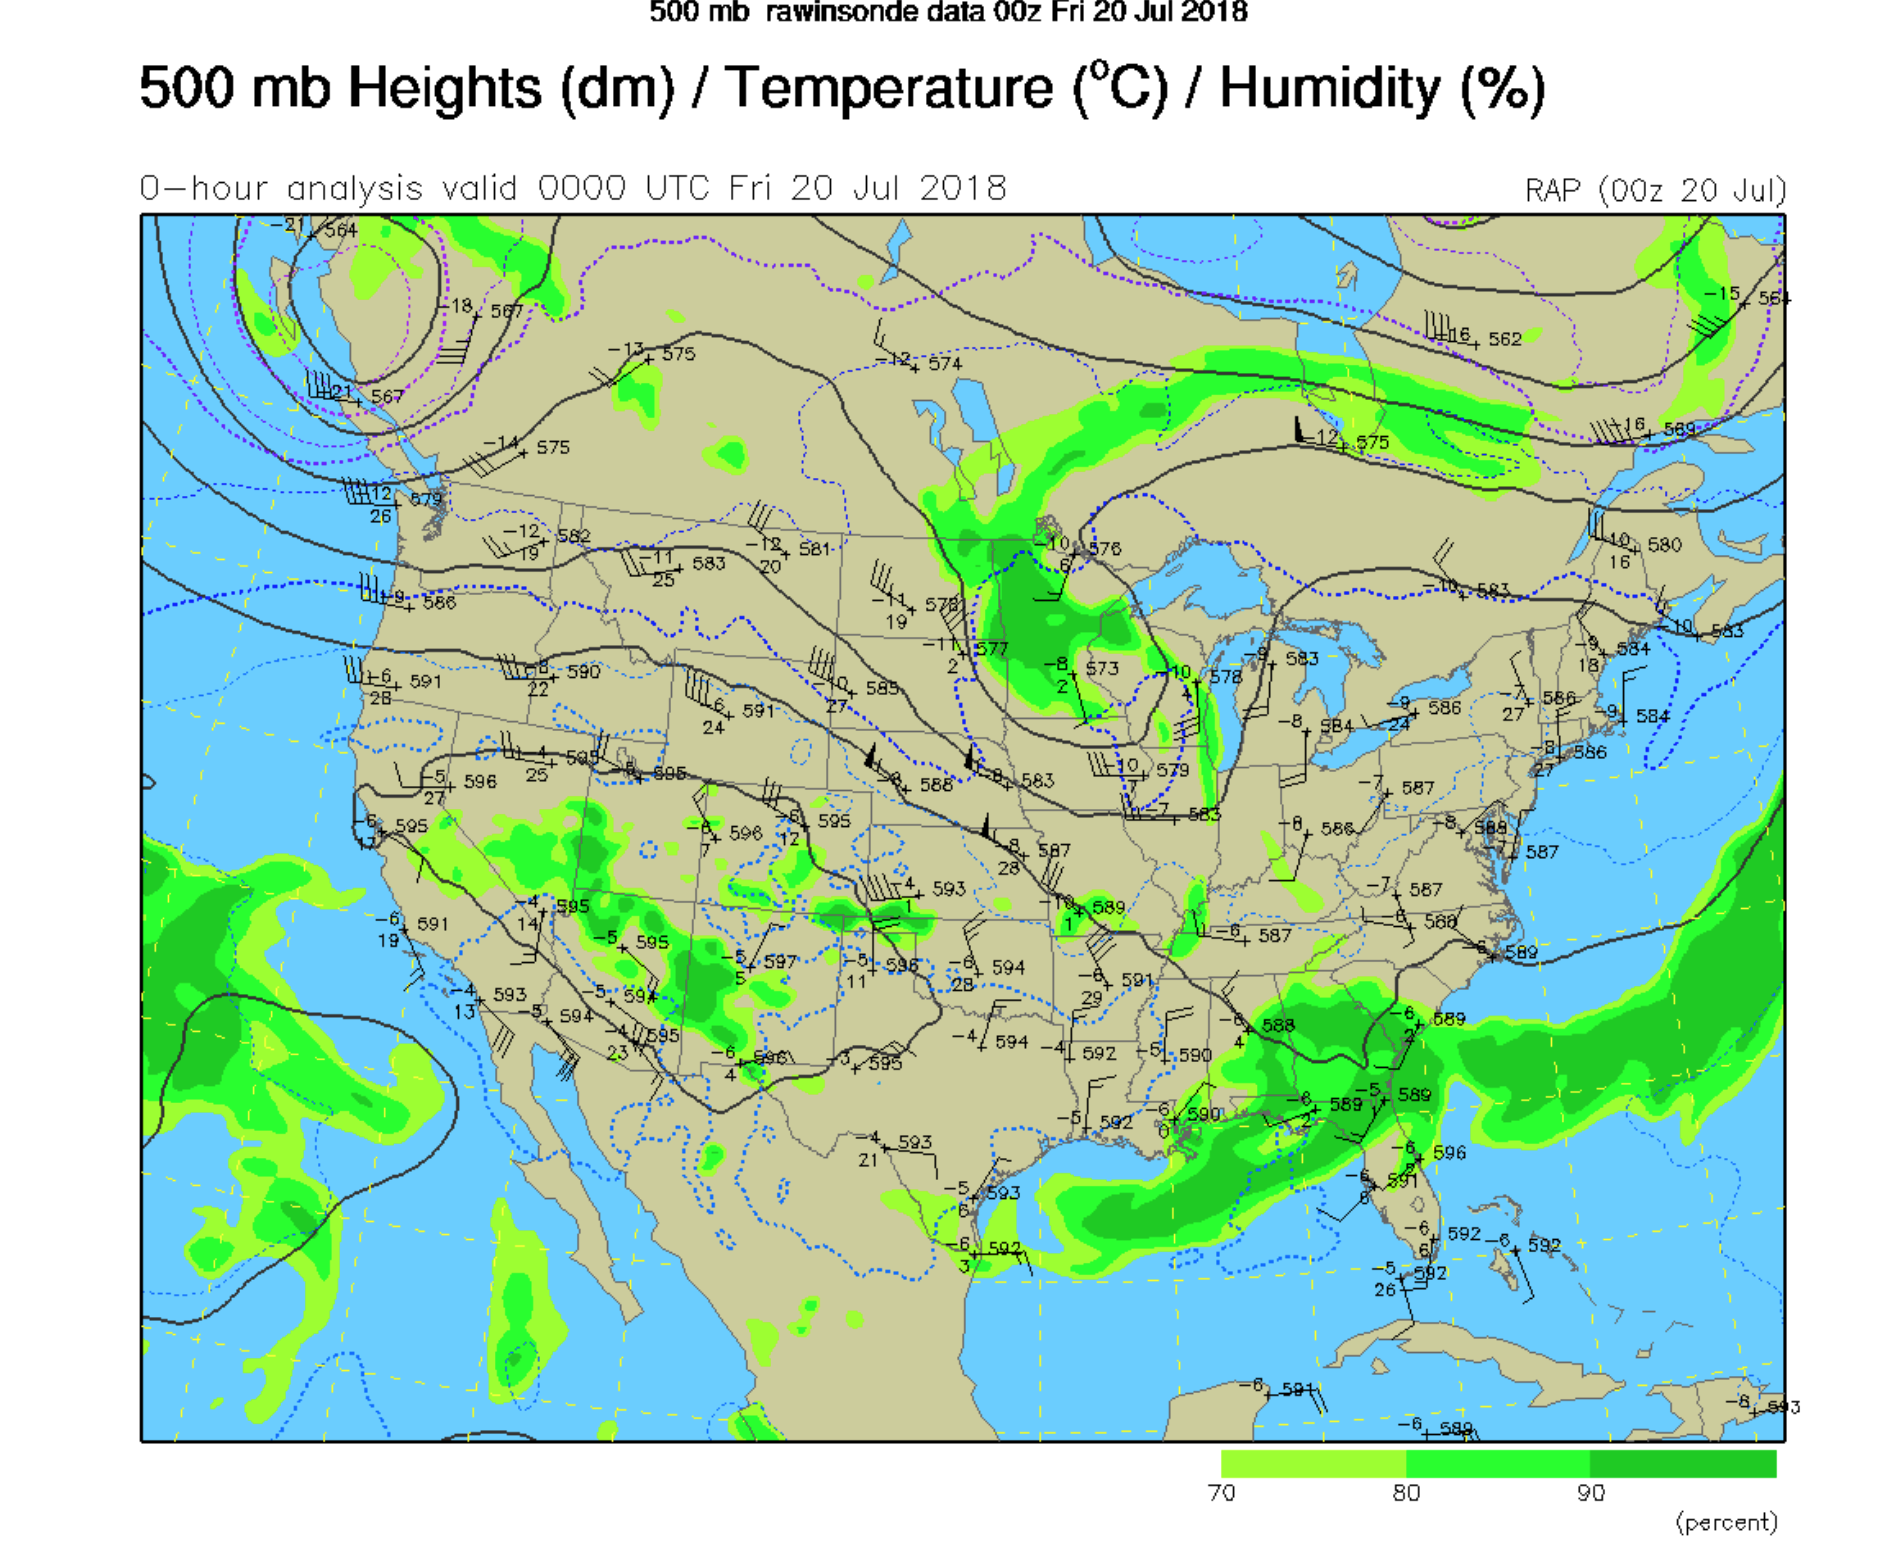
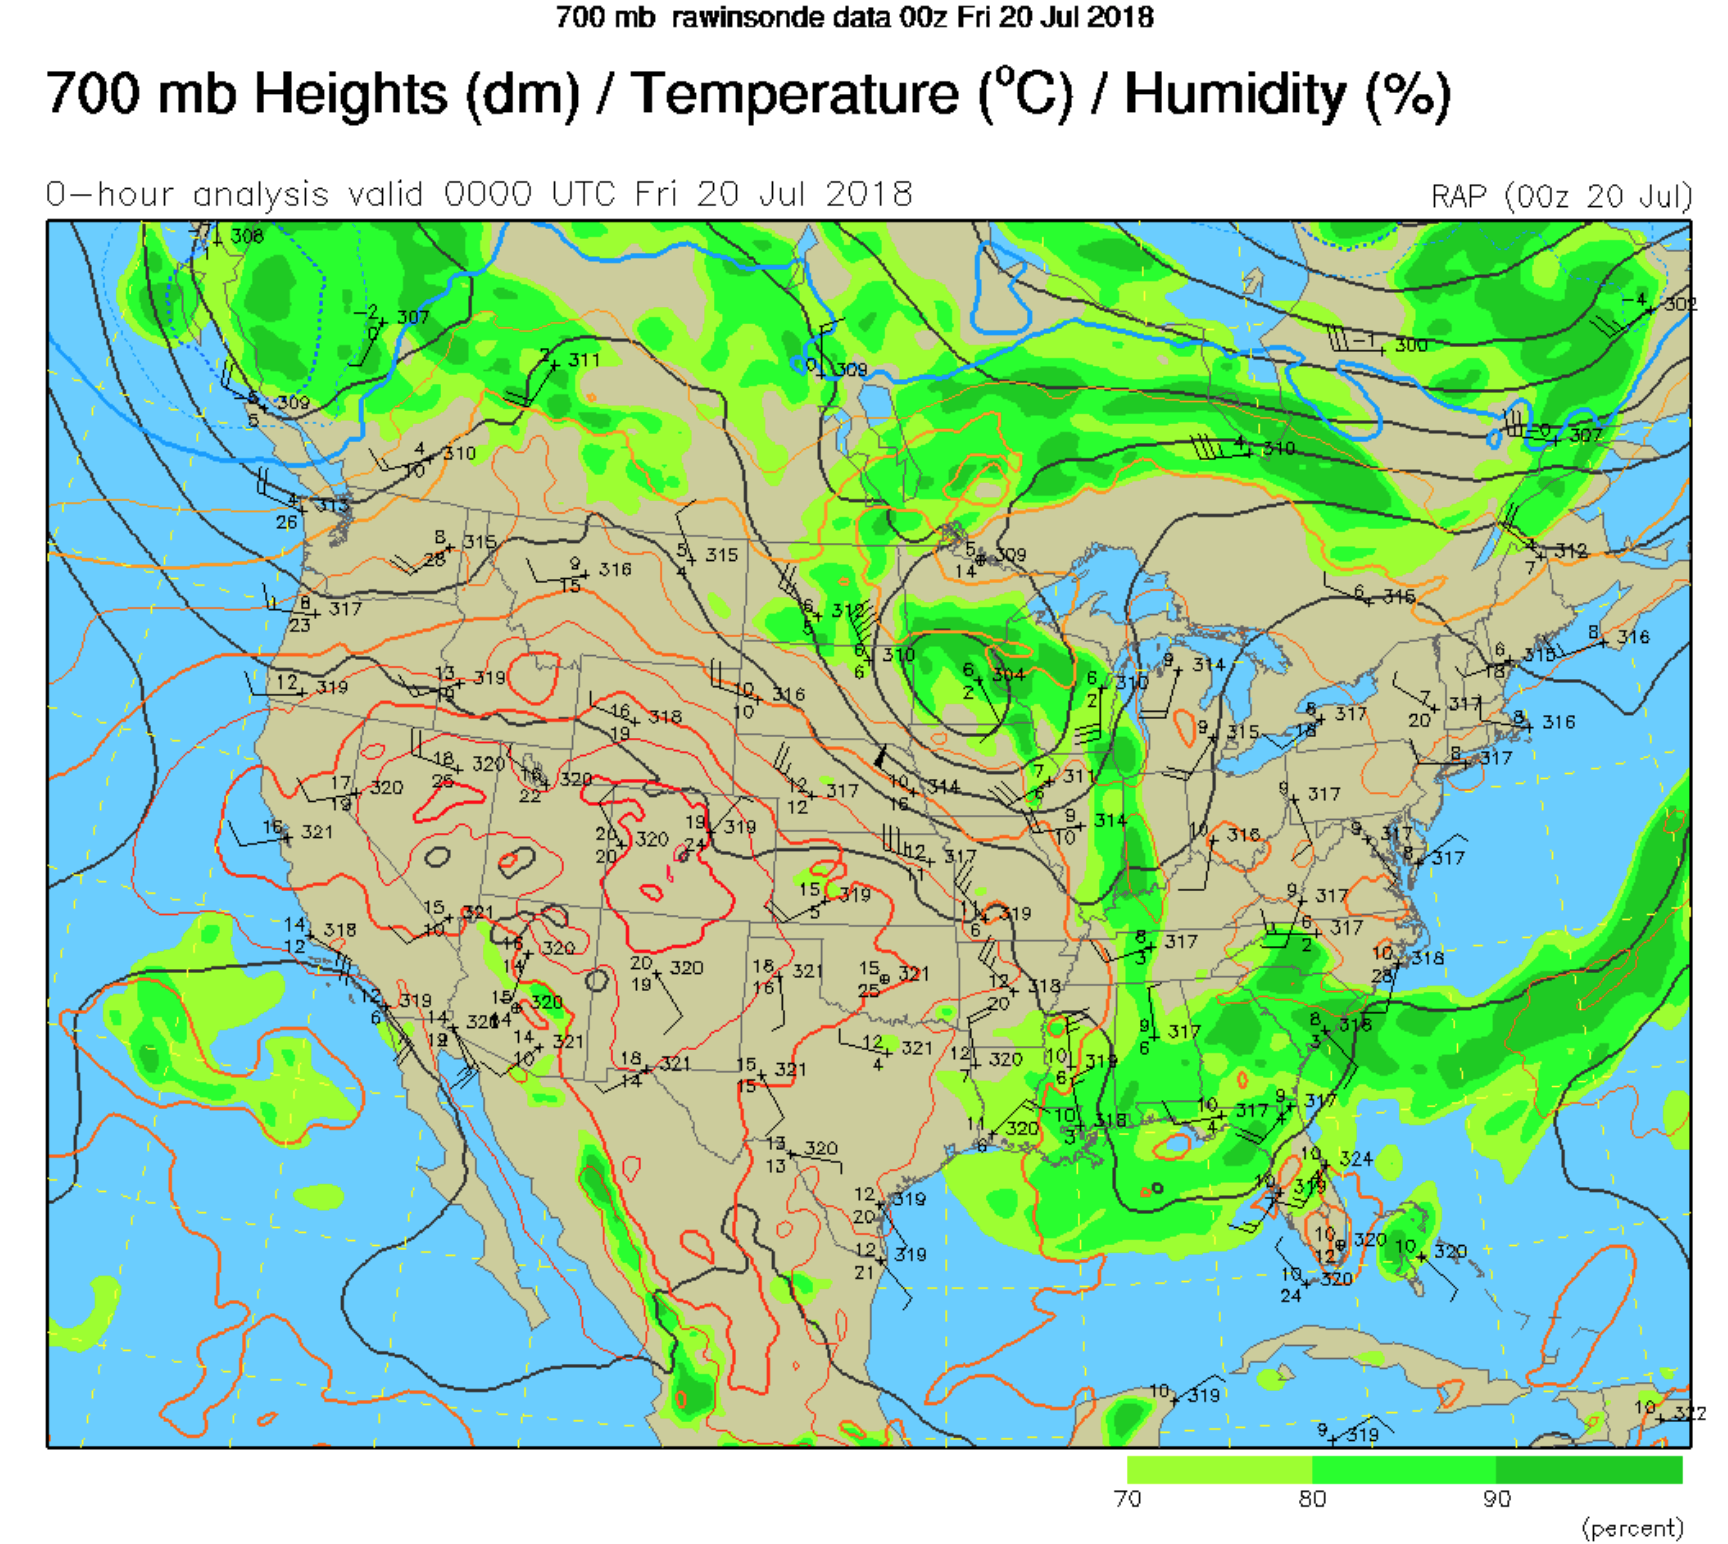


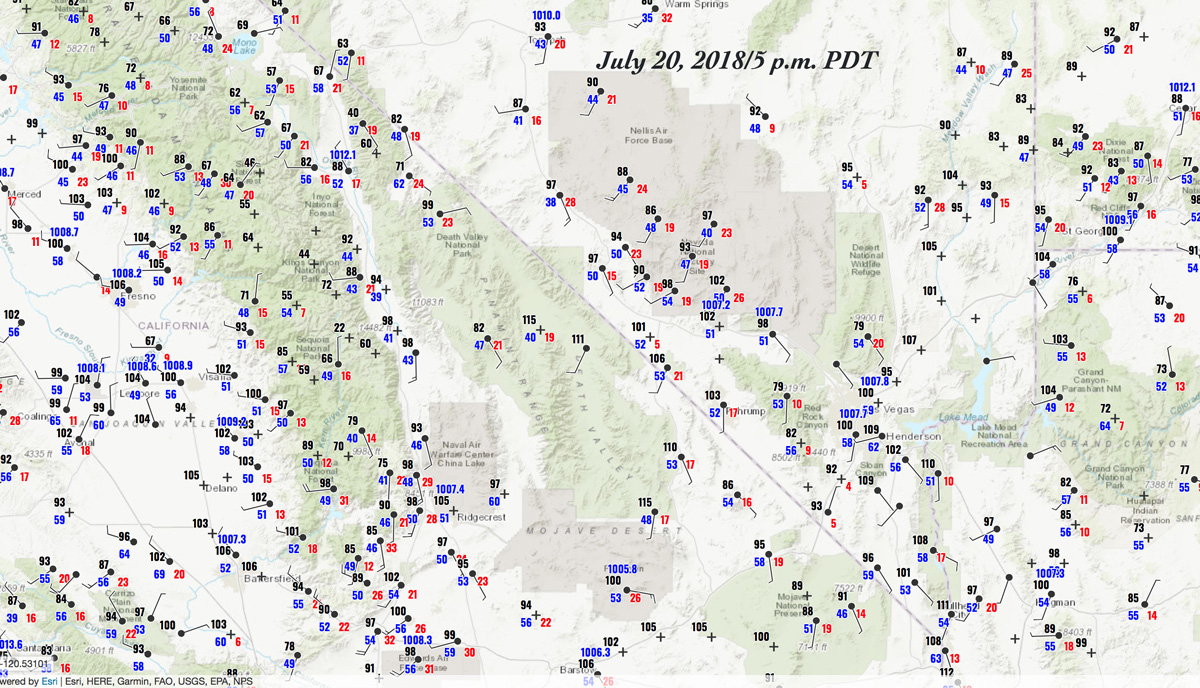
July 20
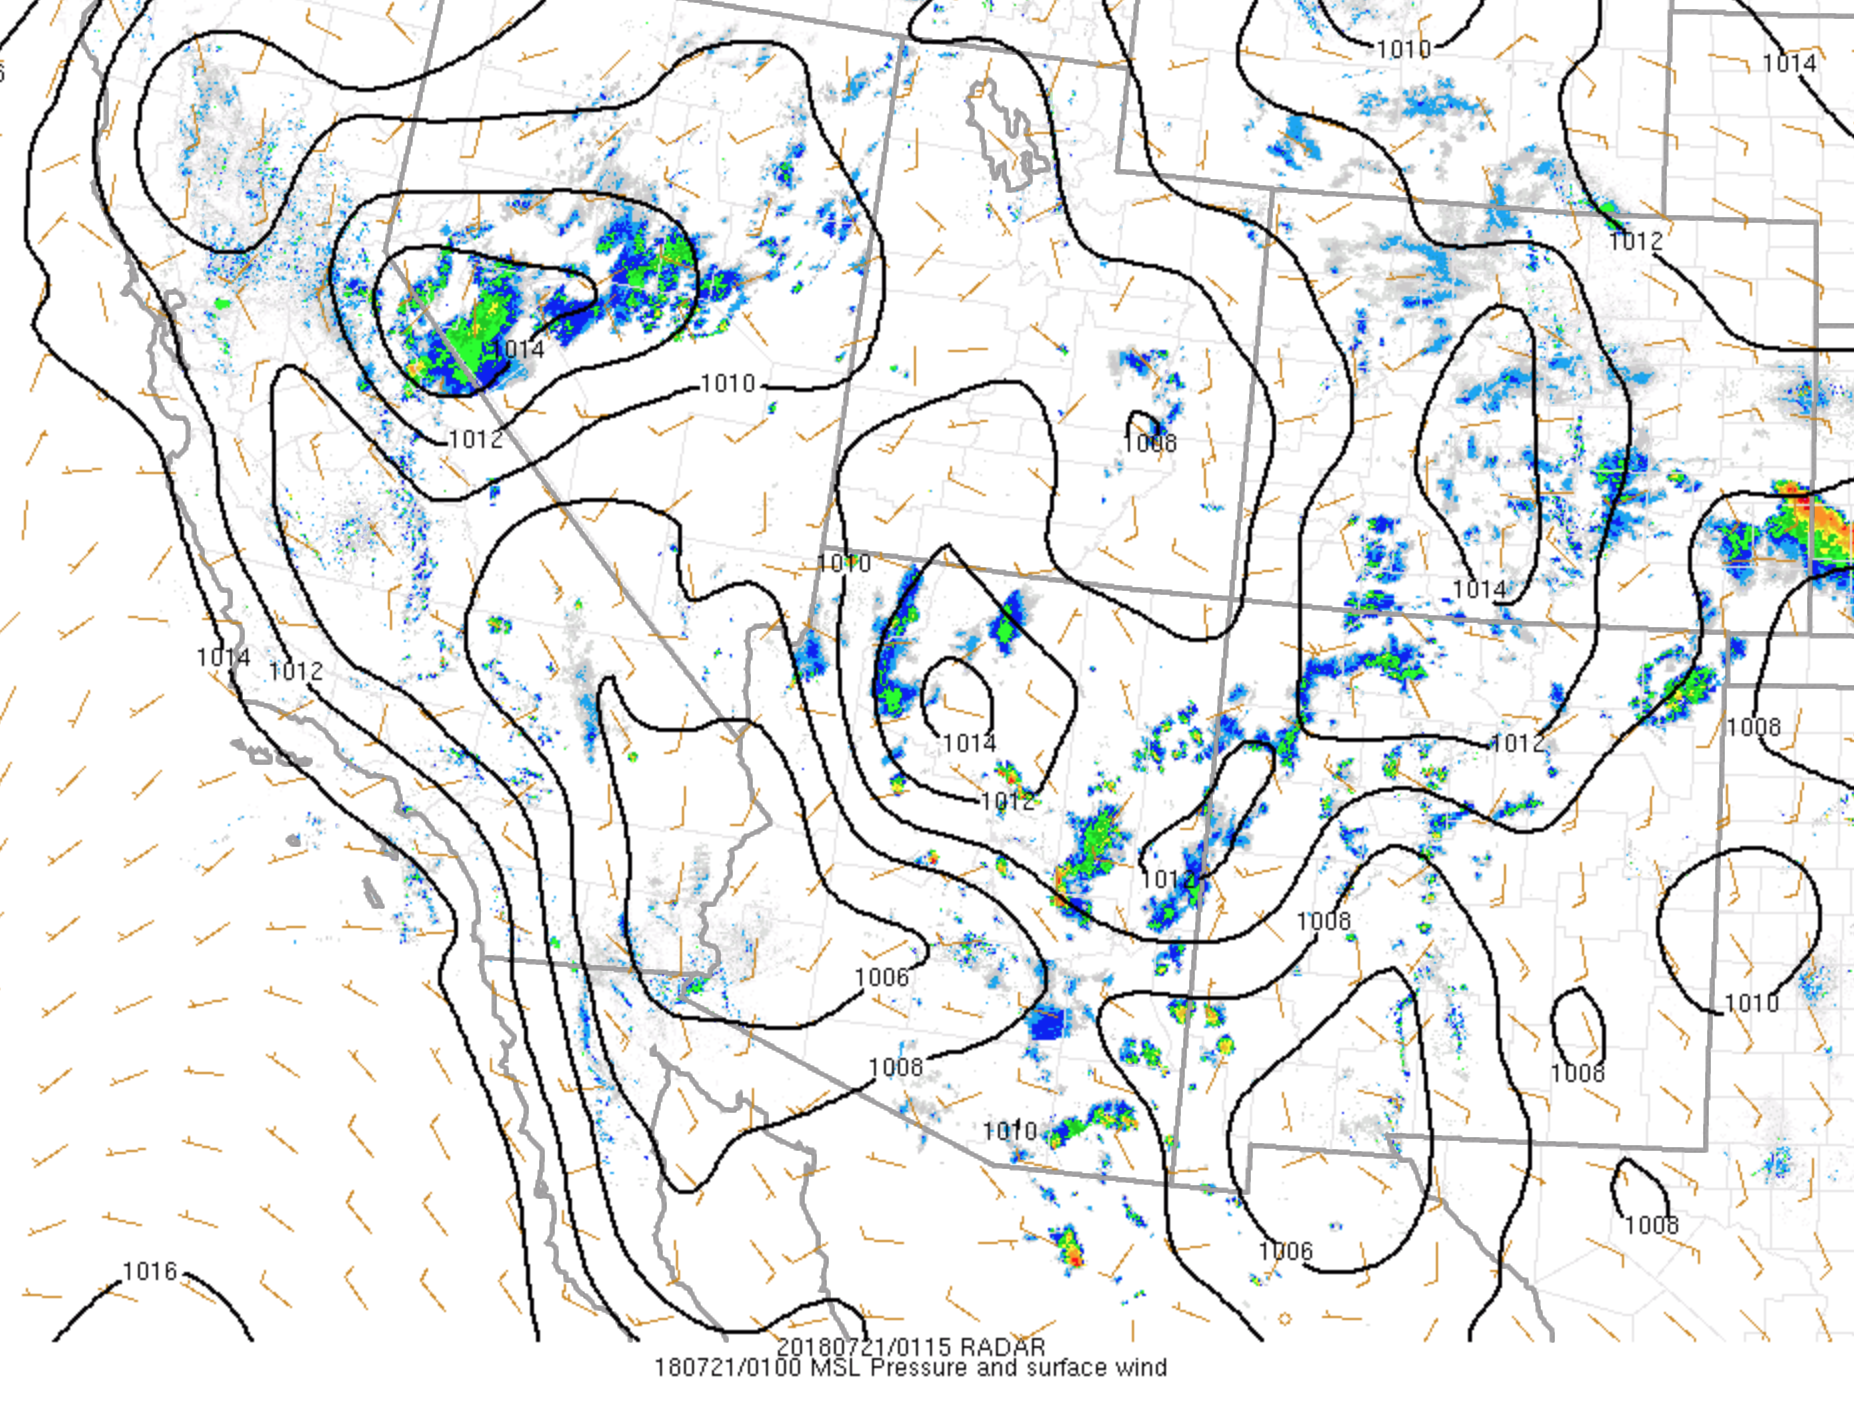
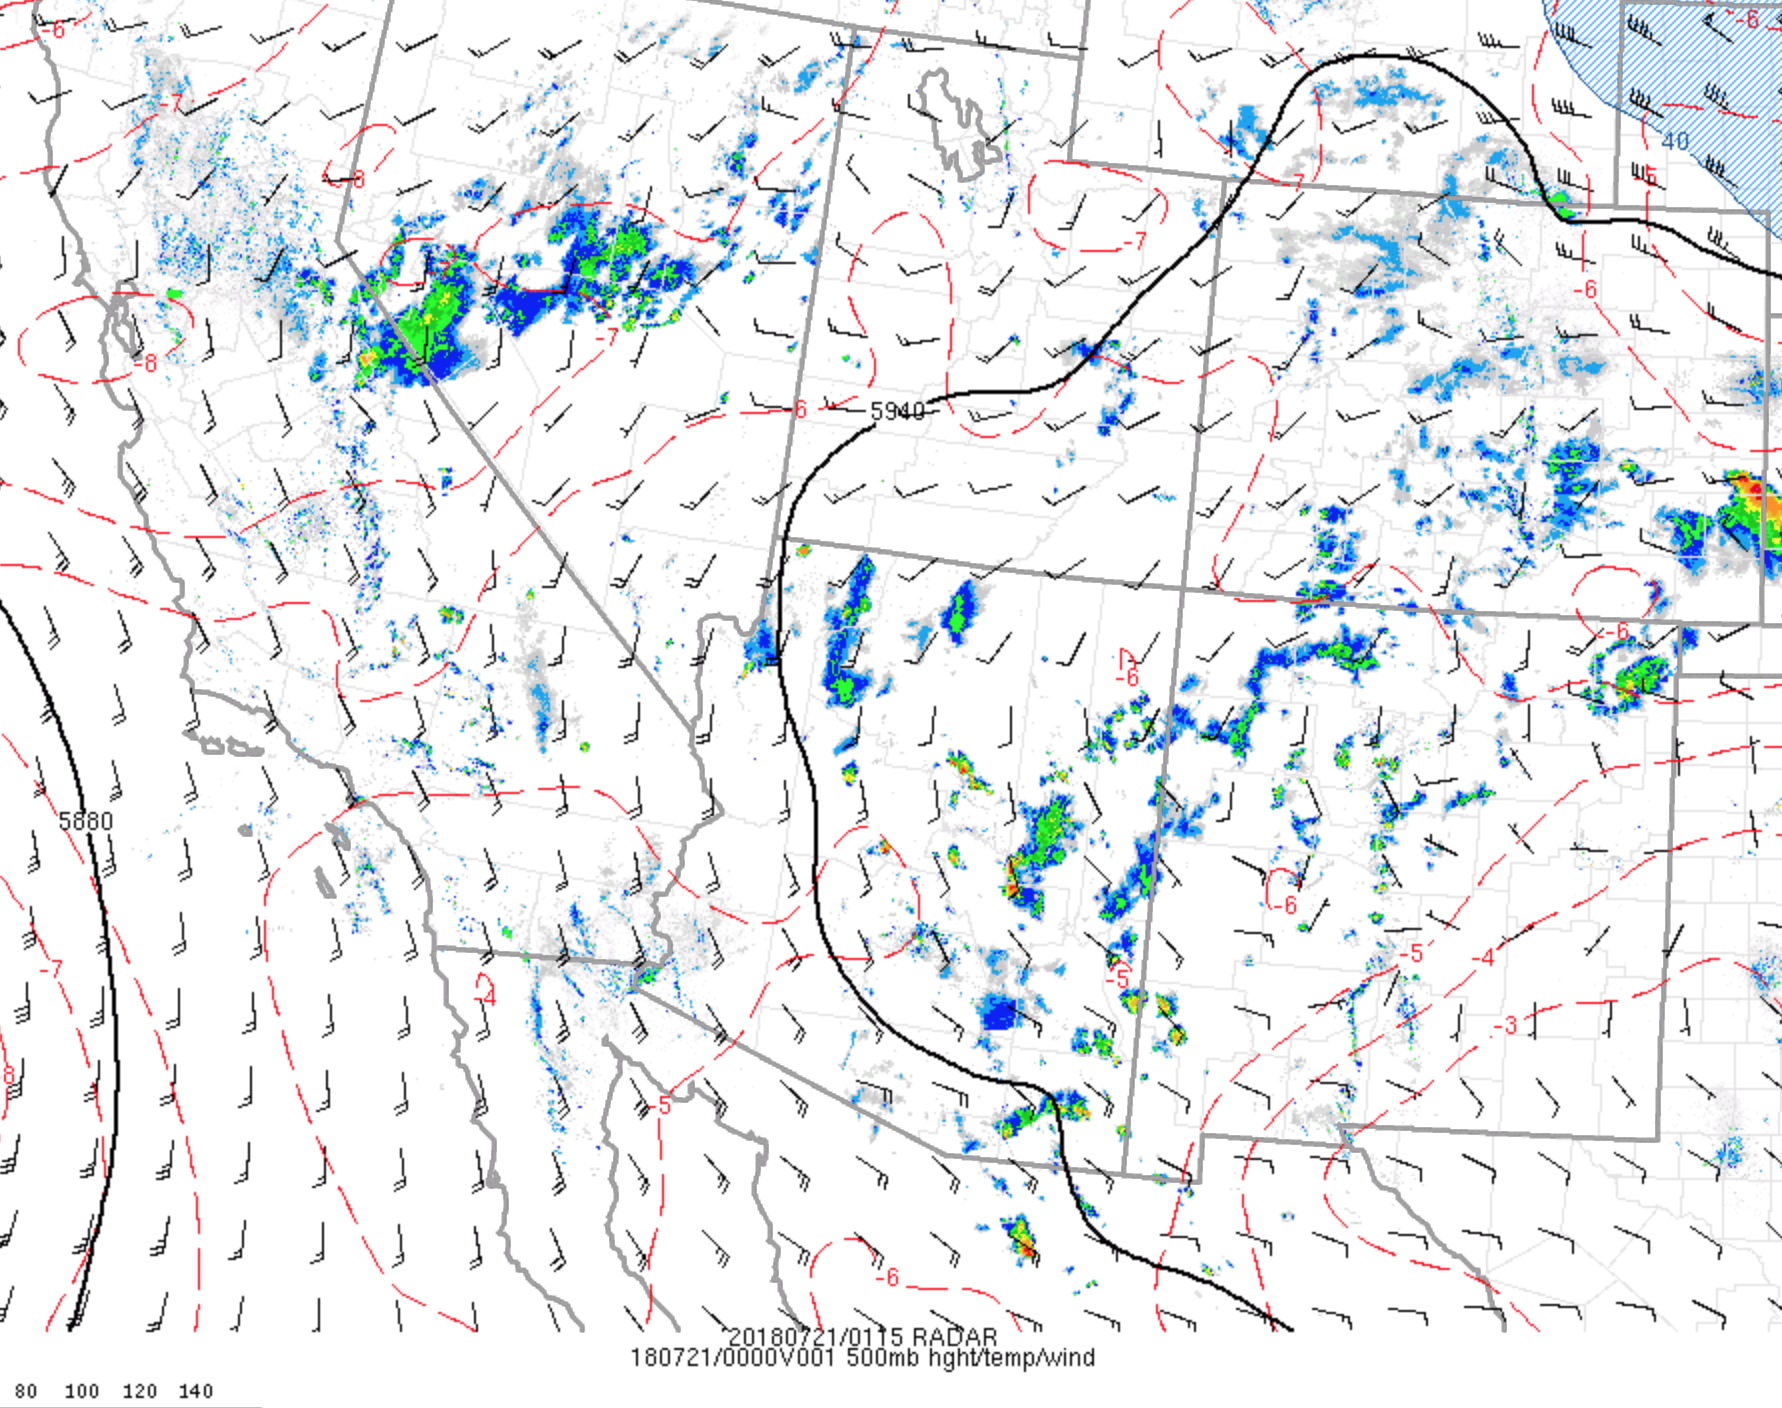
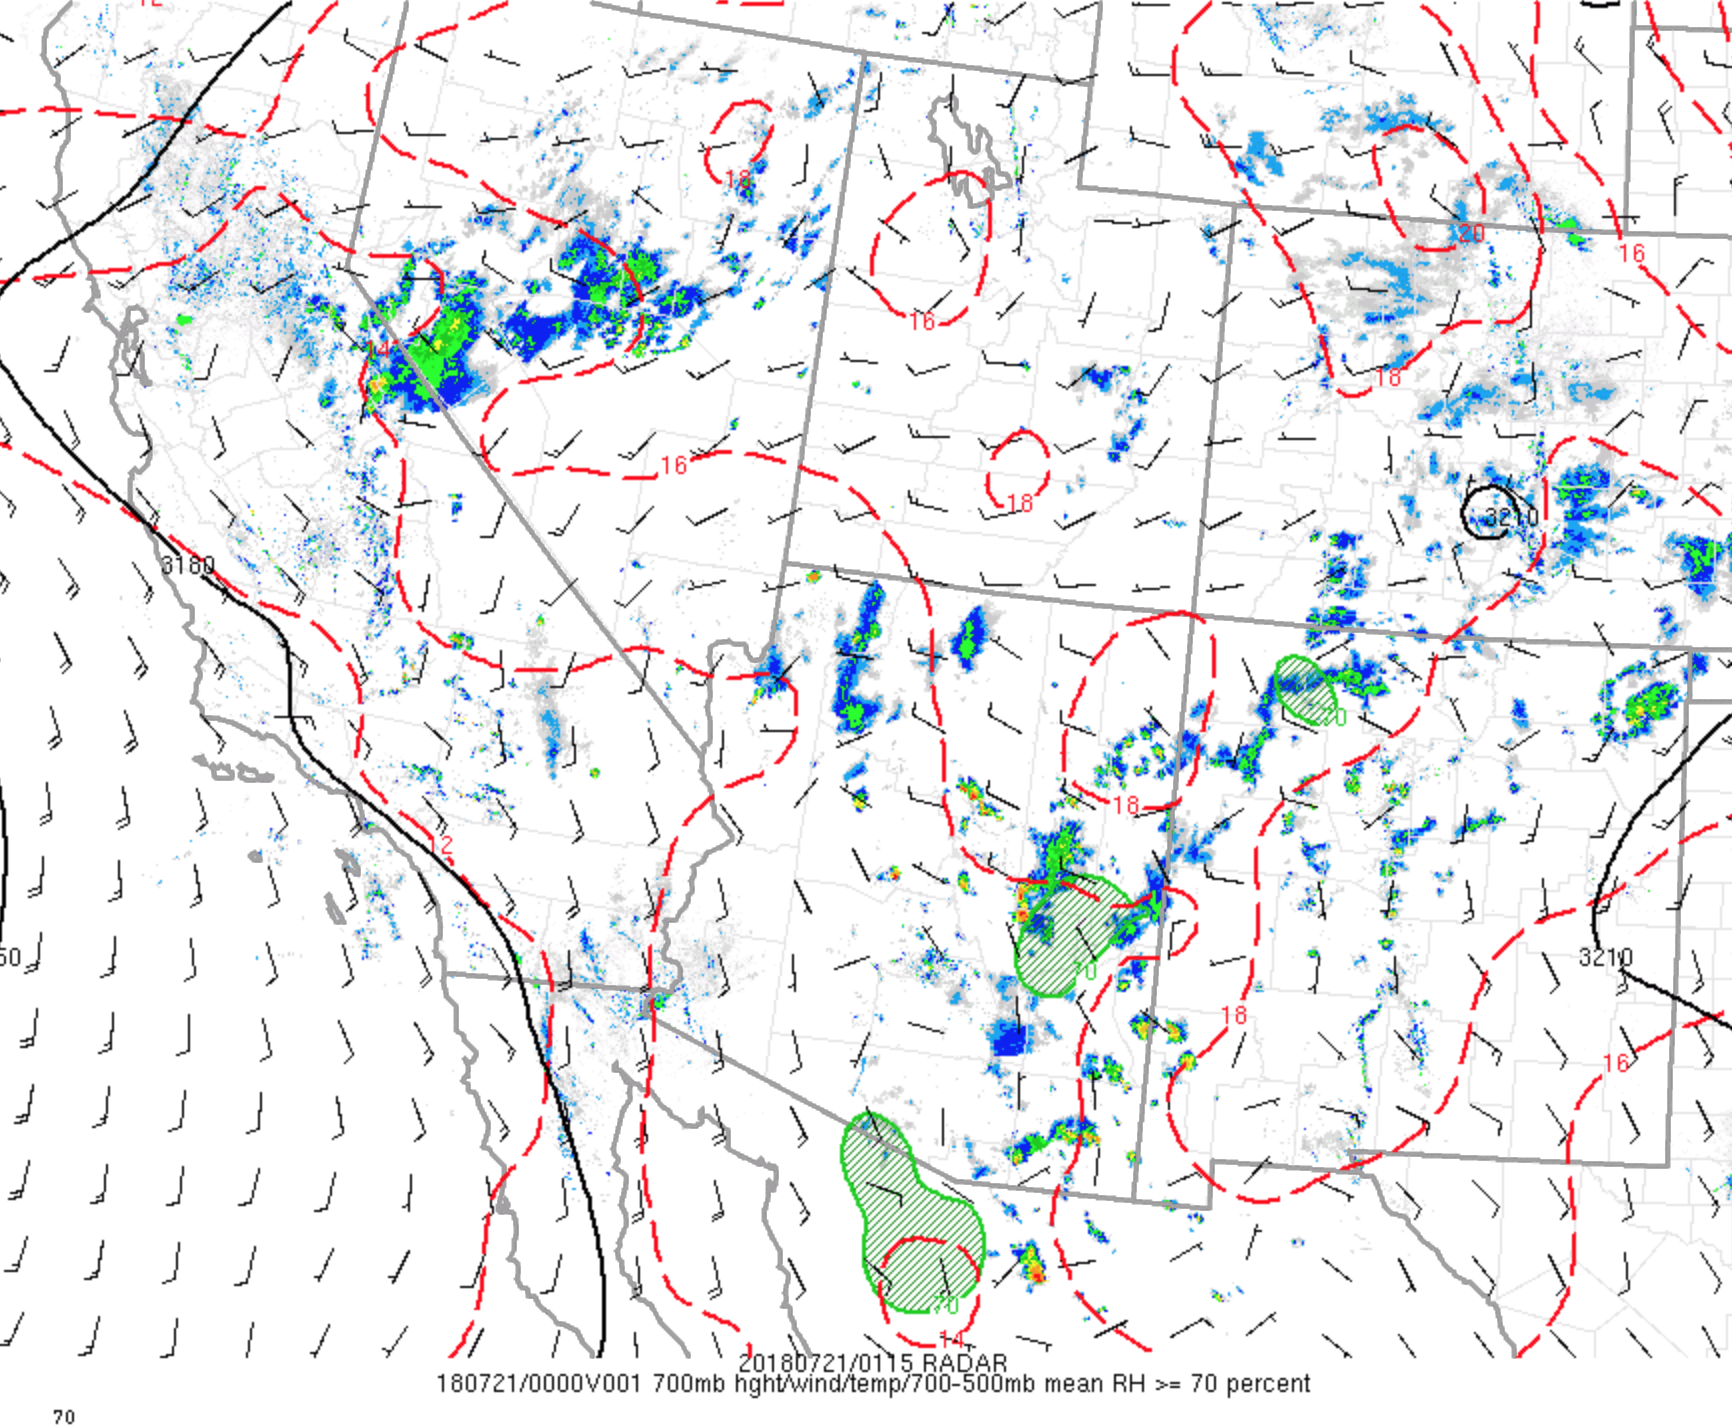
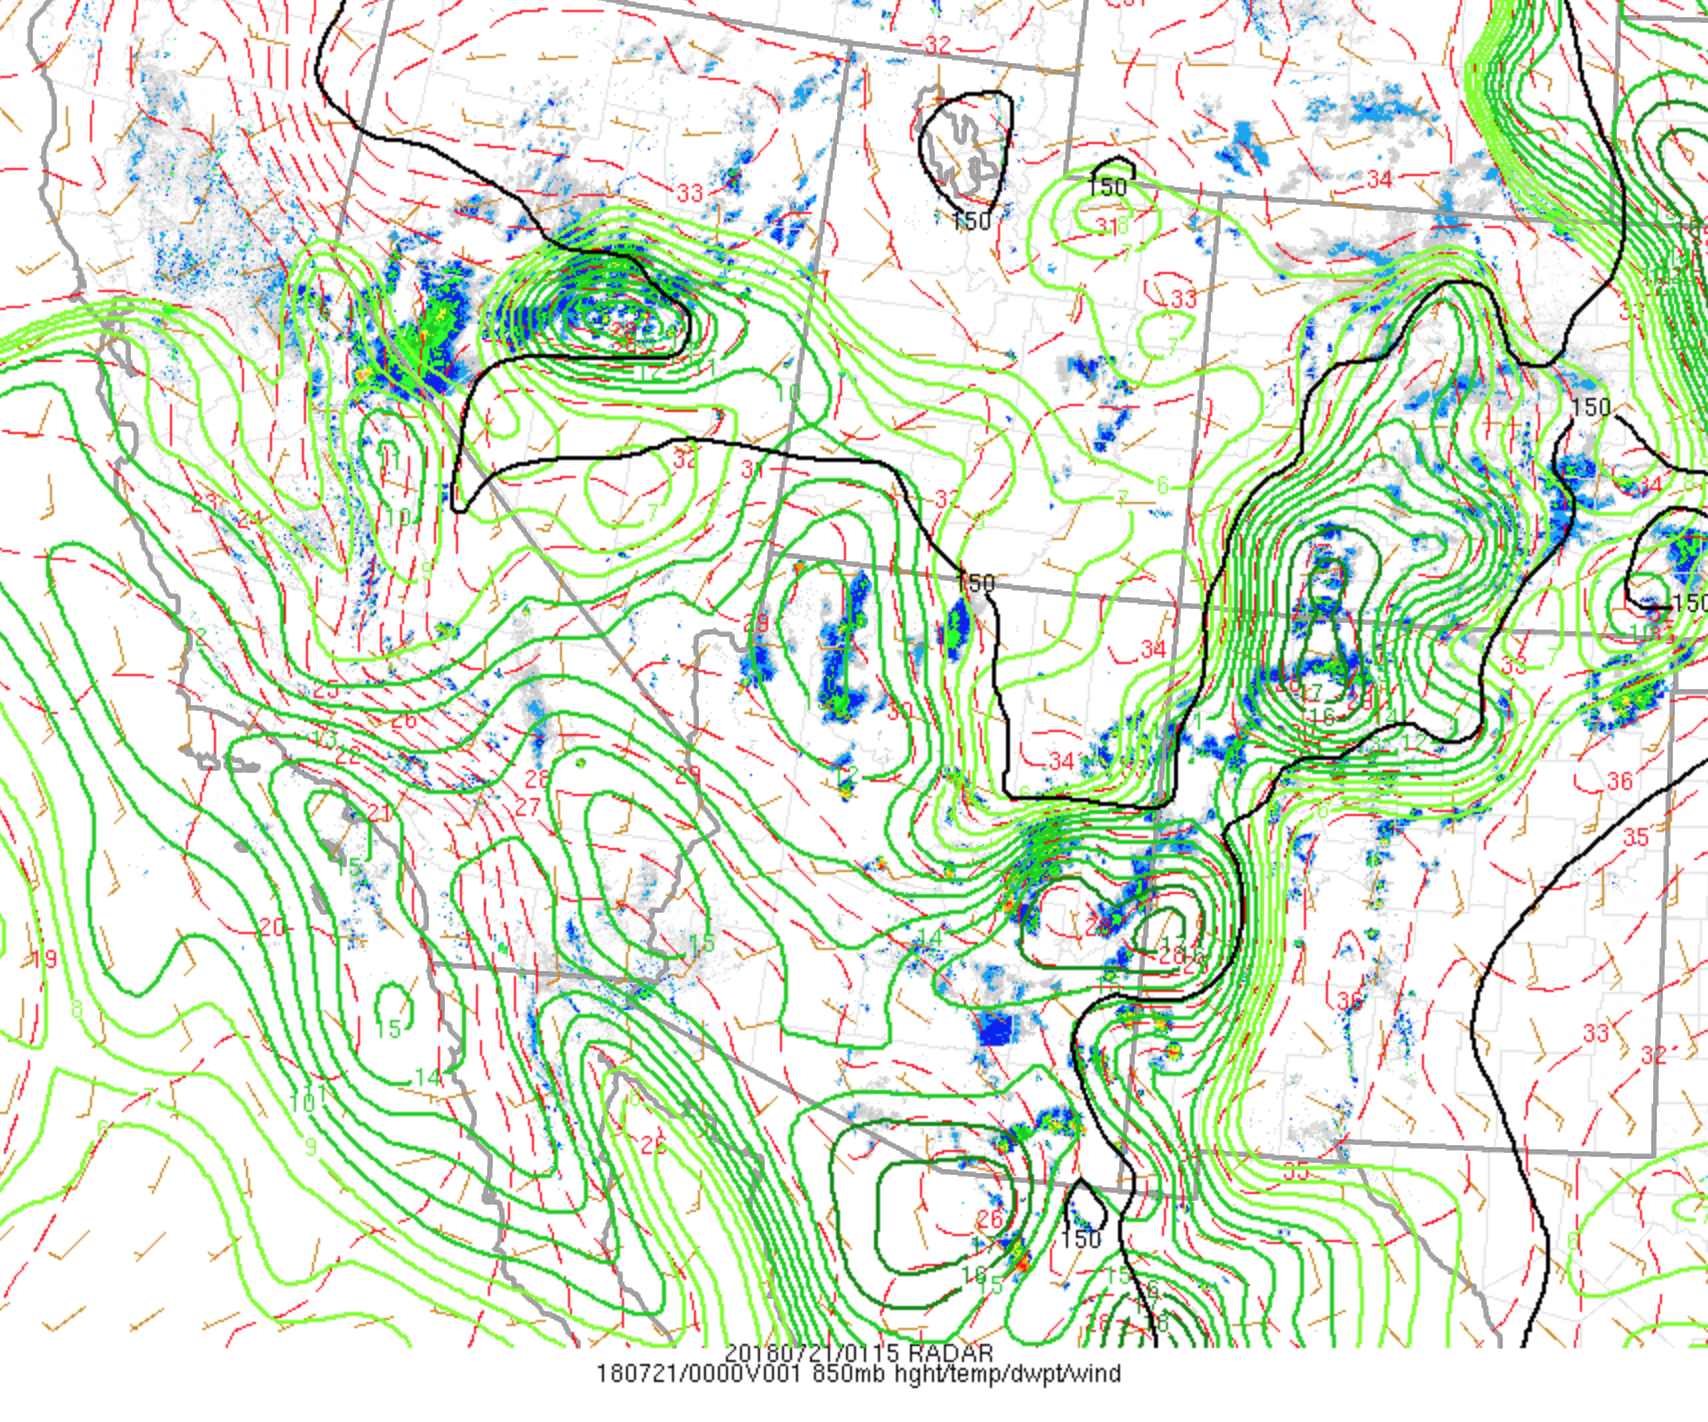
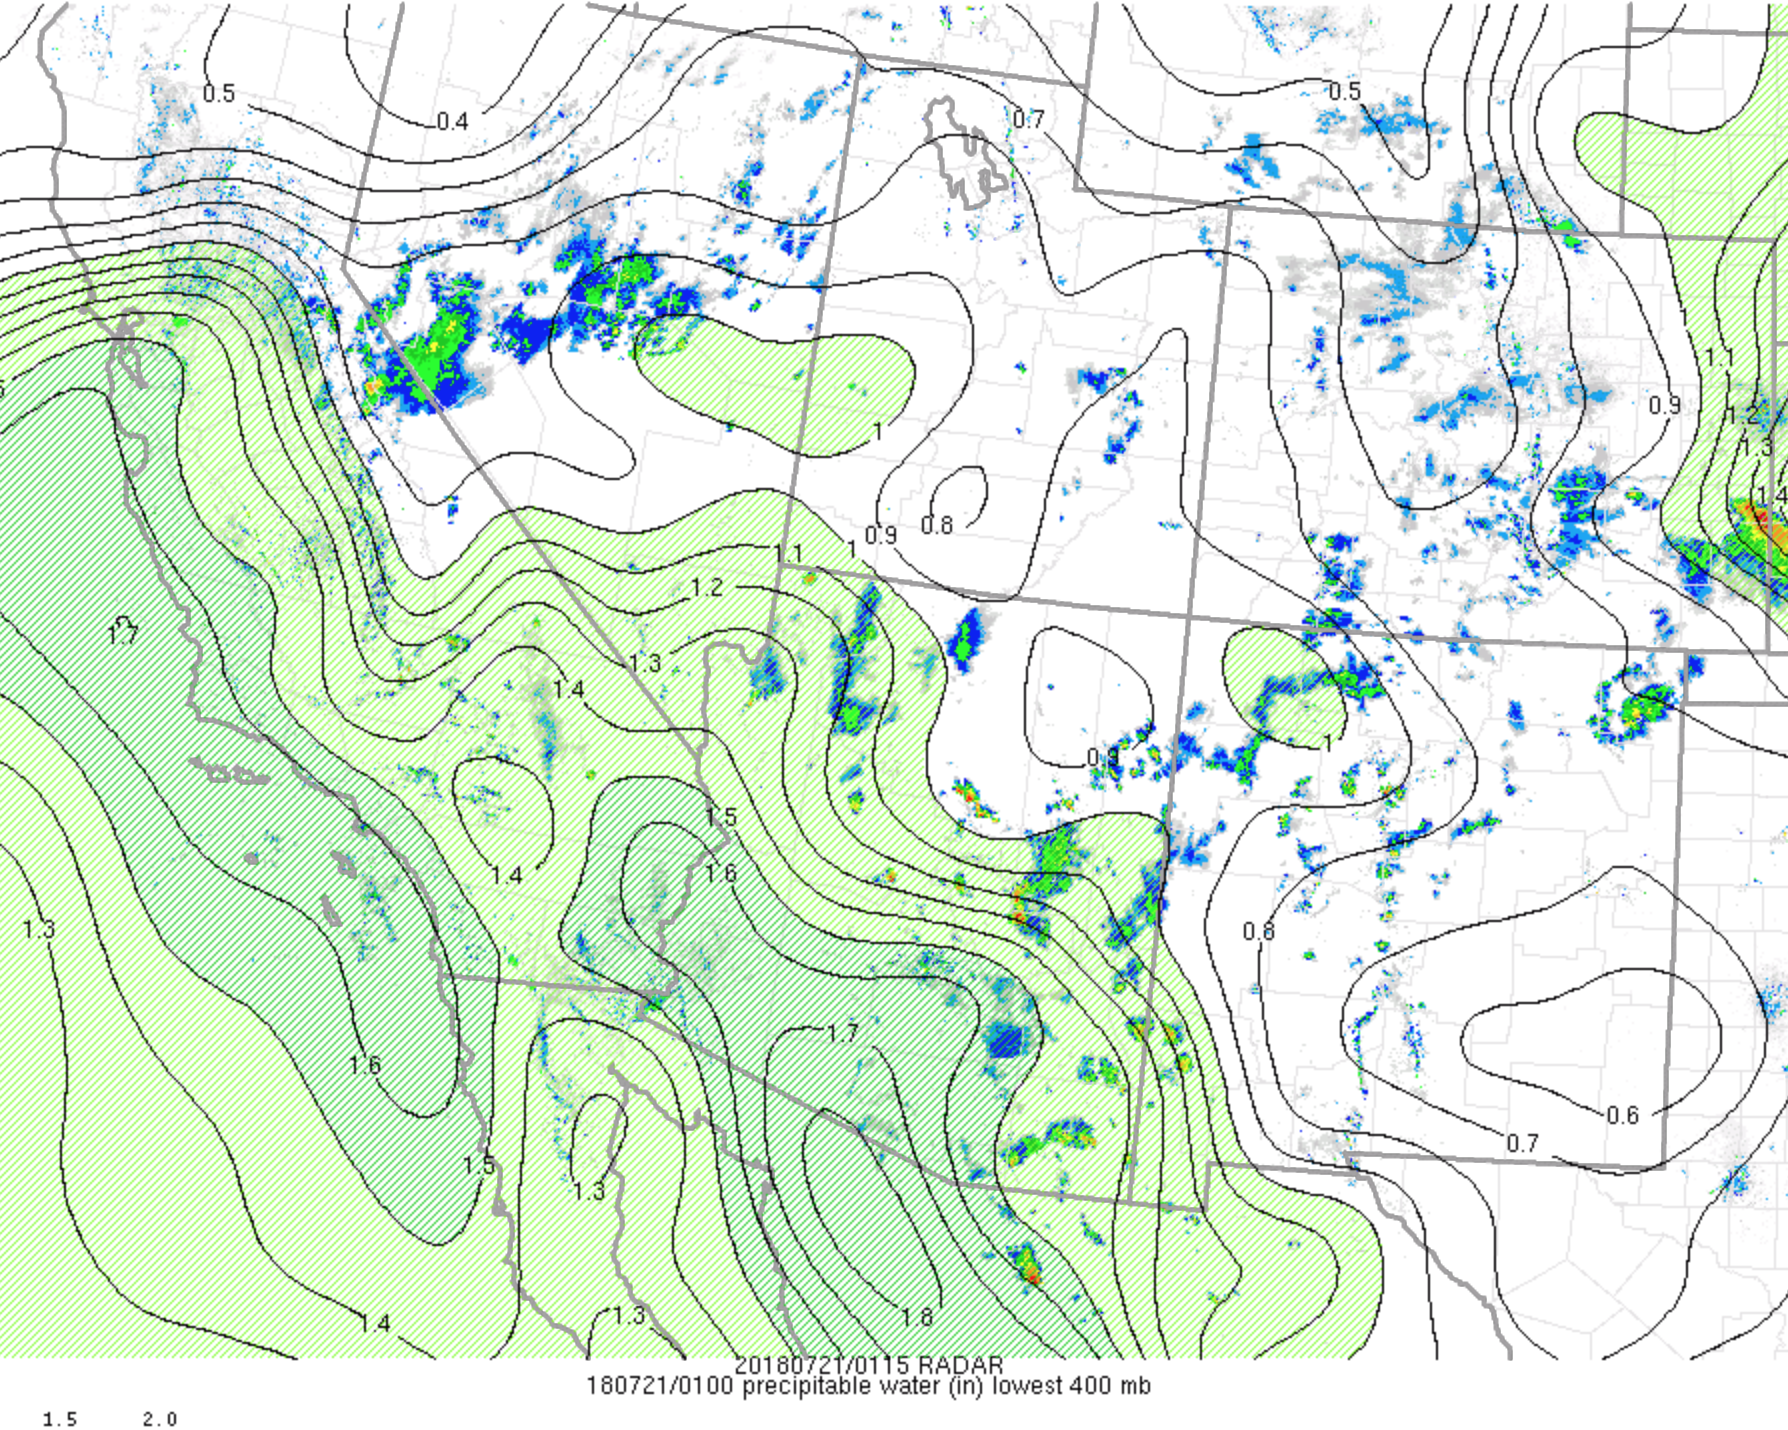
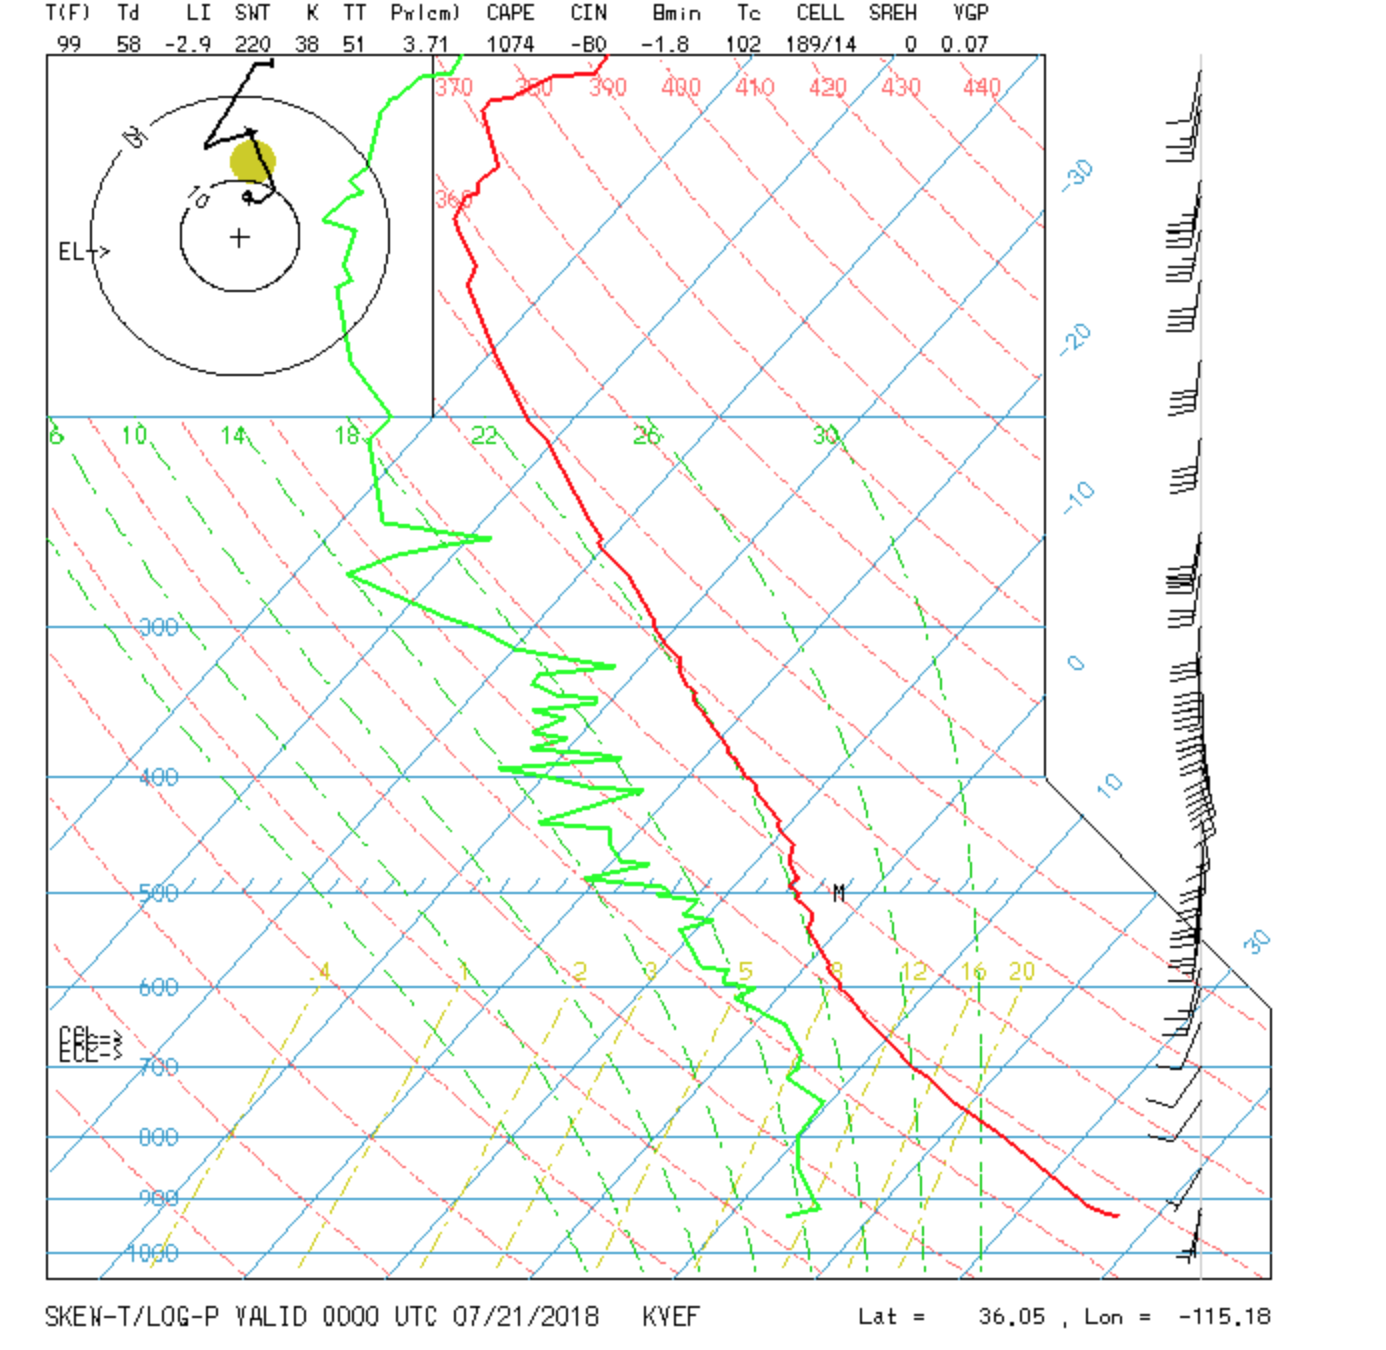
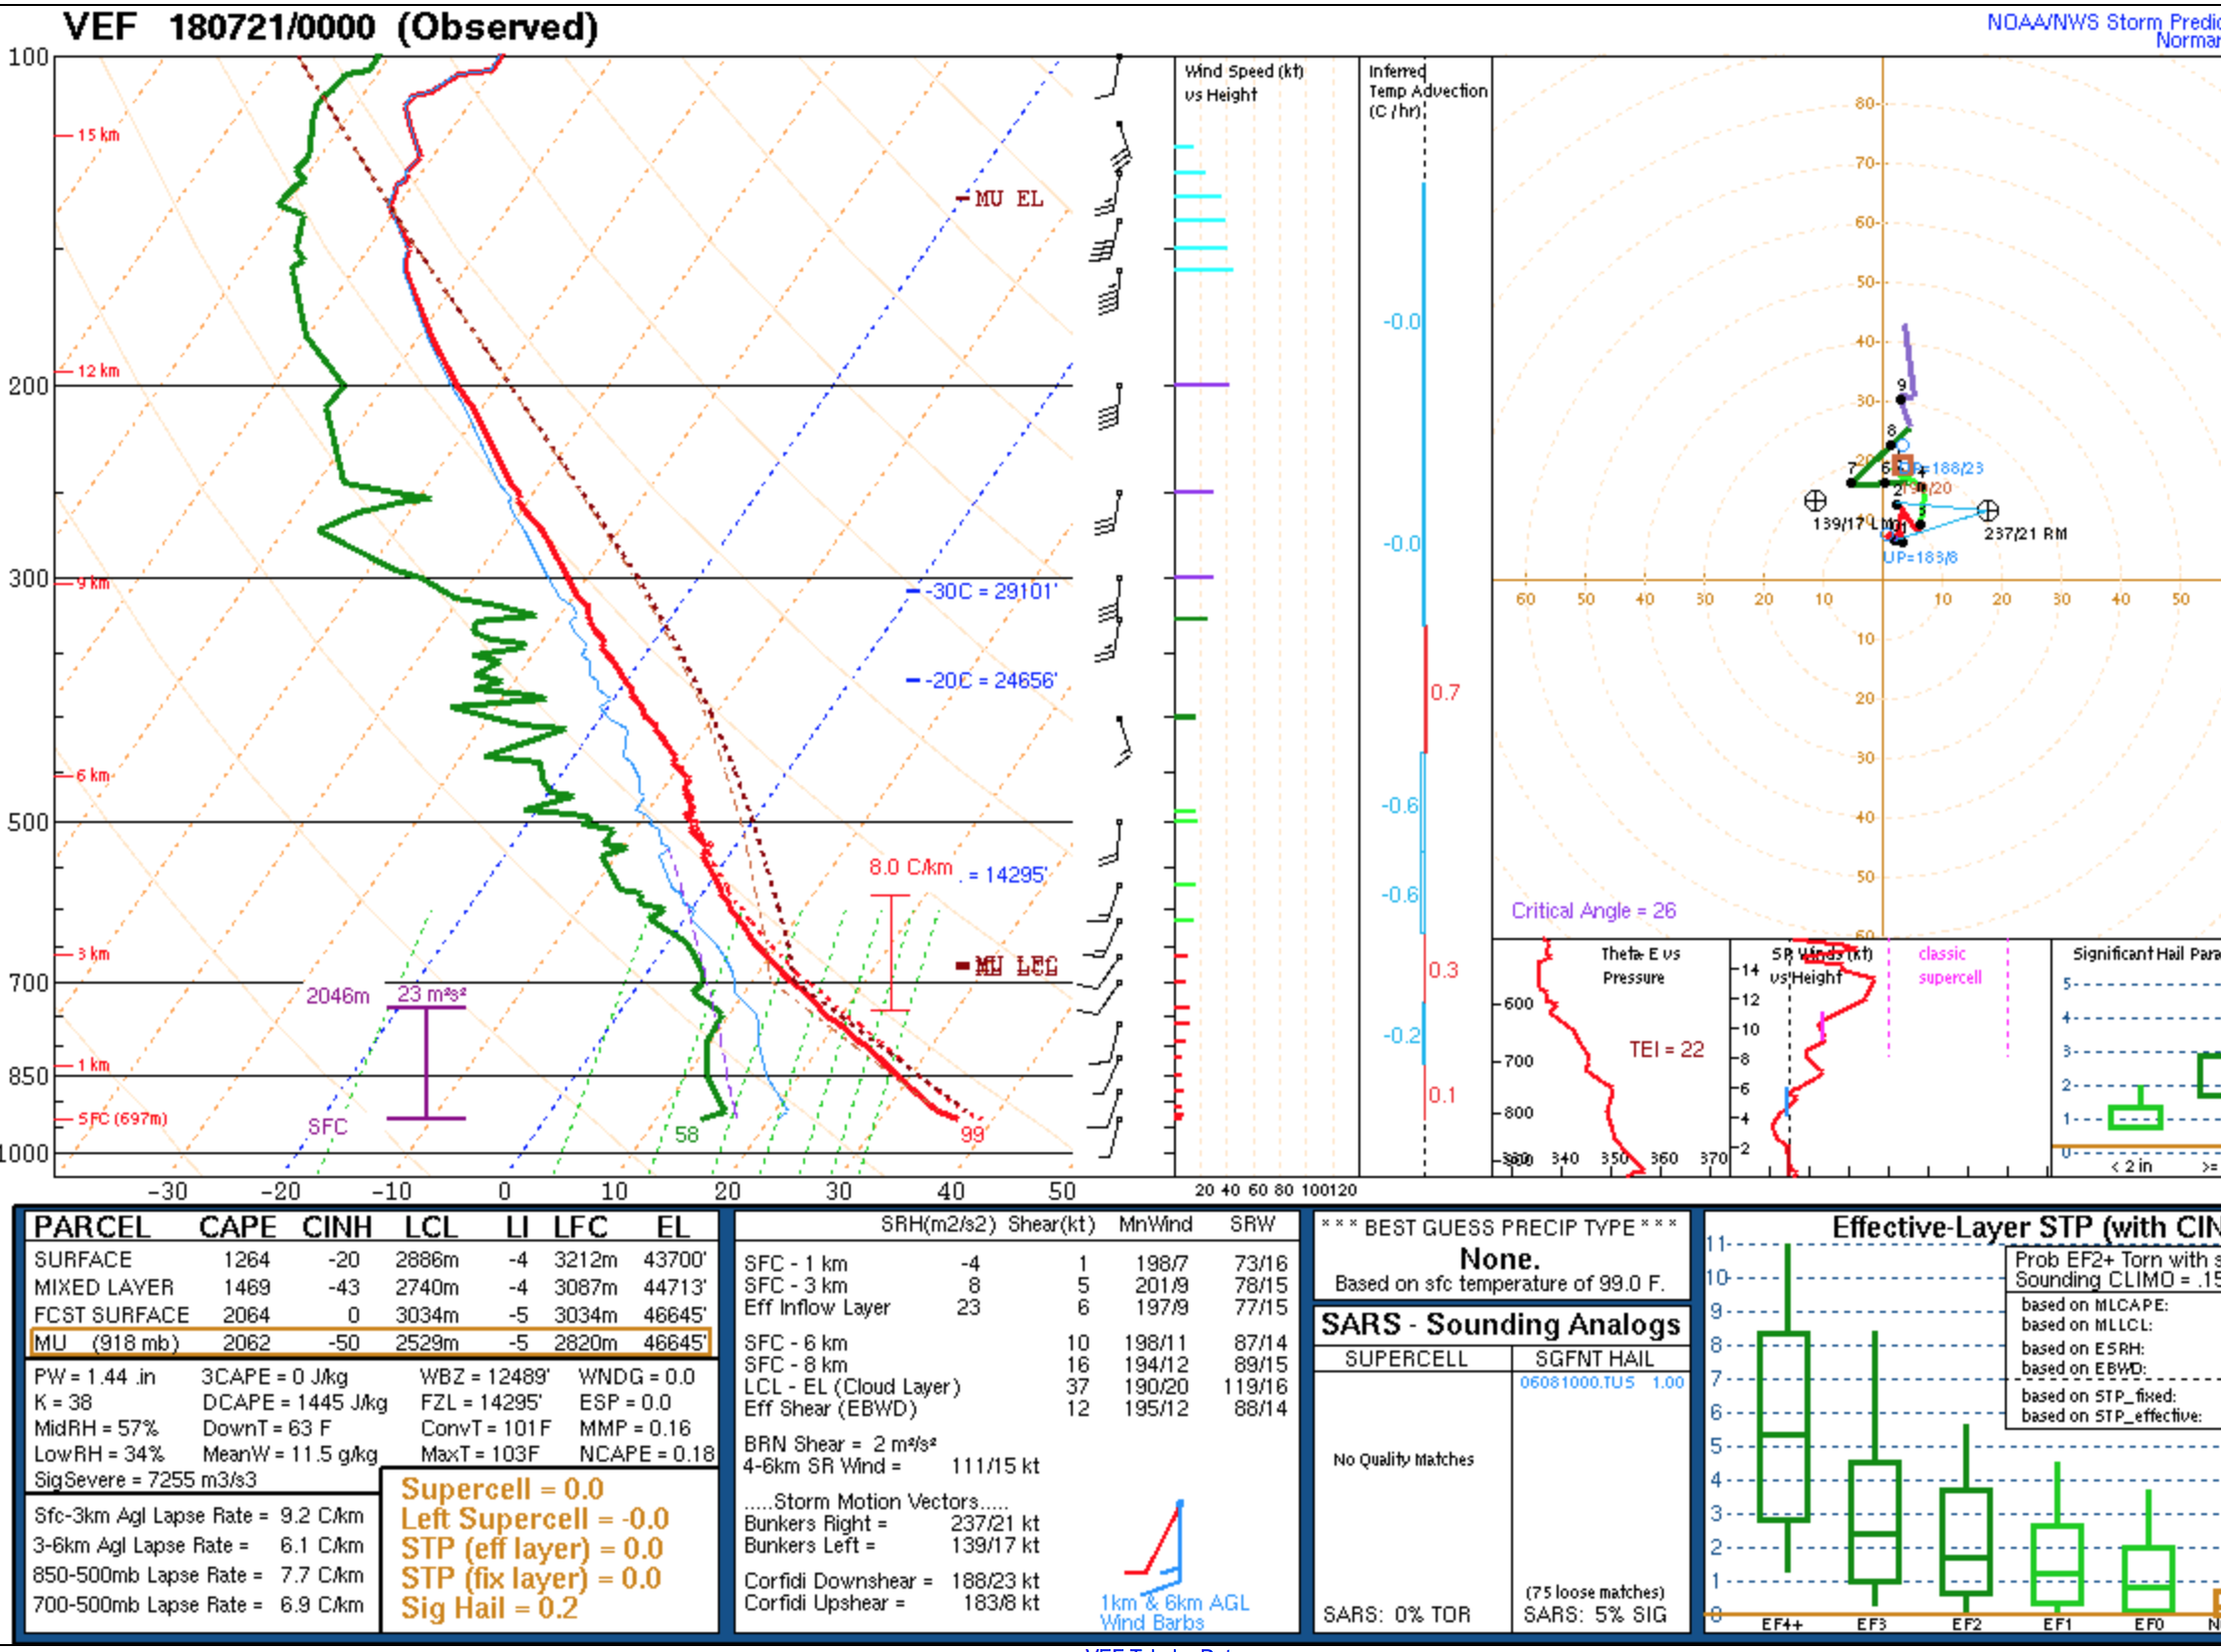

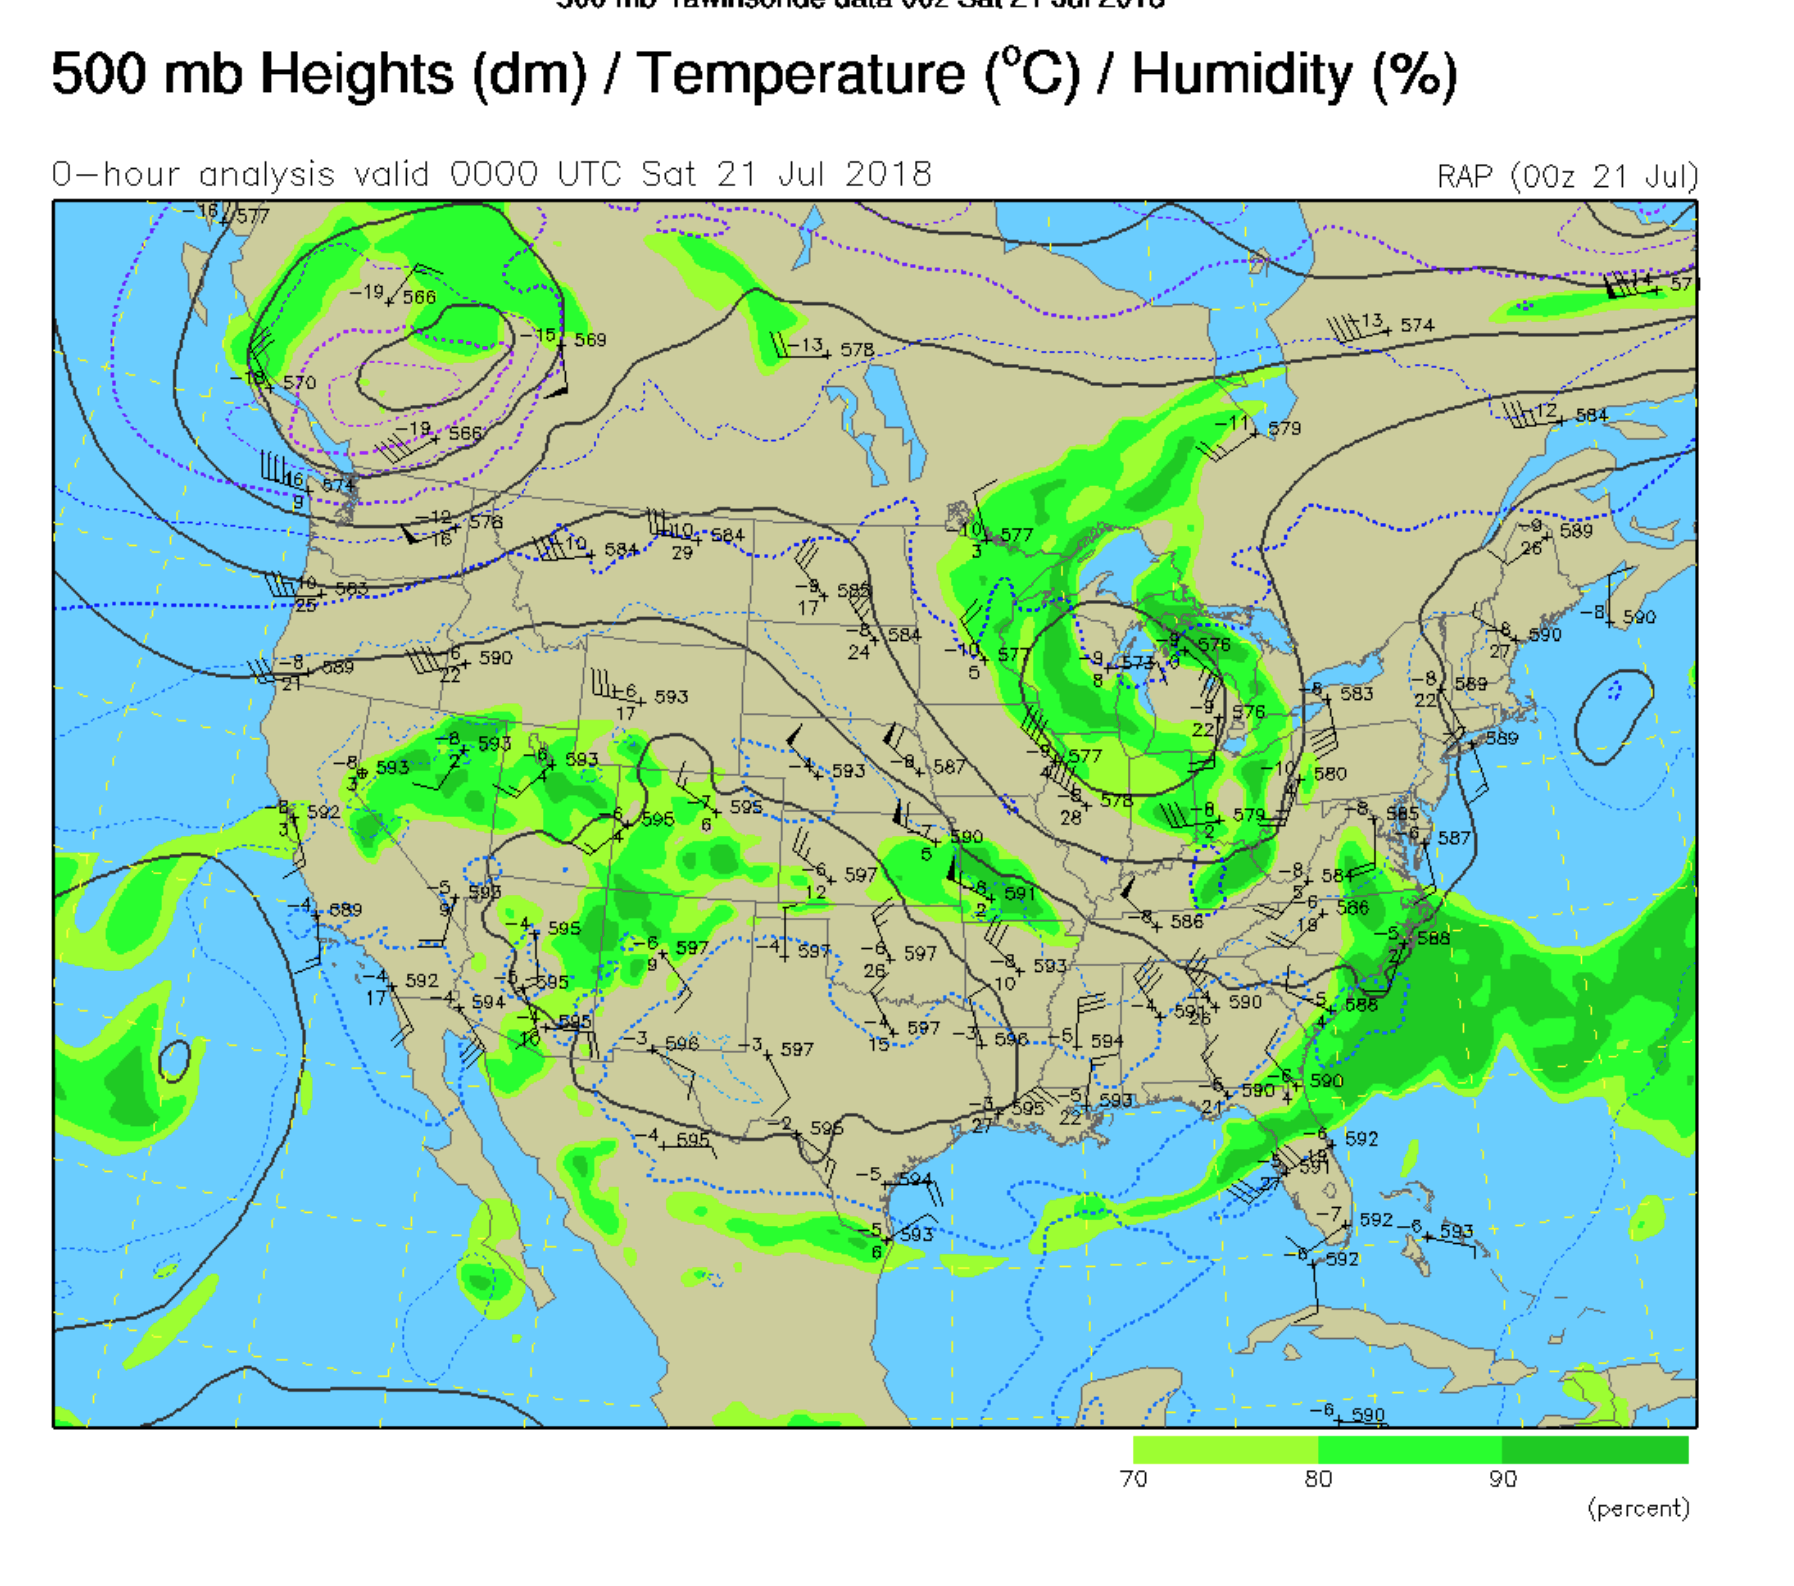
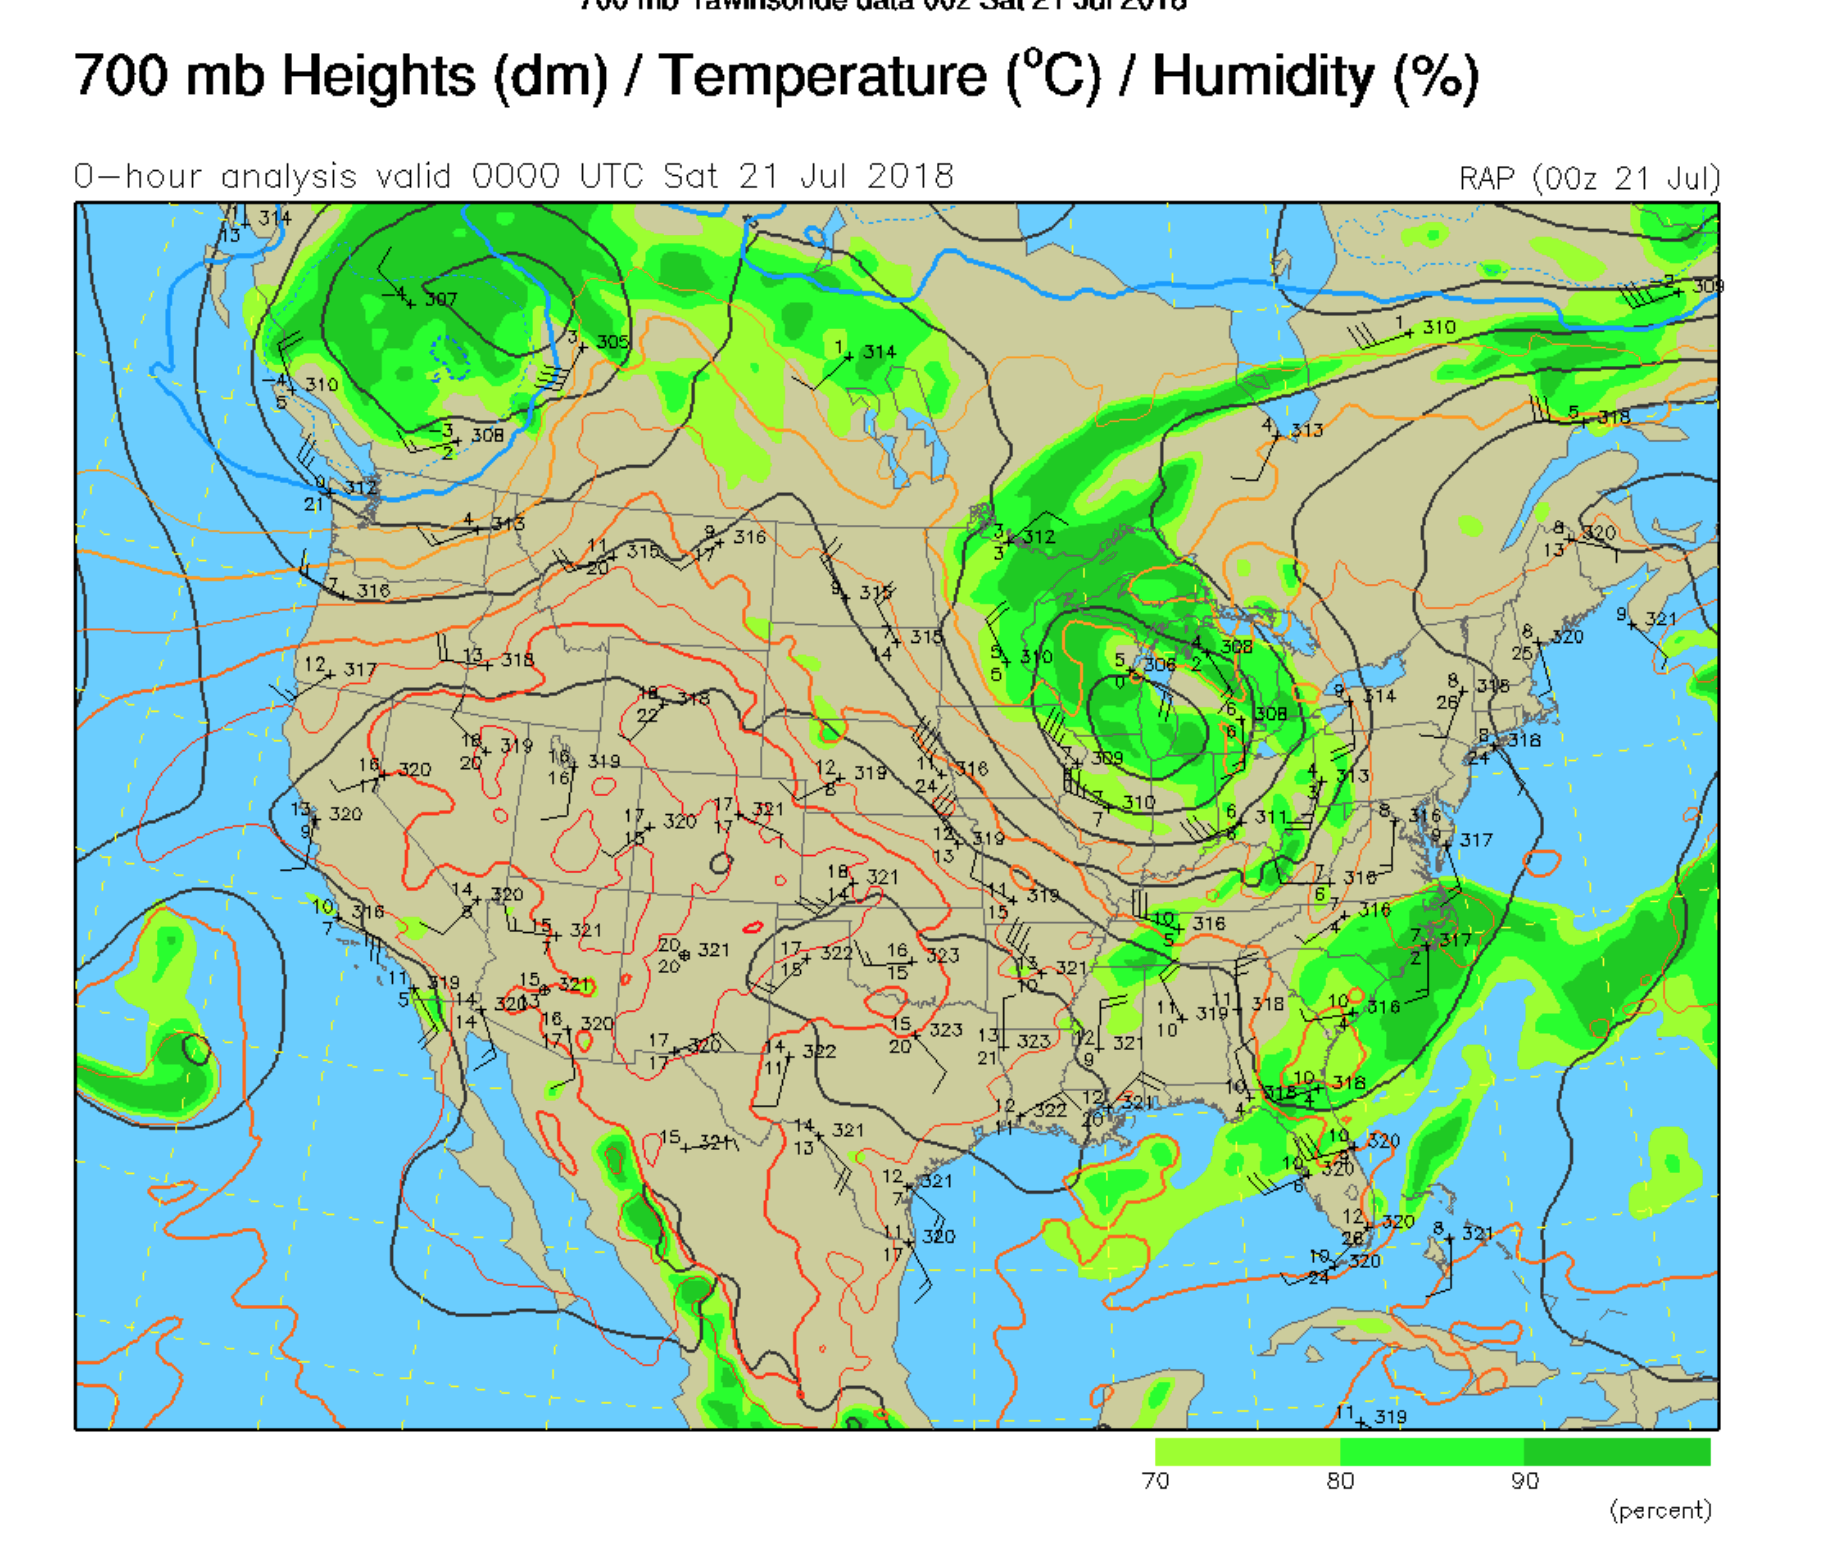
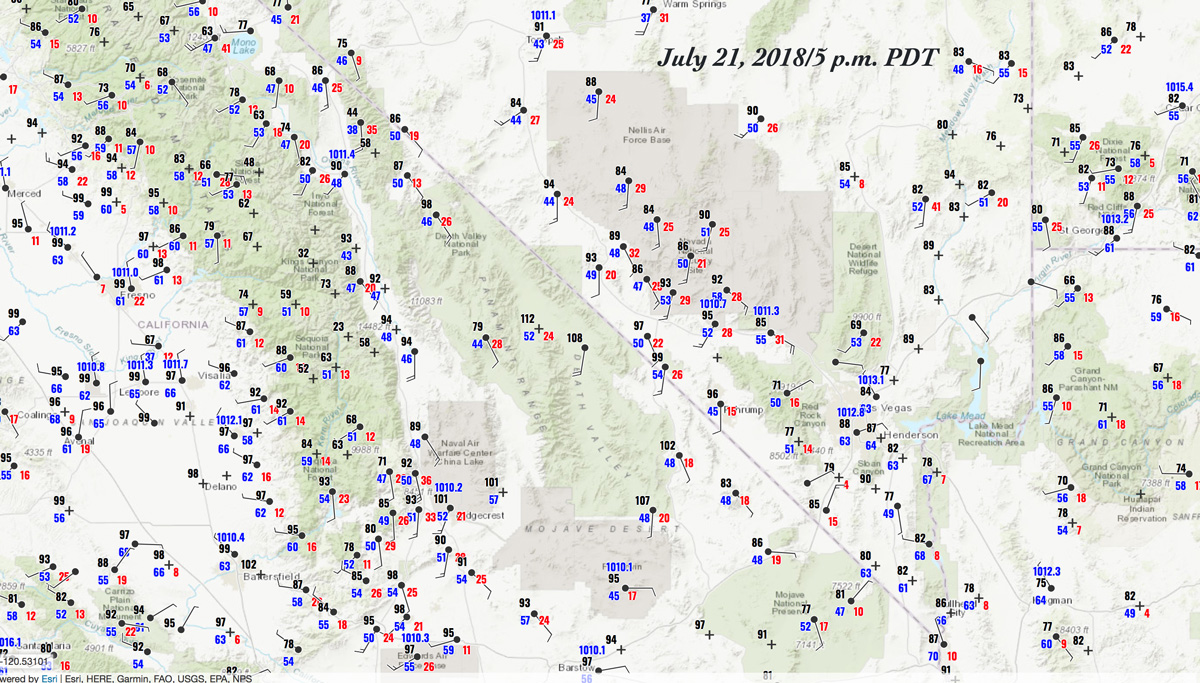
July 21
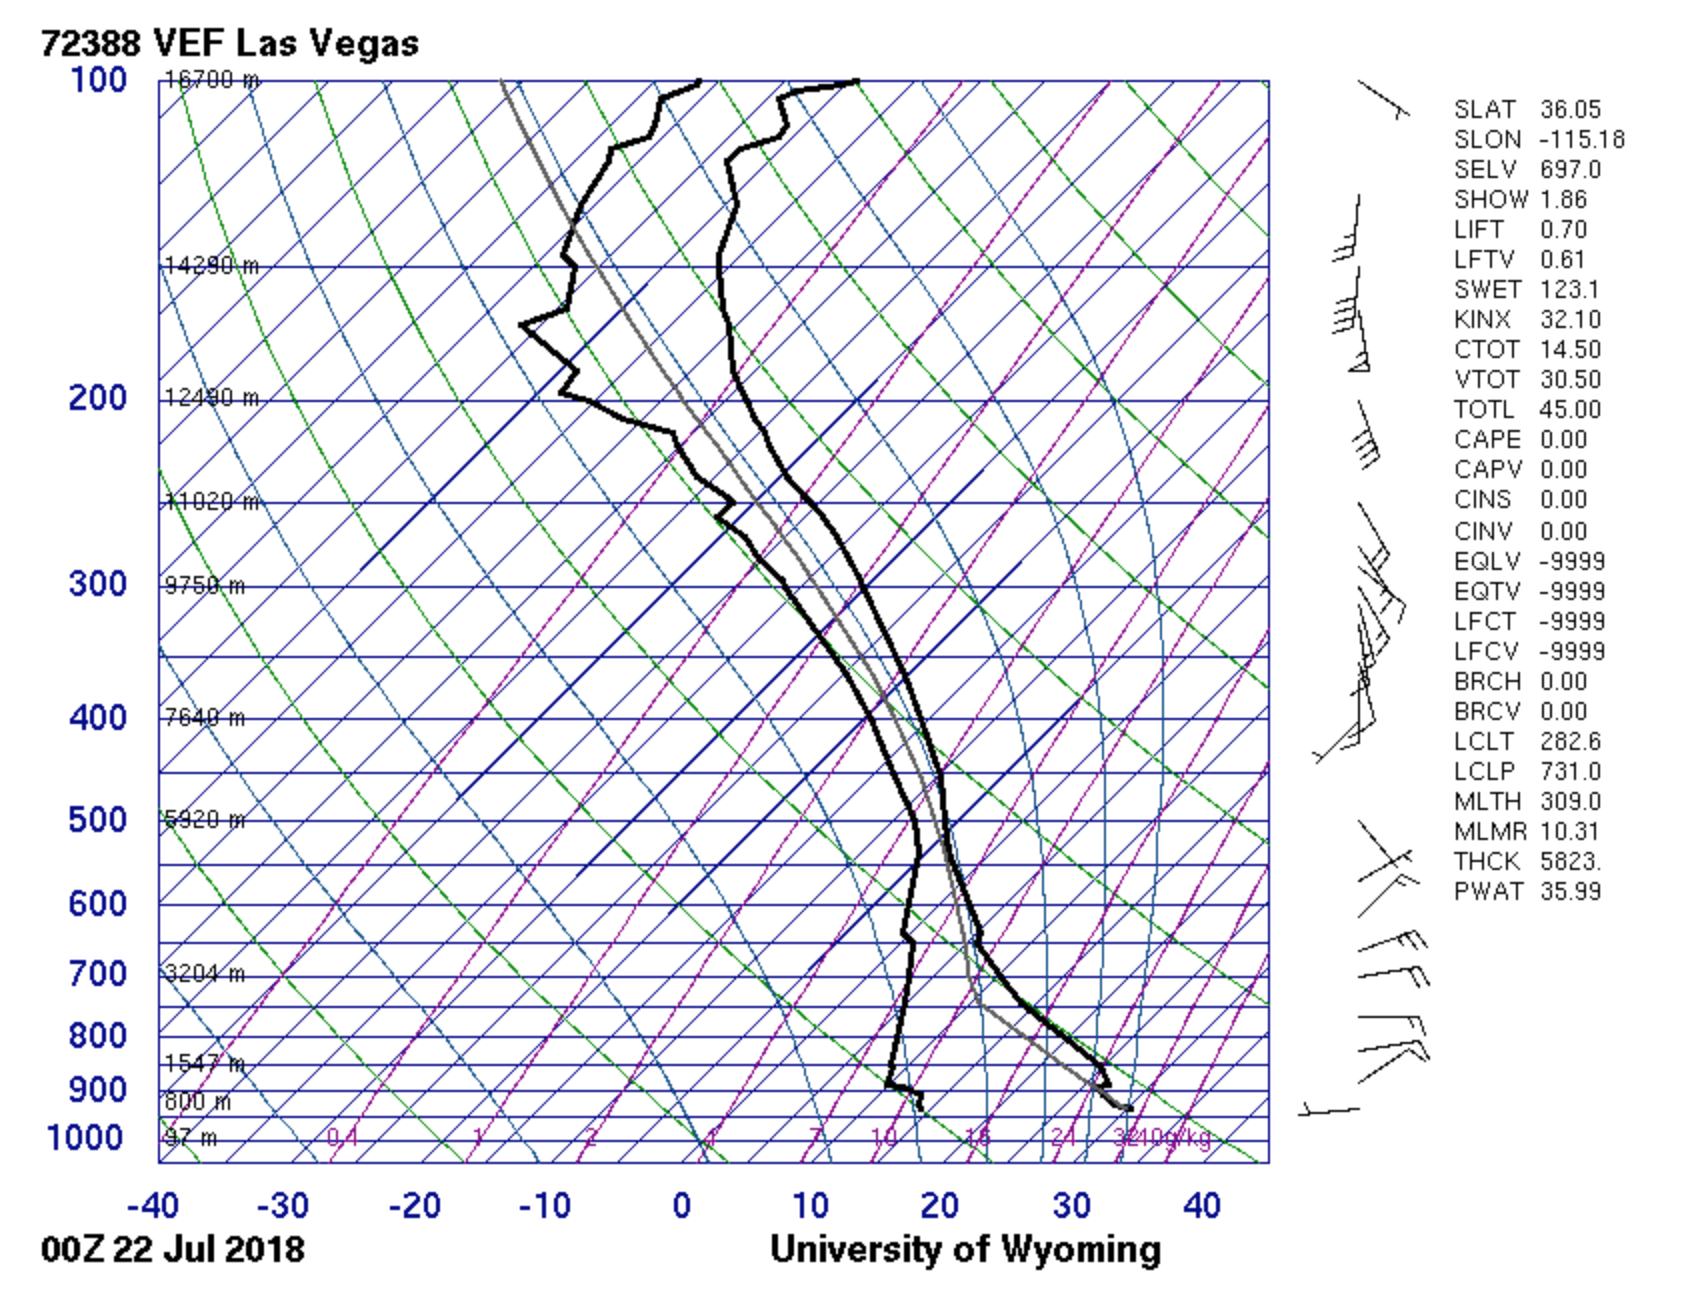
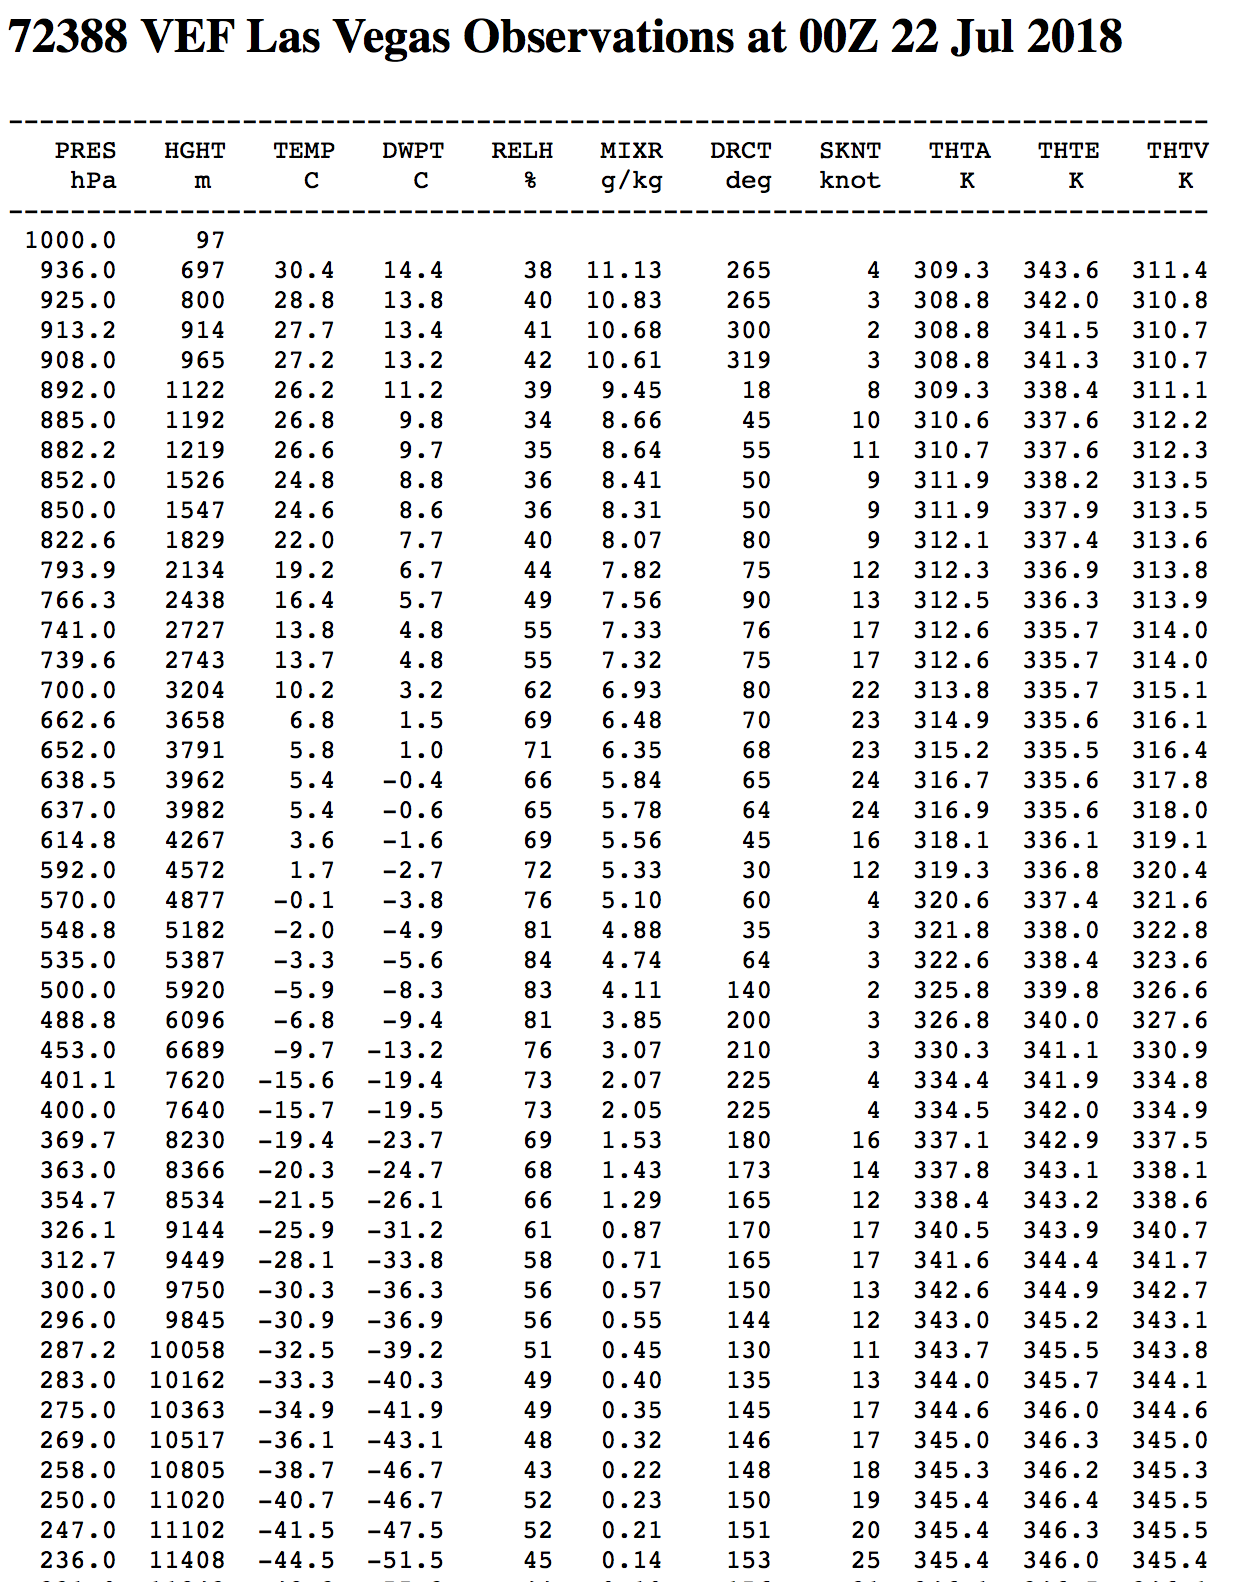
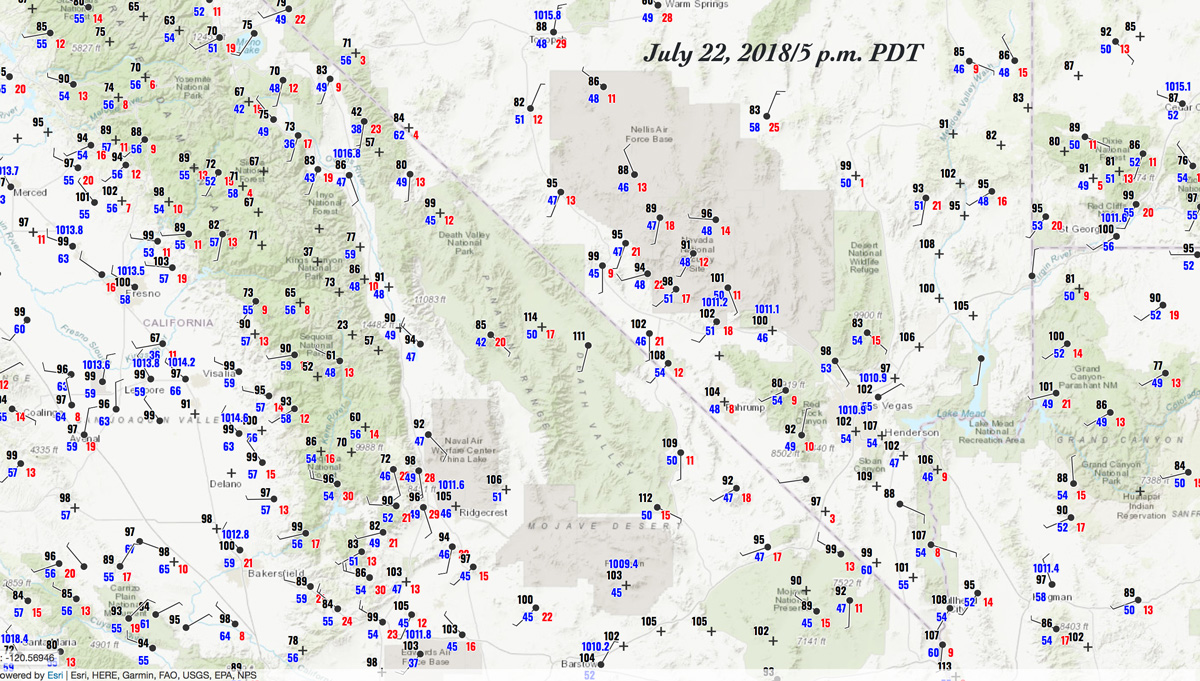
July 22
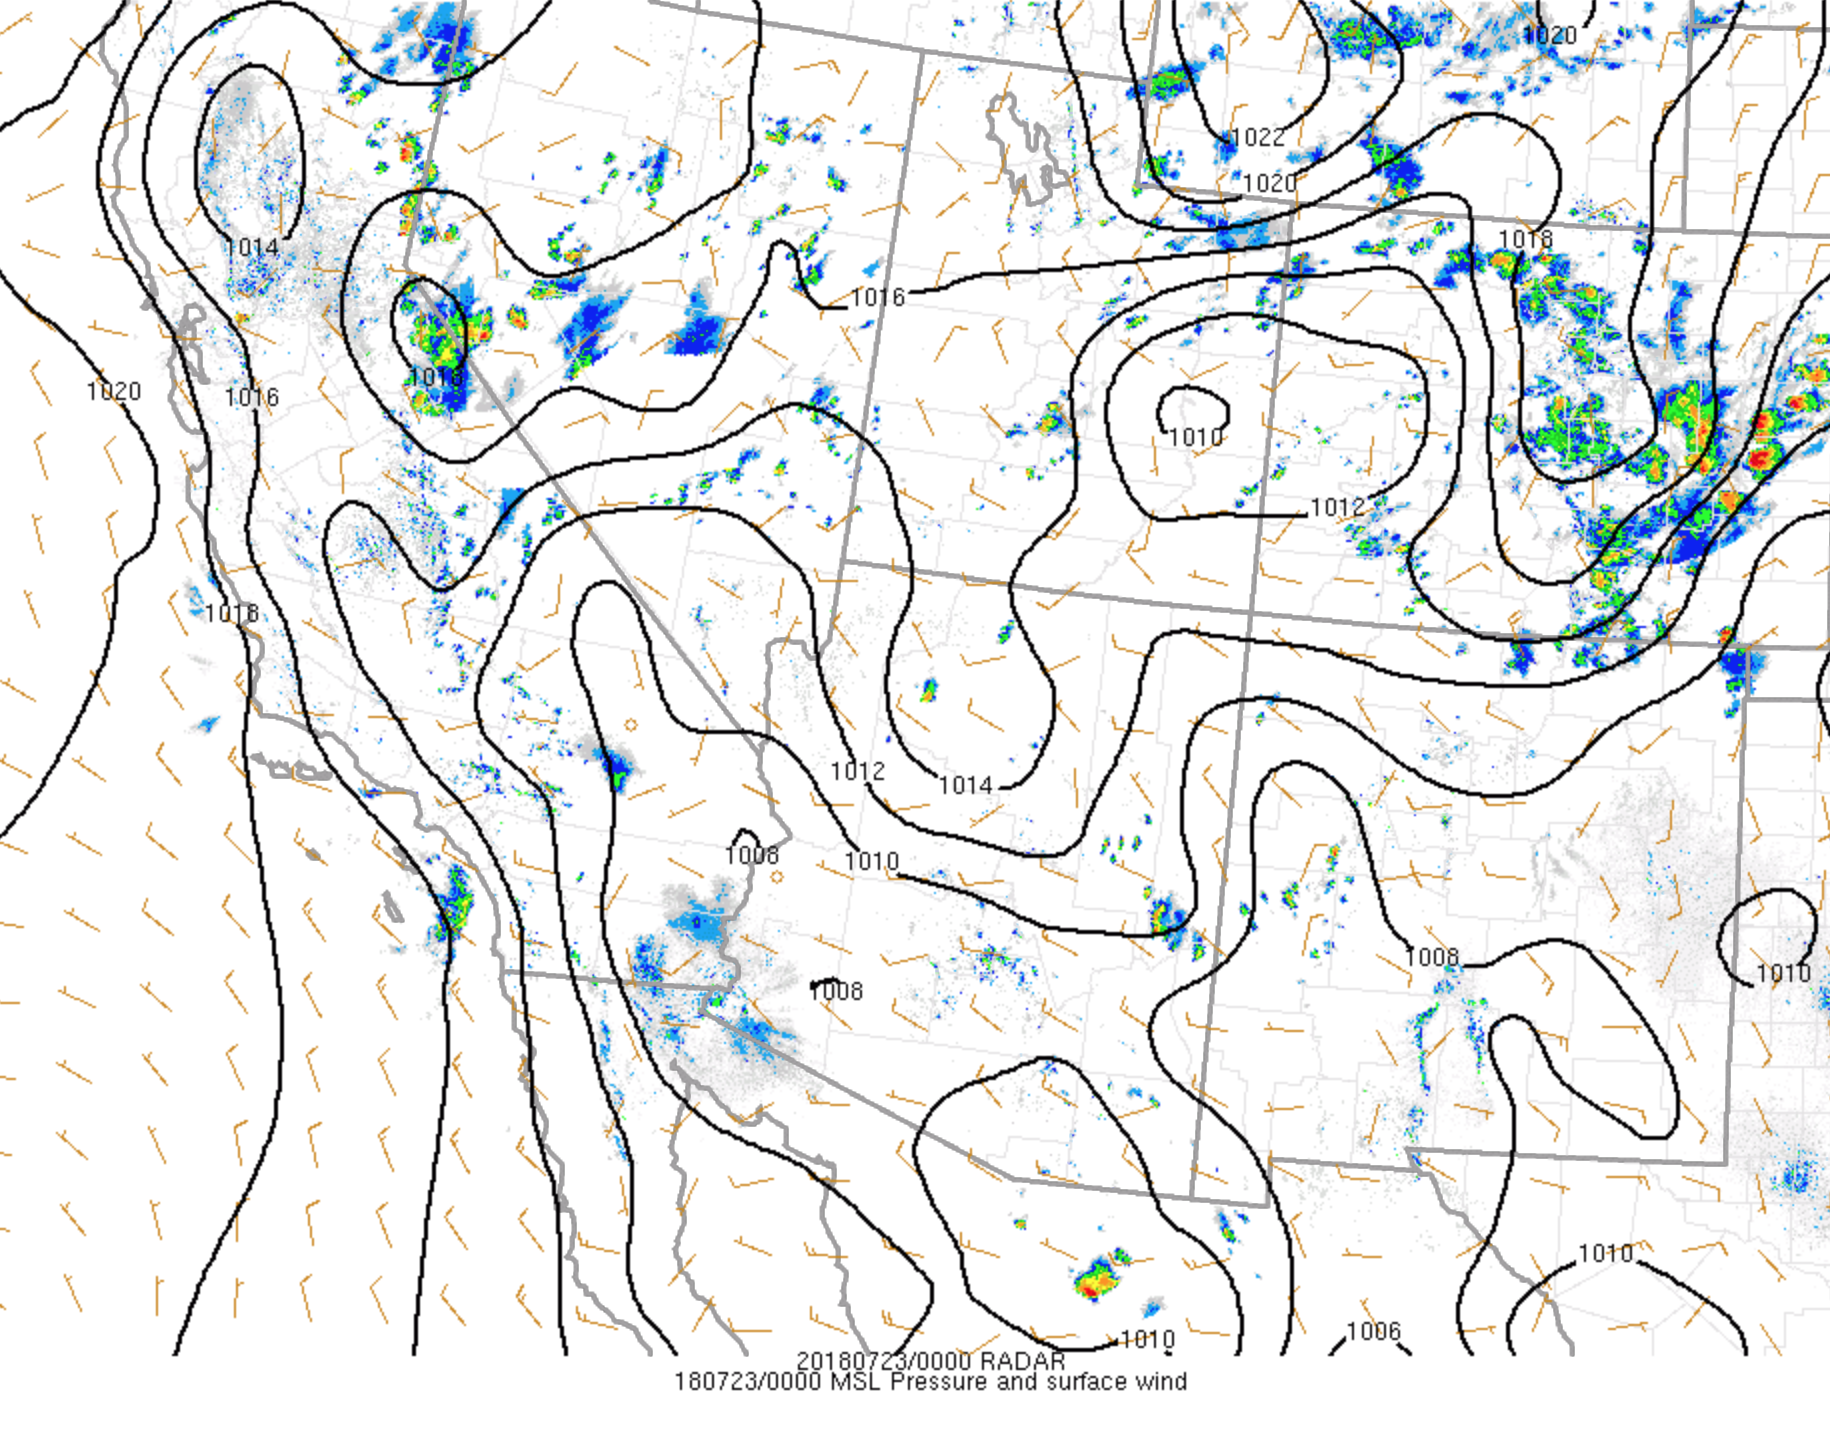

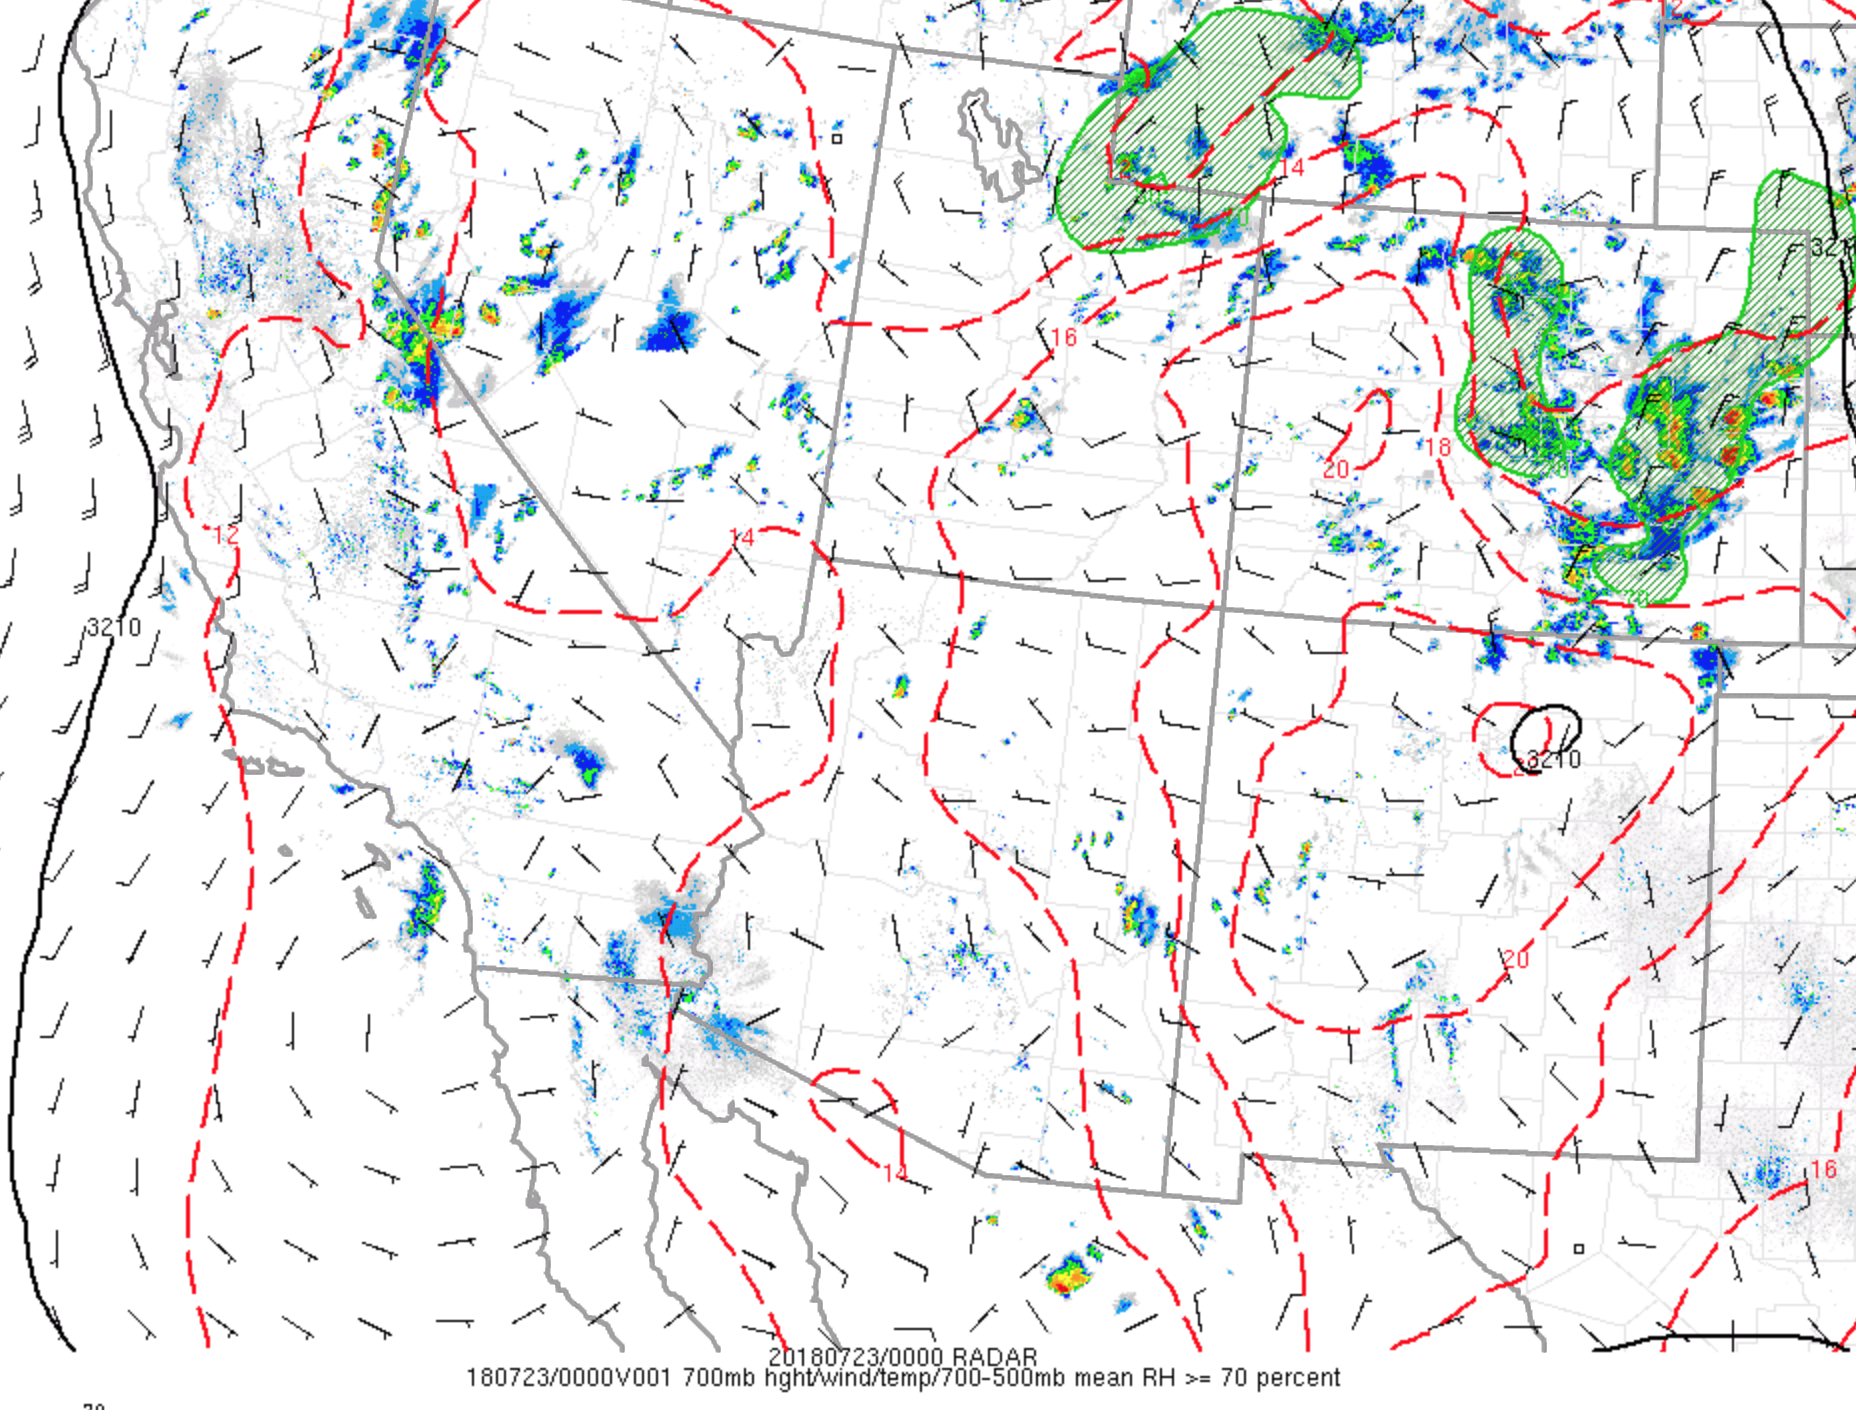
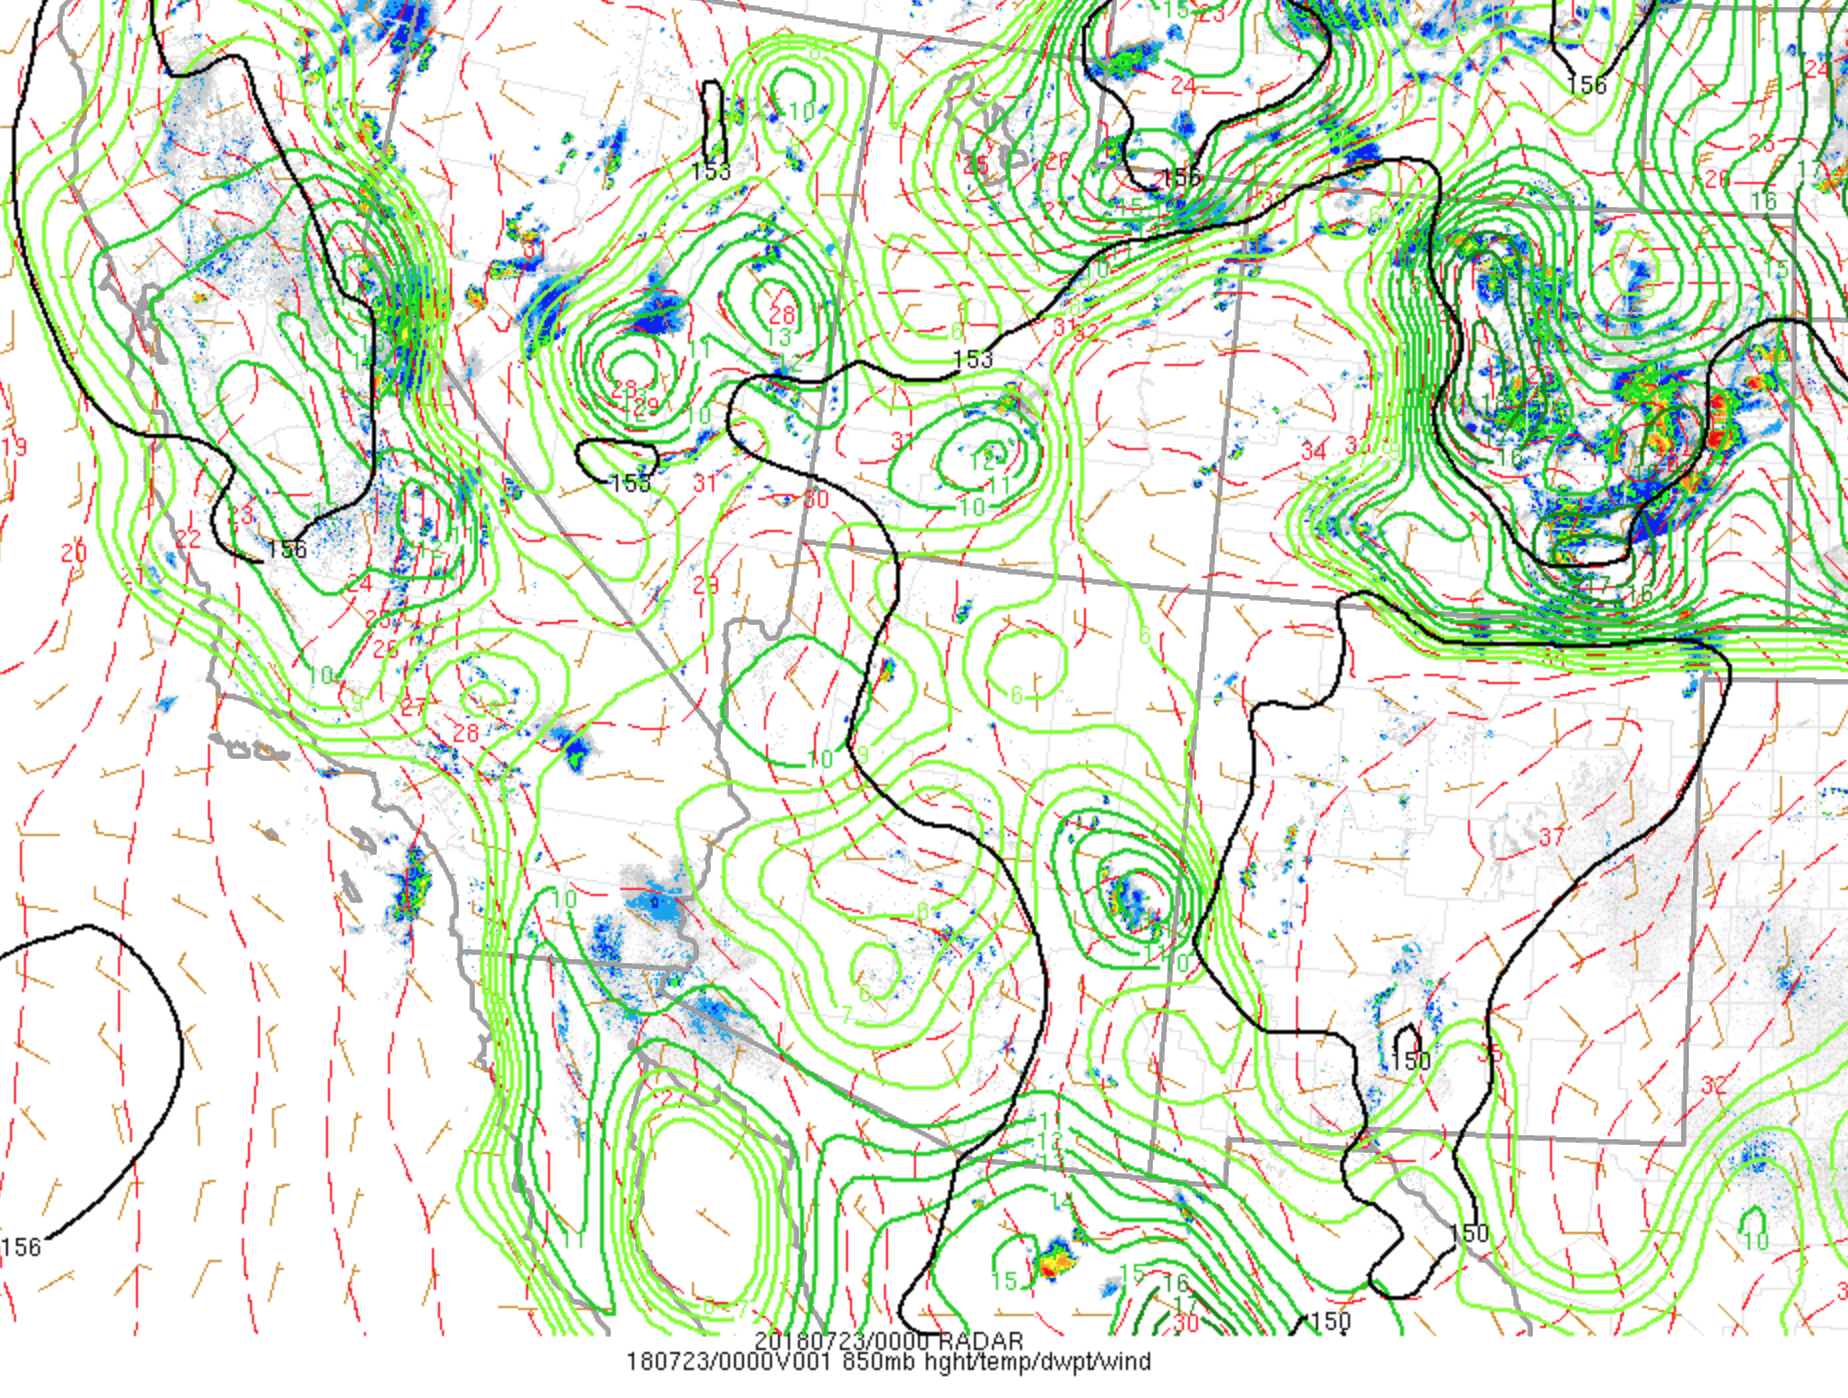
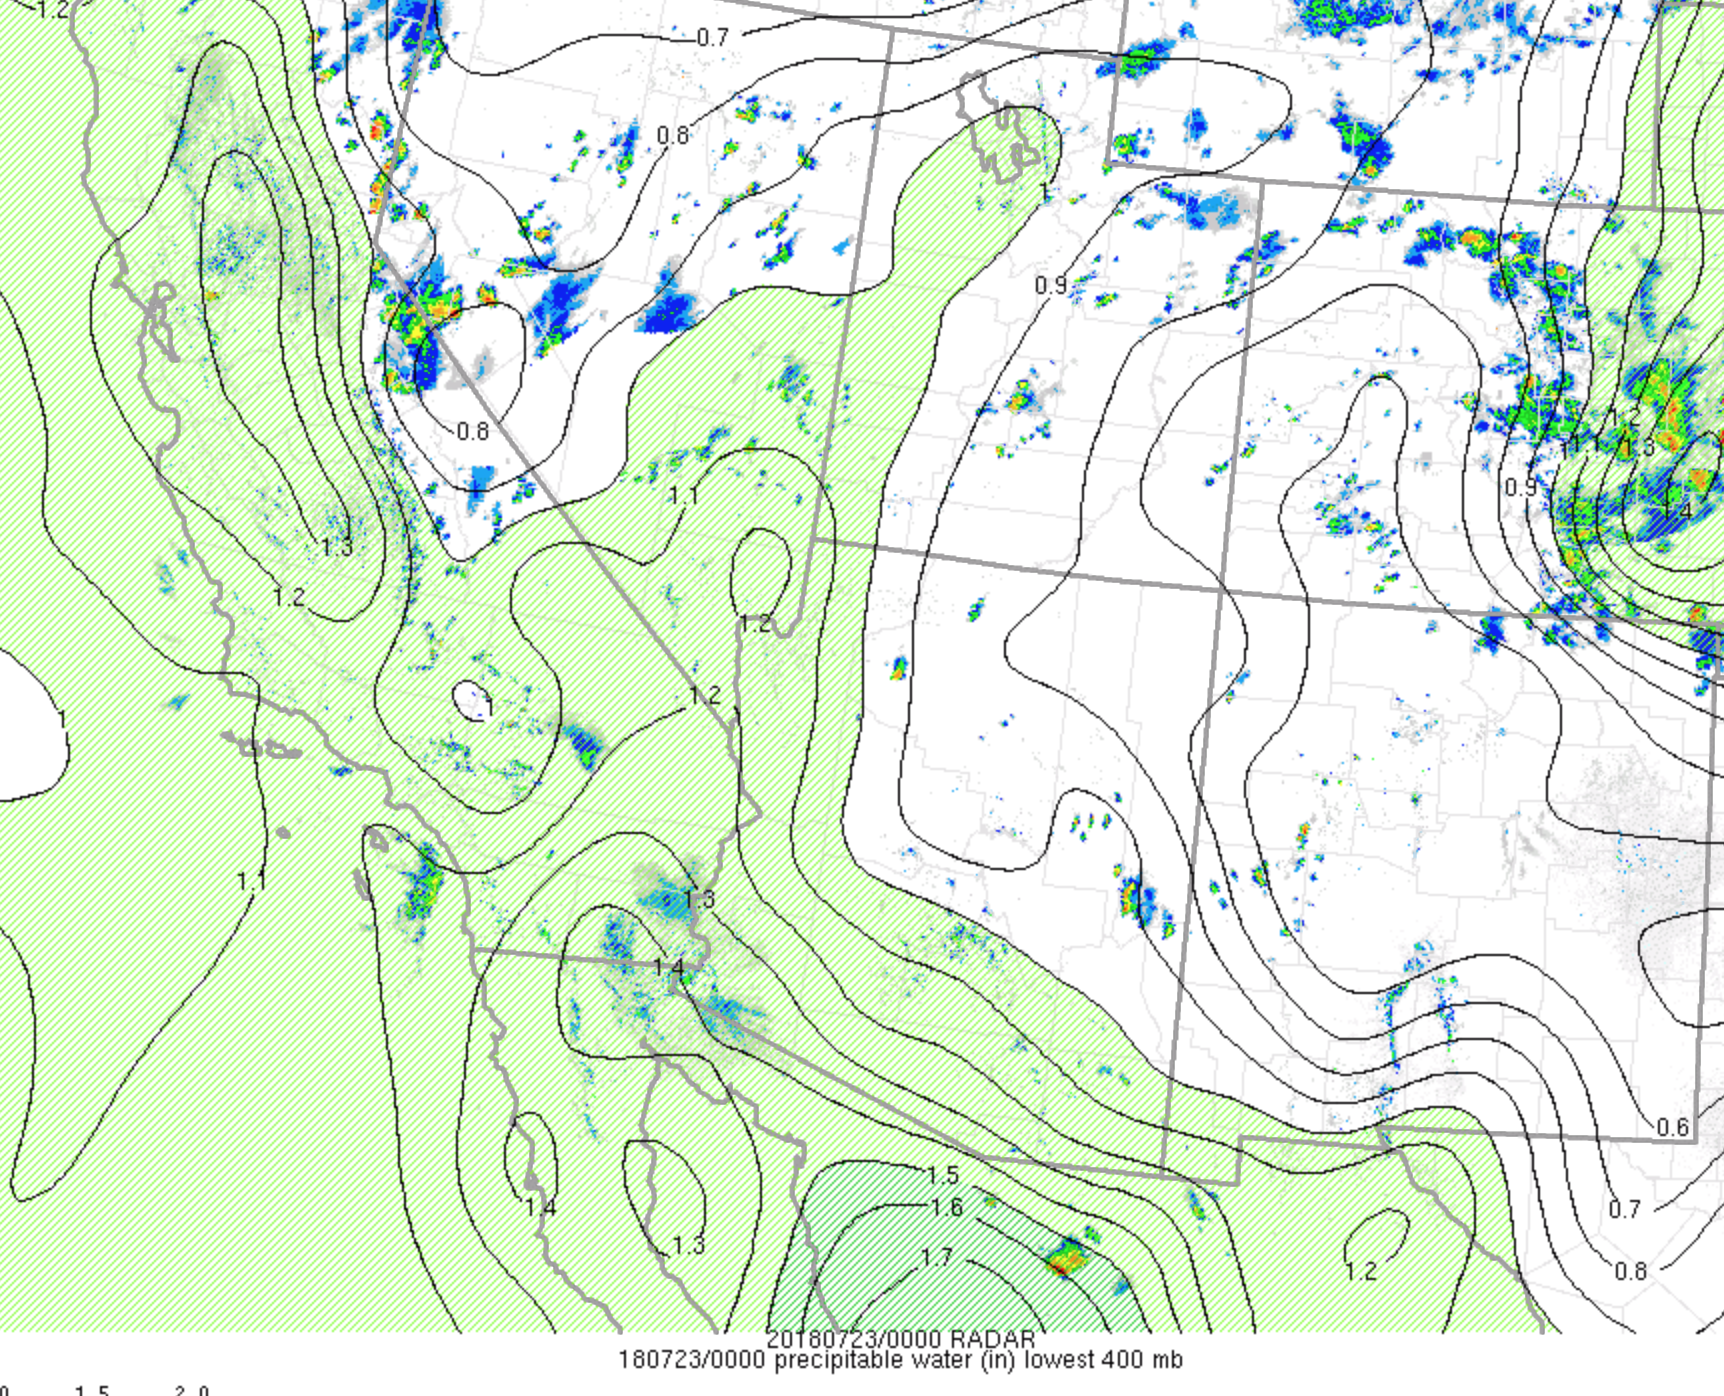
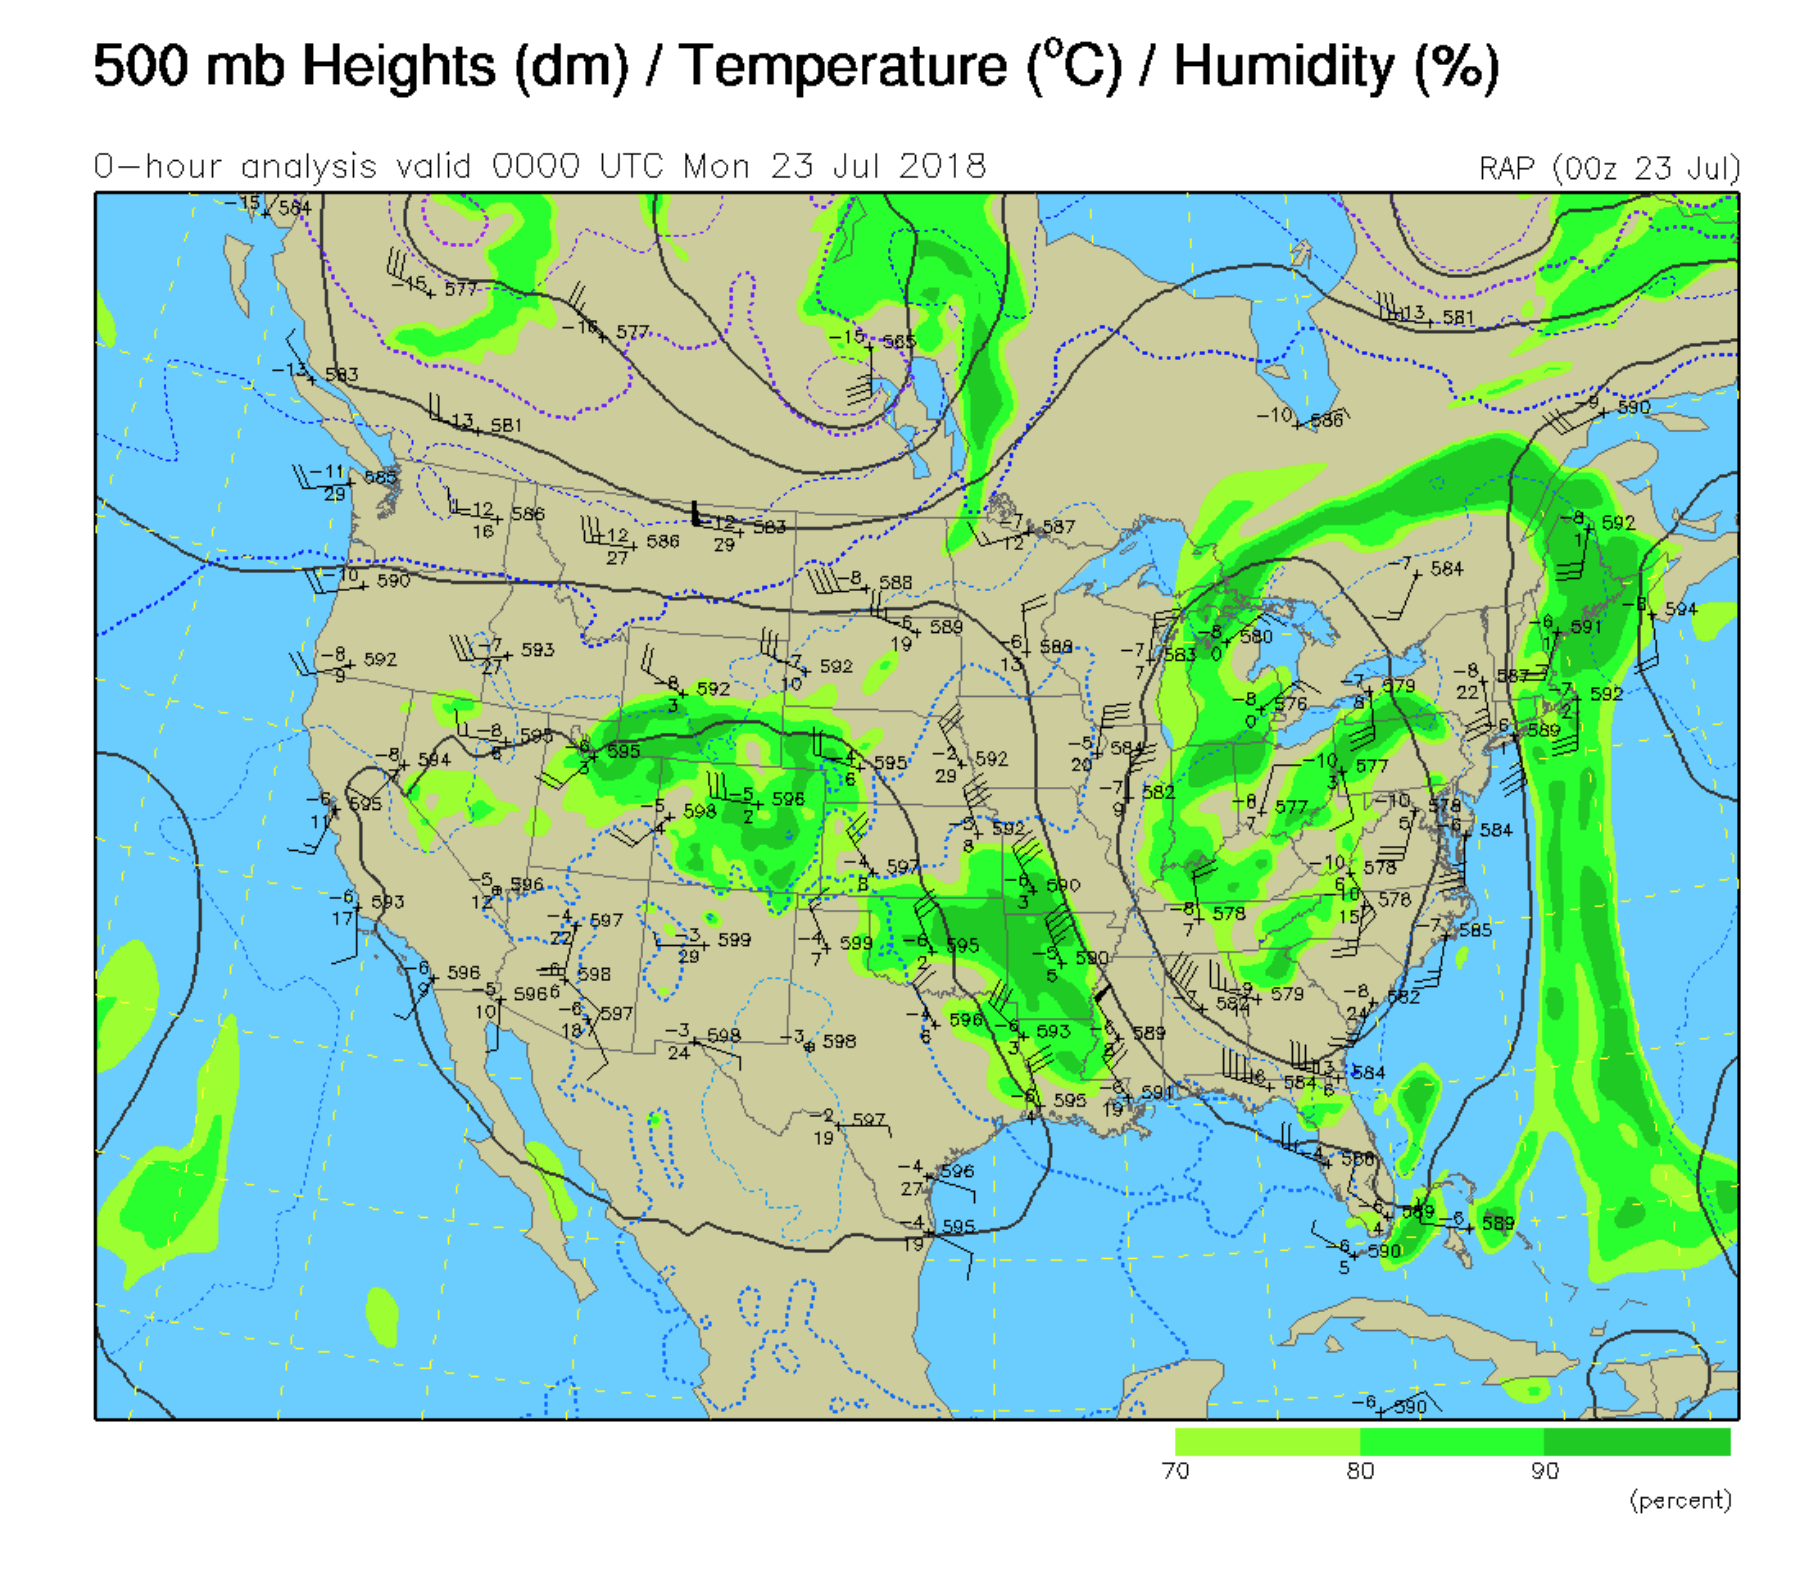

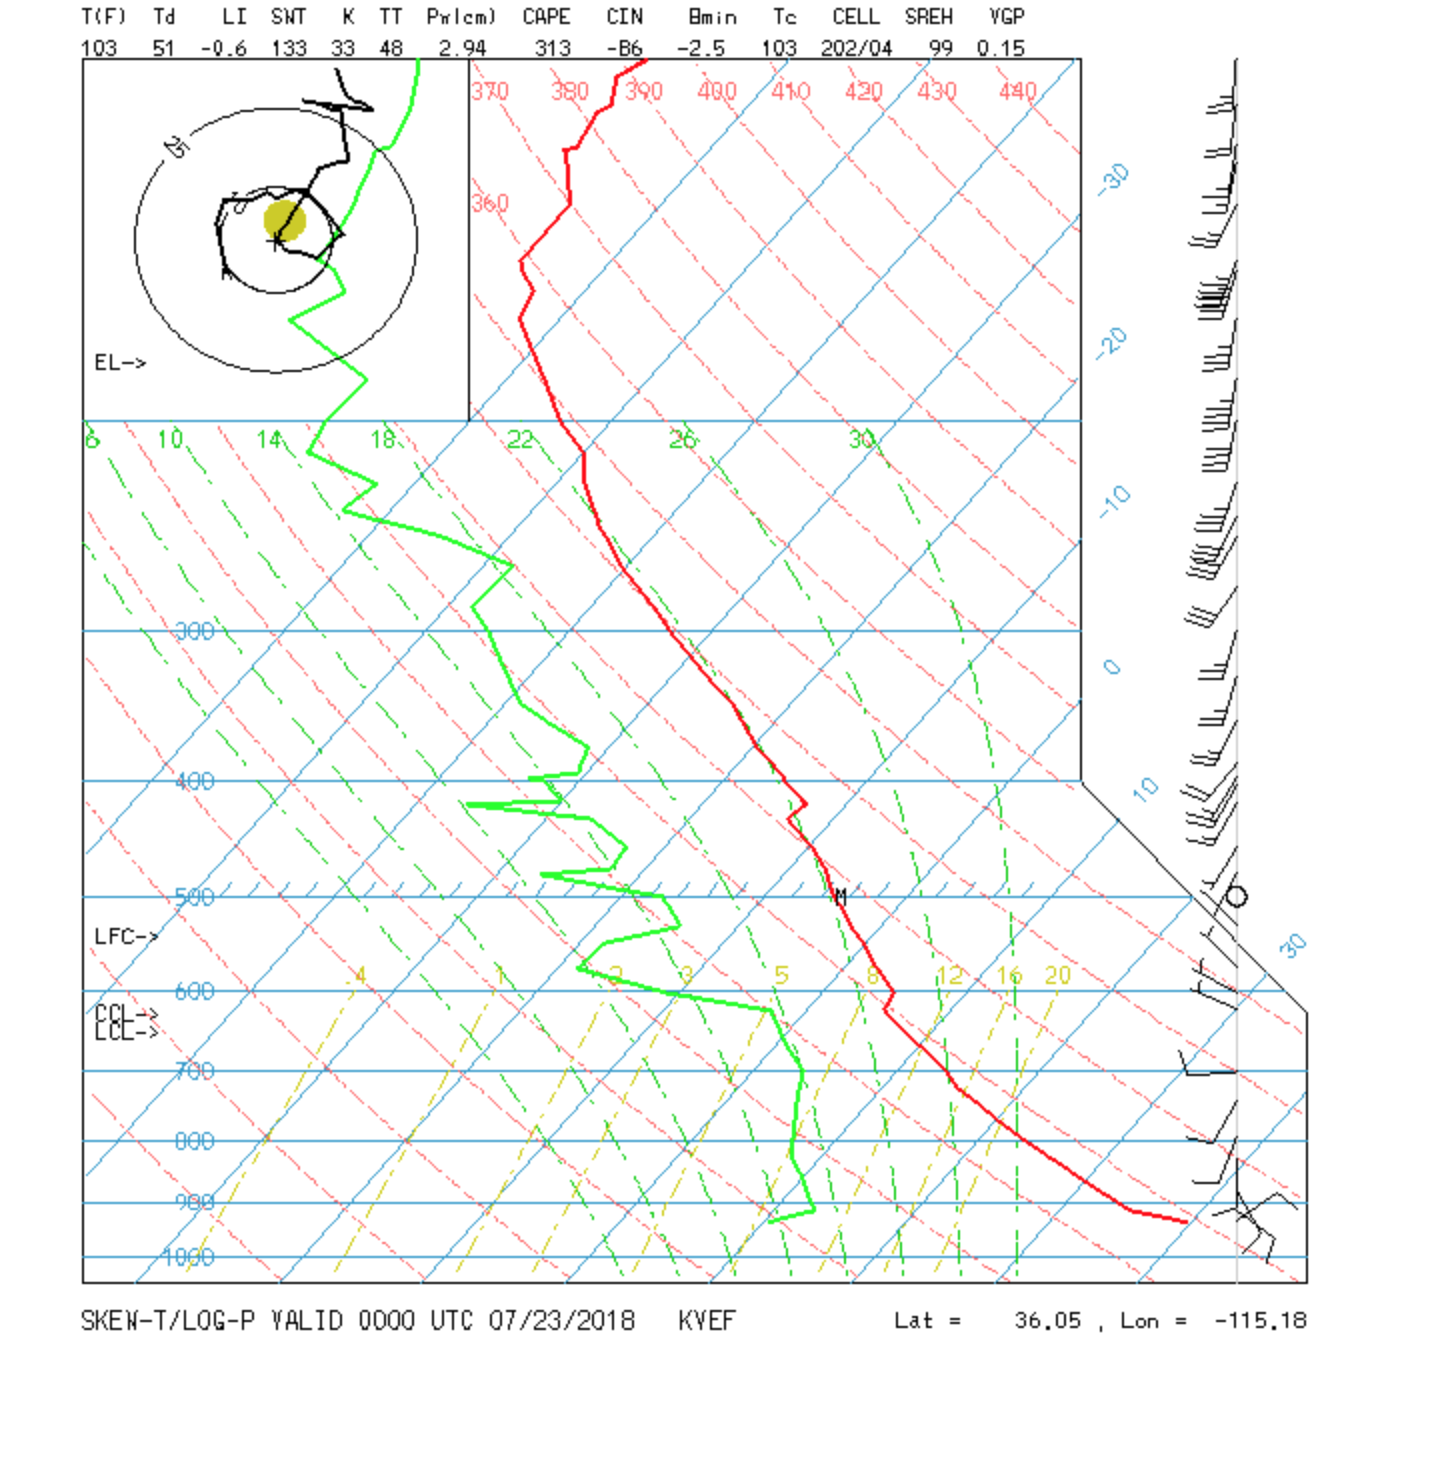
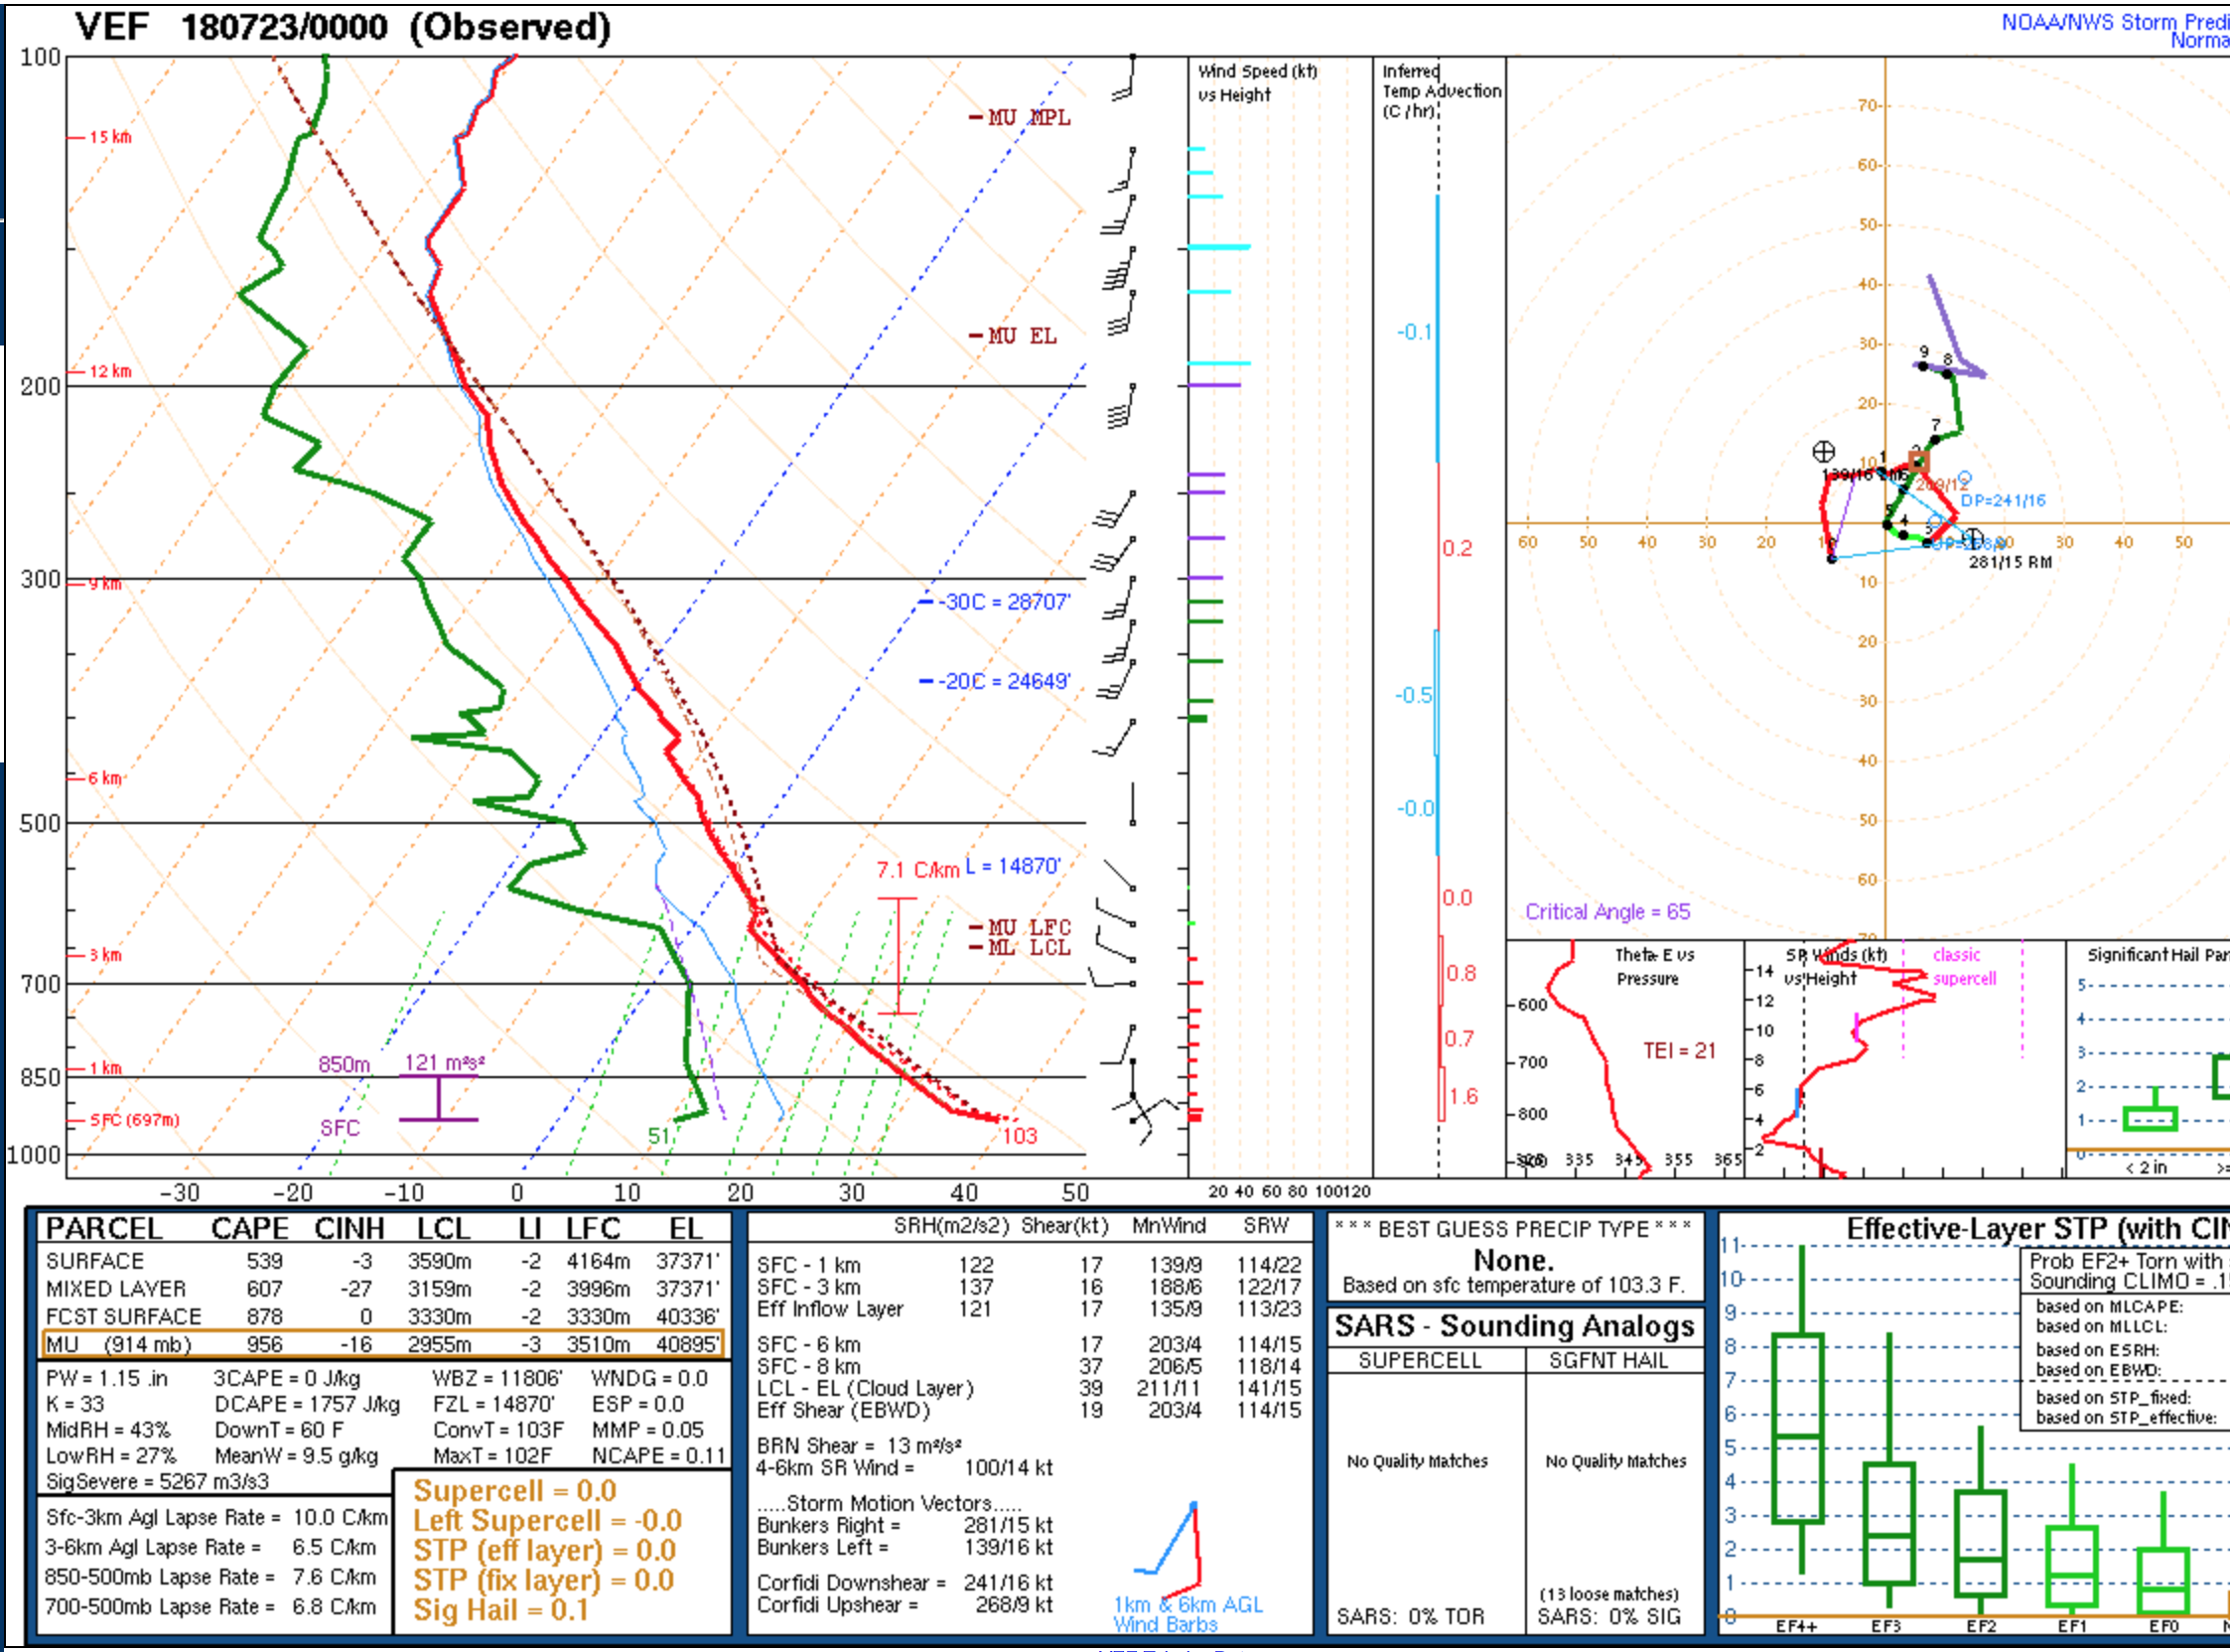
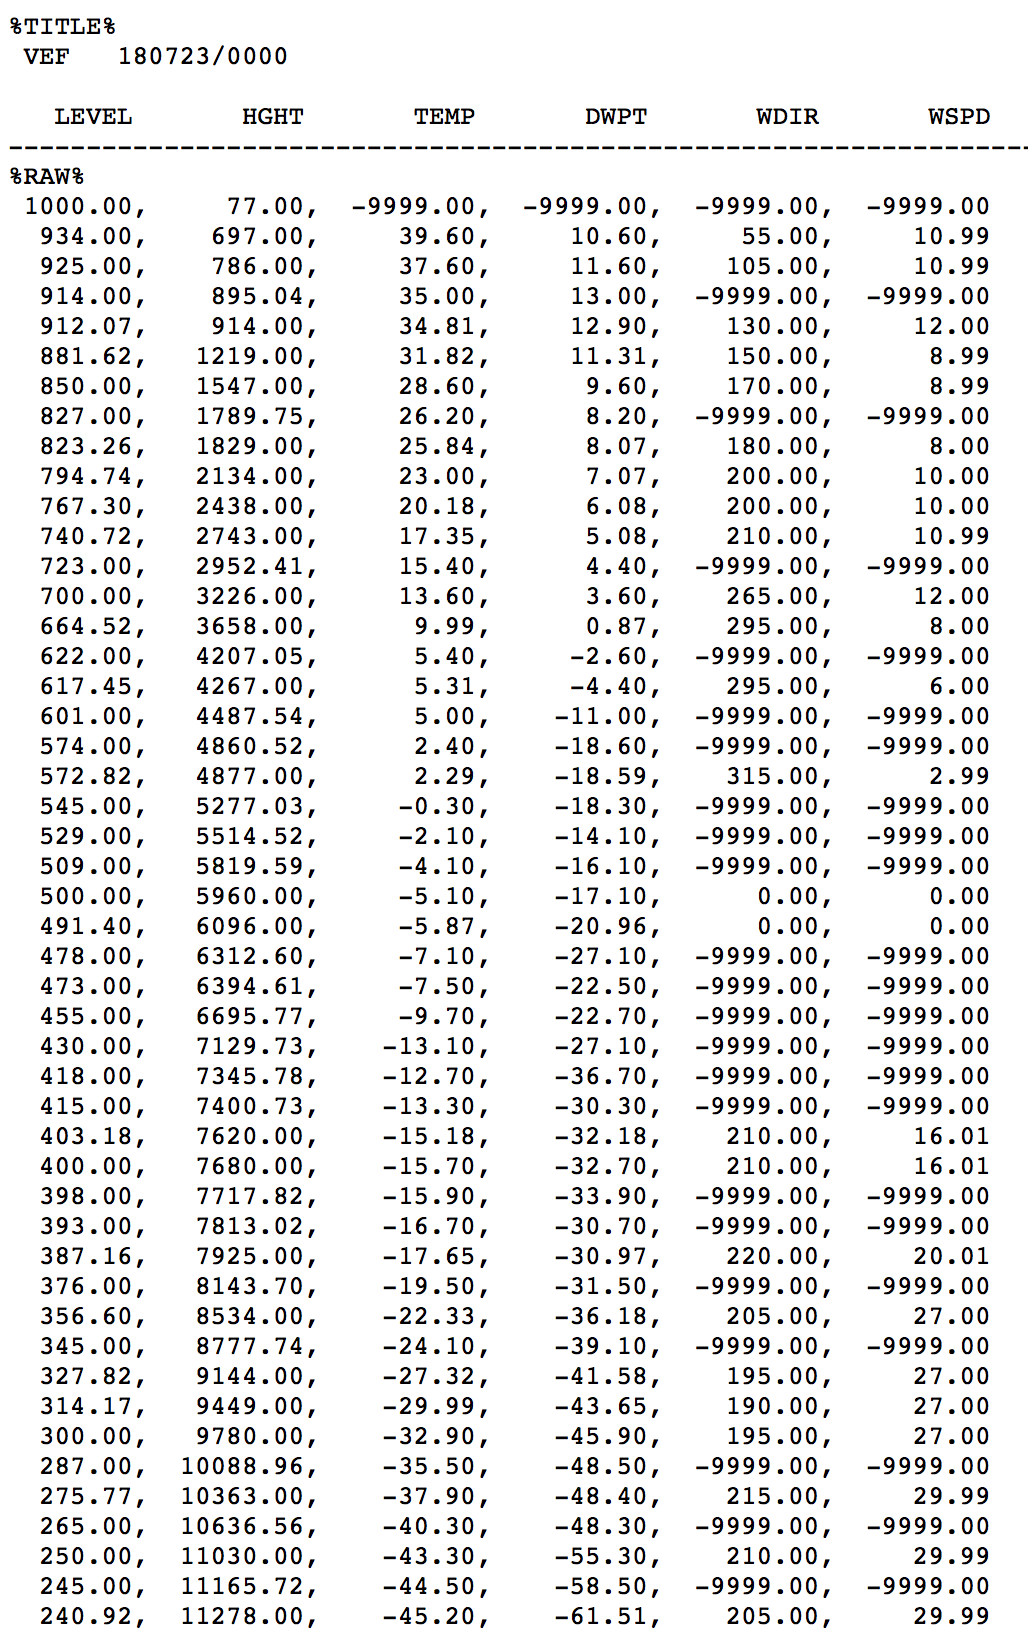
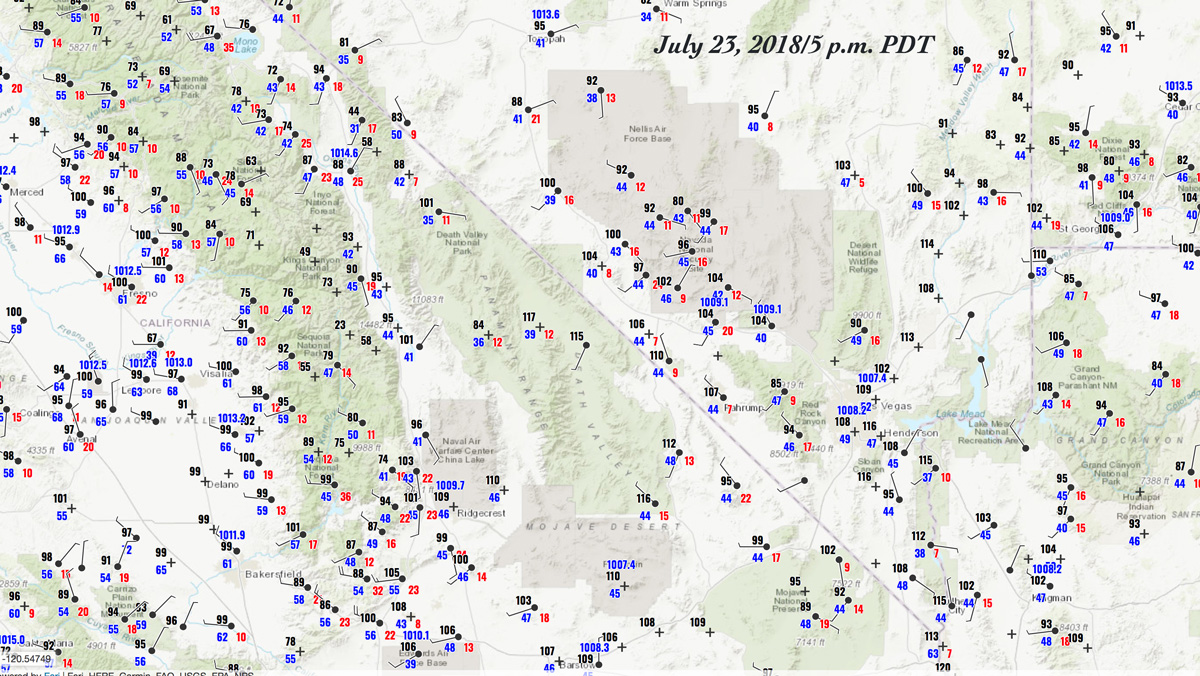
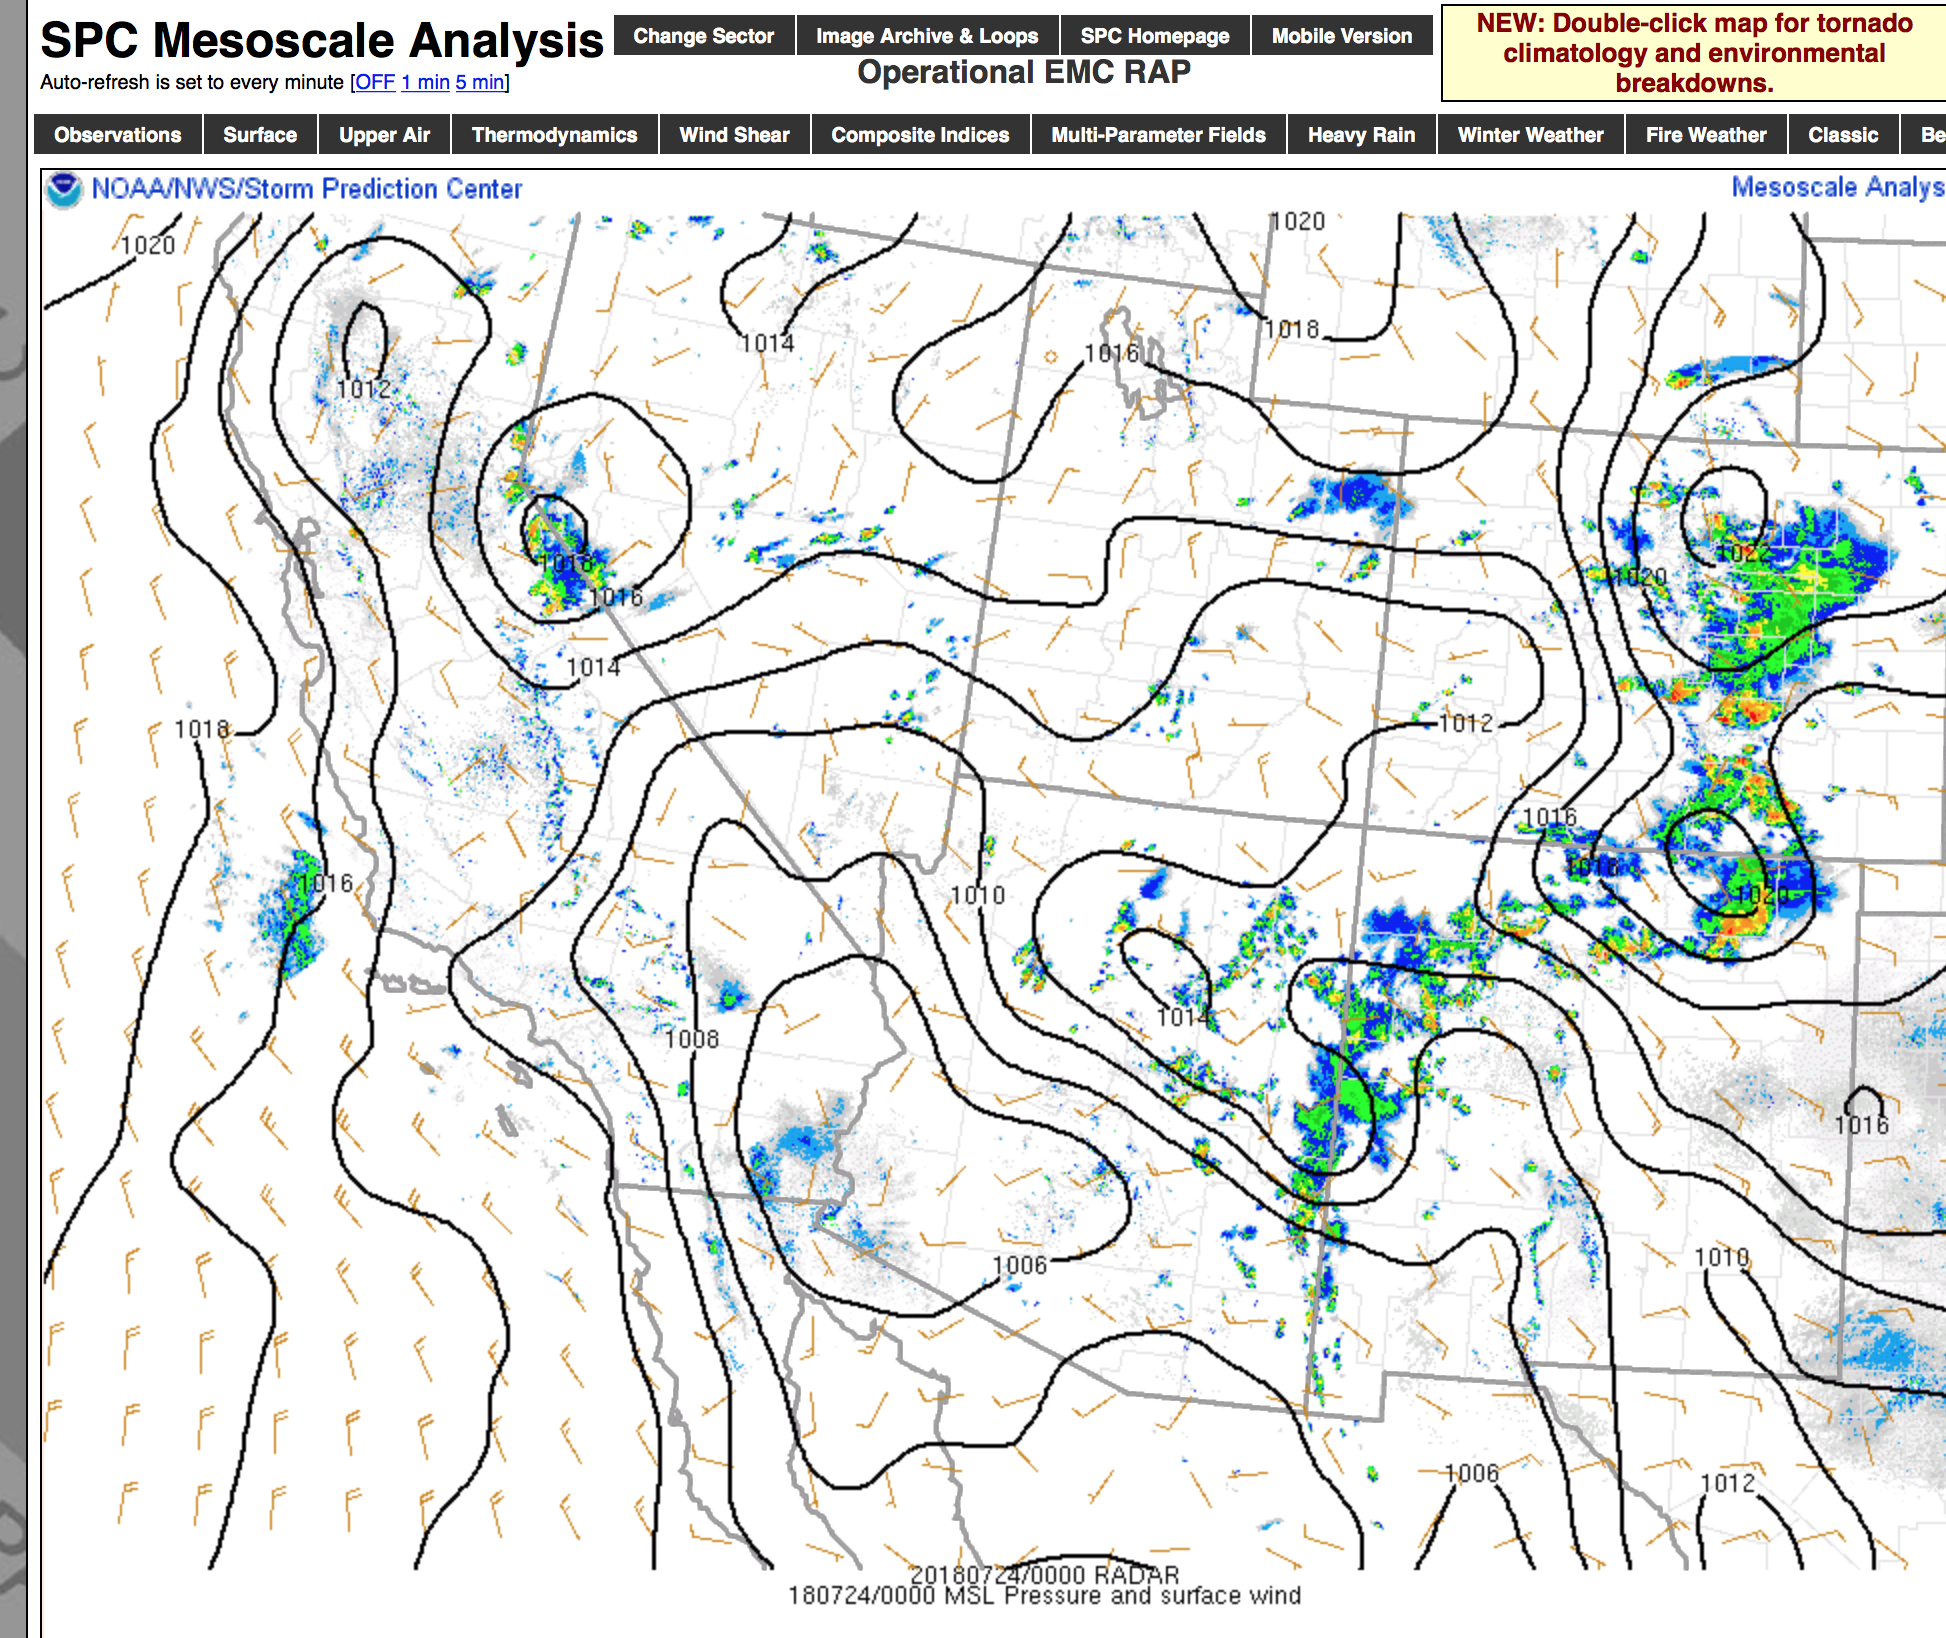
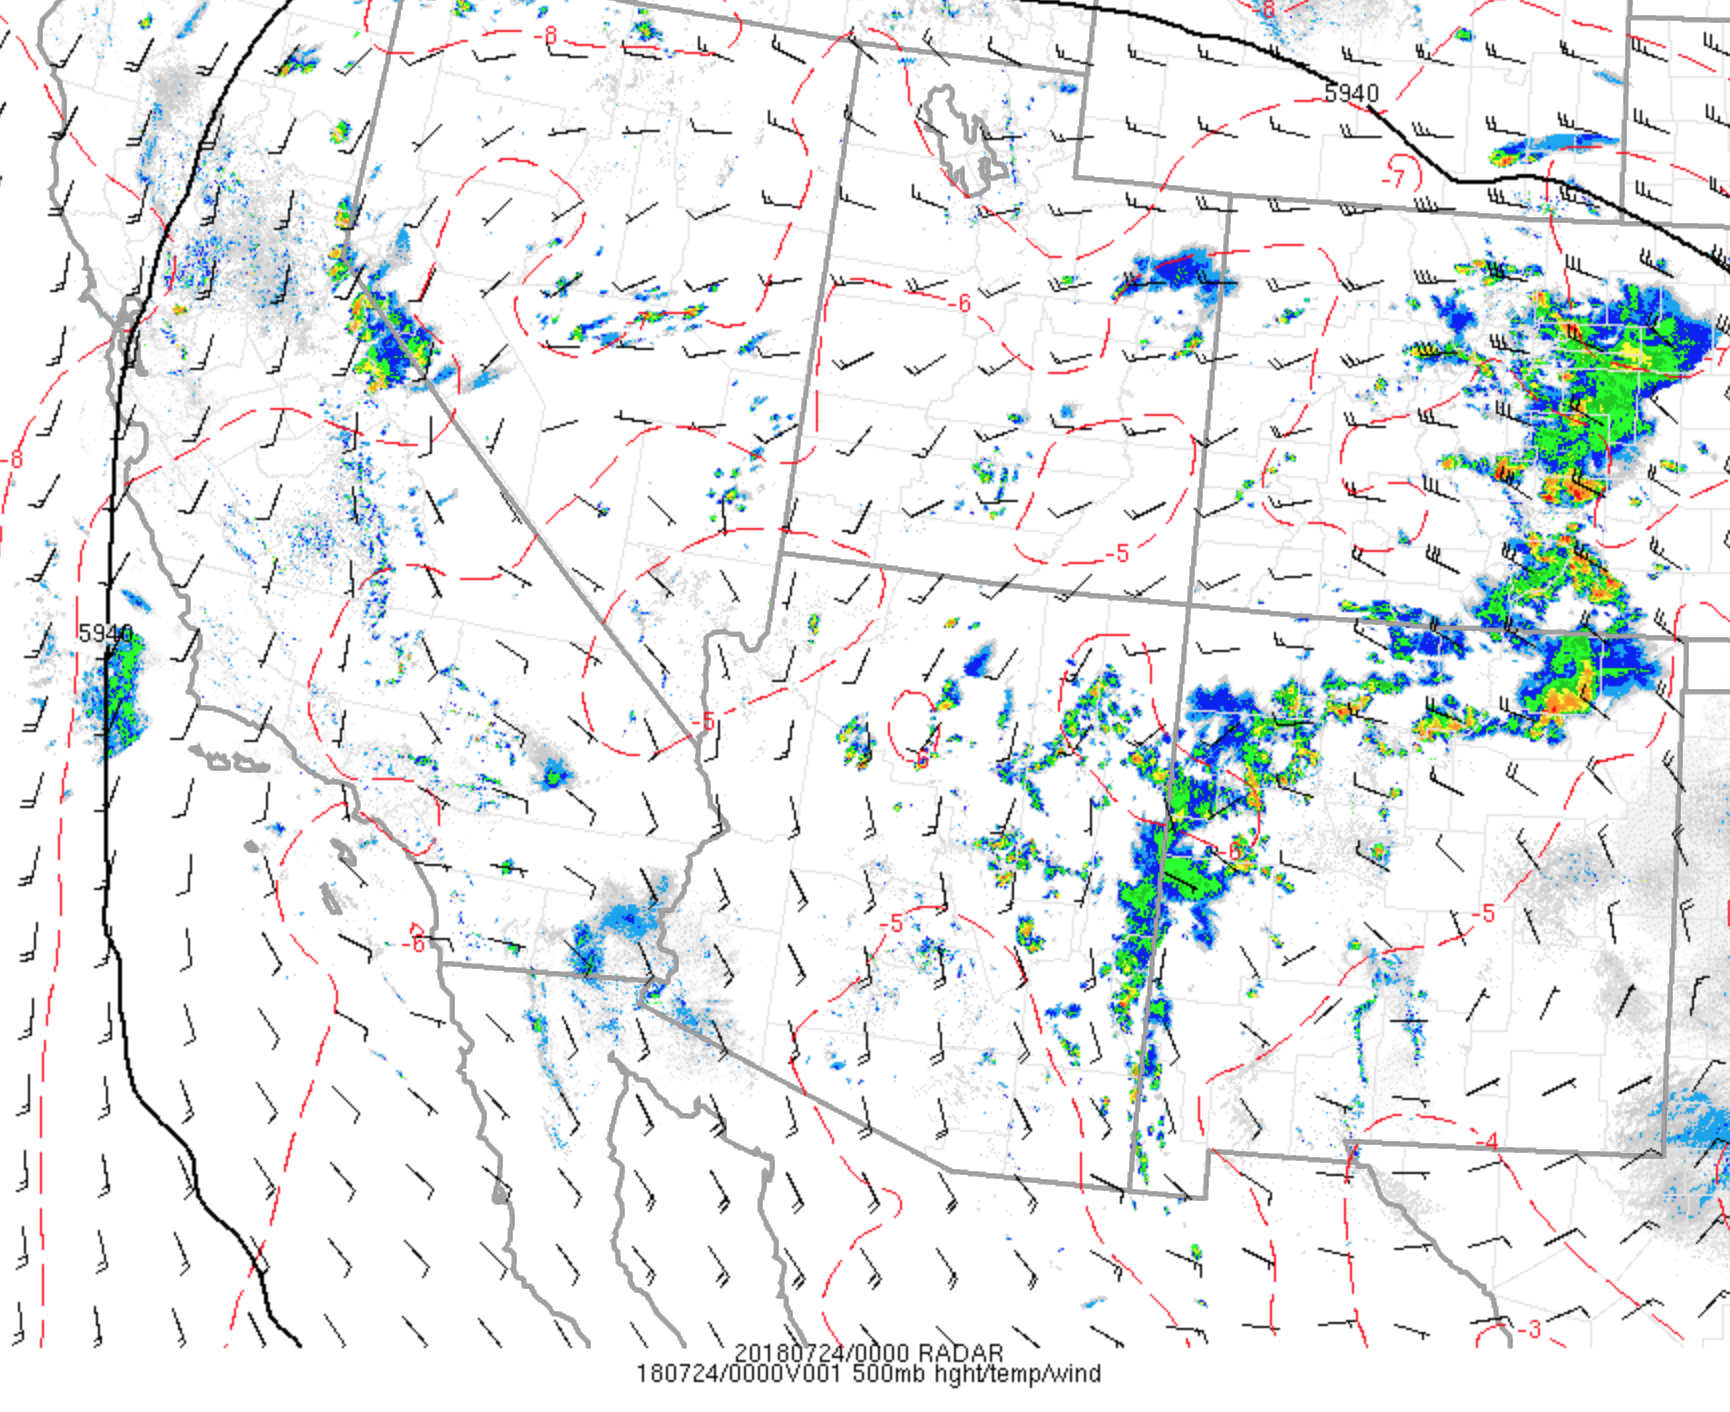
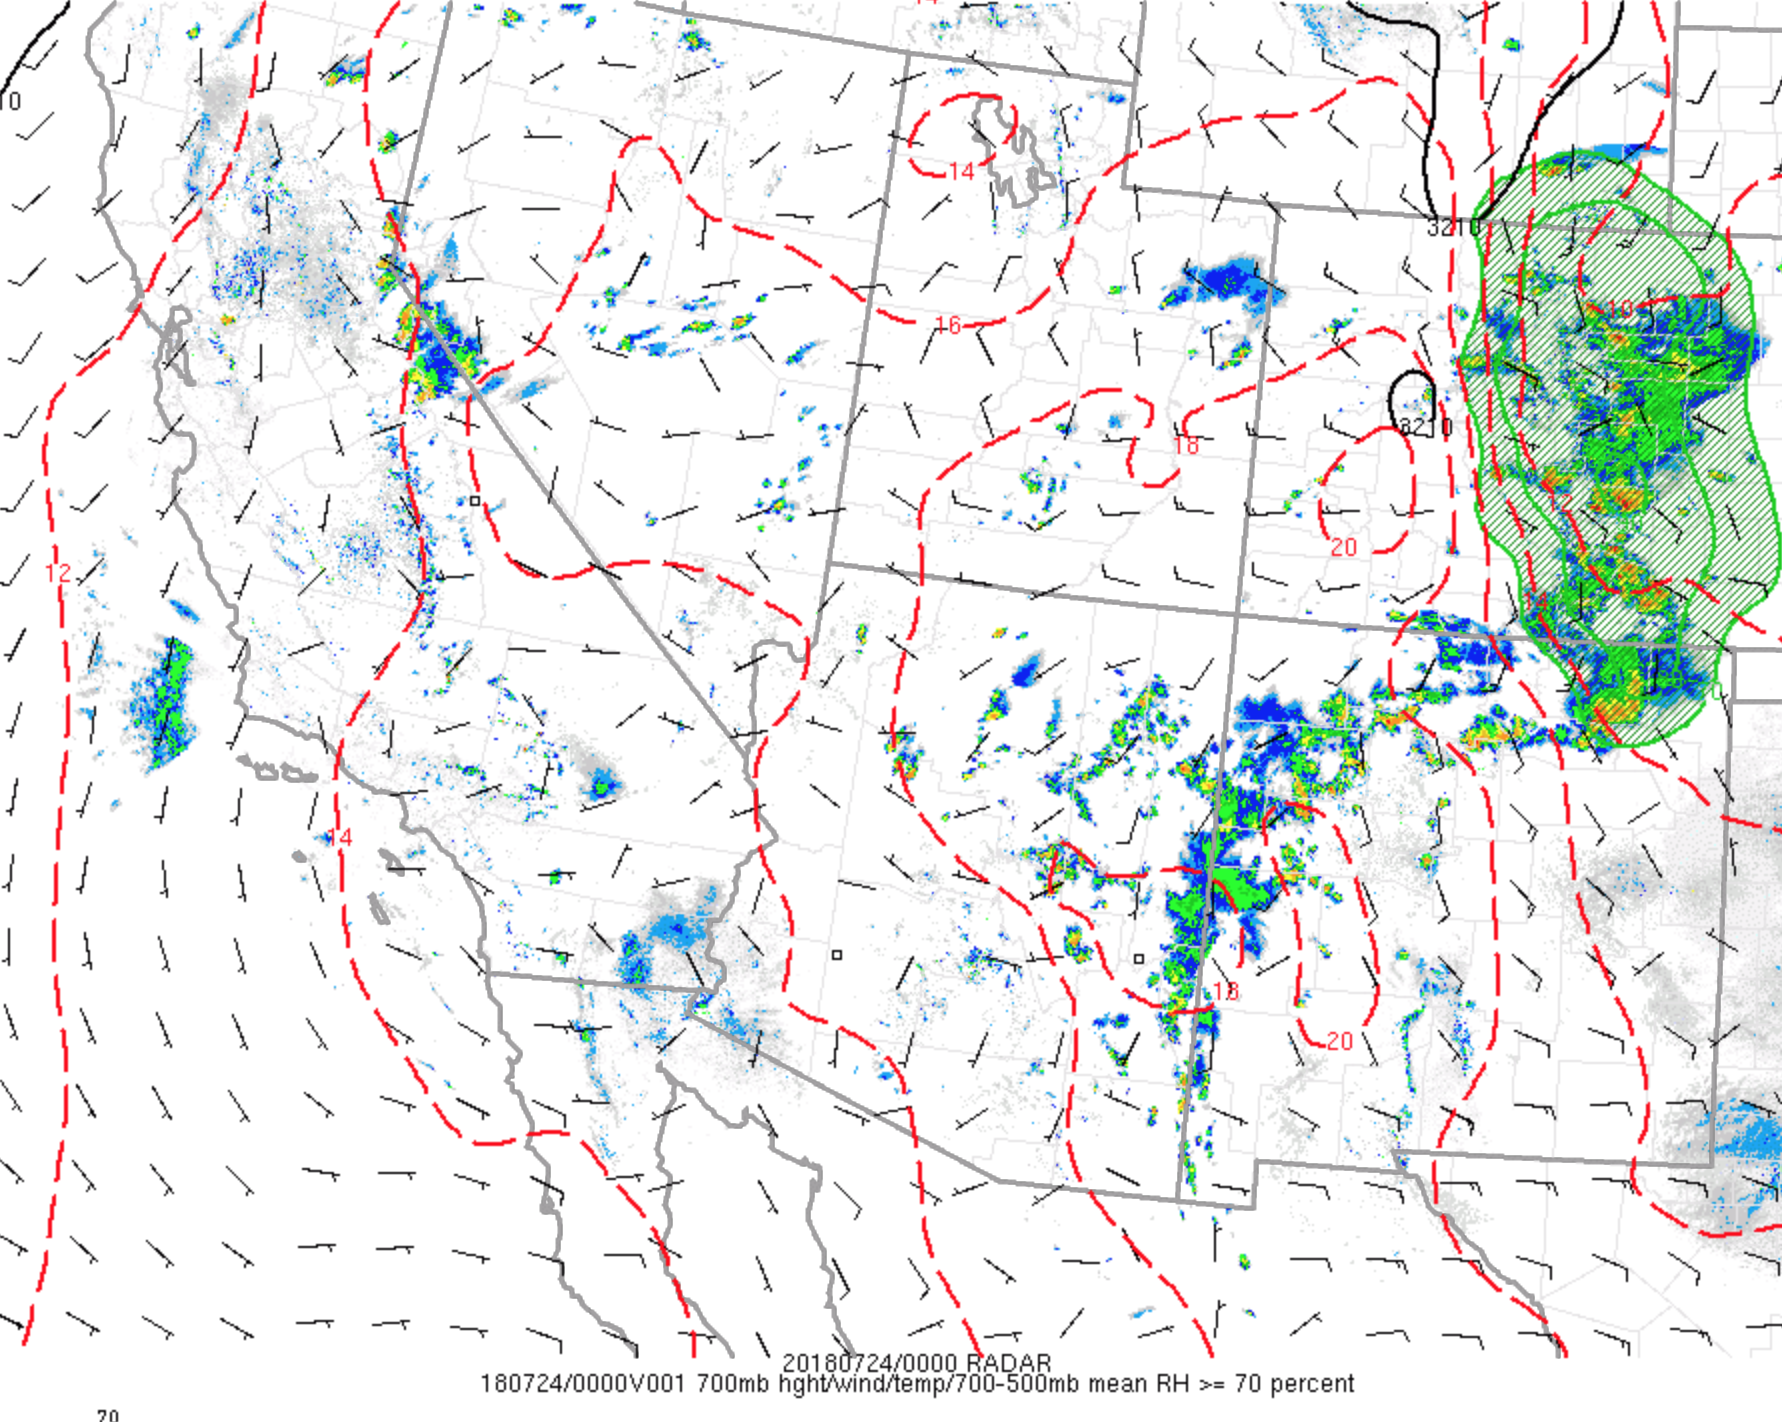
July 23
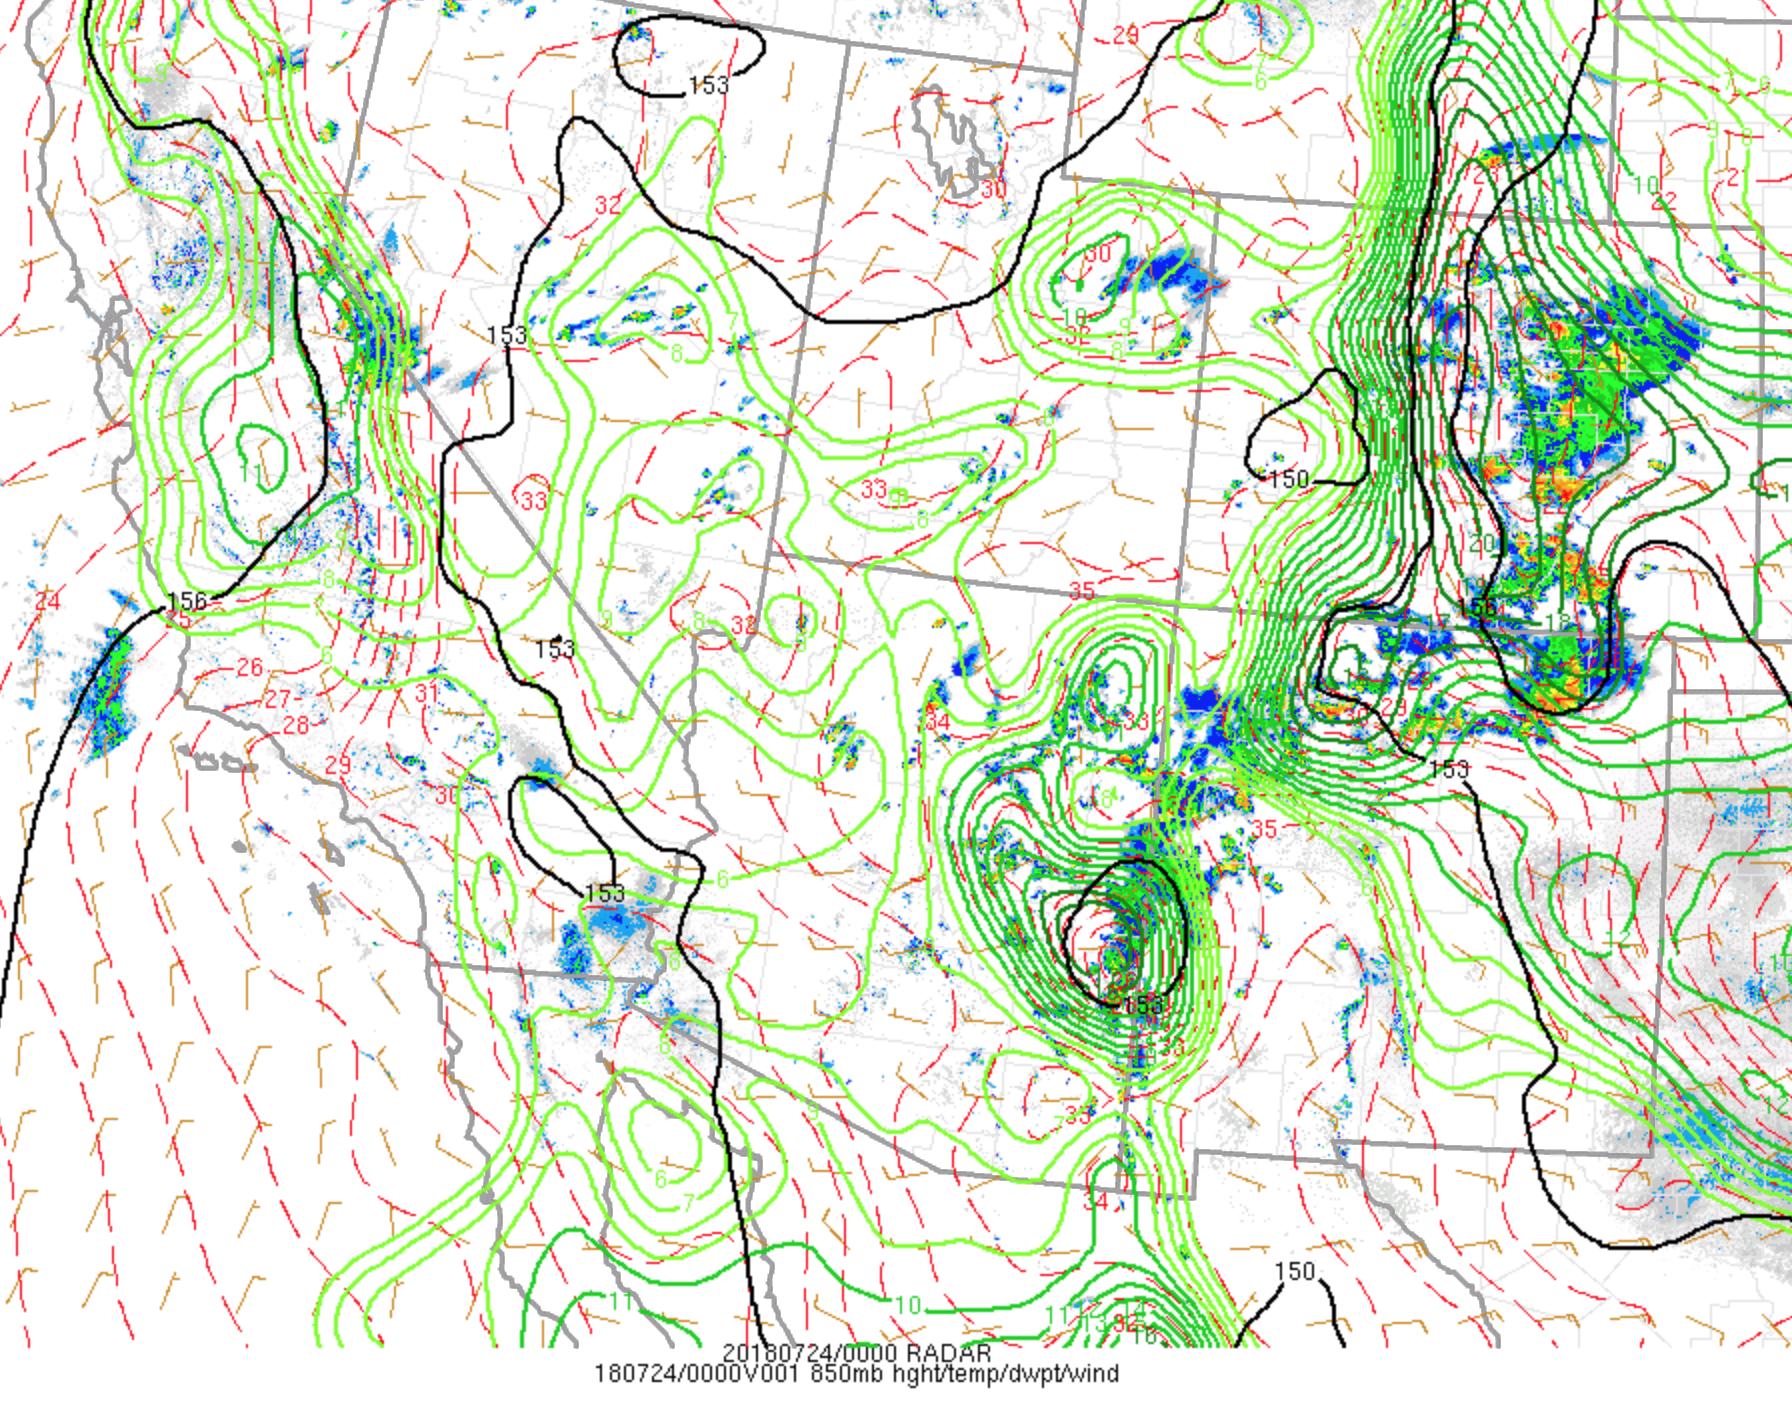

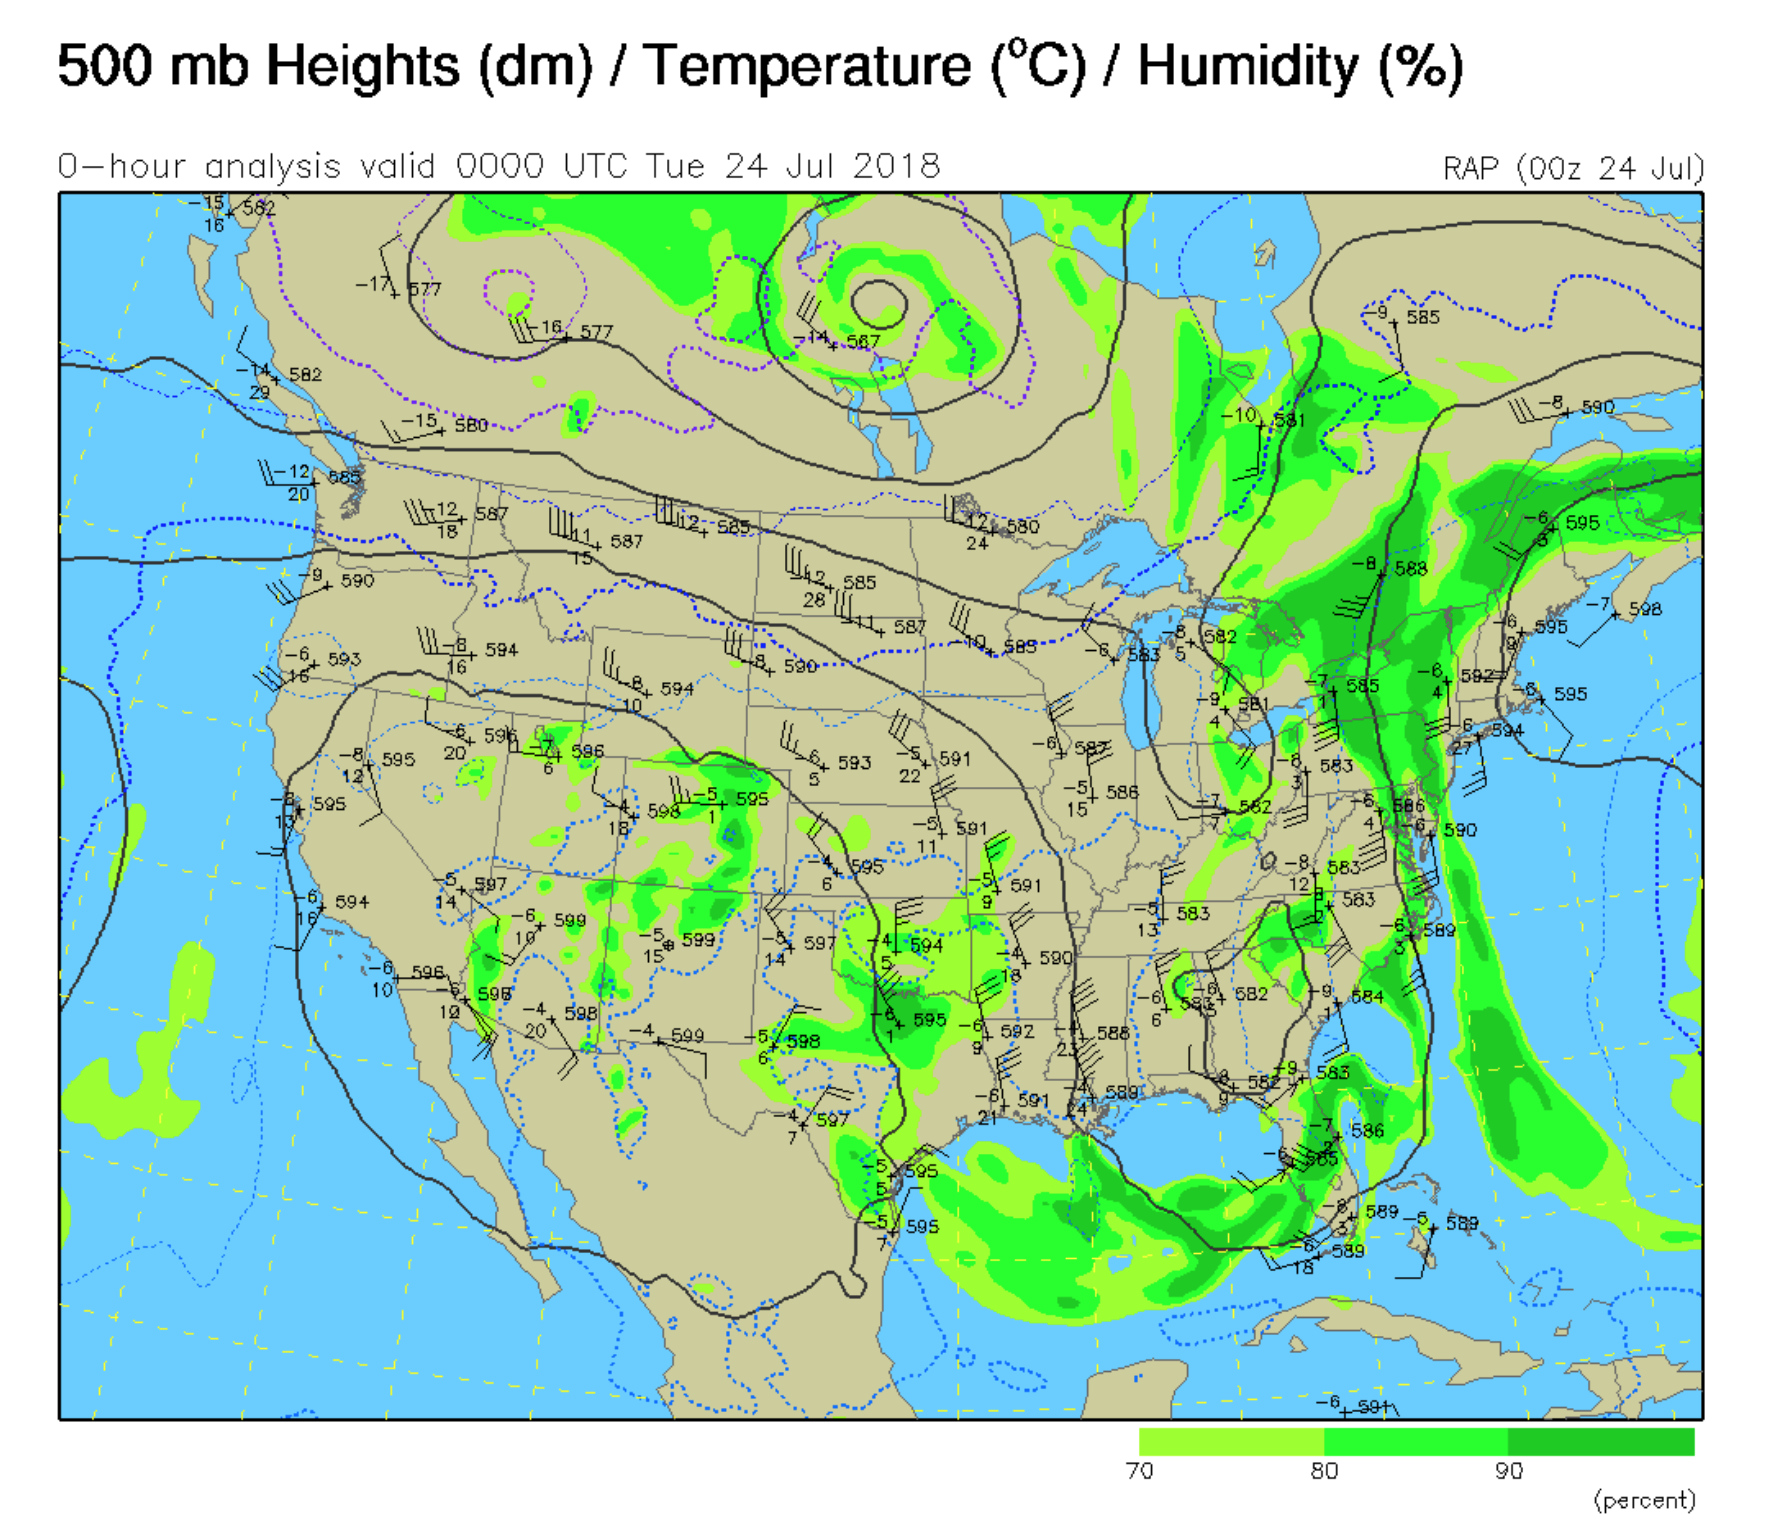

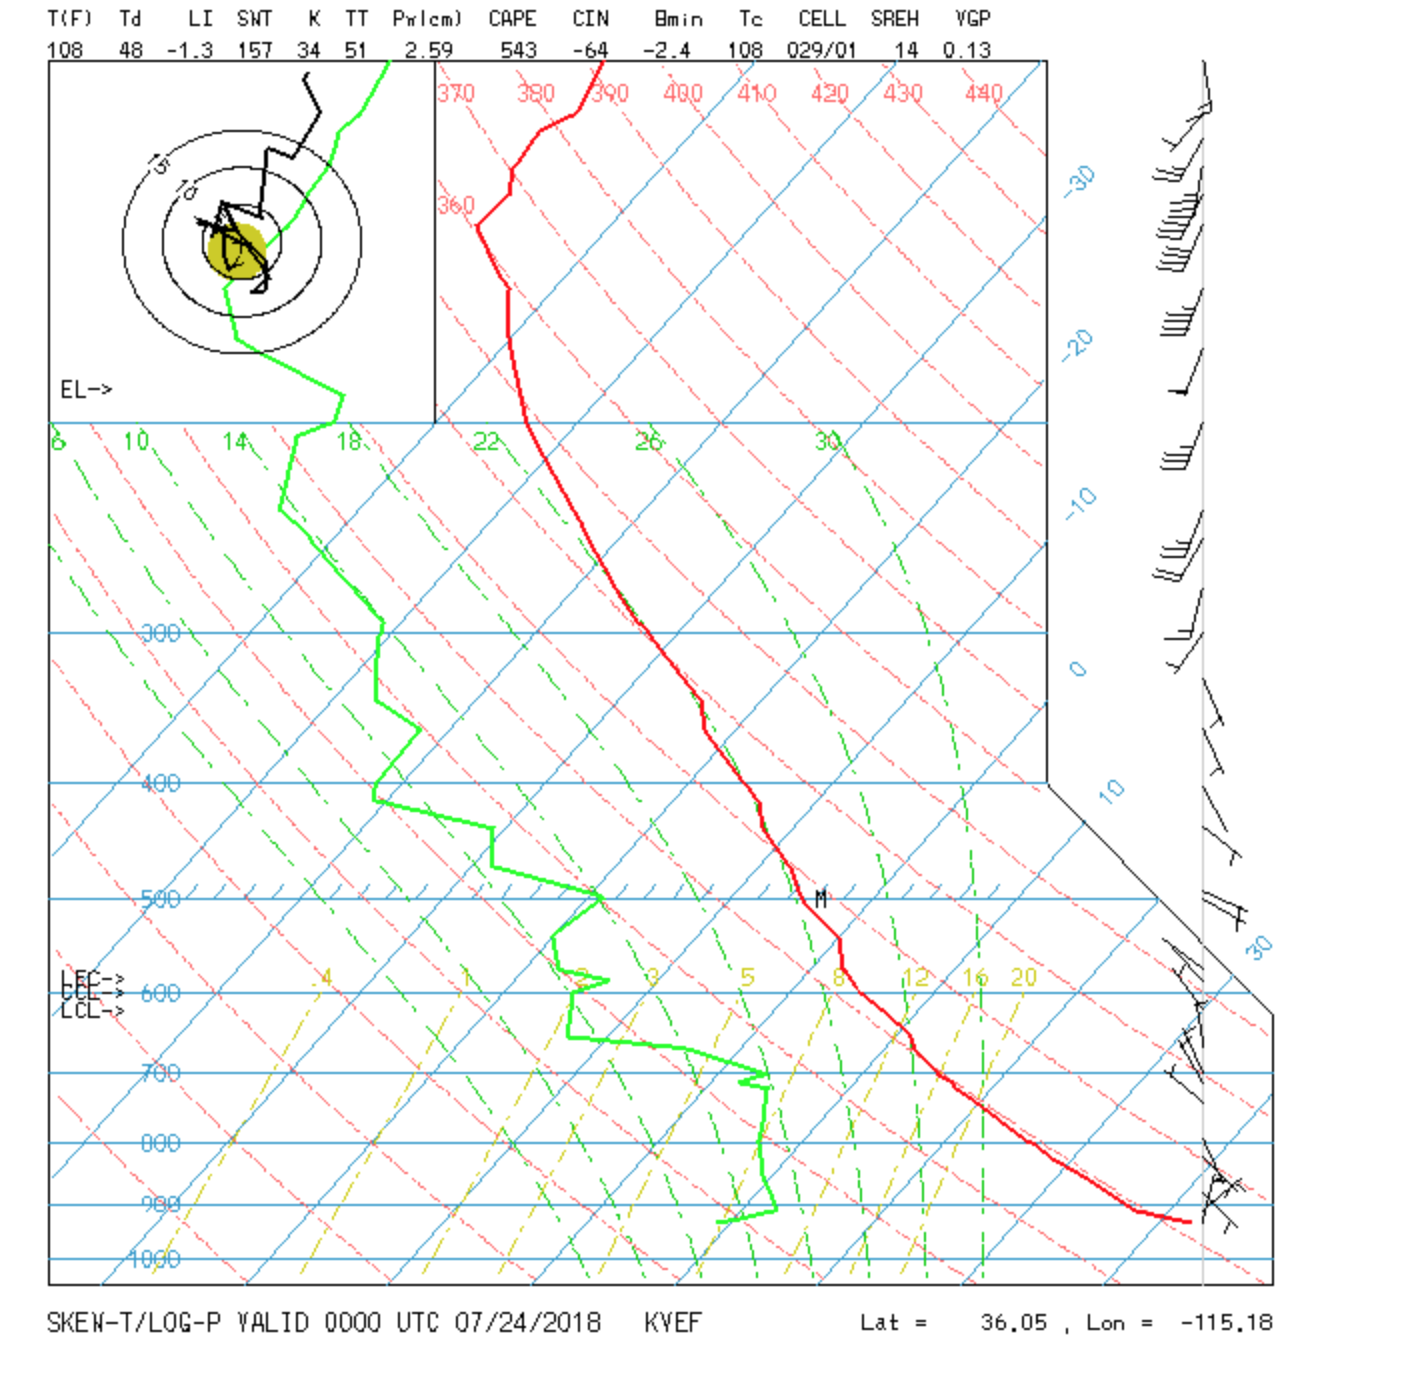
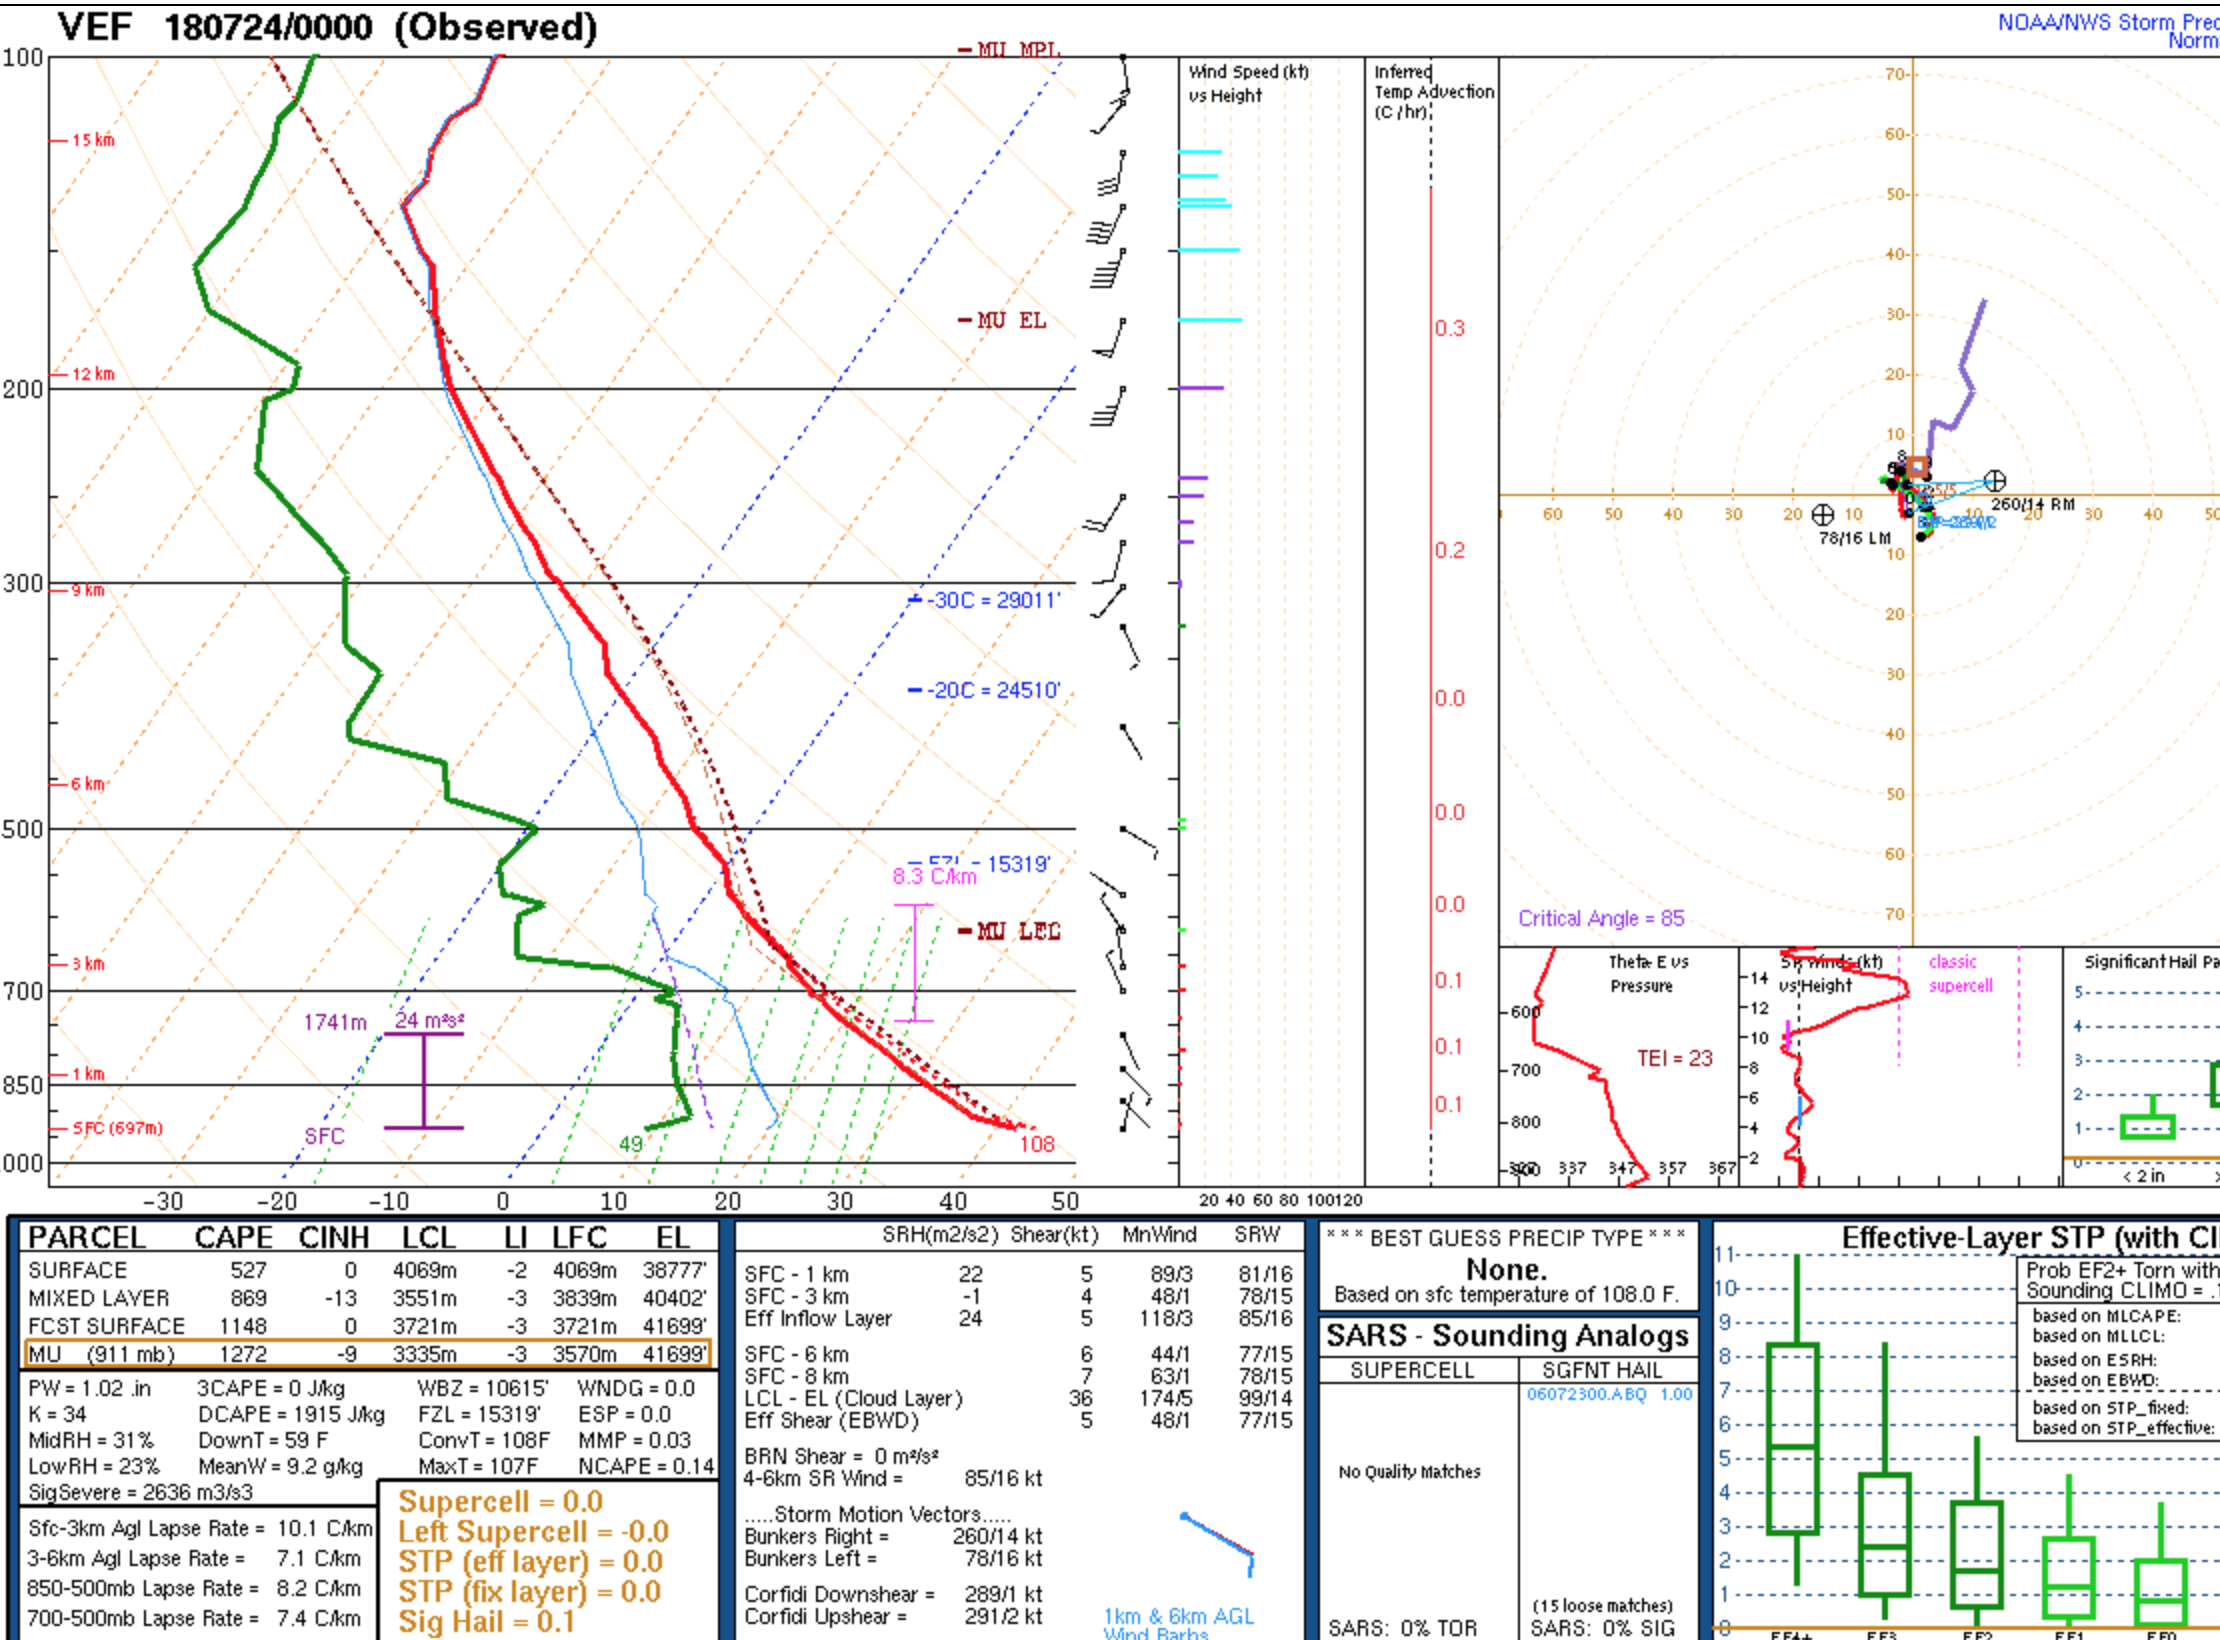

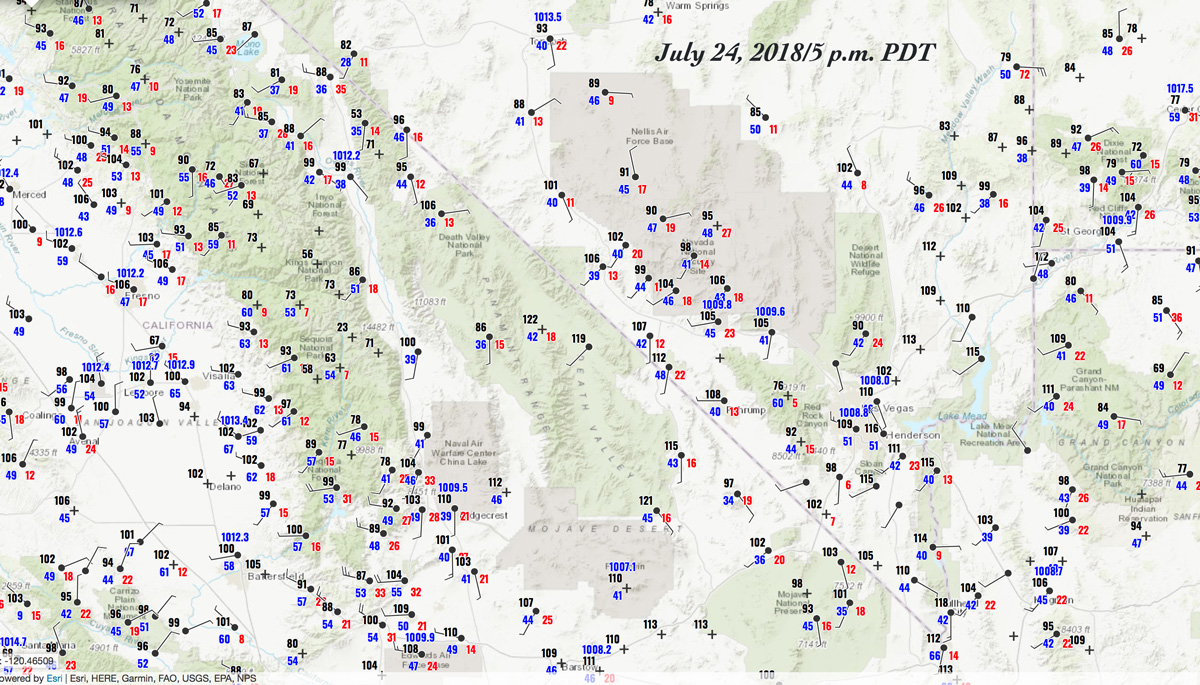
July 24

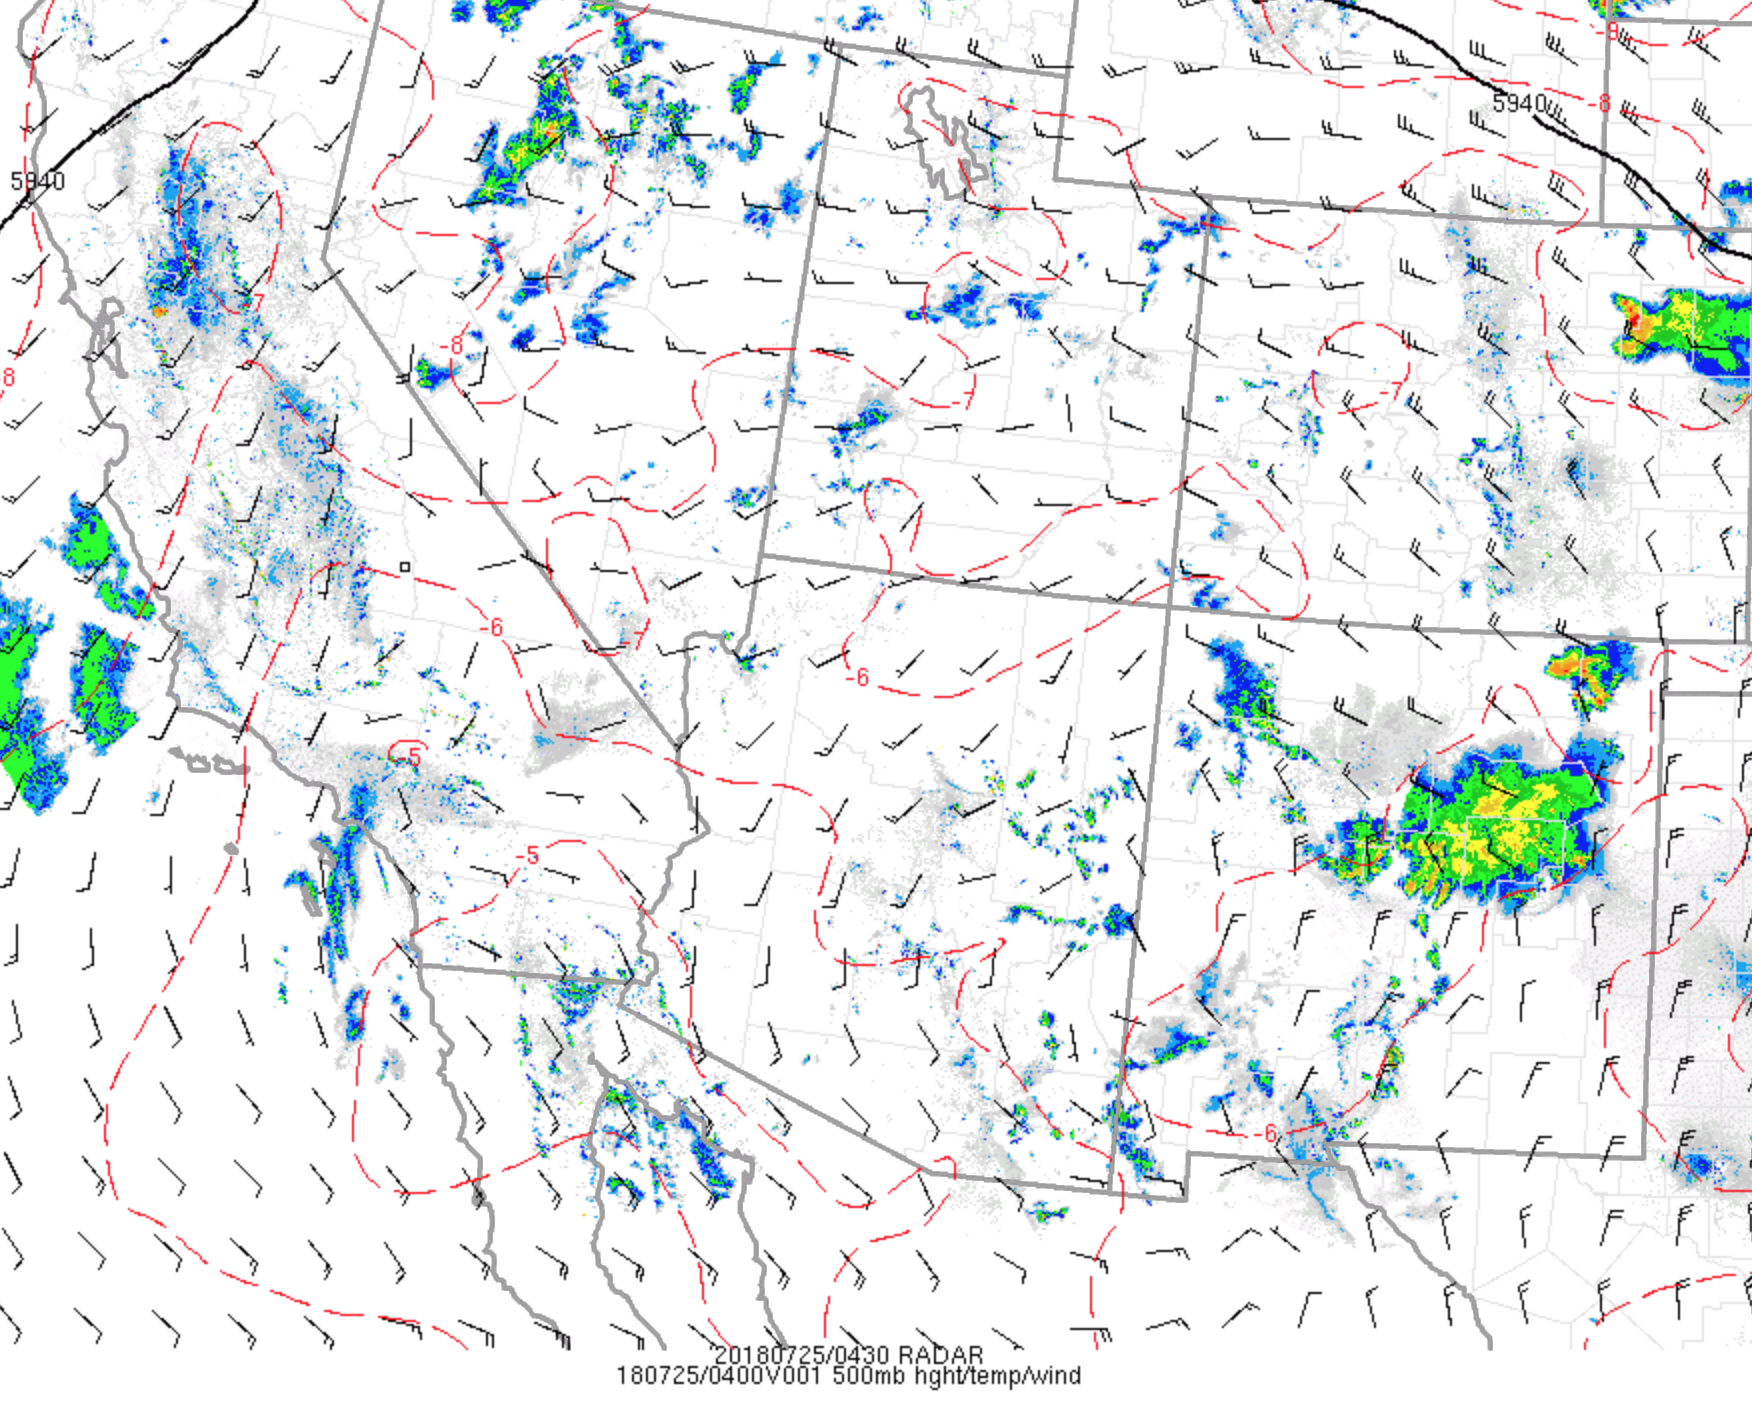
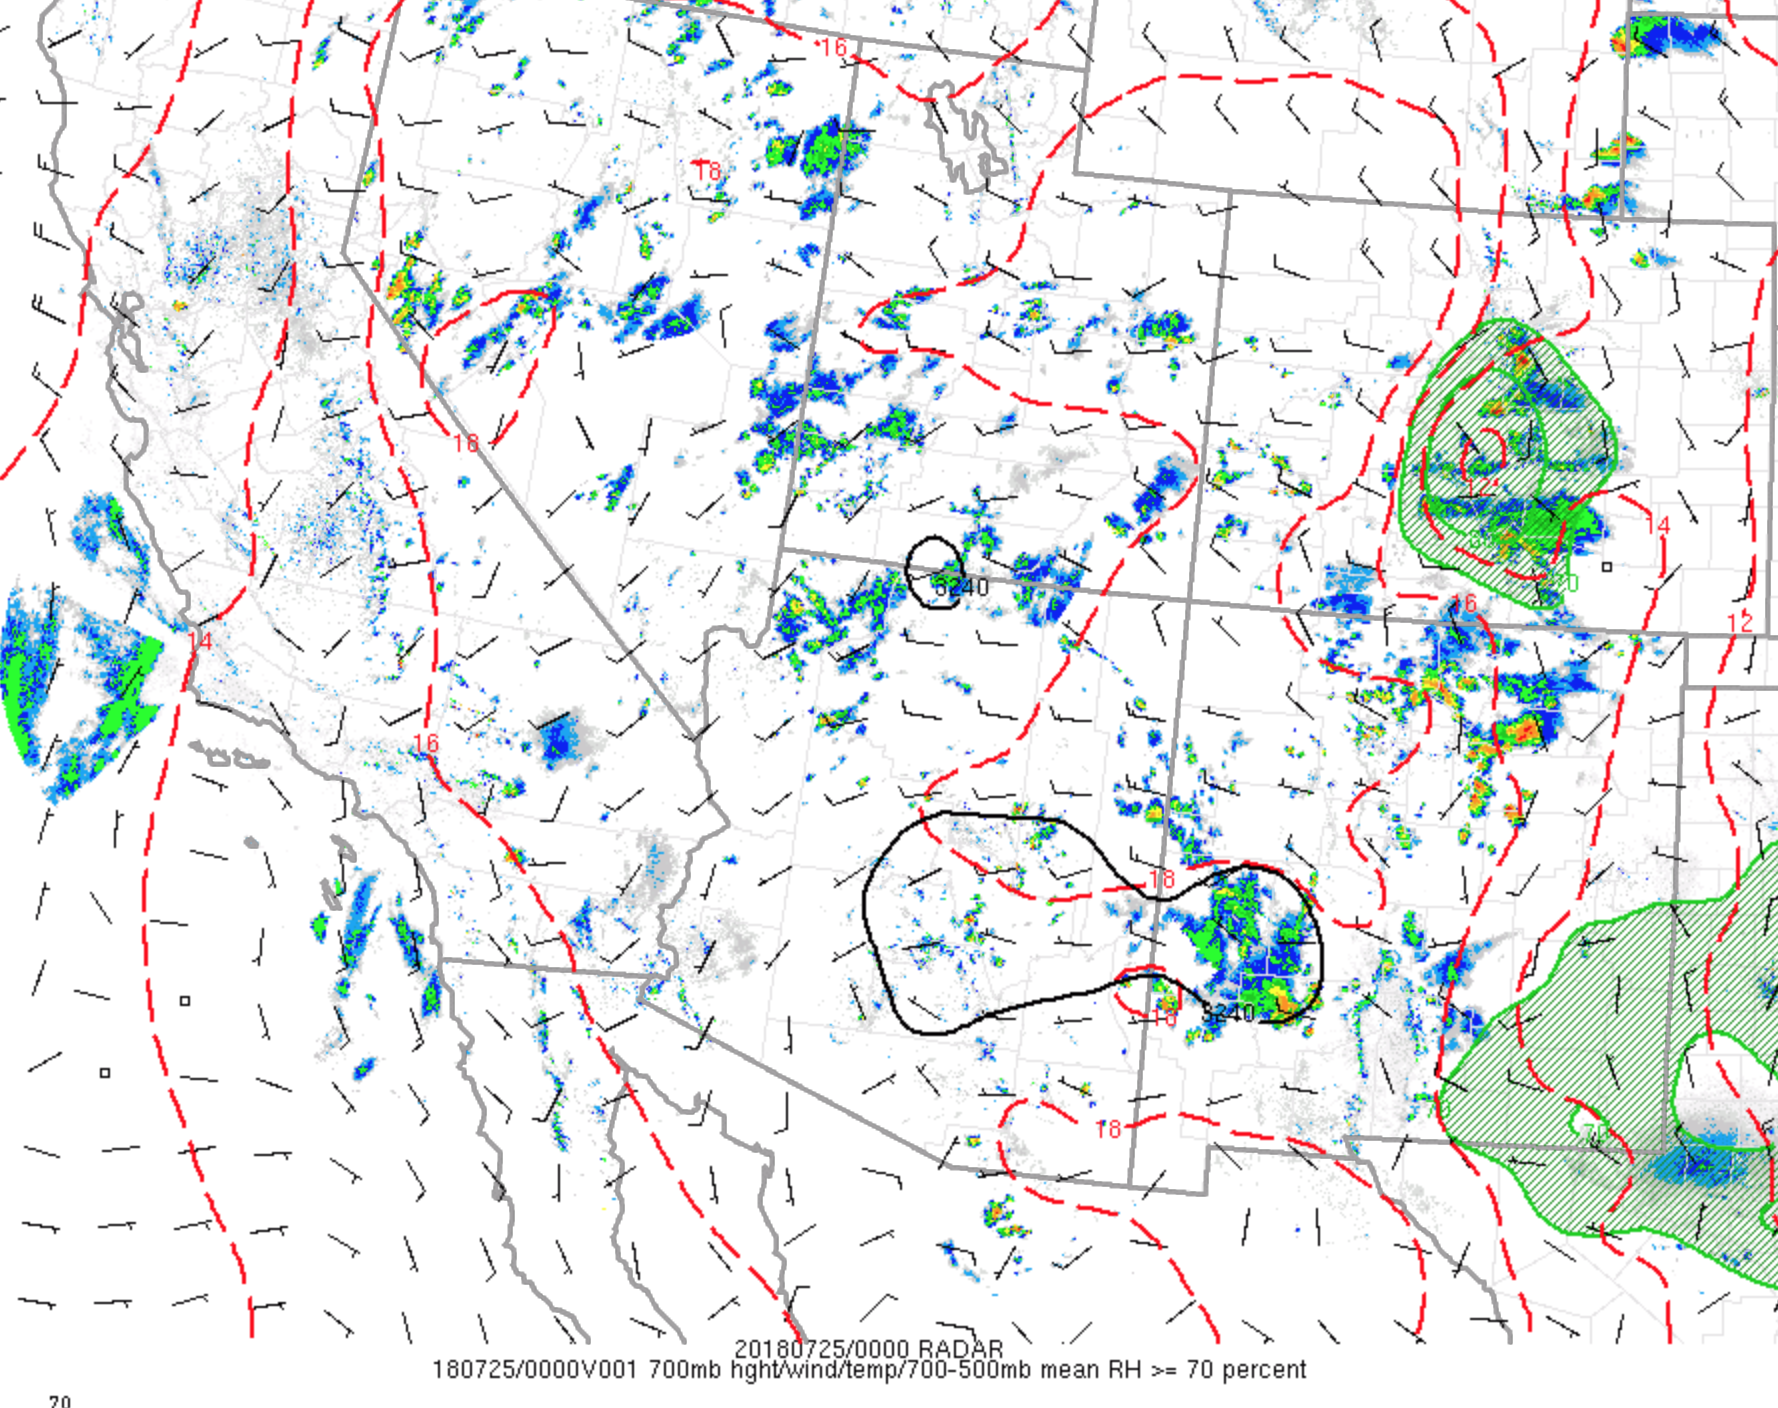


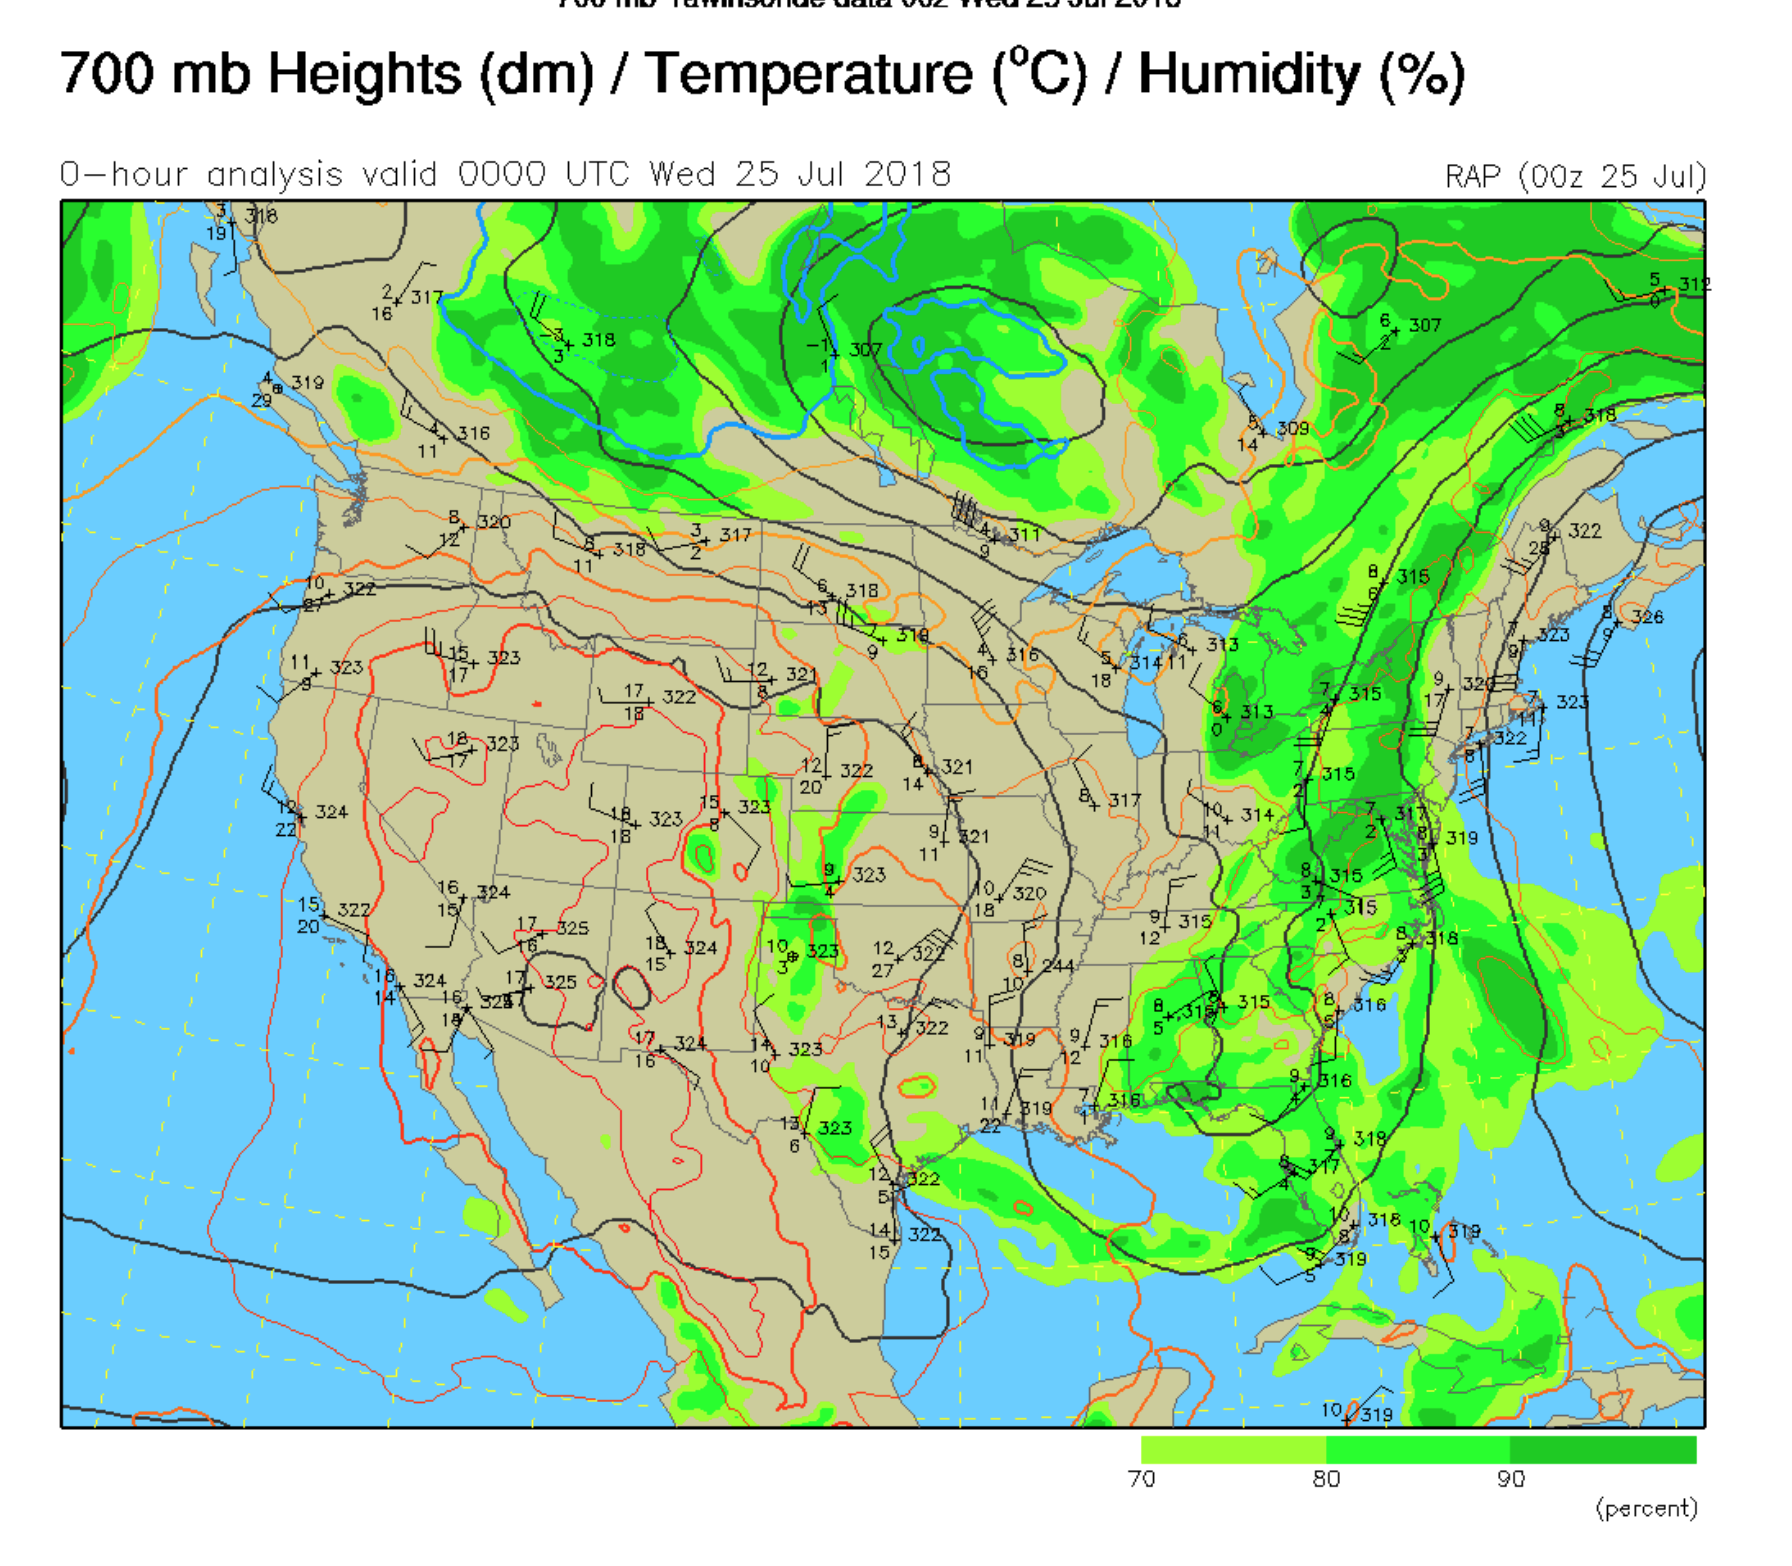
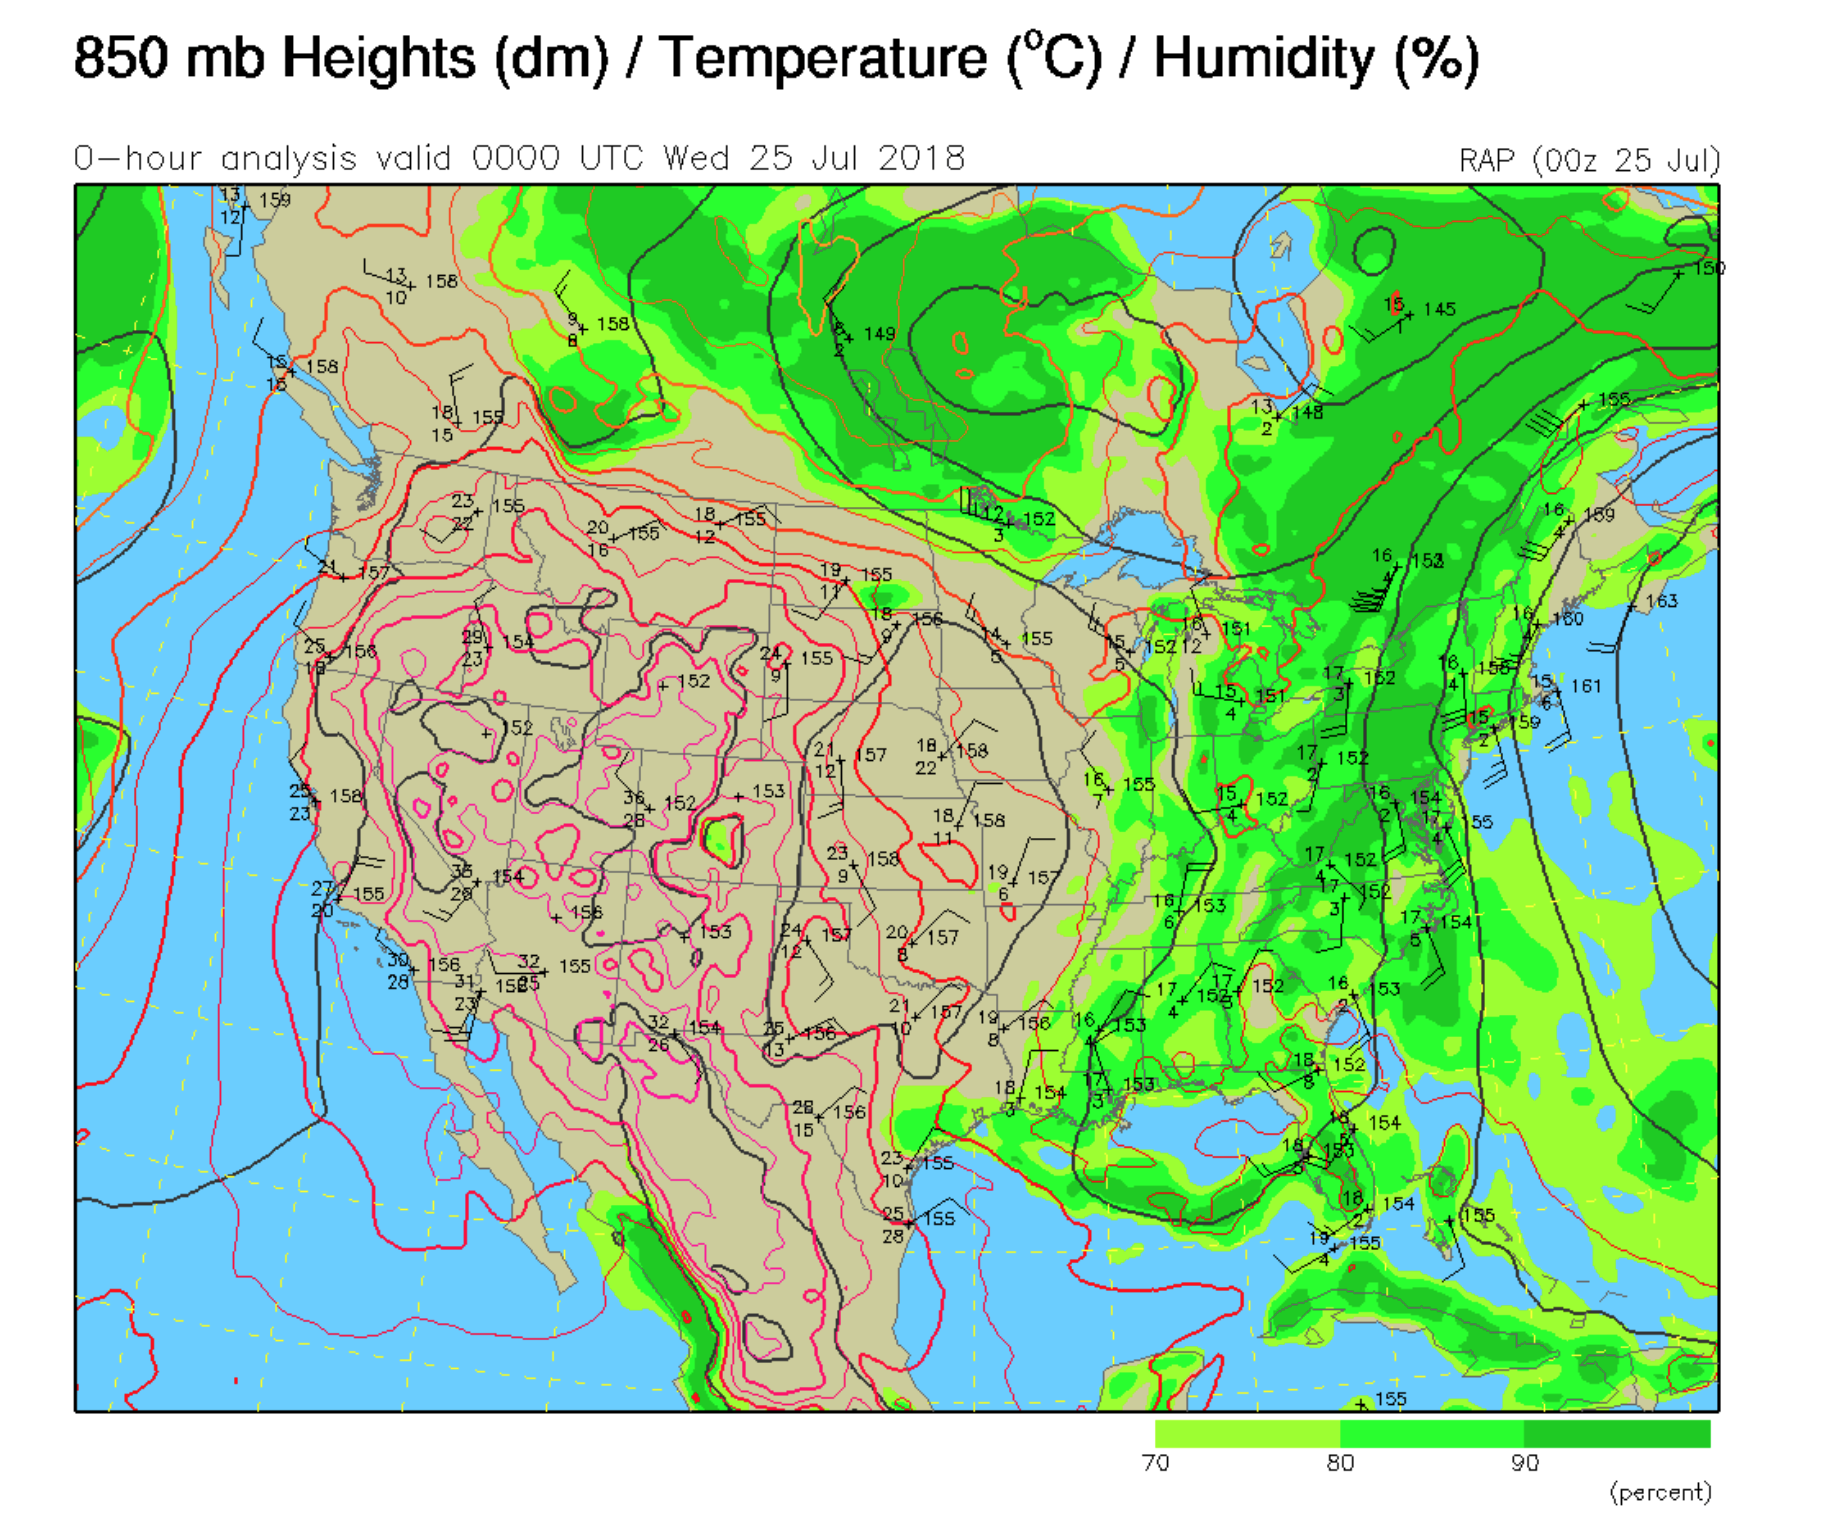
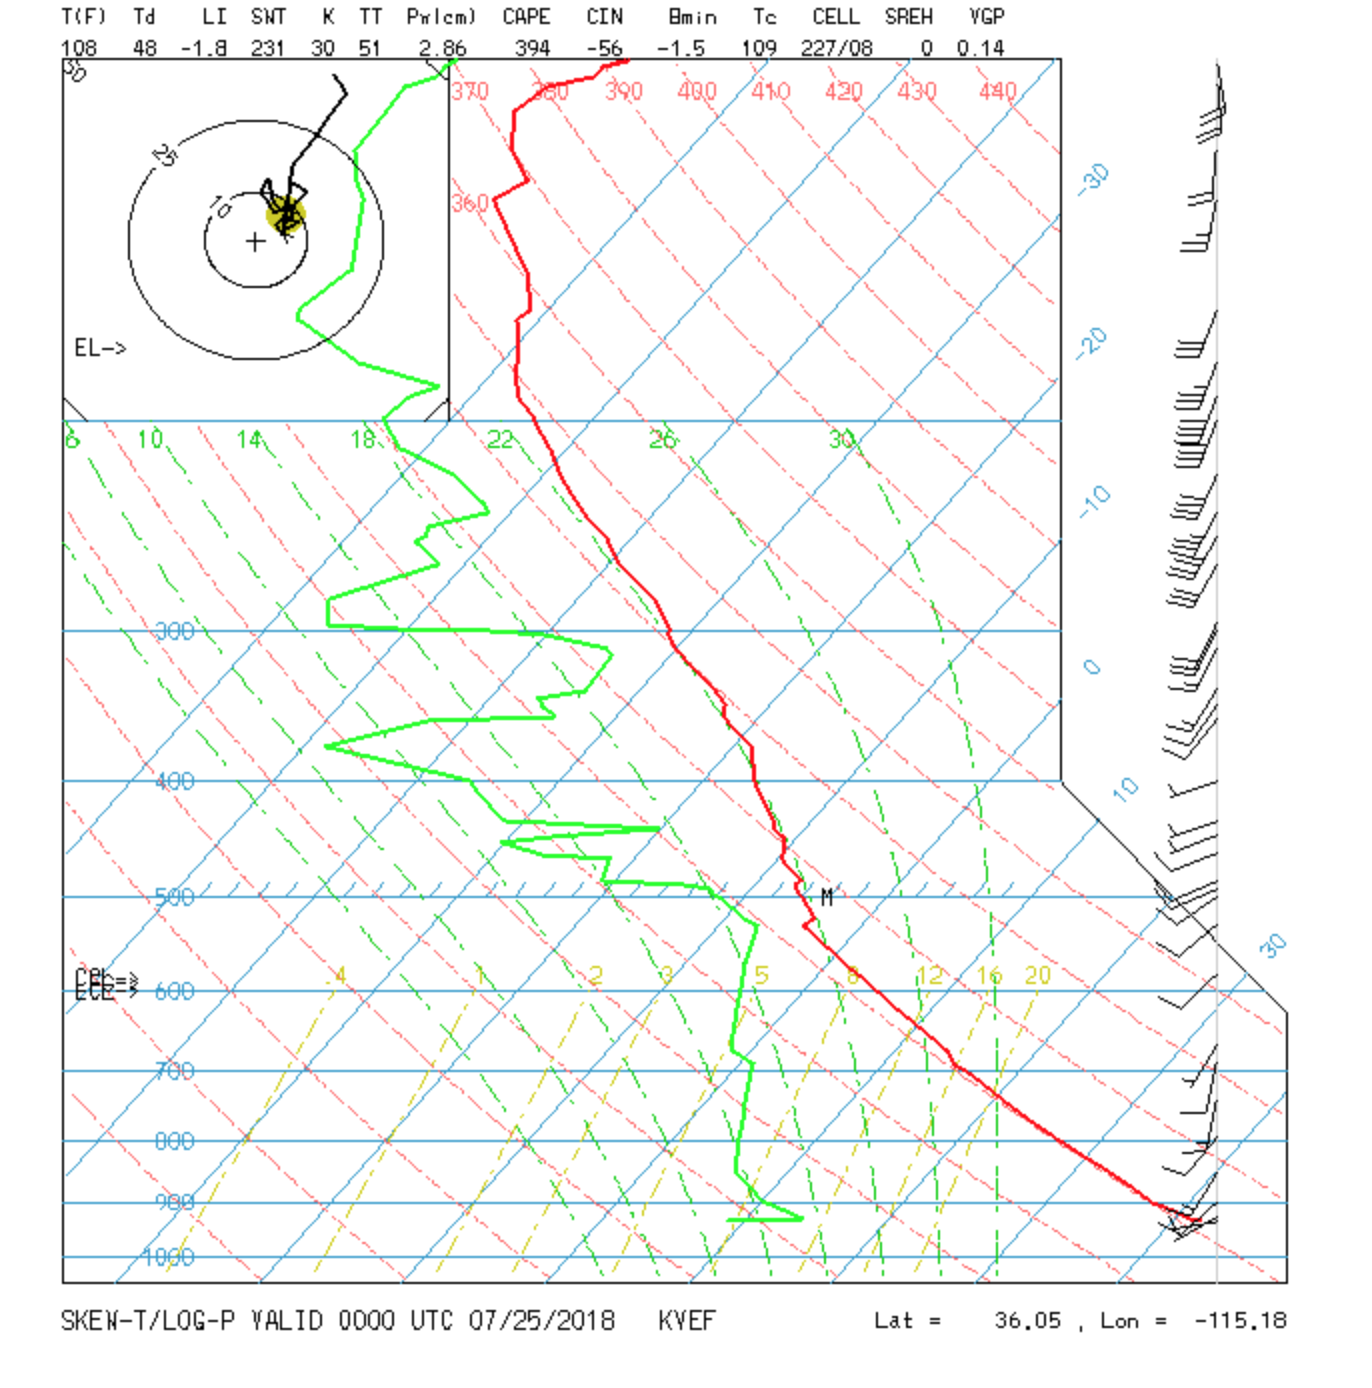

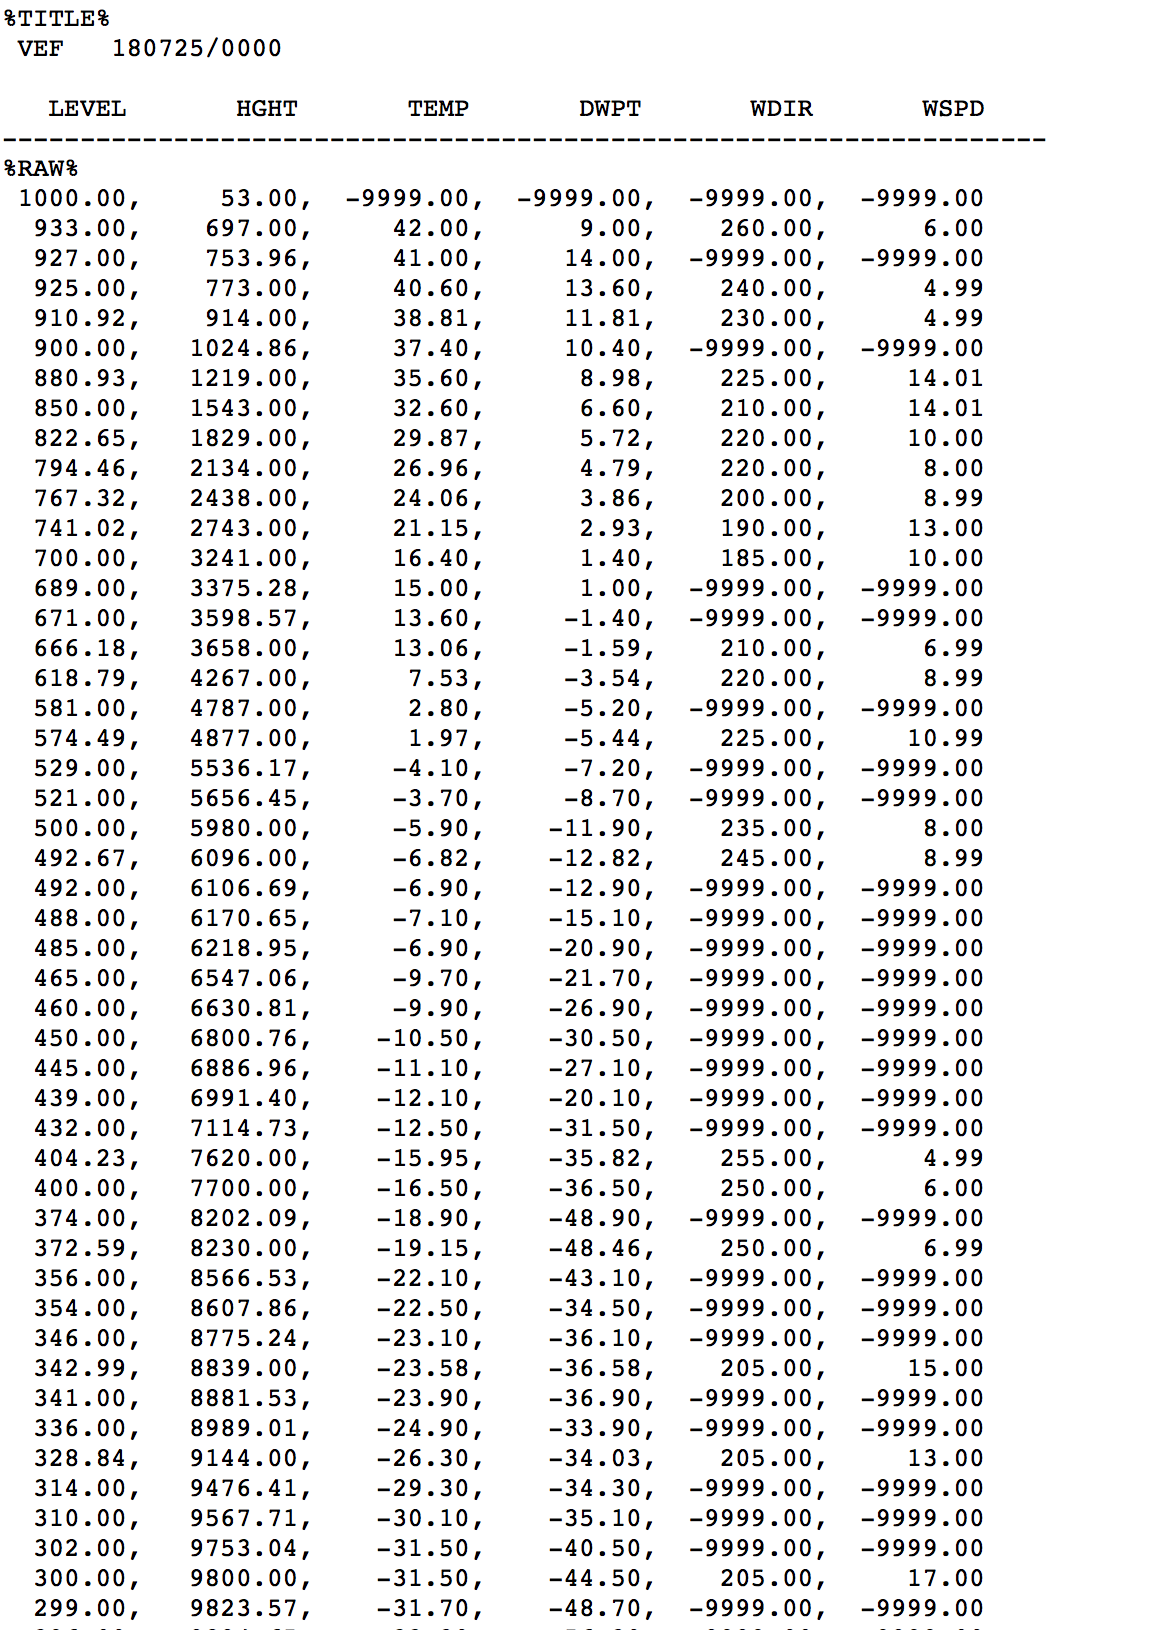
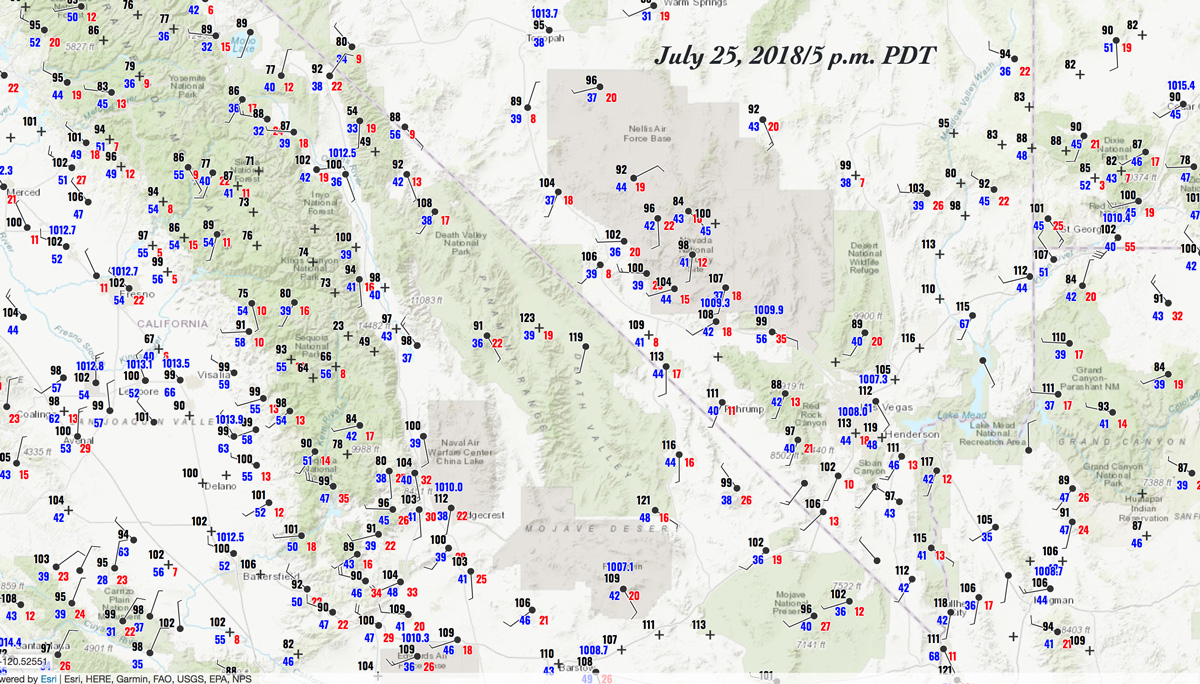
July 25
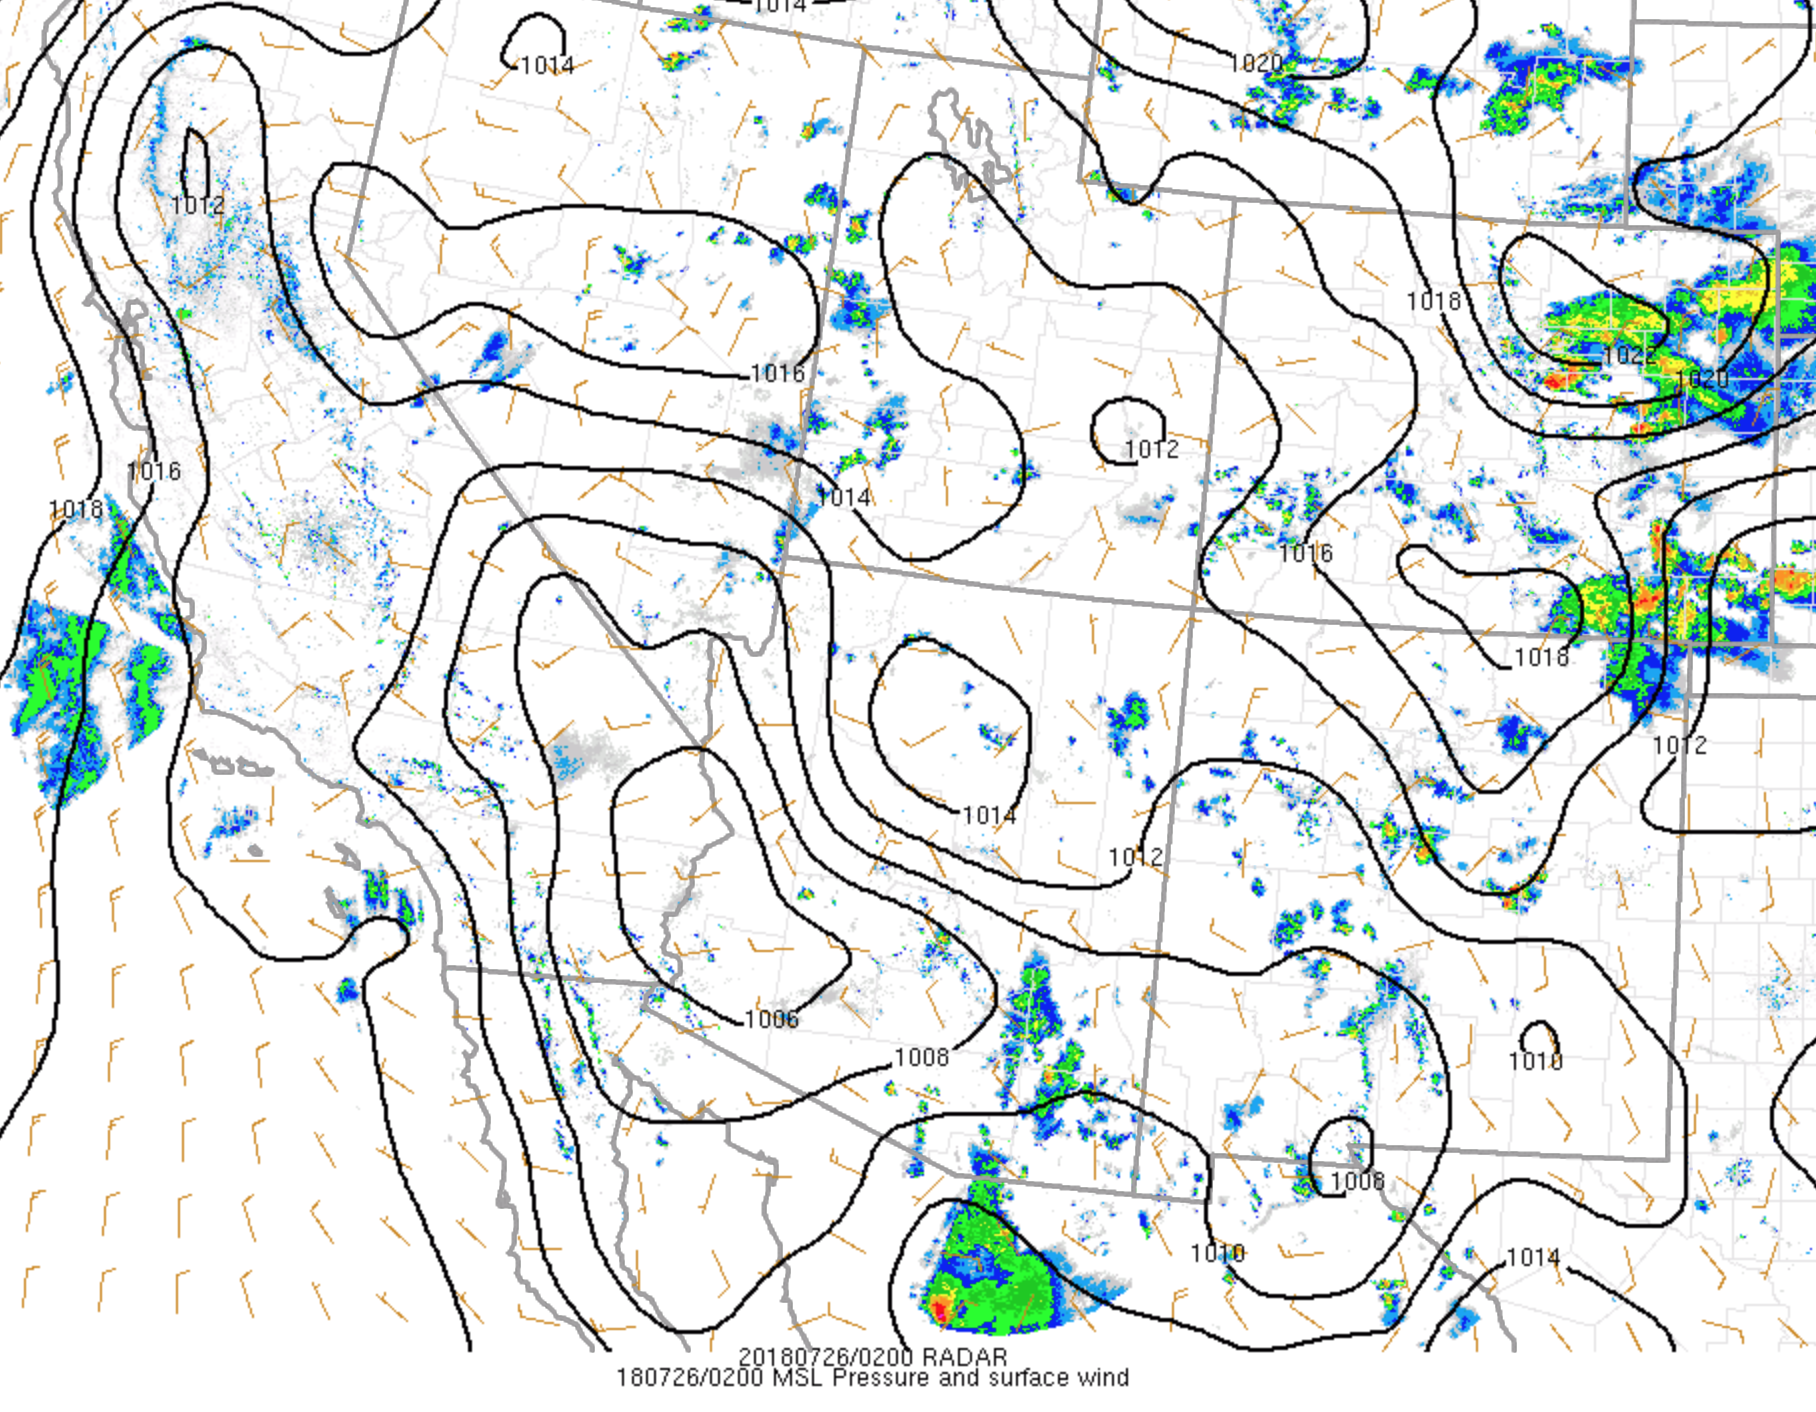
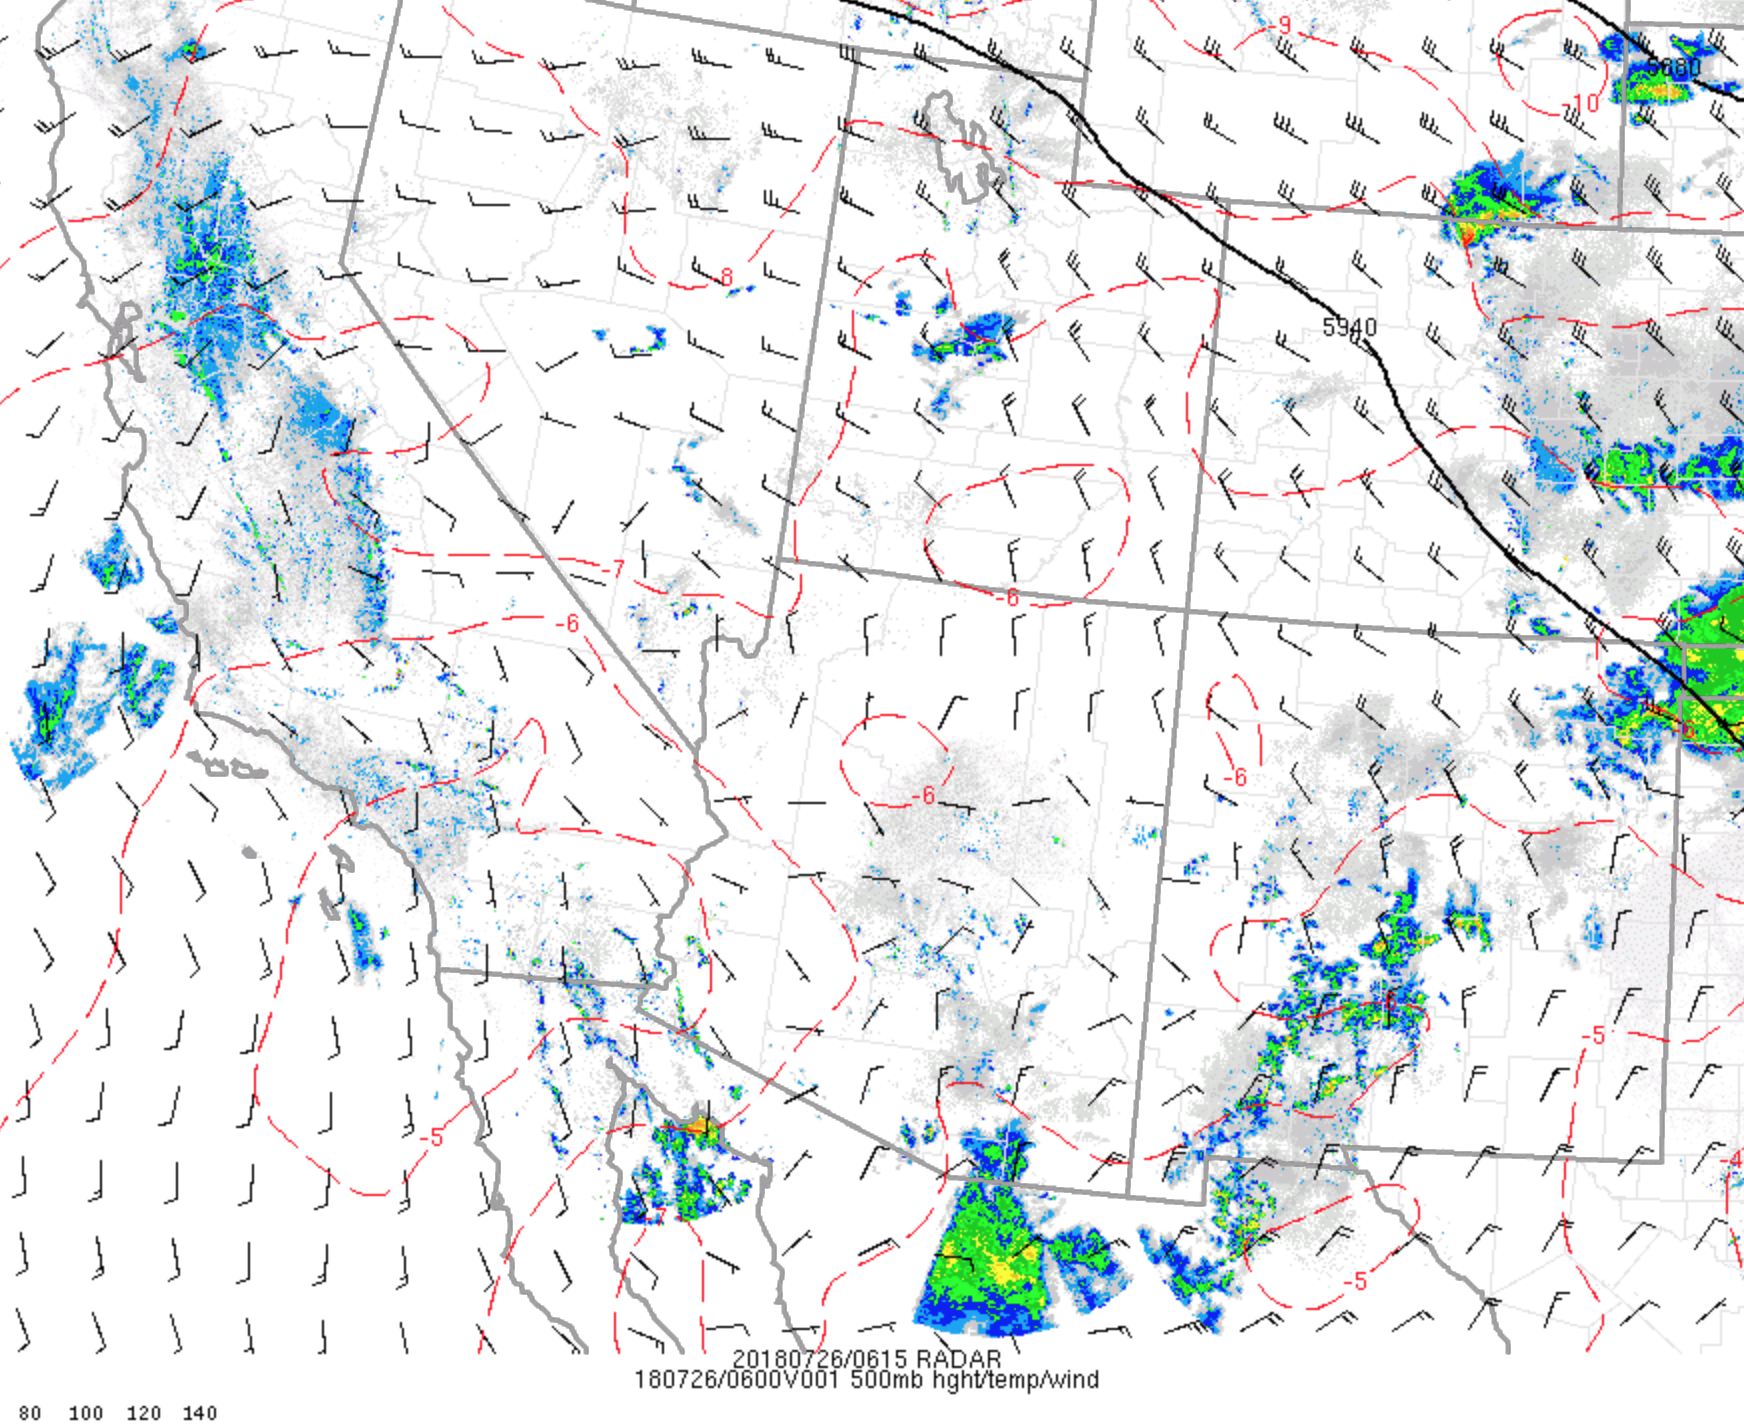
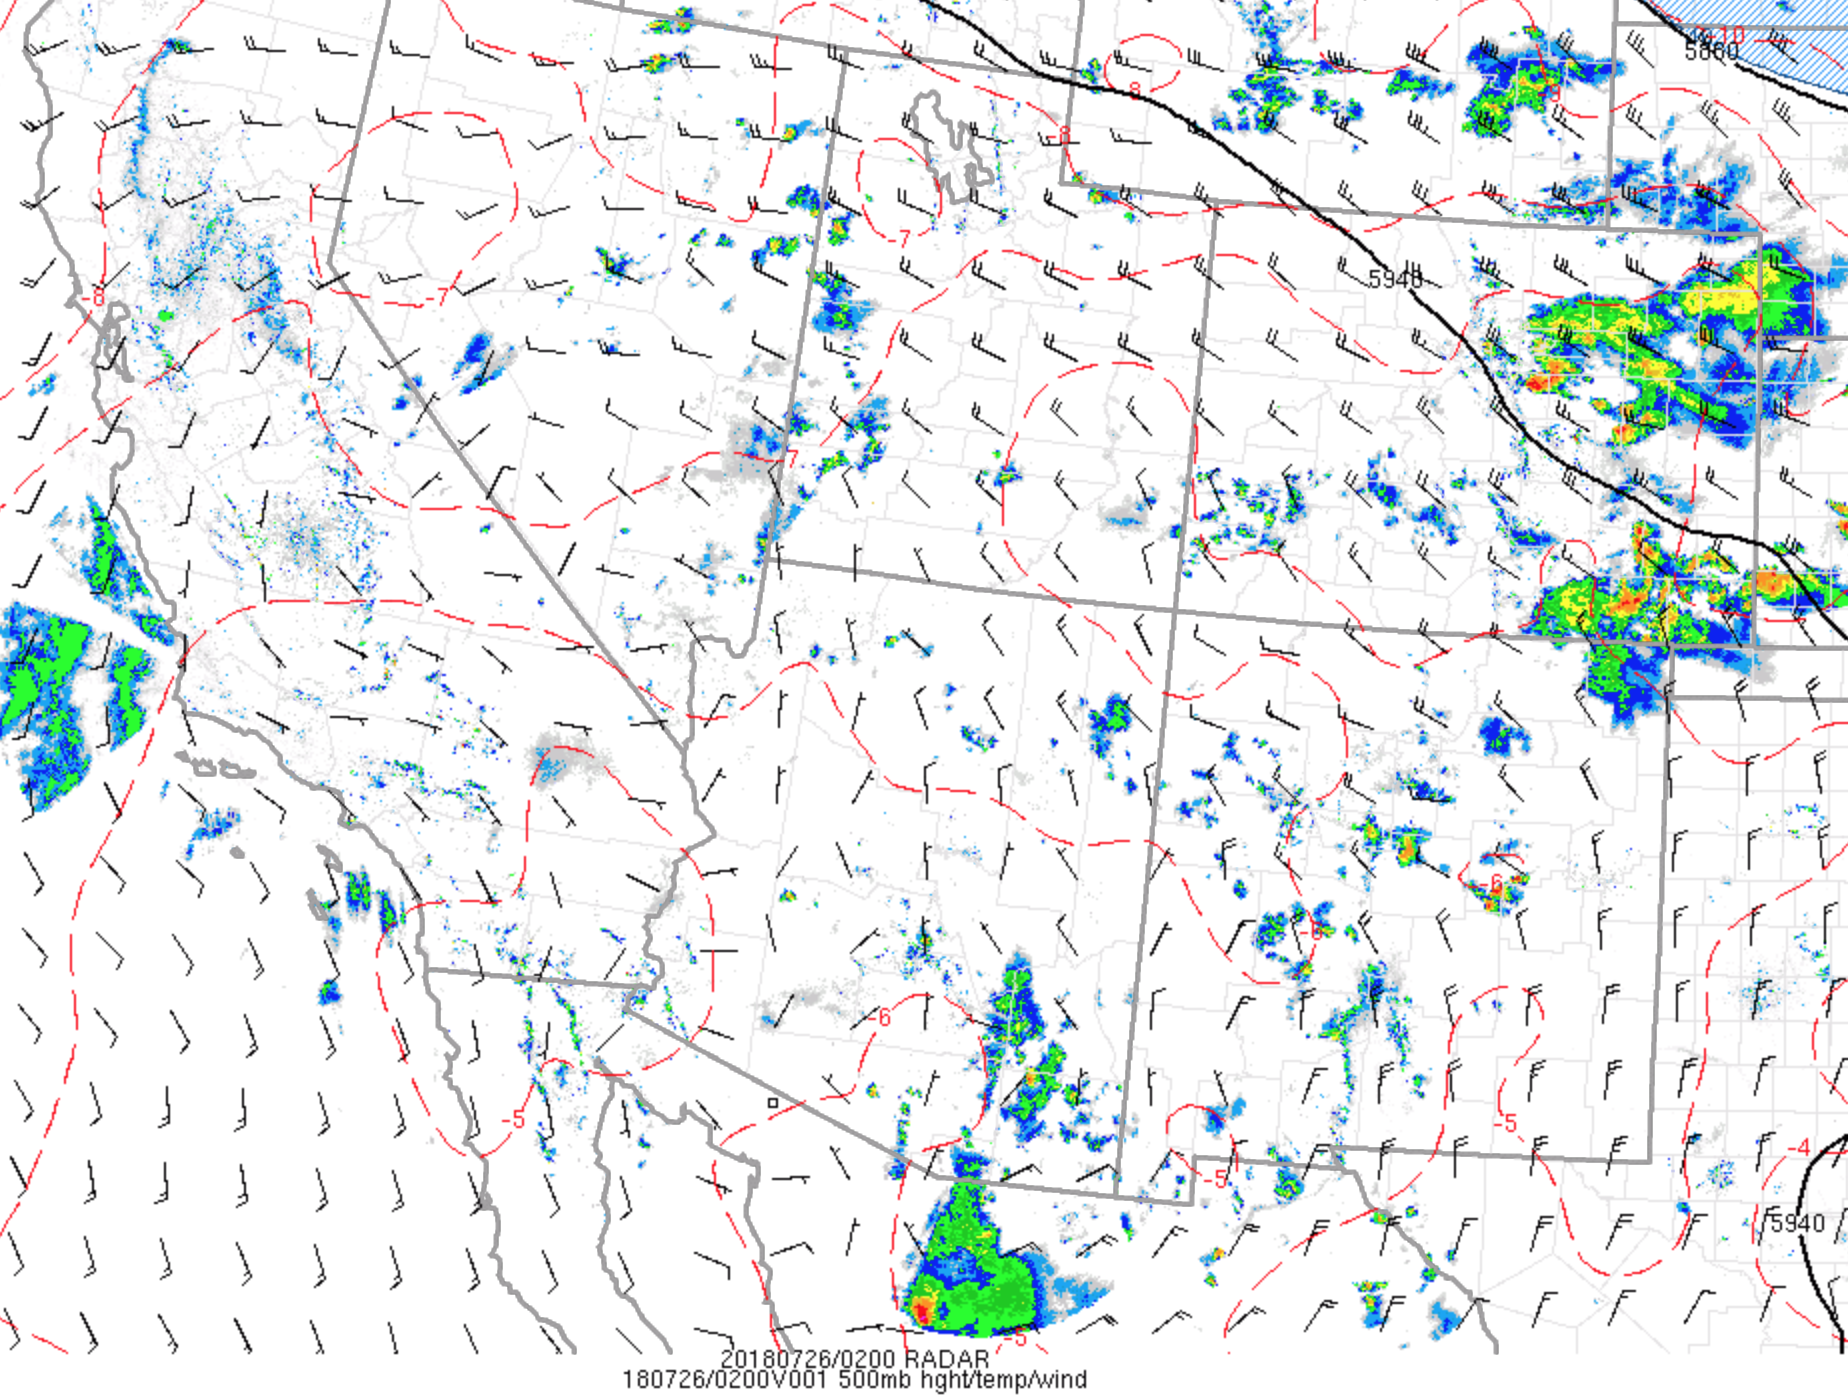
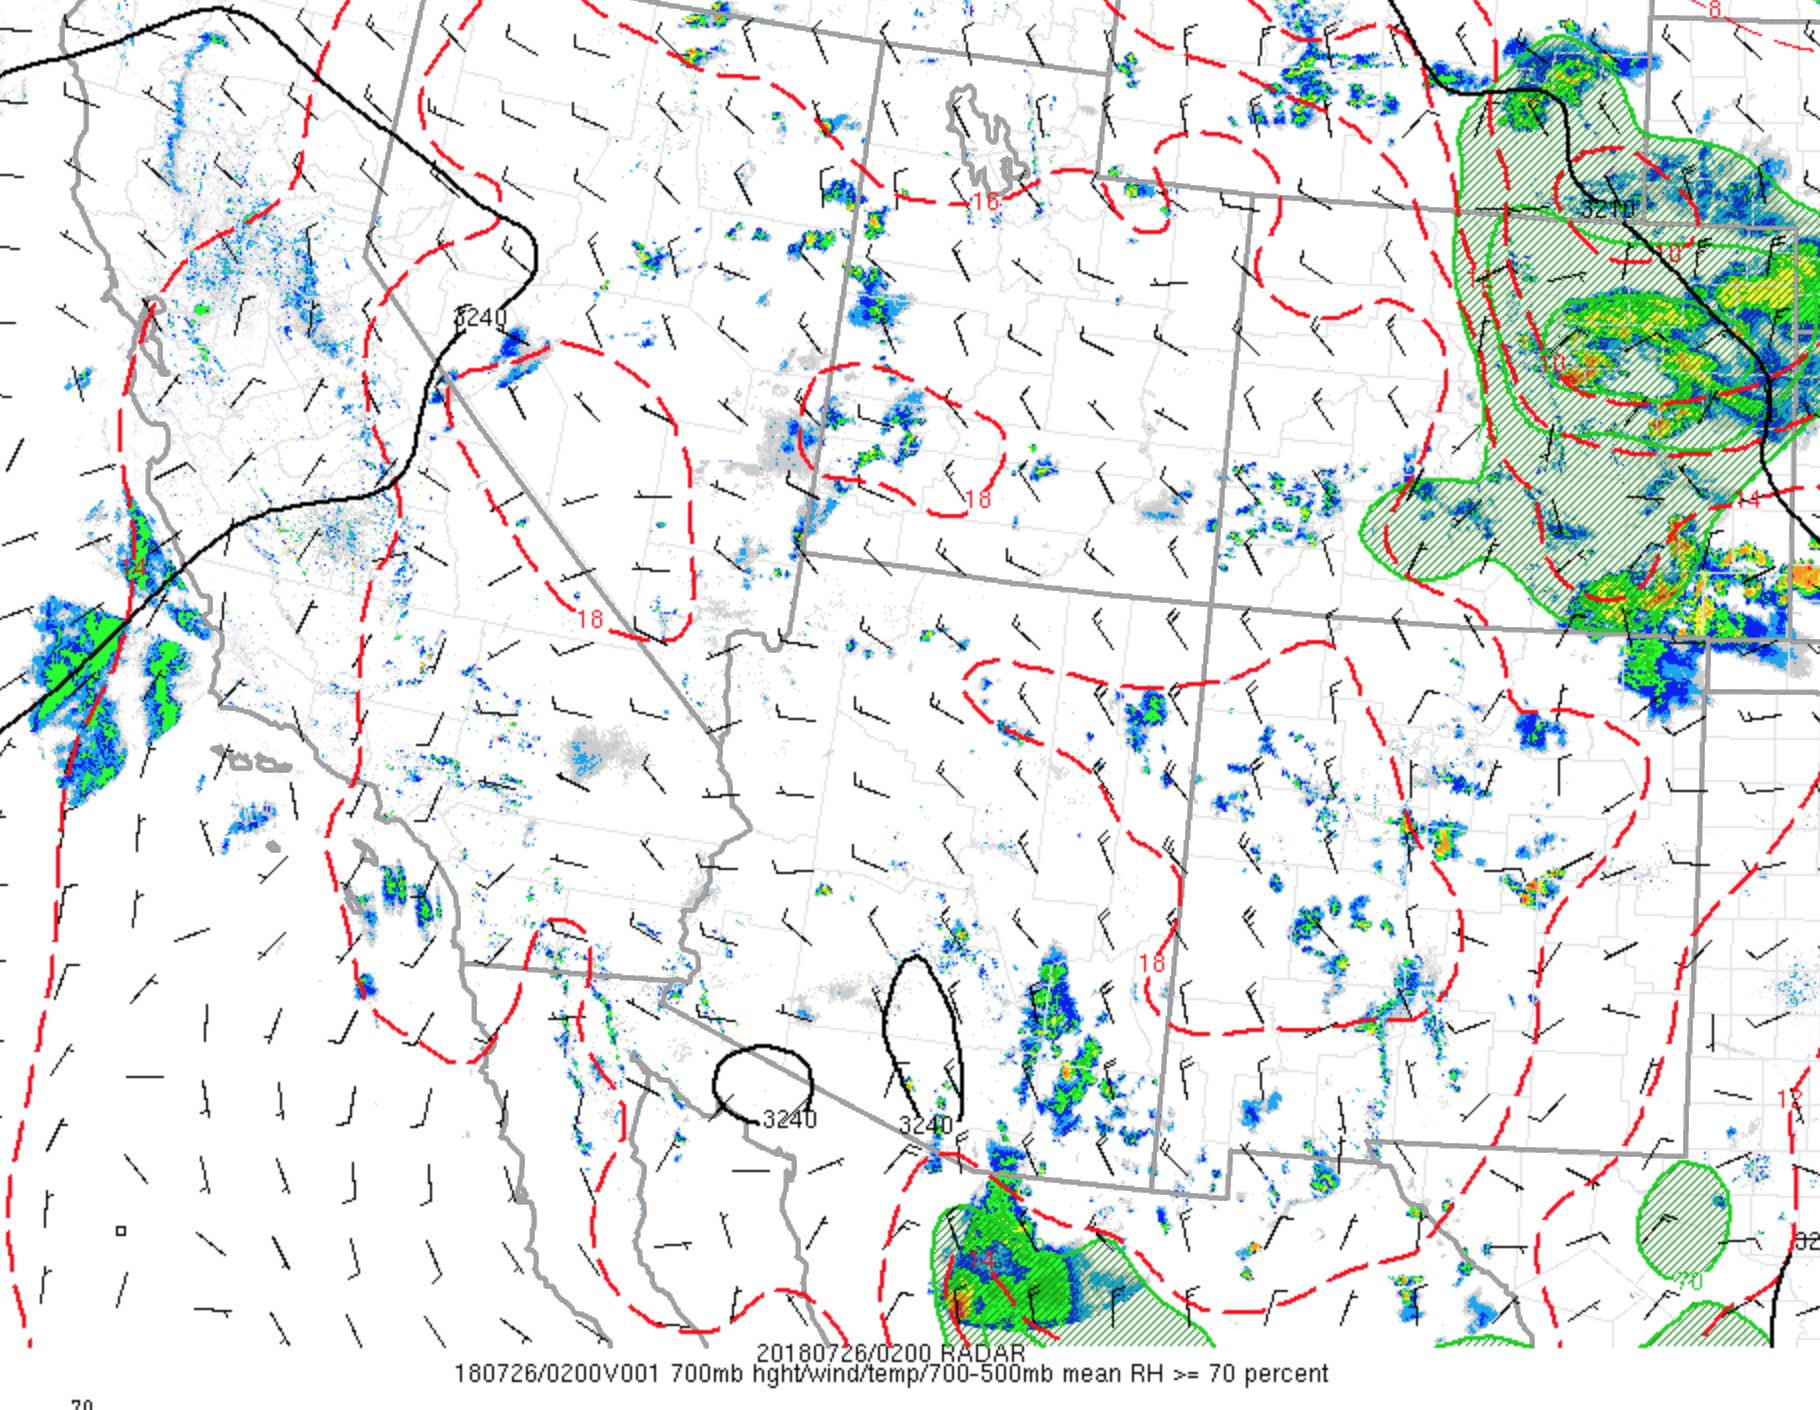

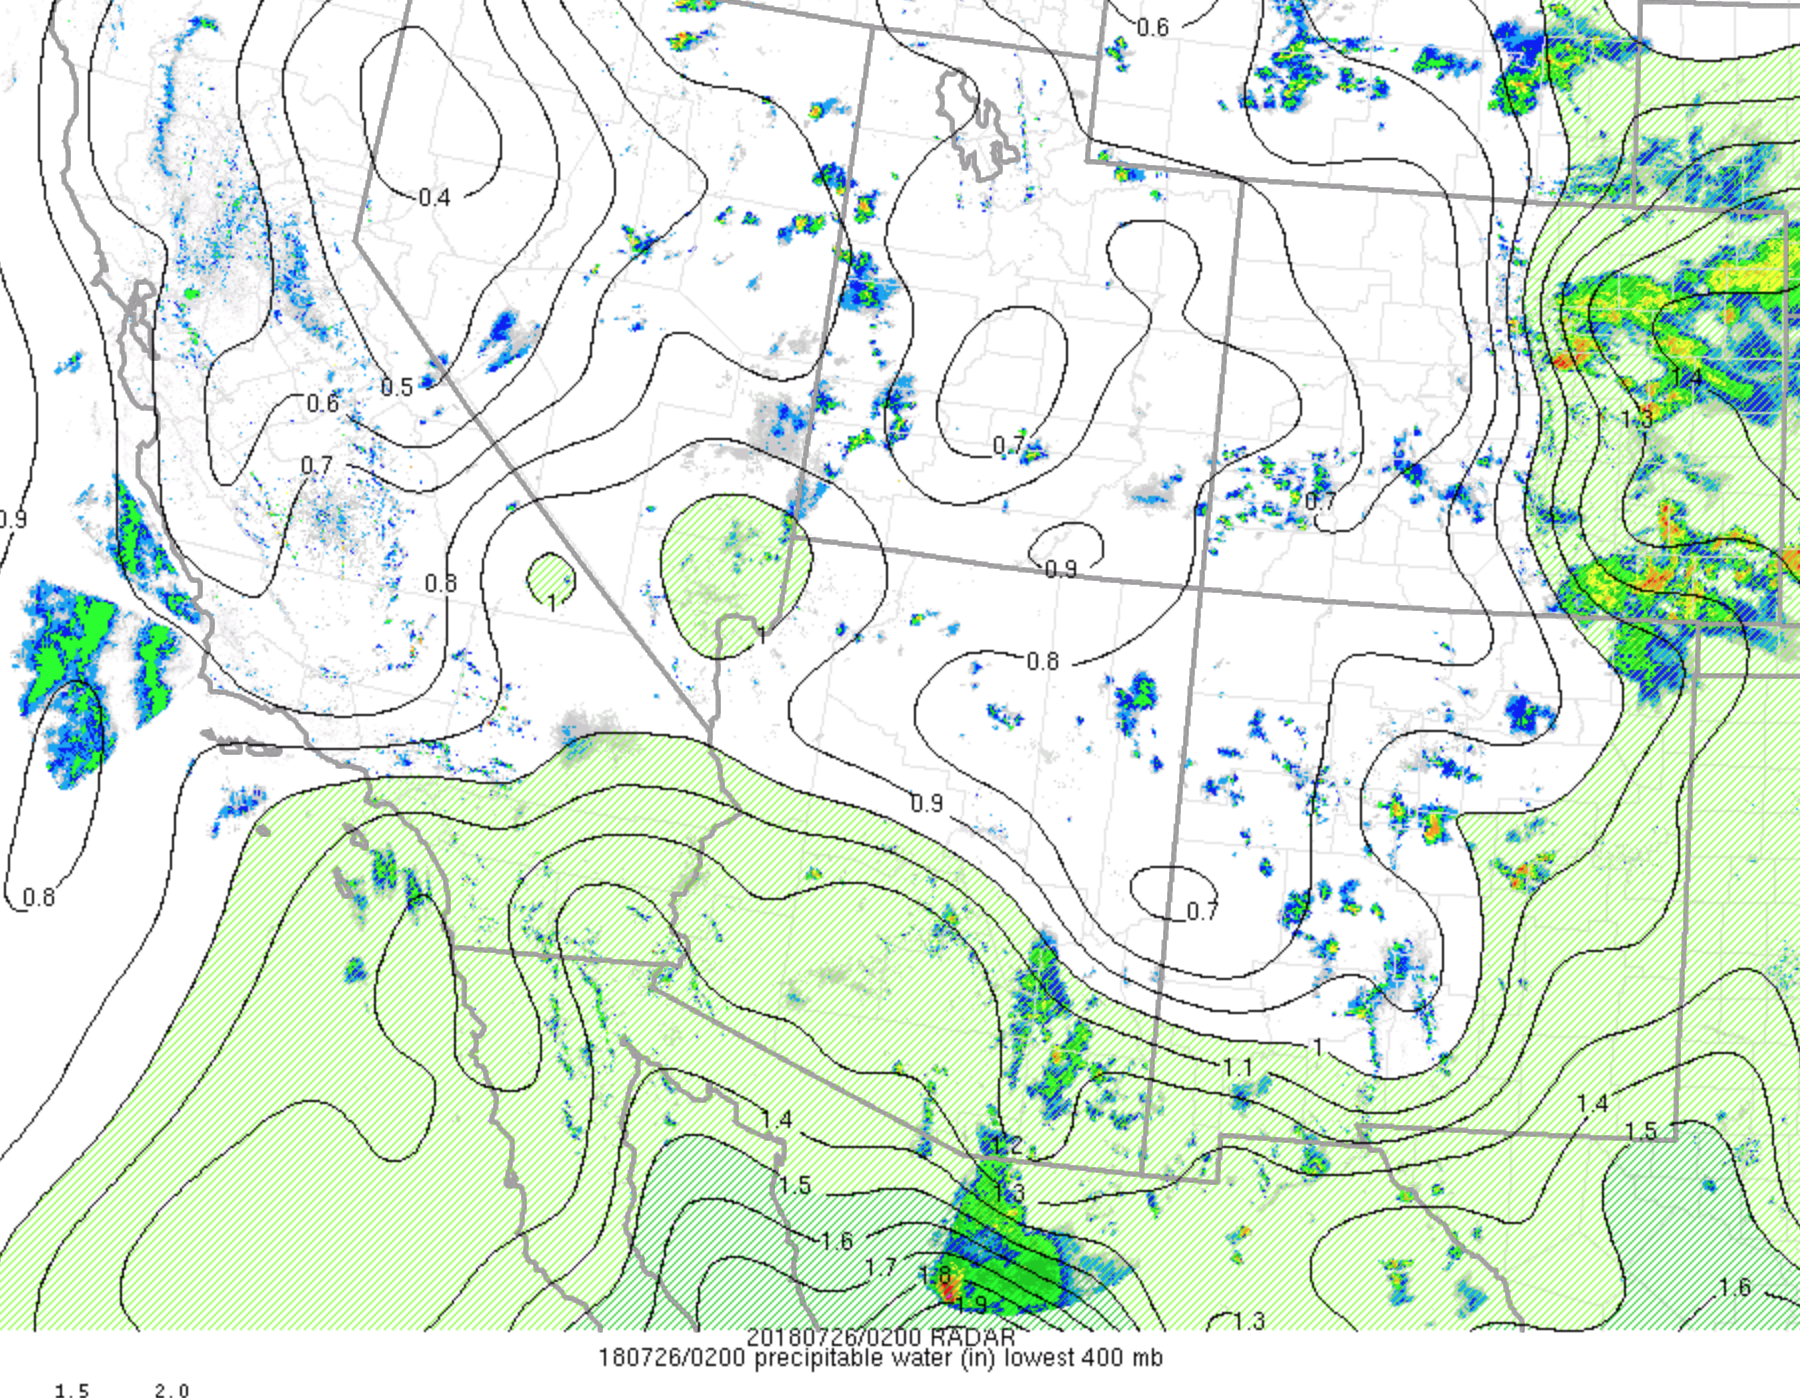

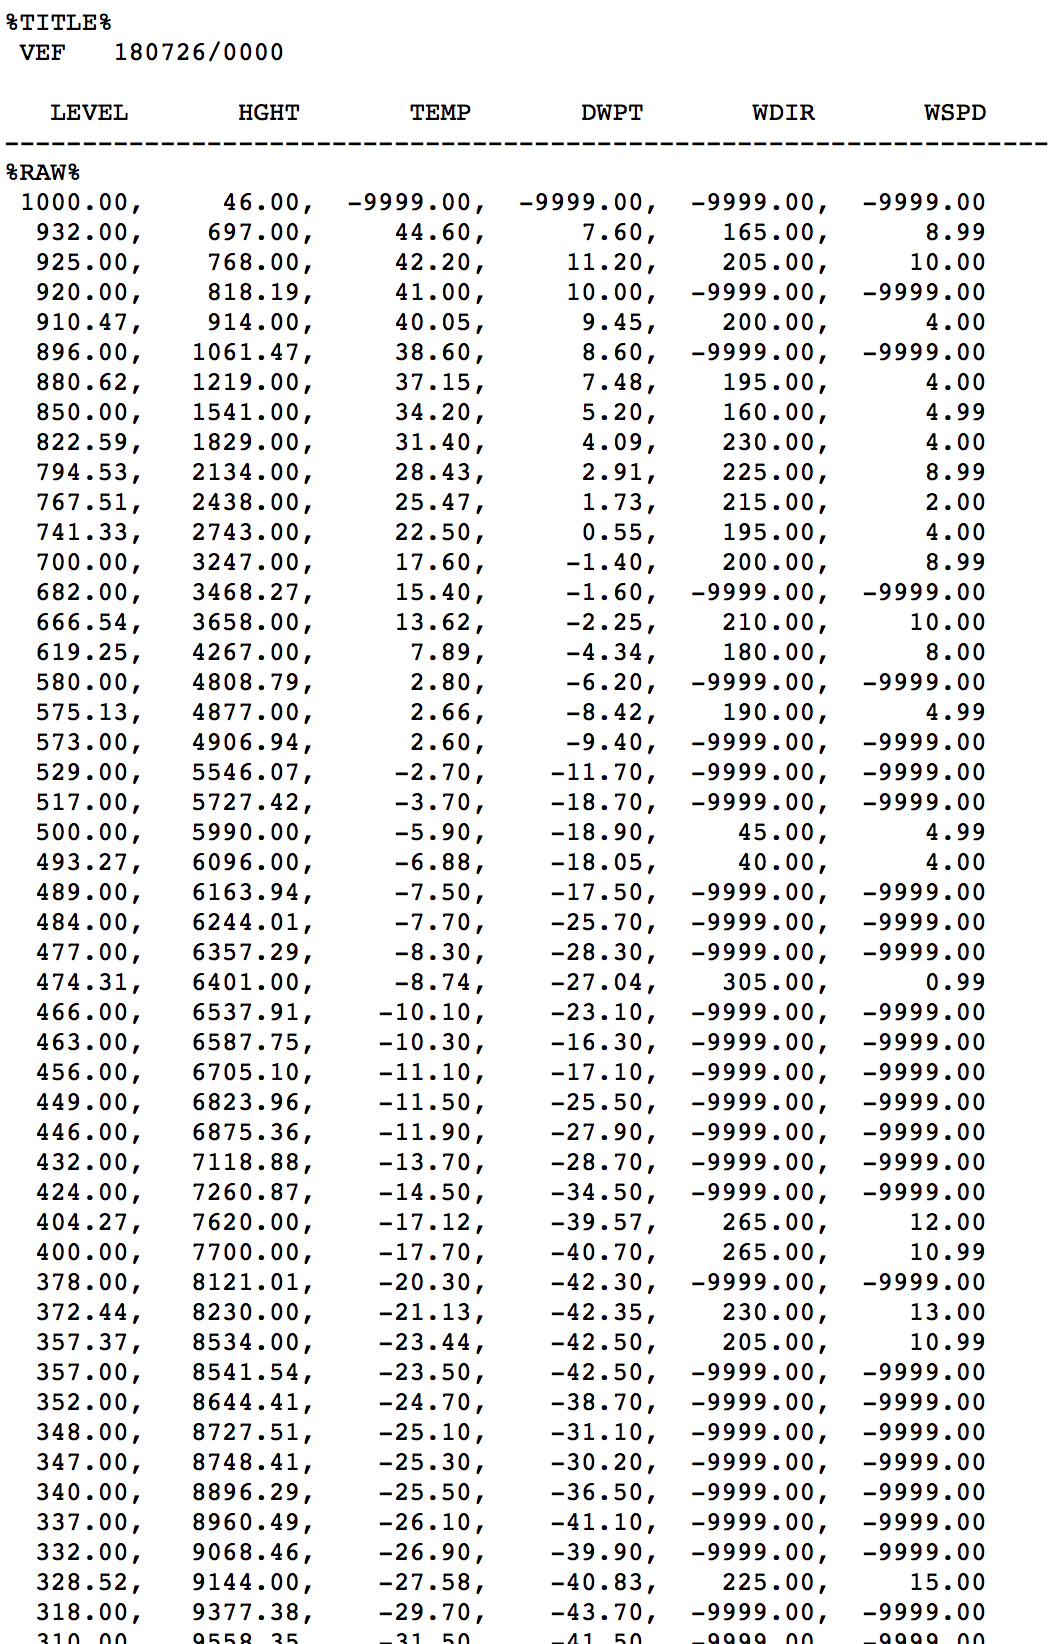
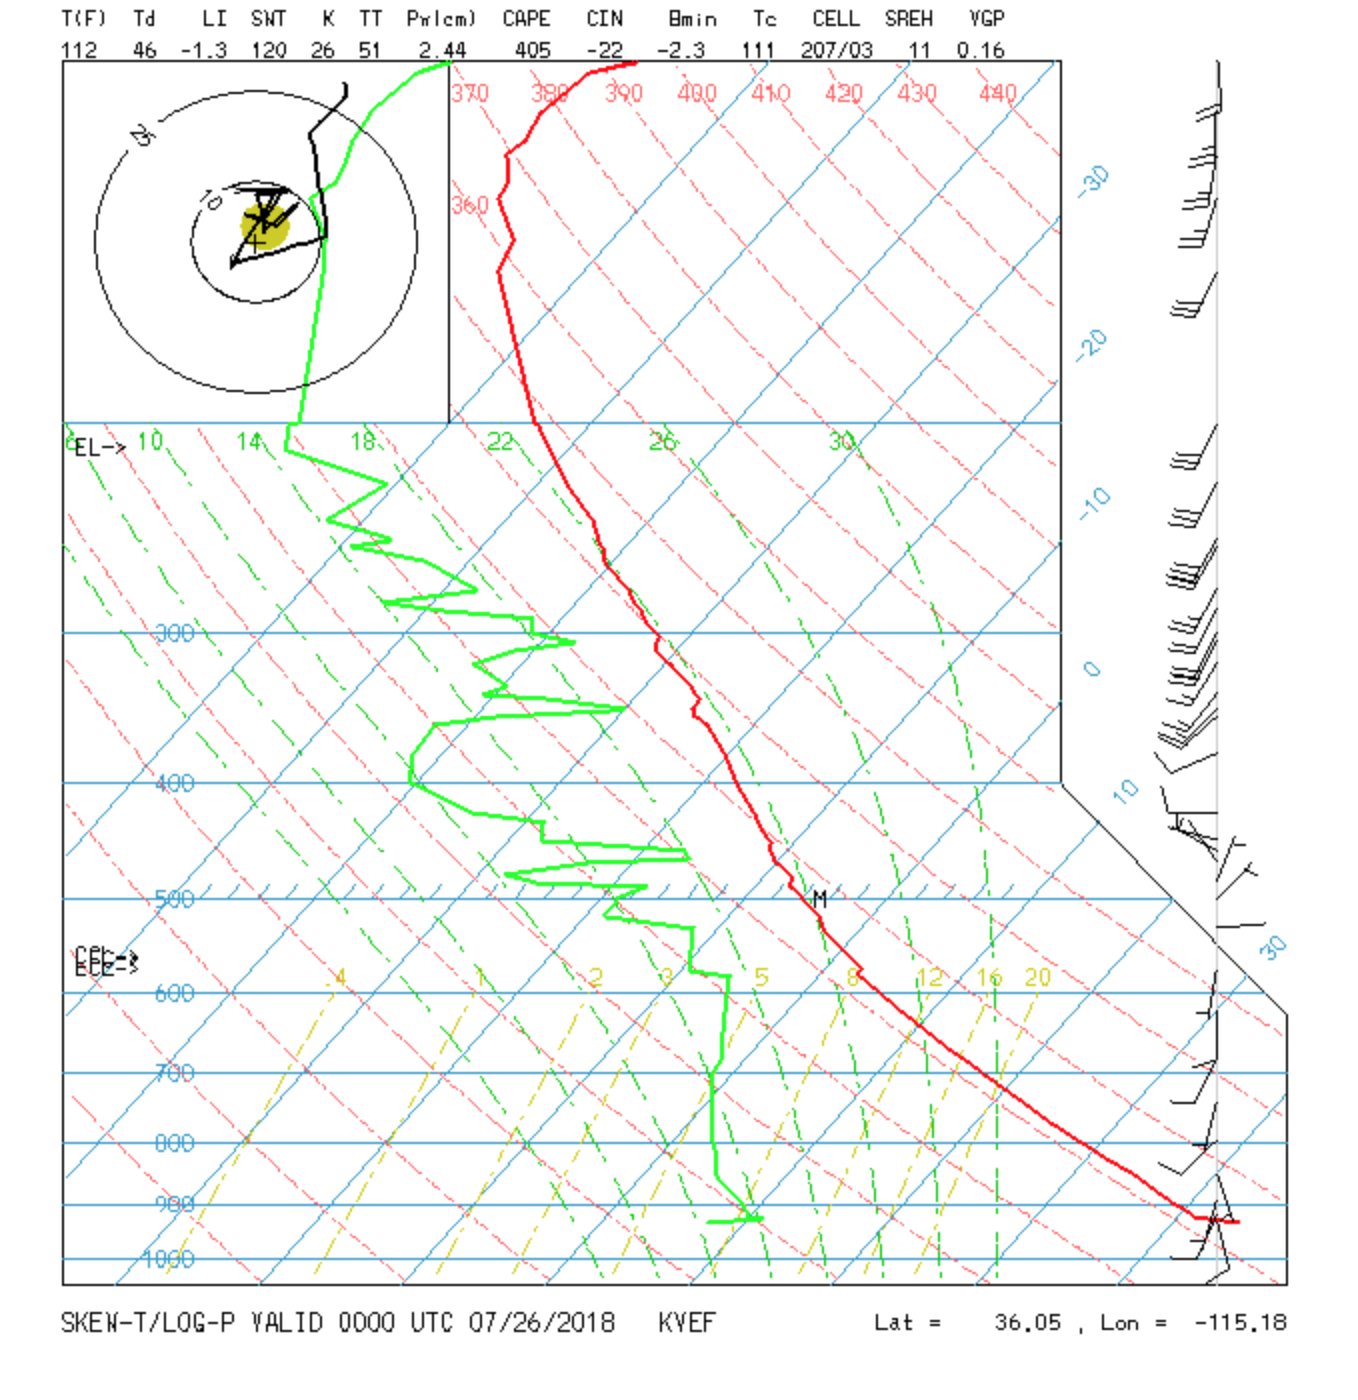
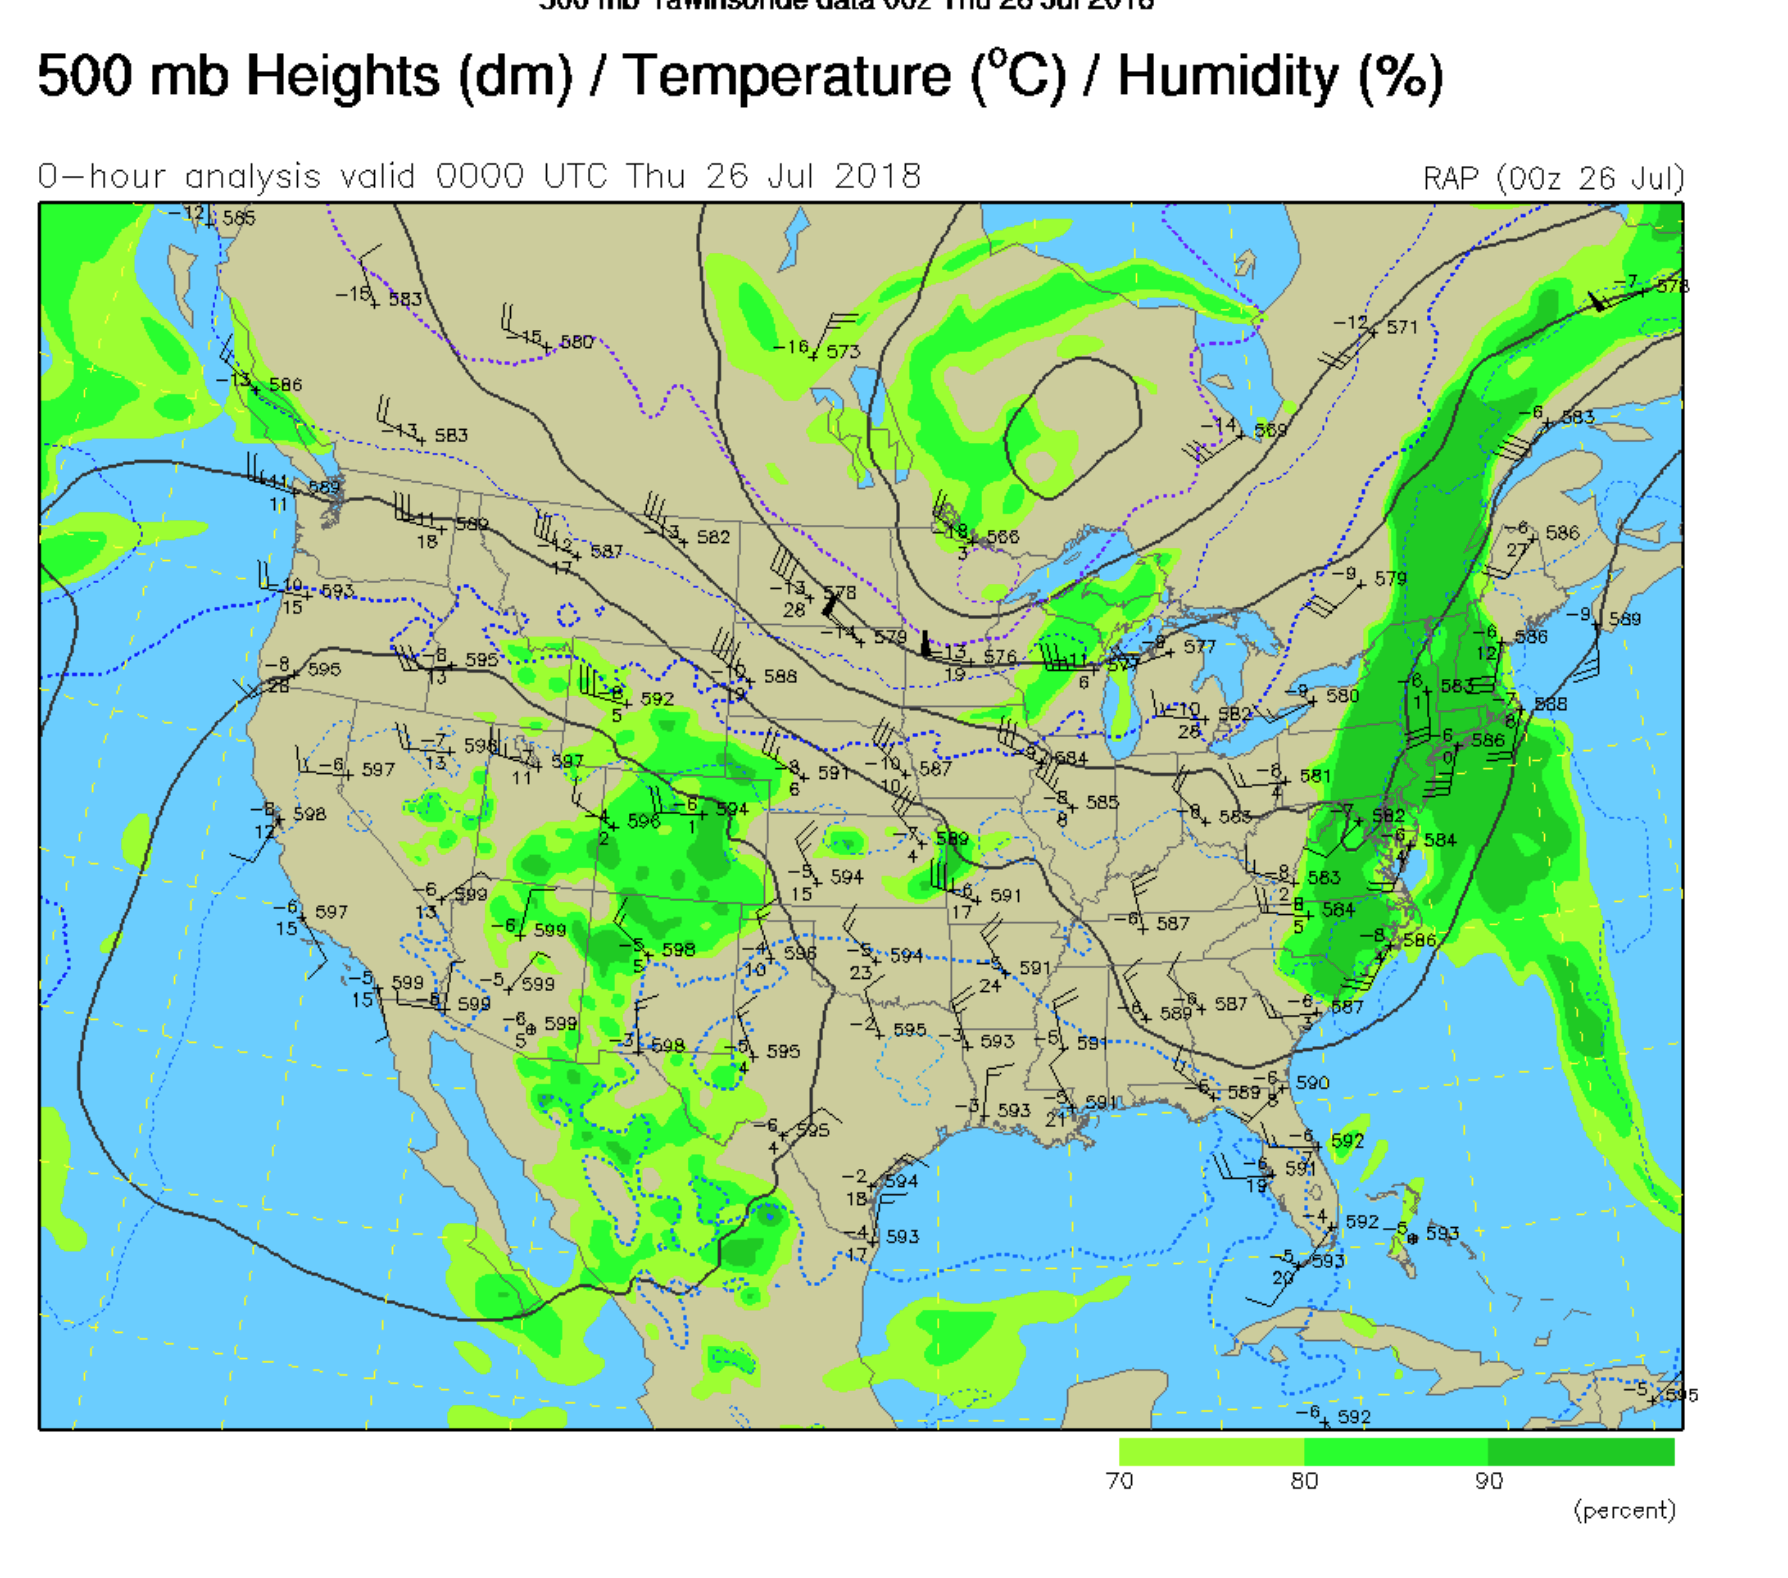
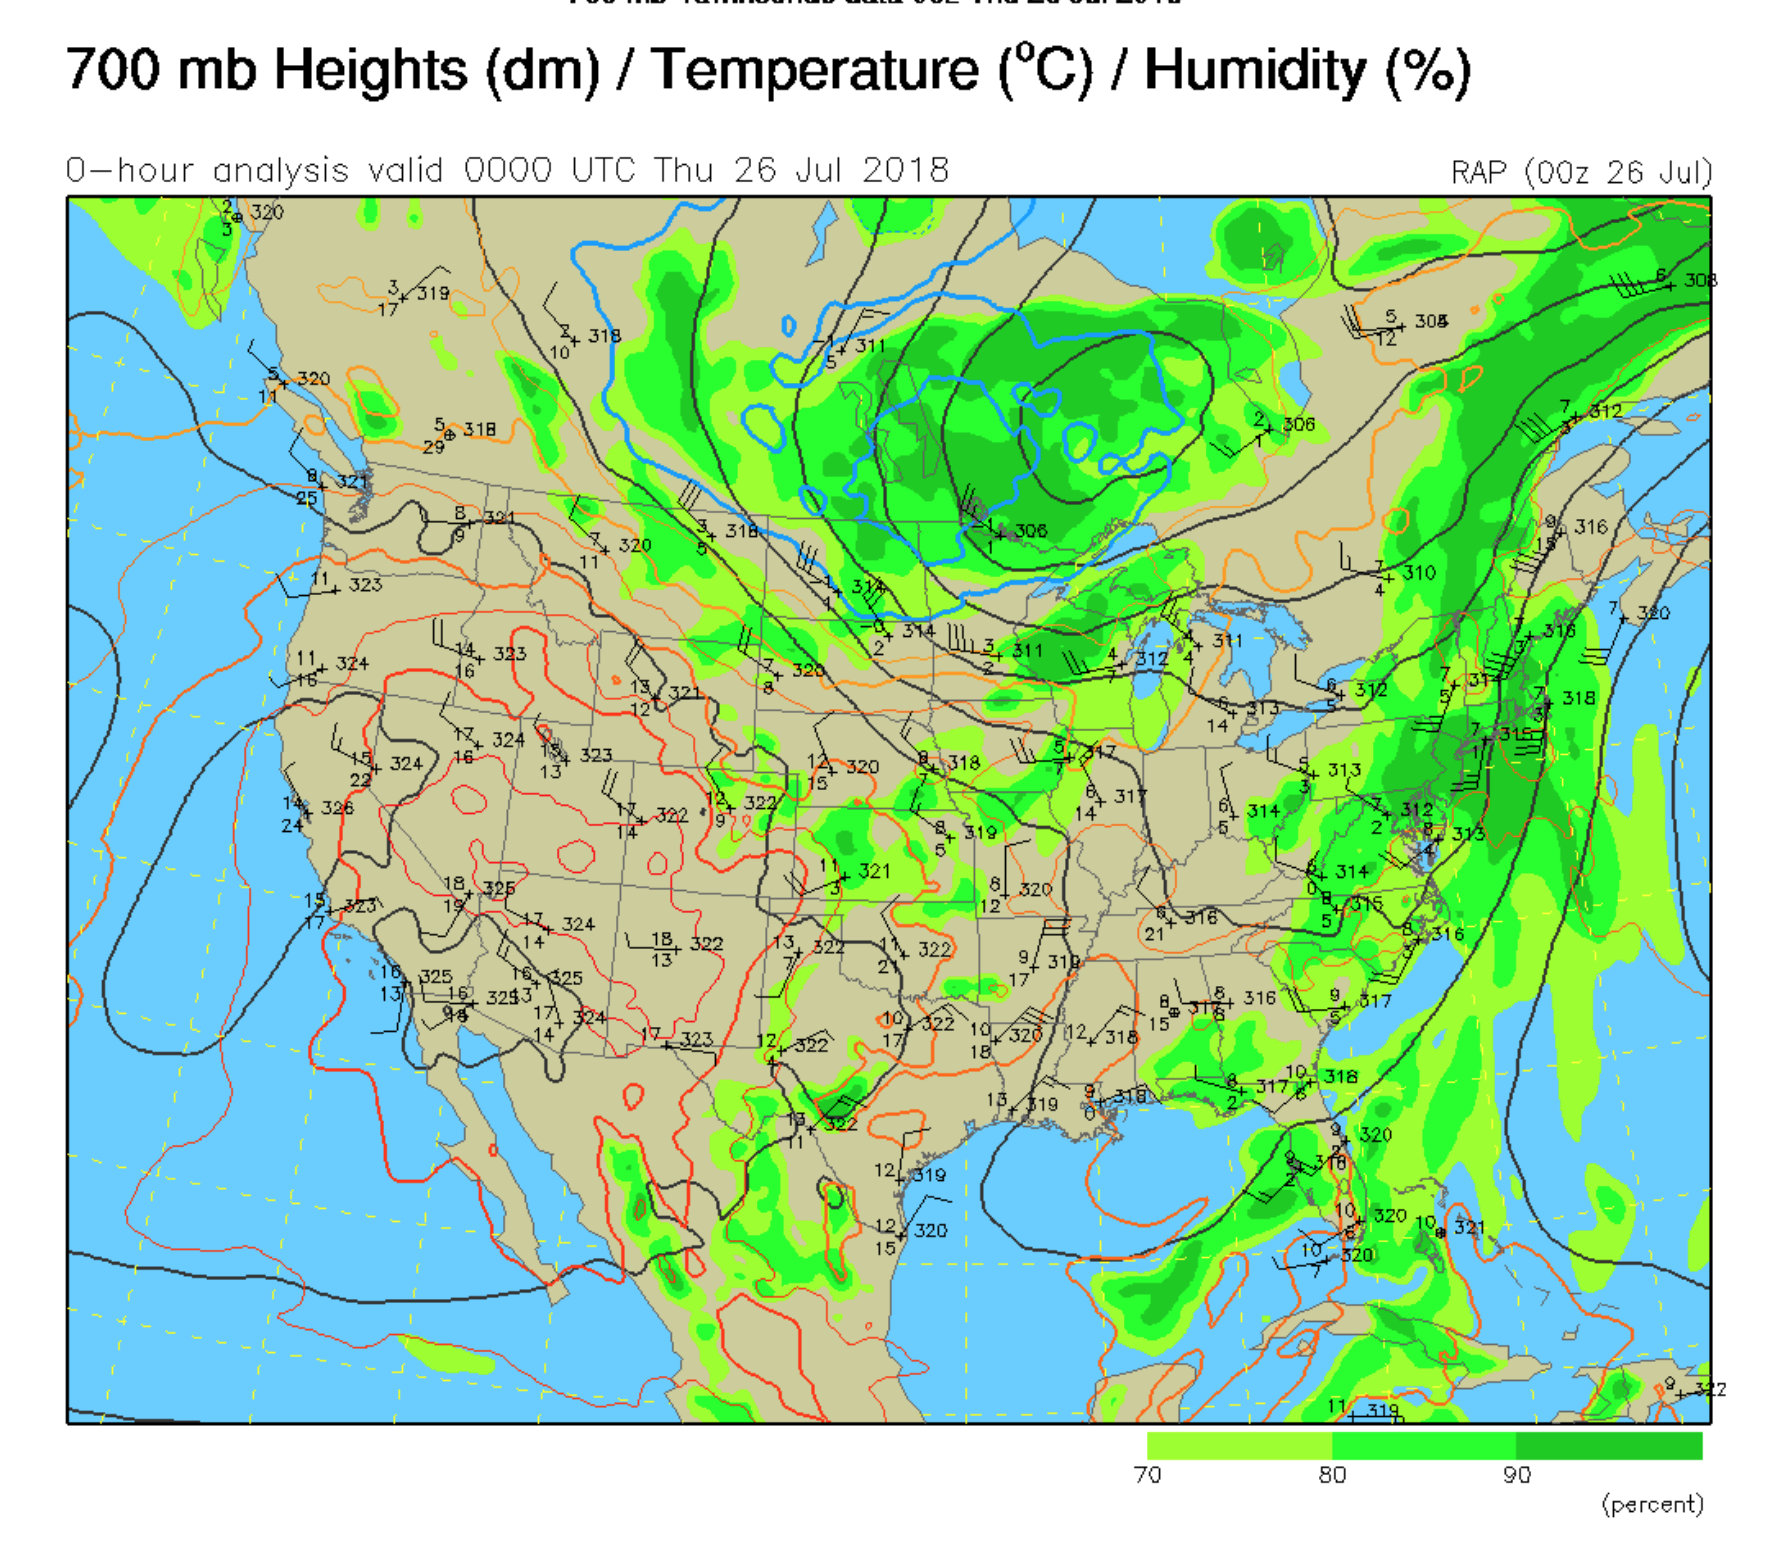
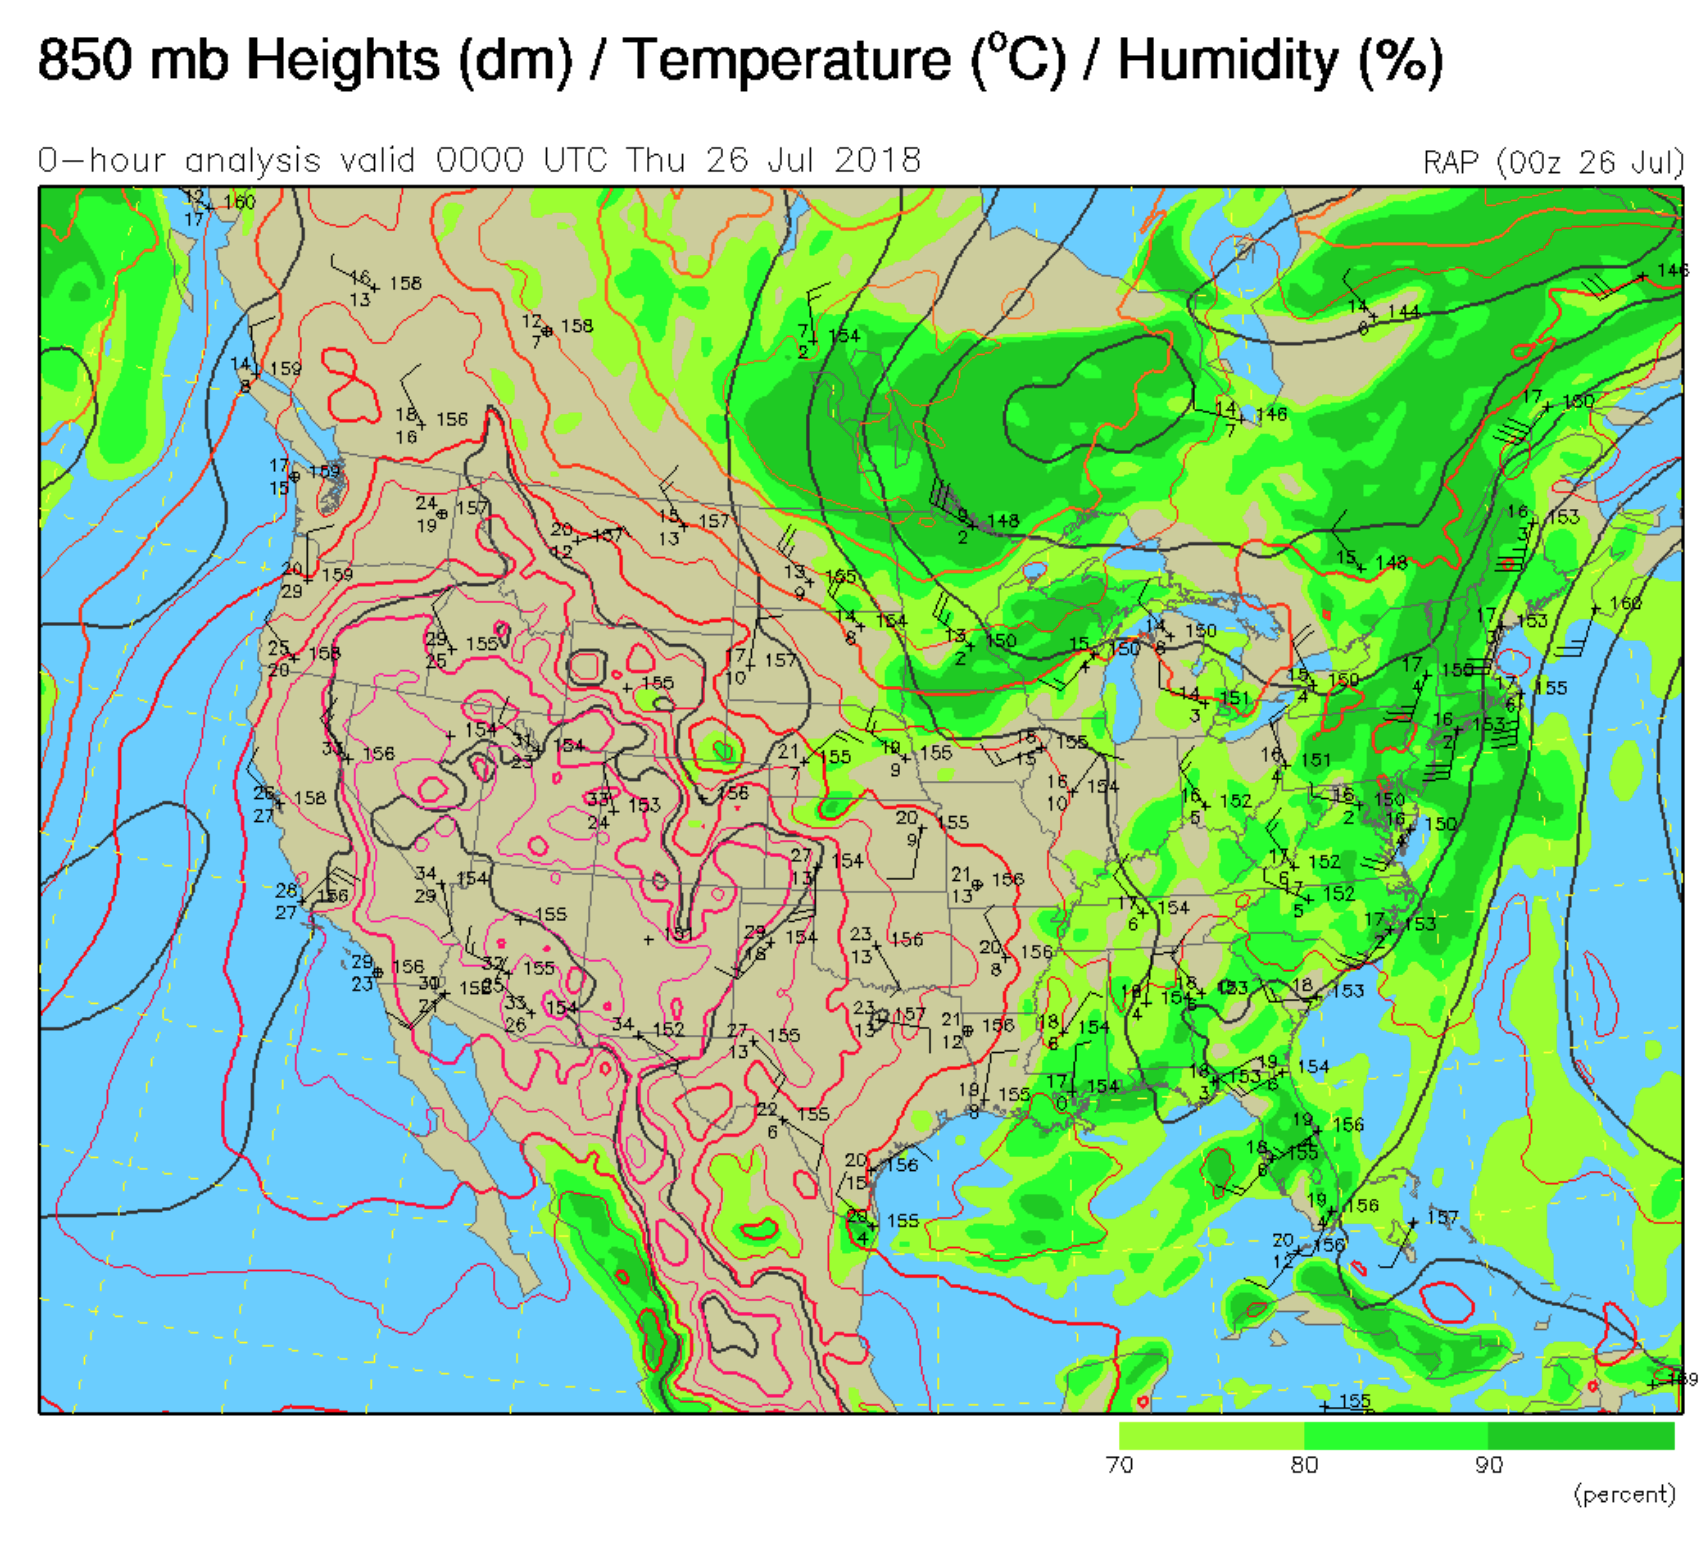
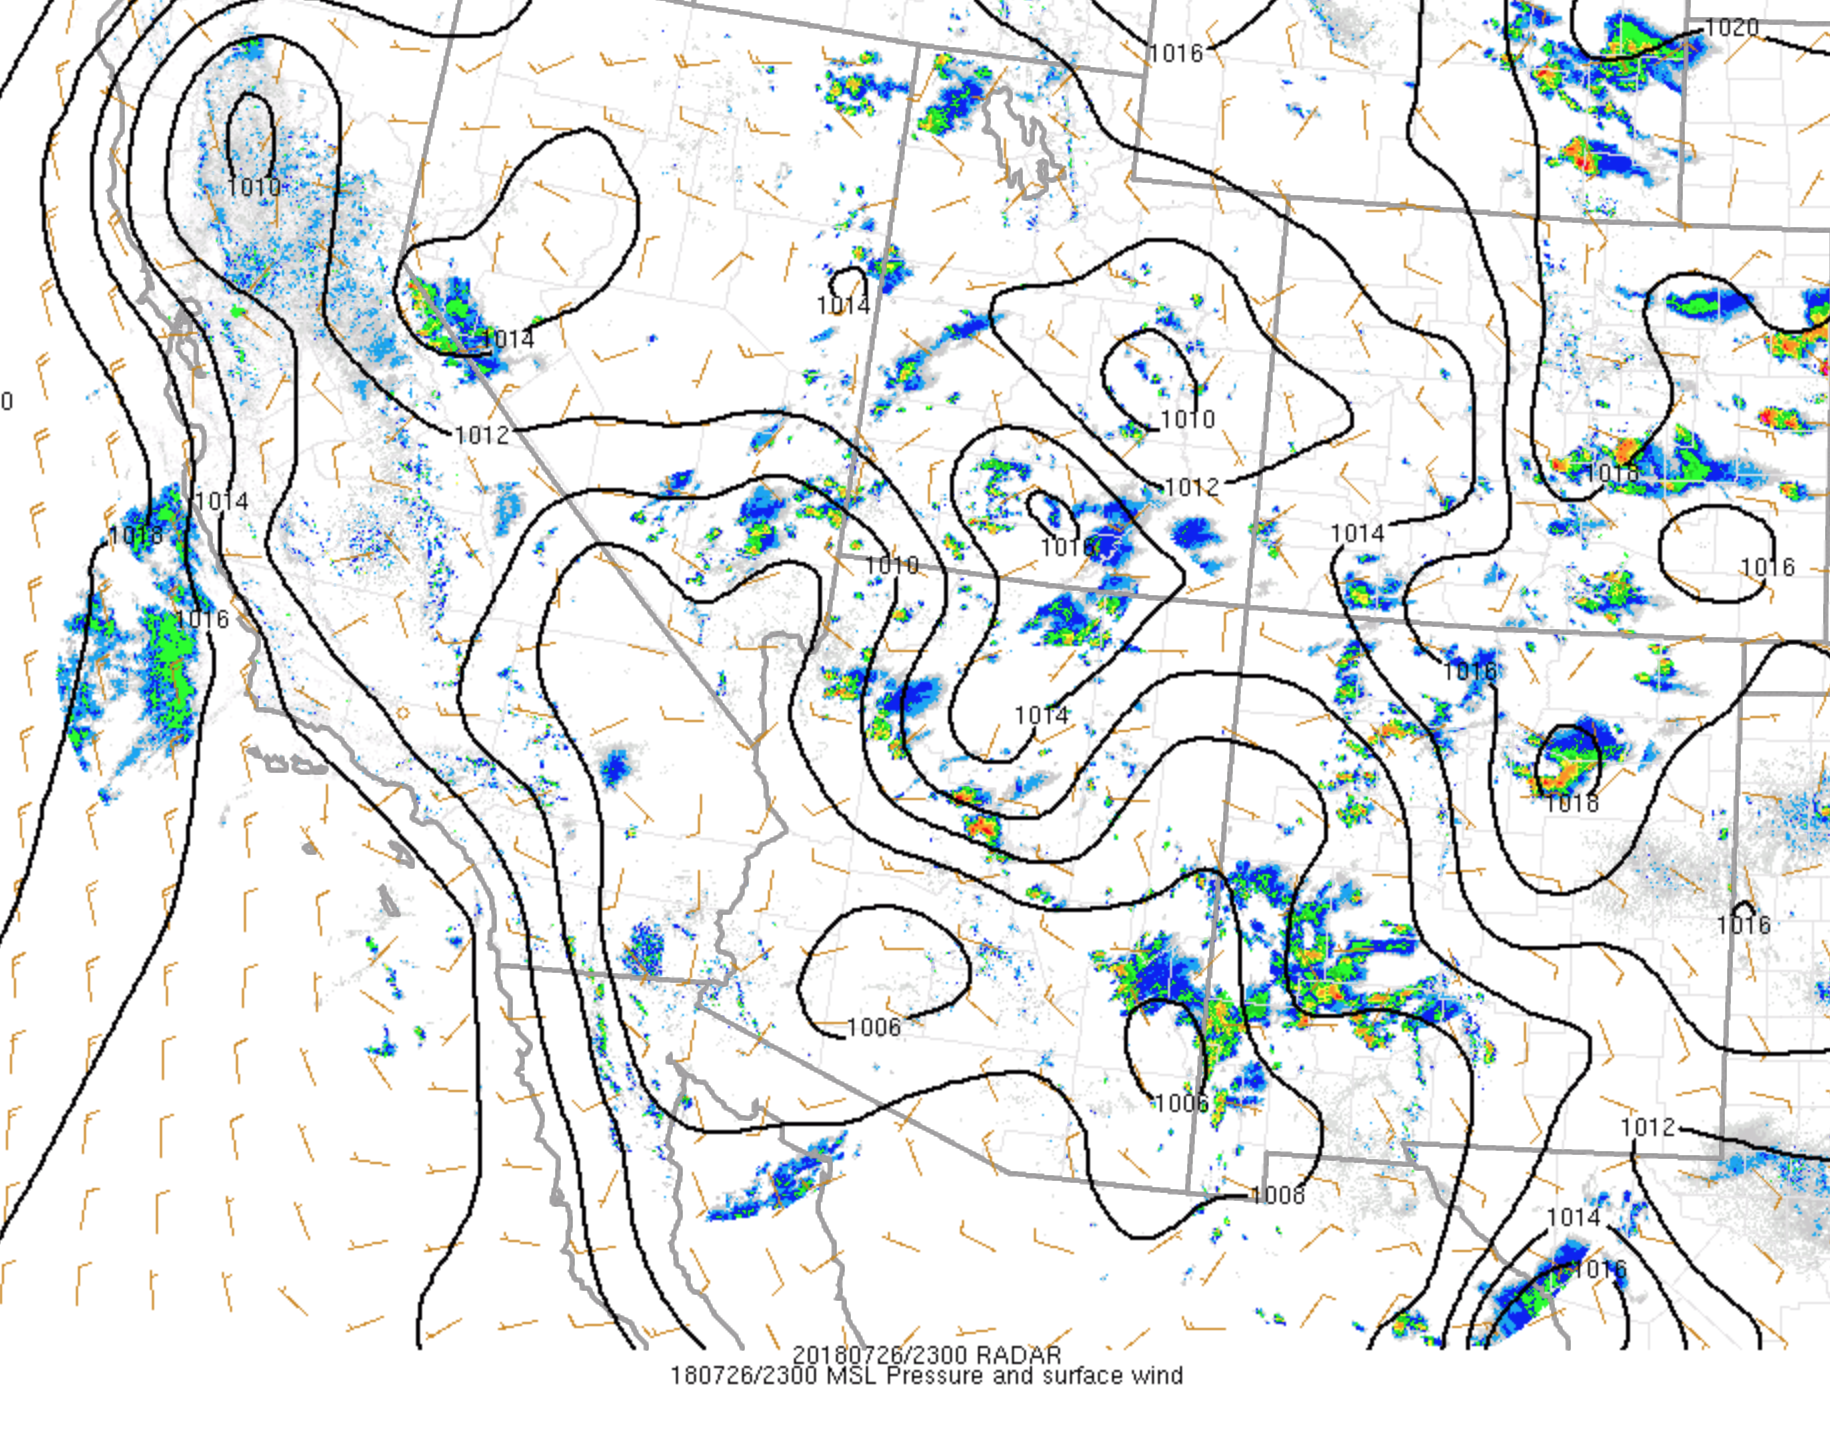
July 26

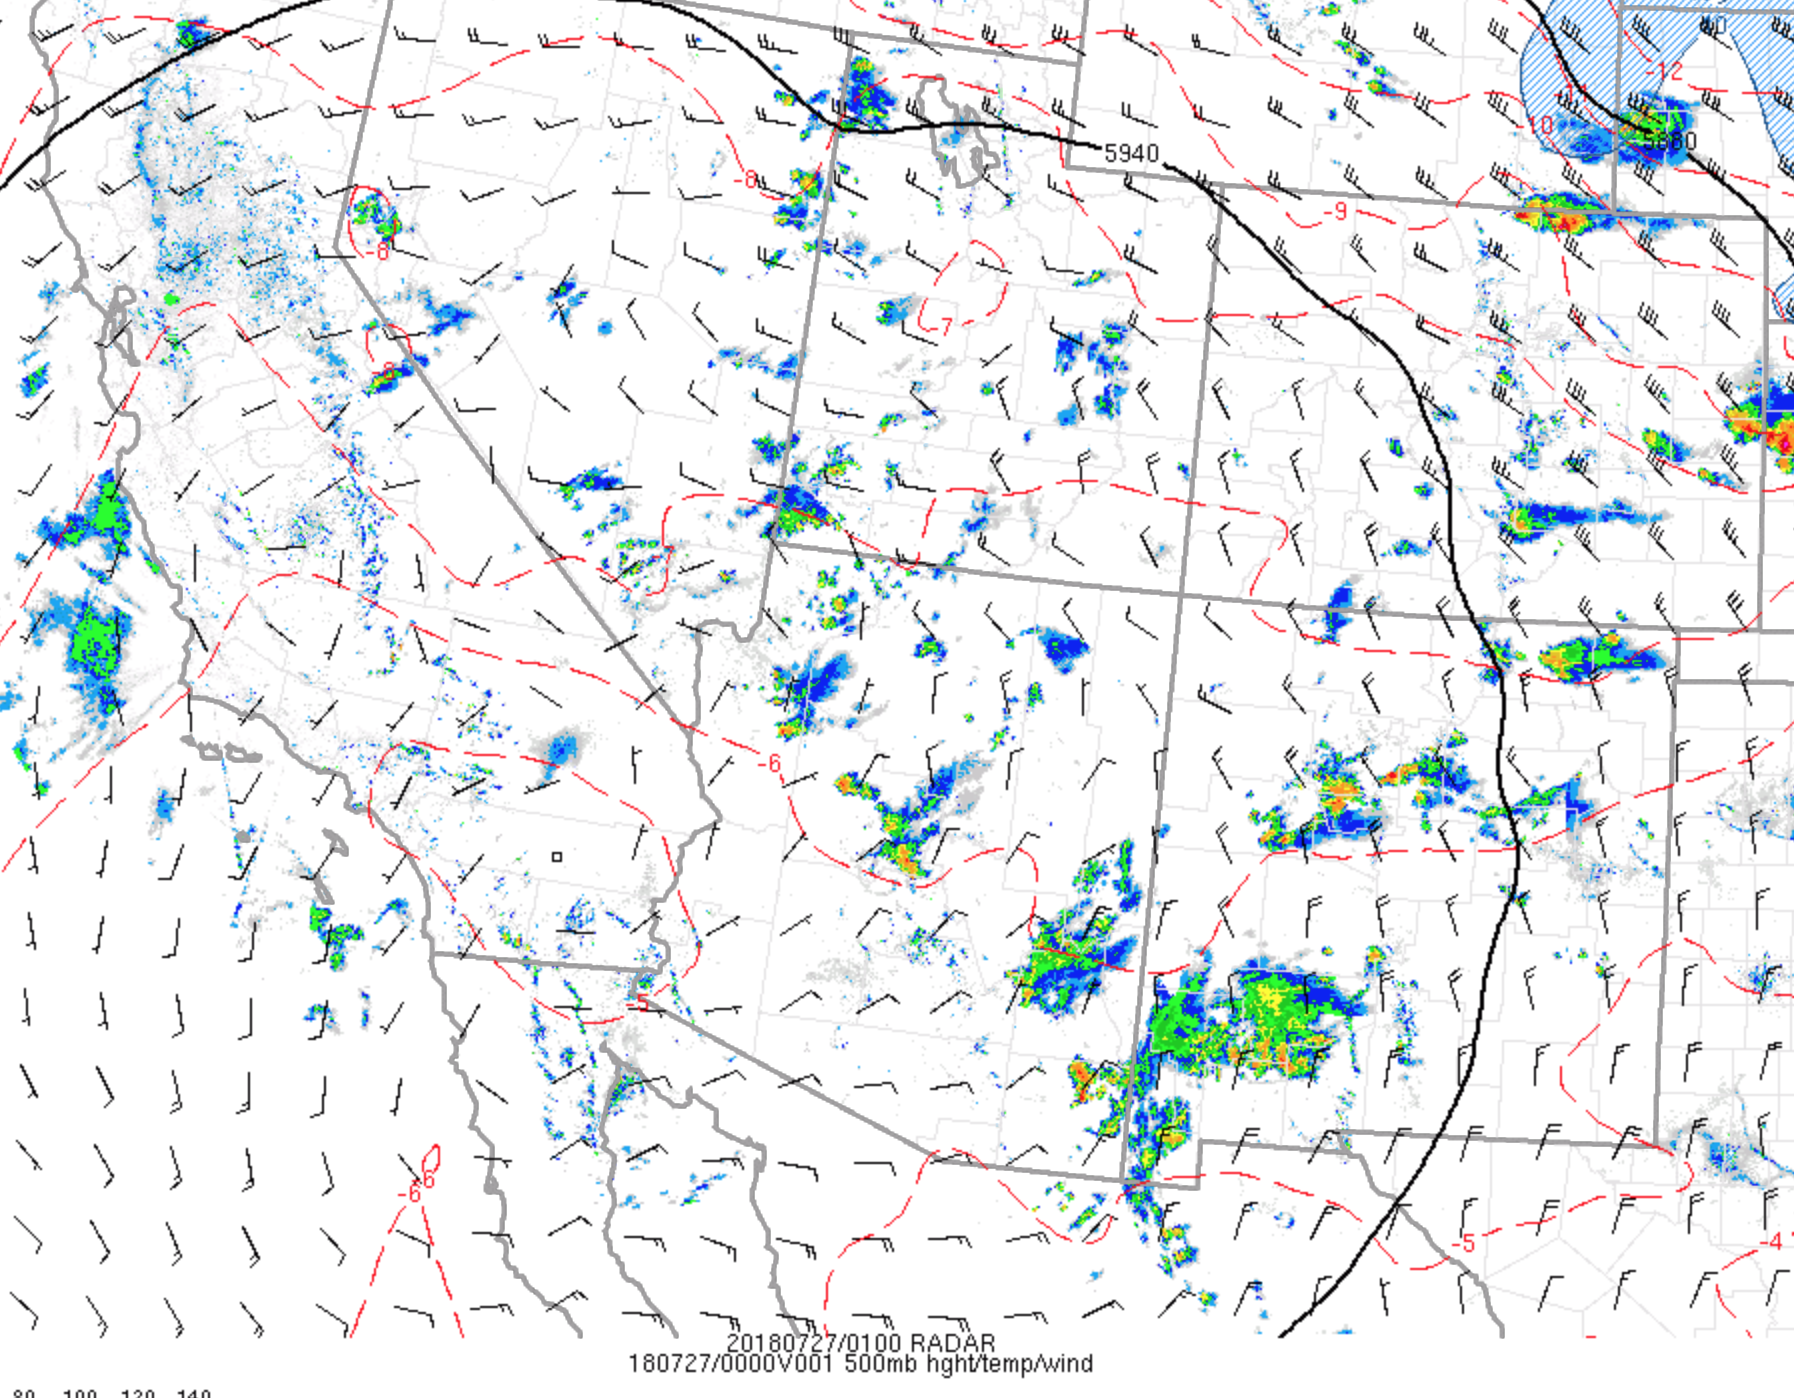
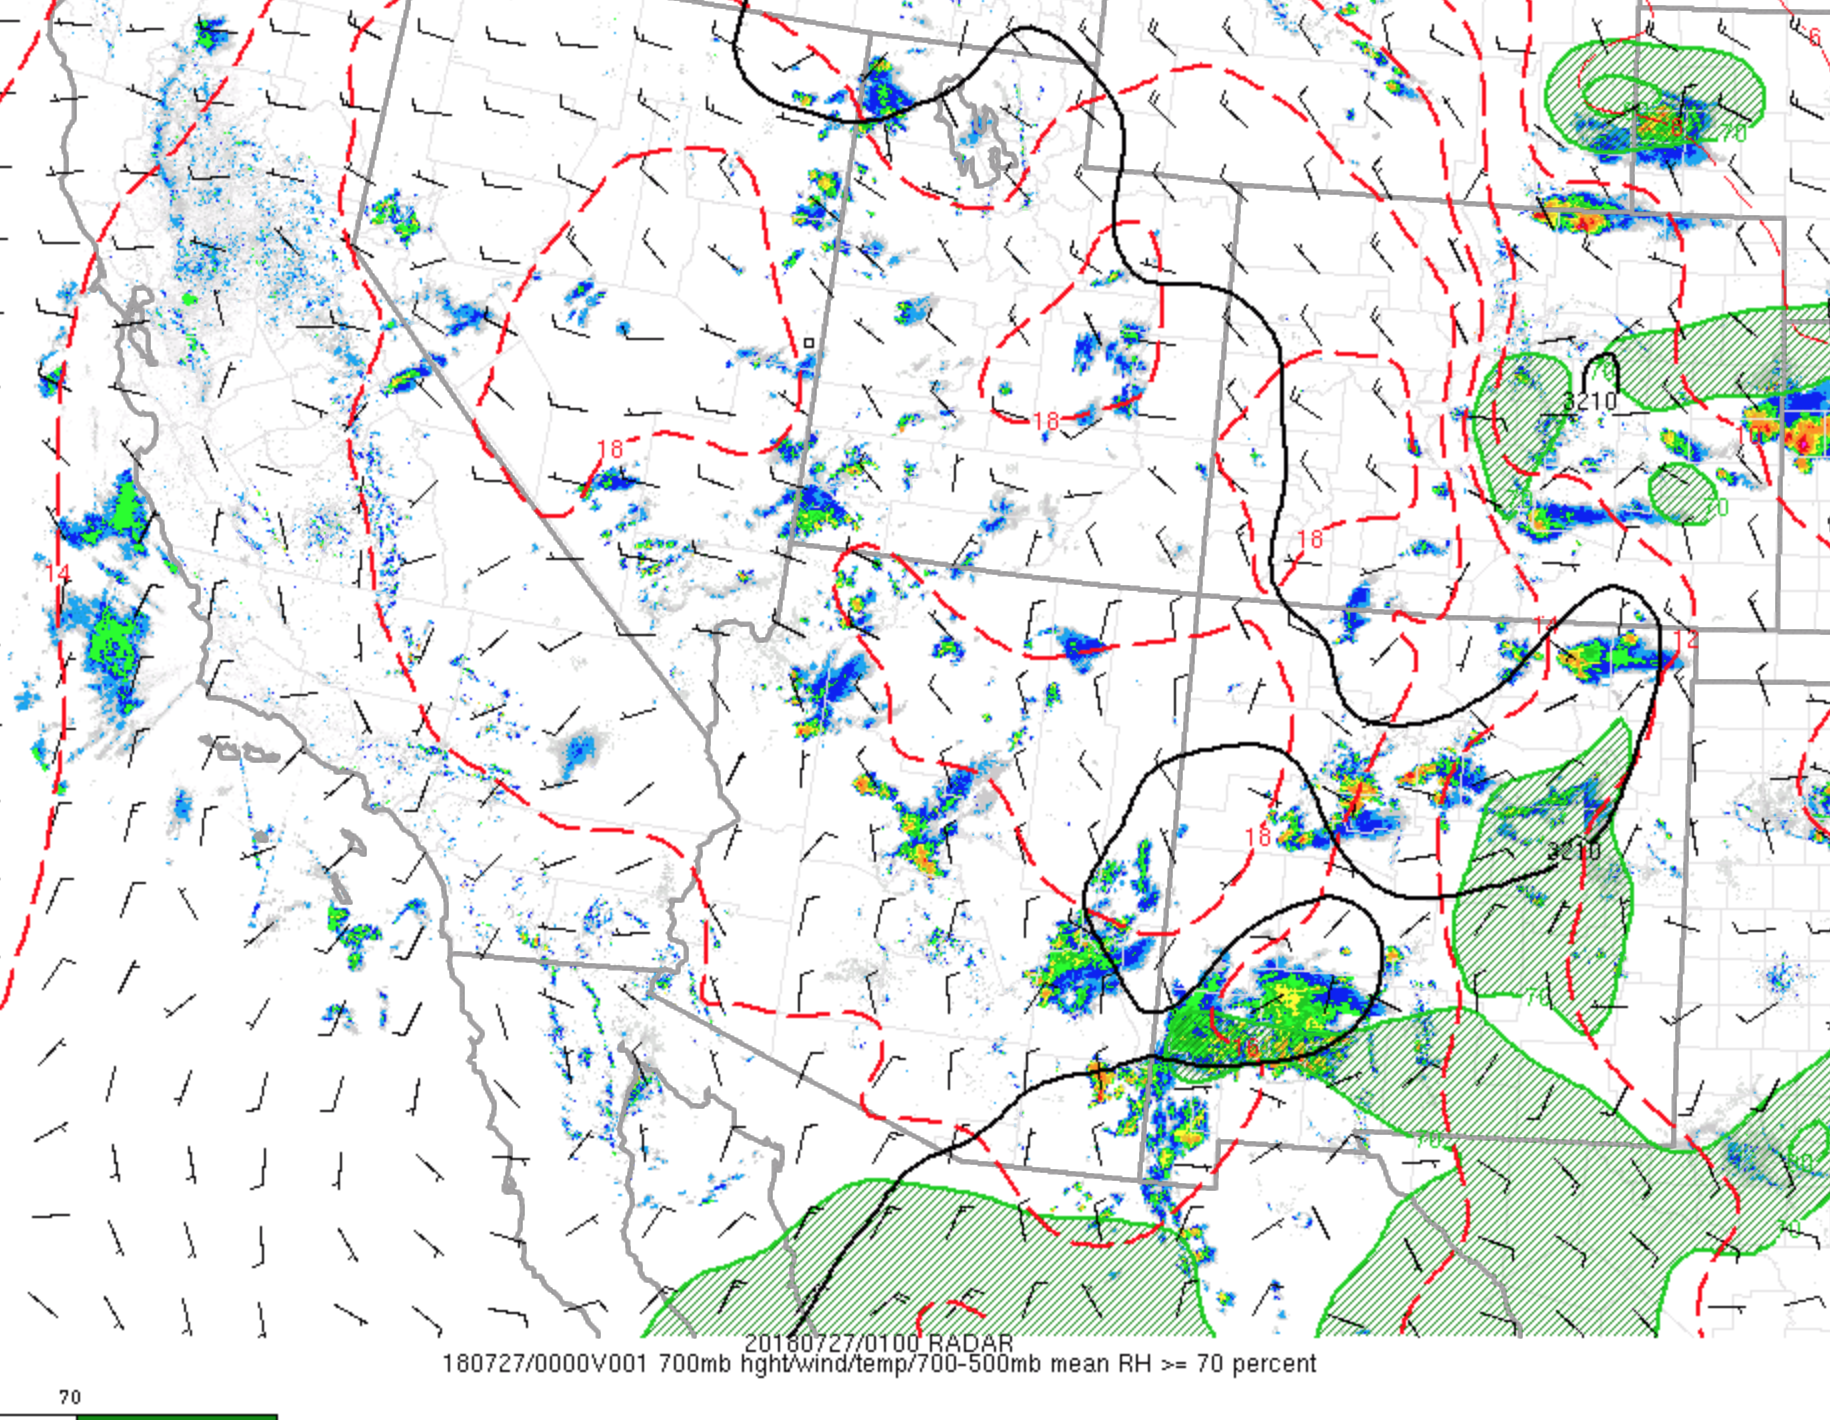


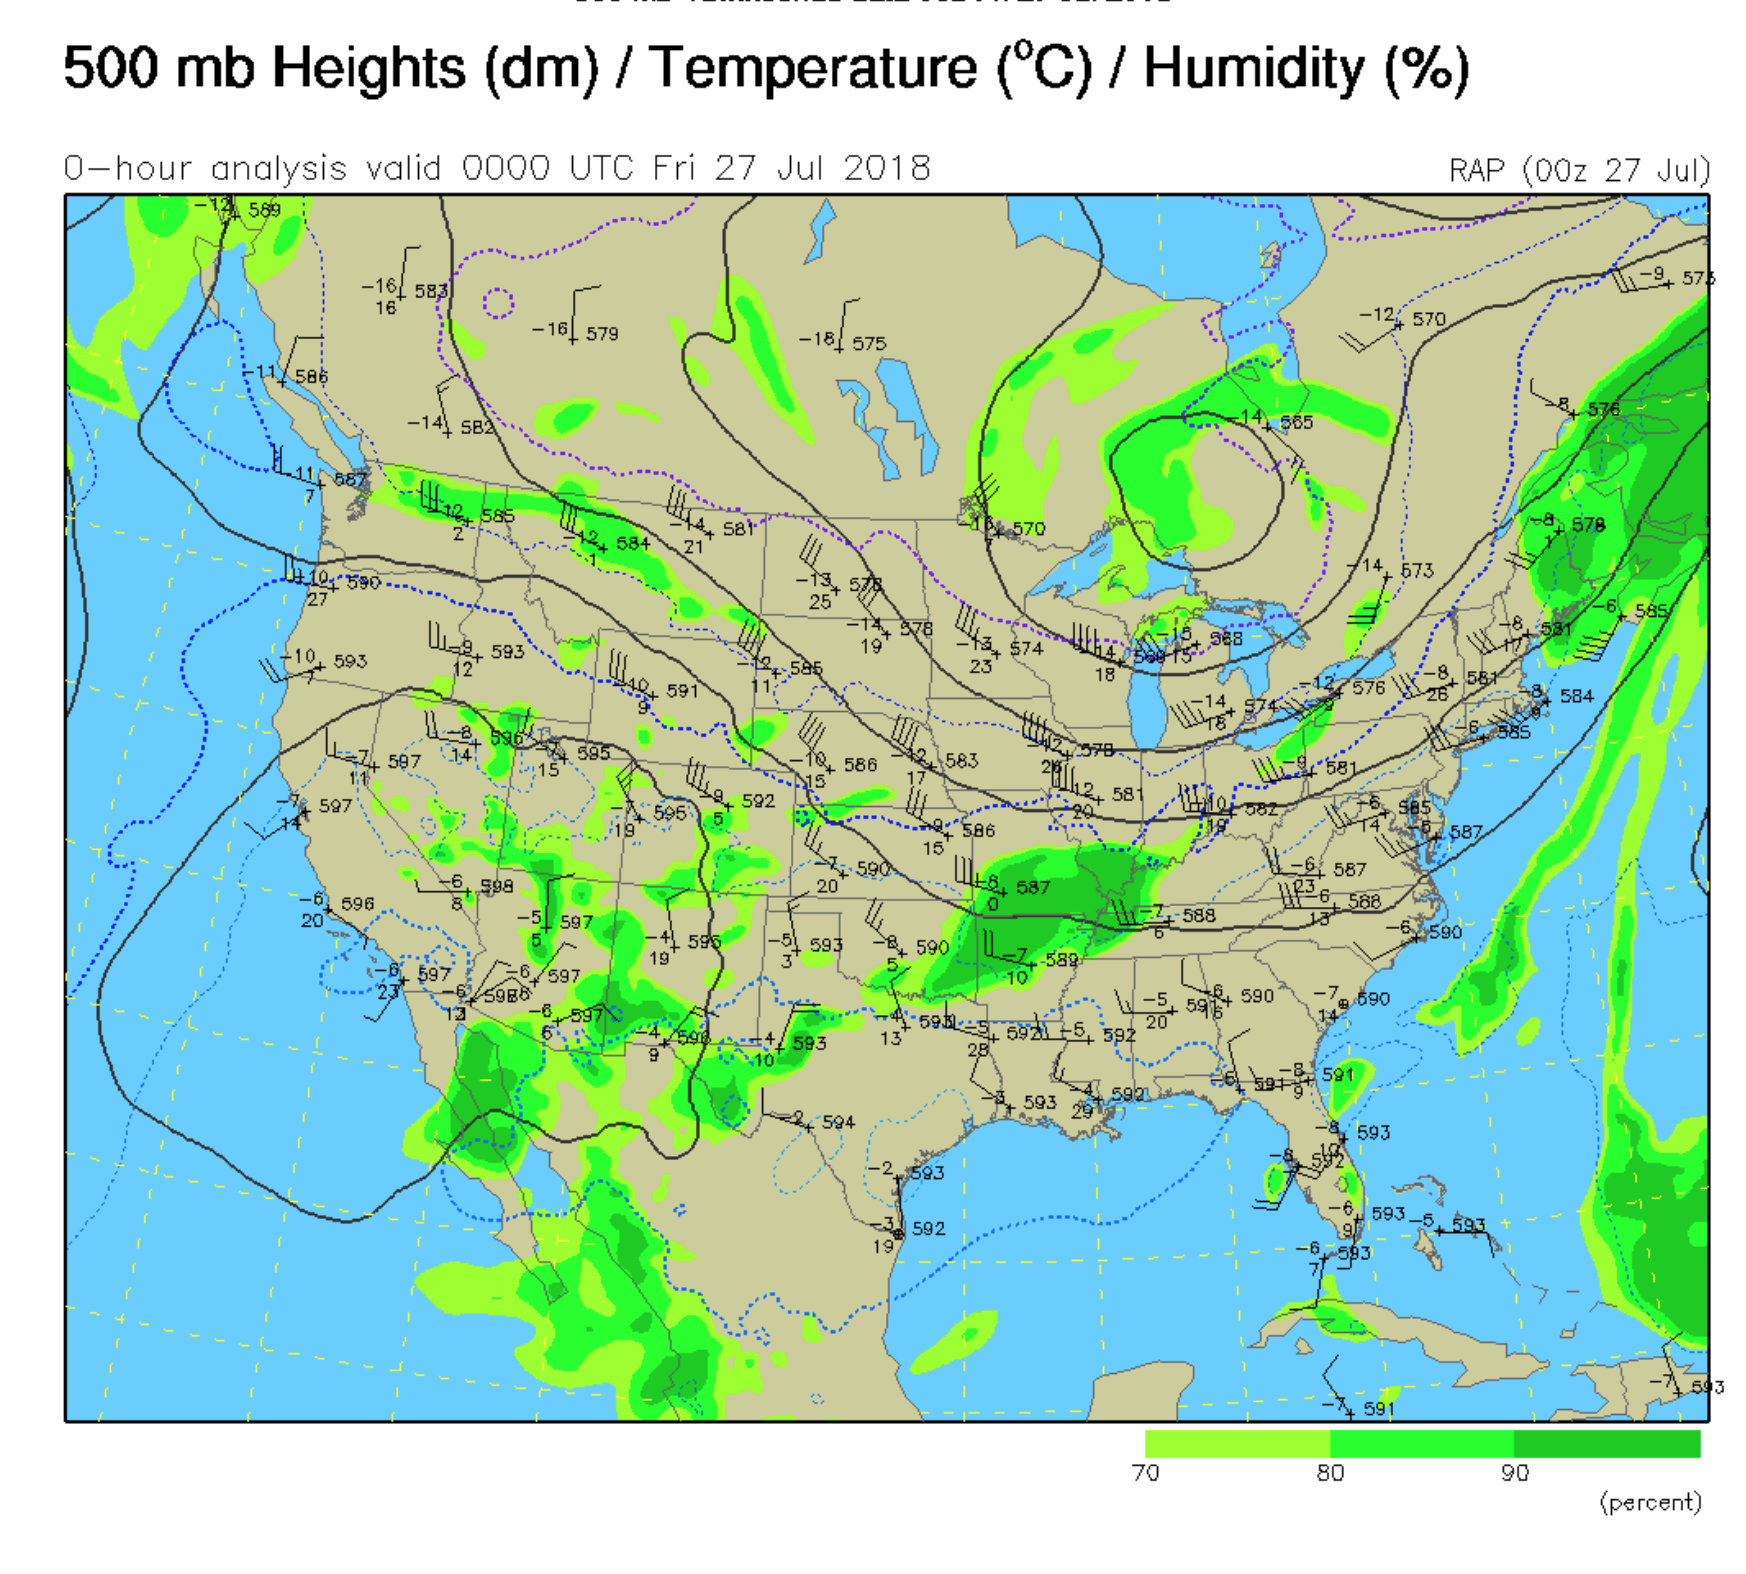
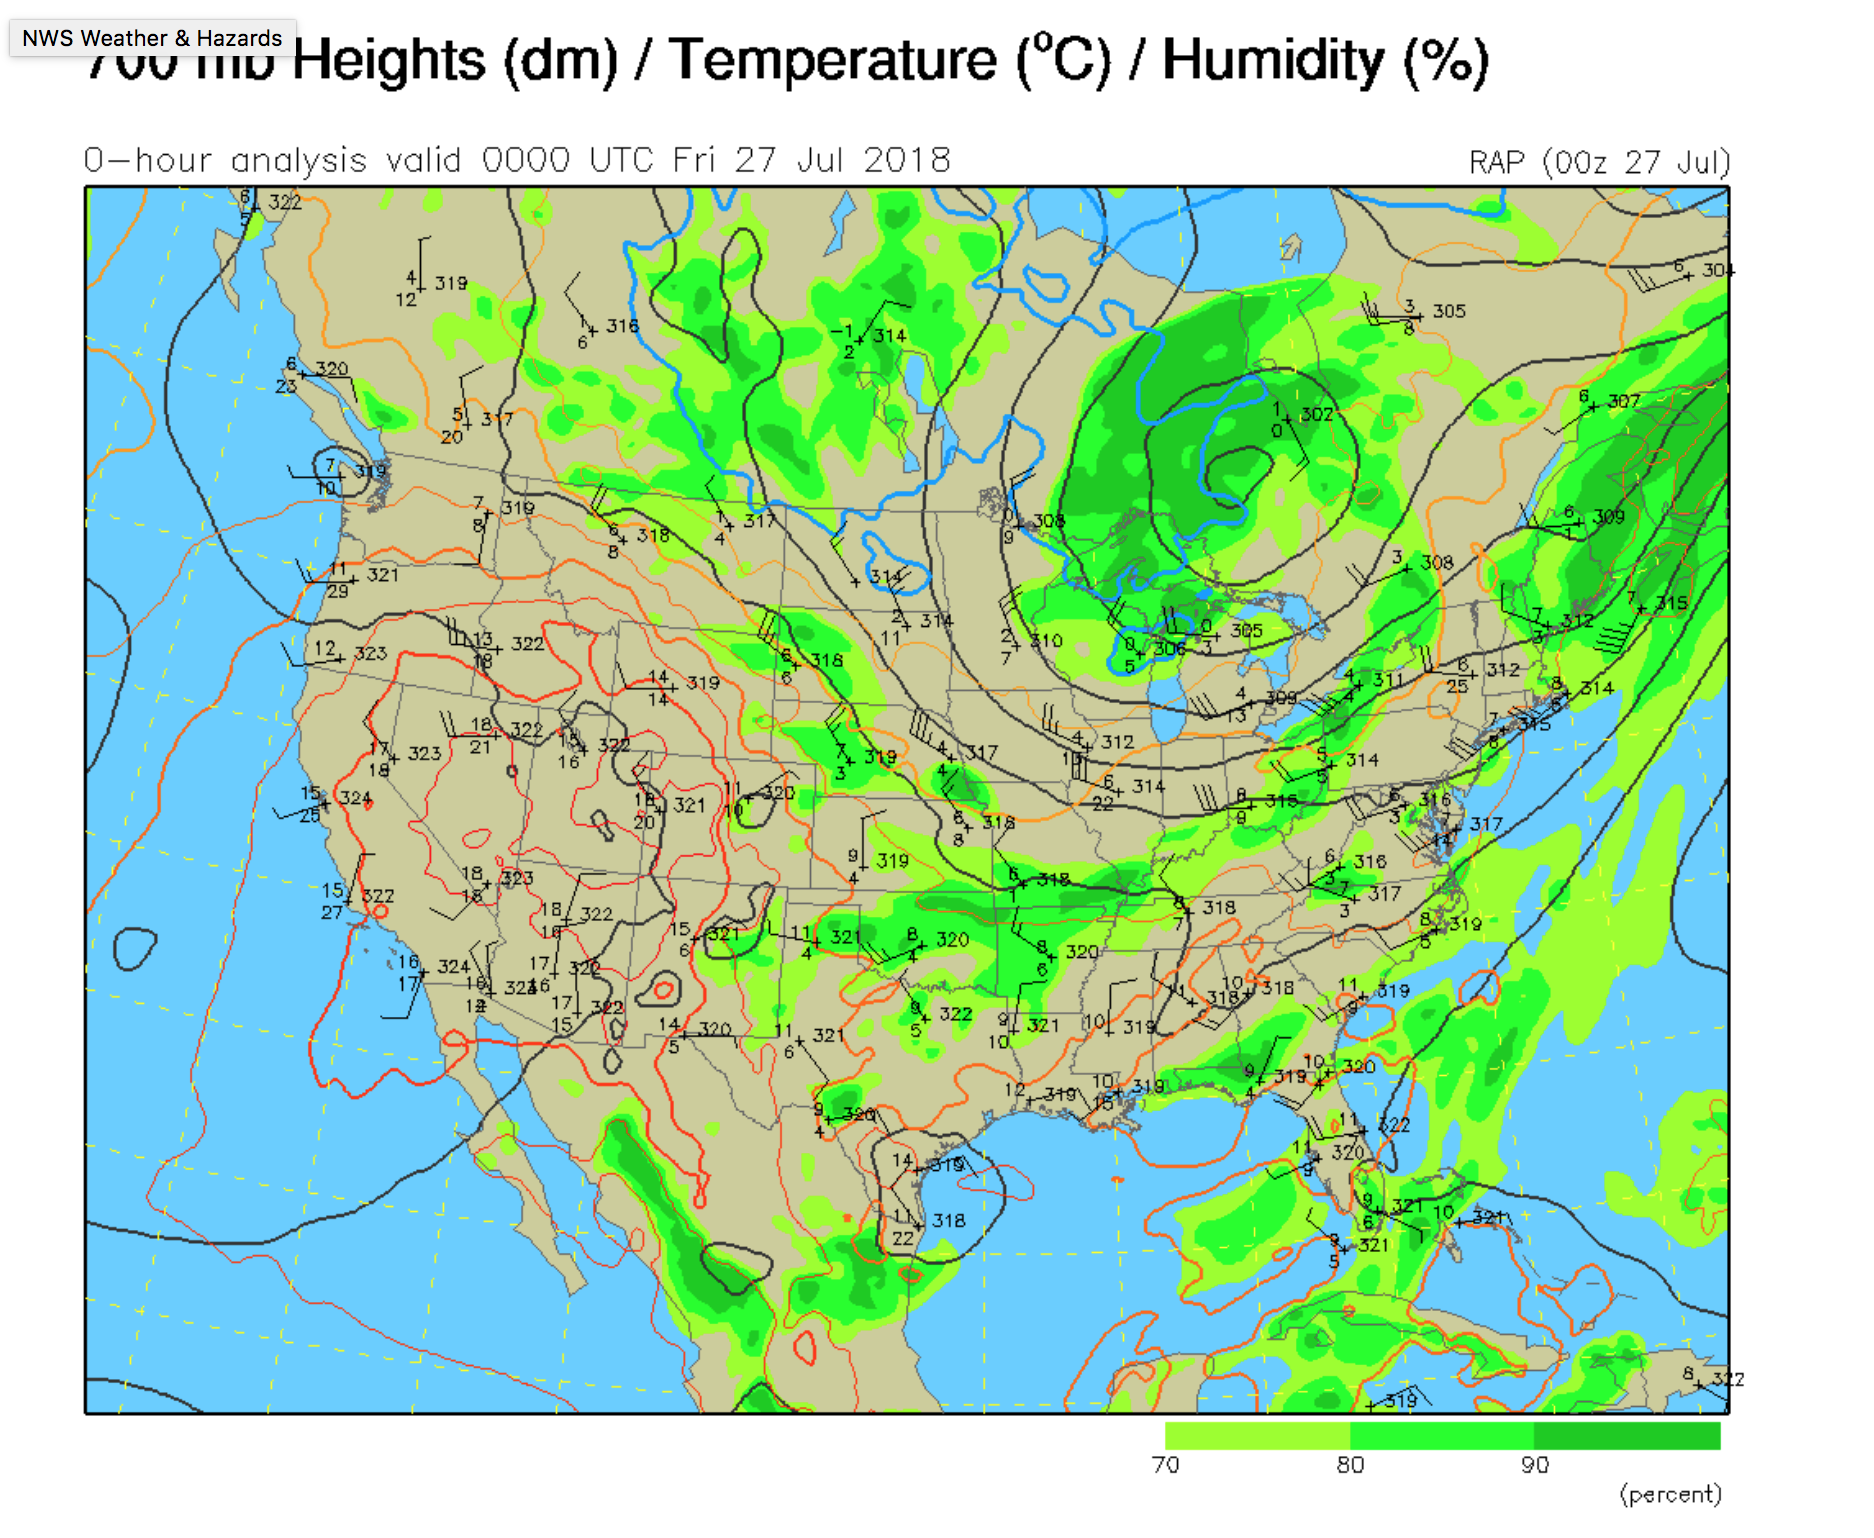
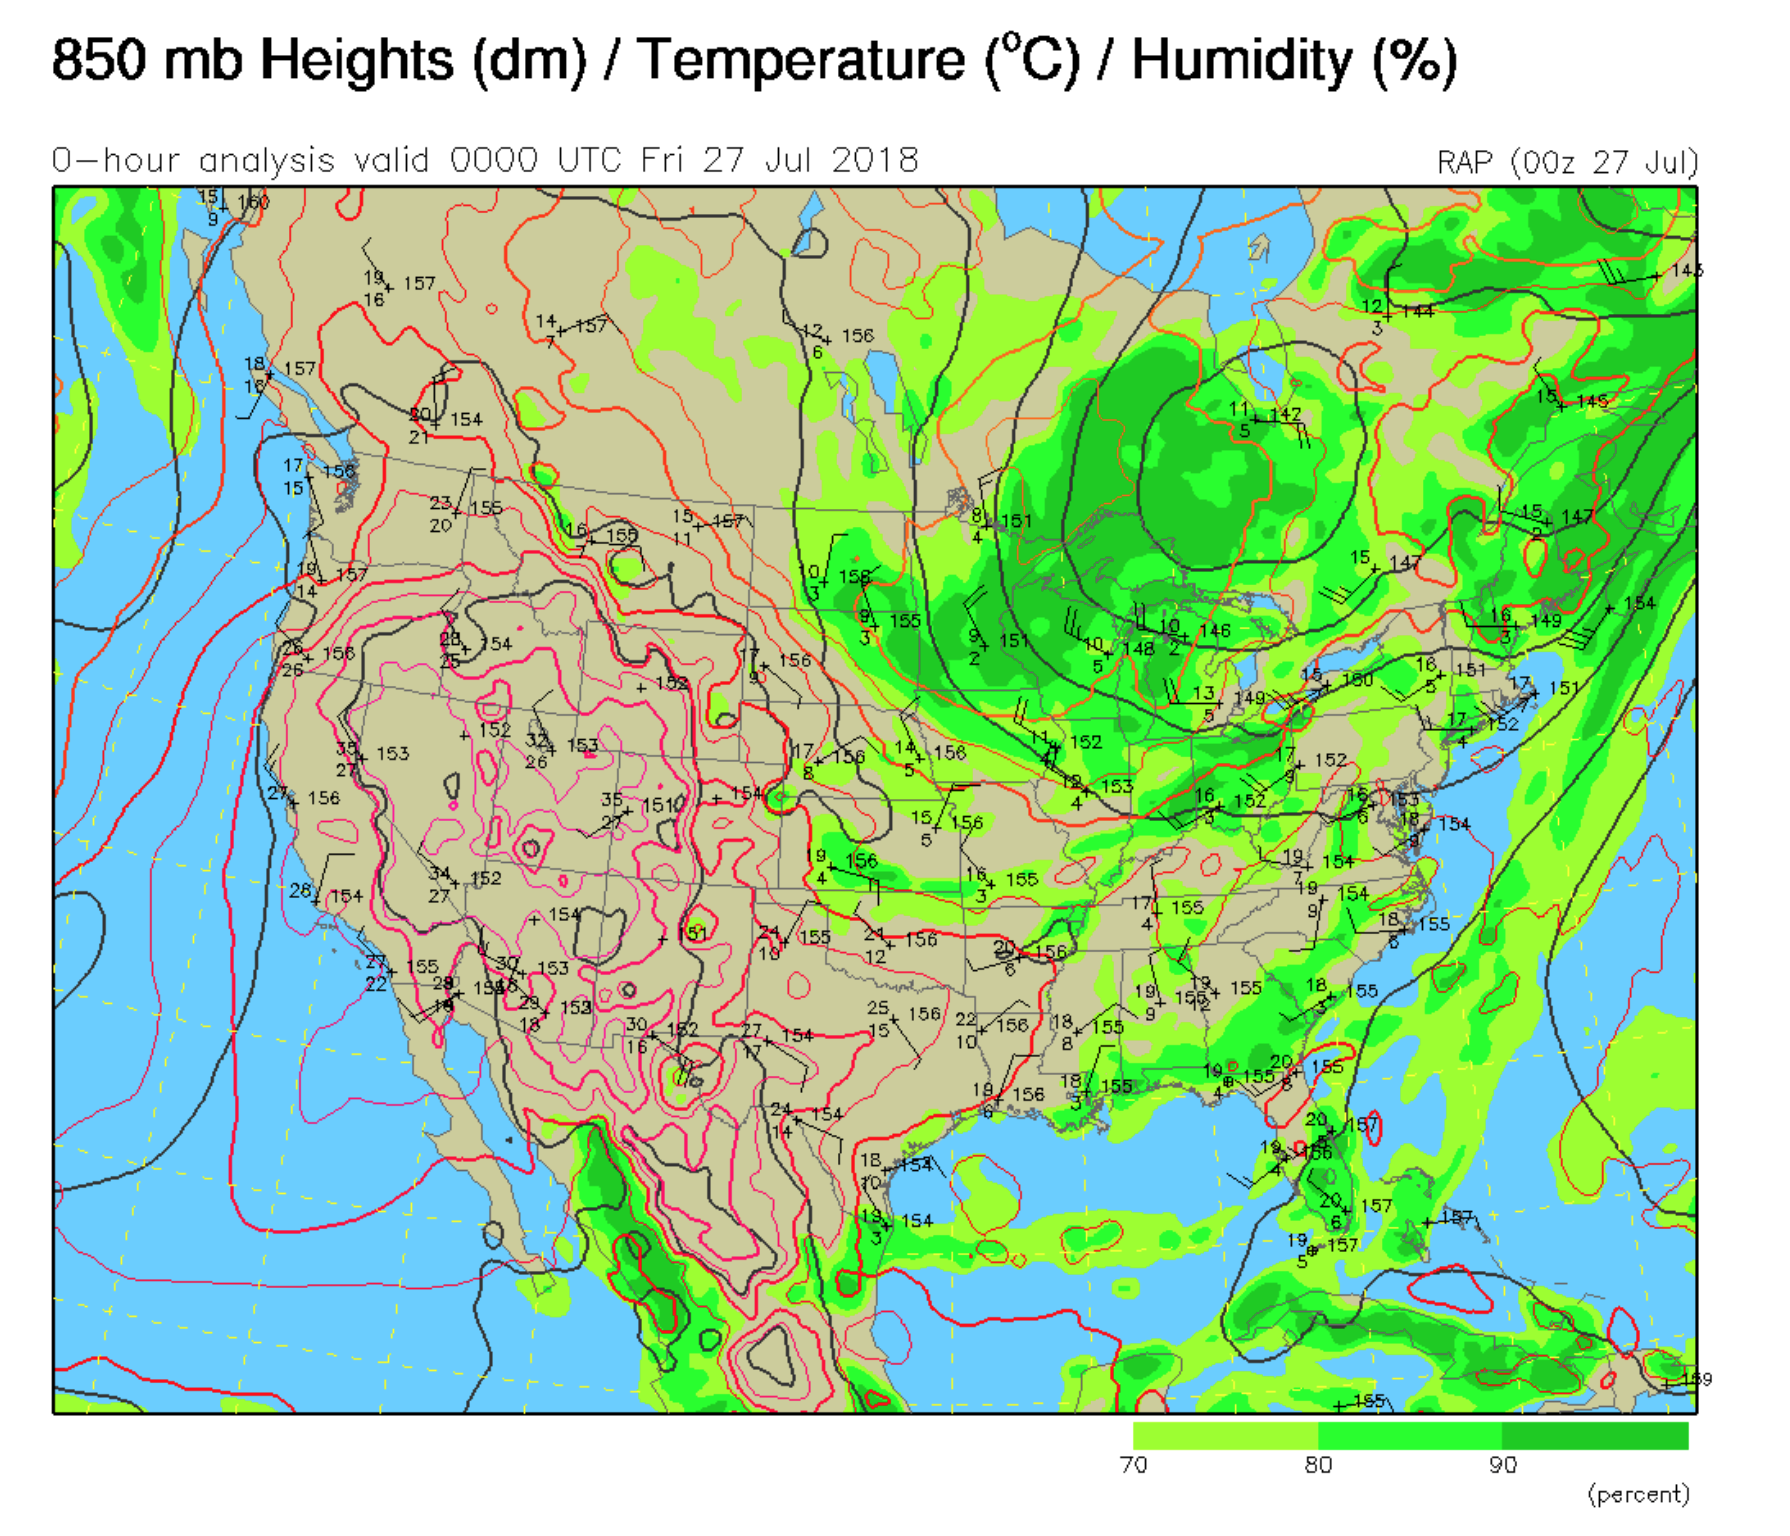

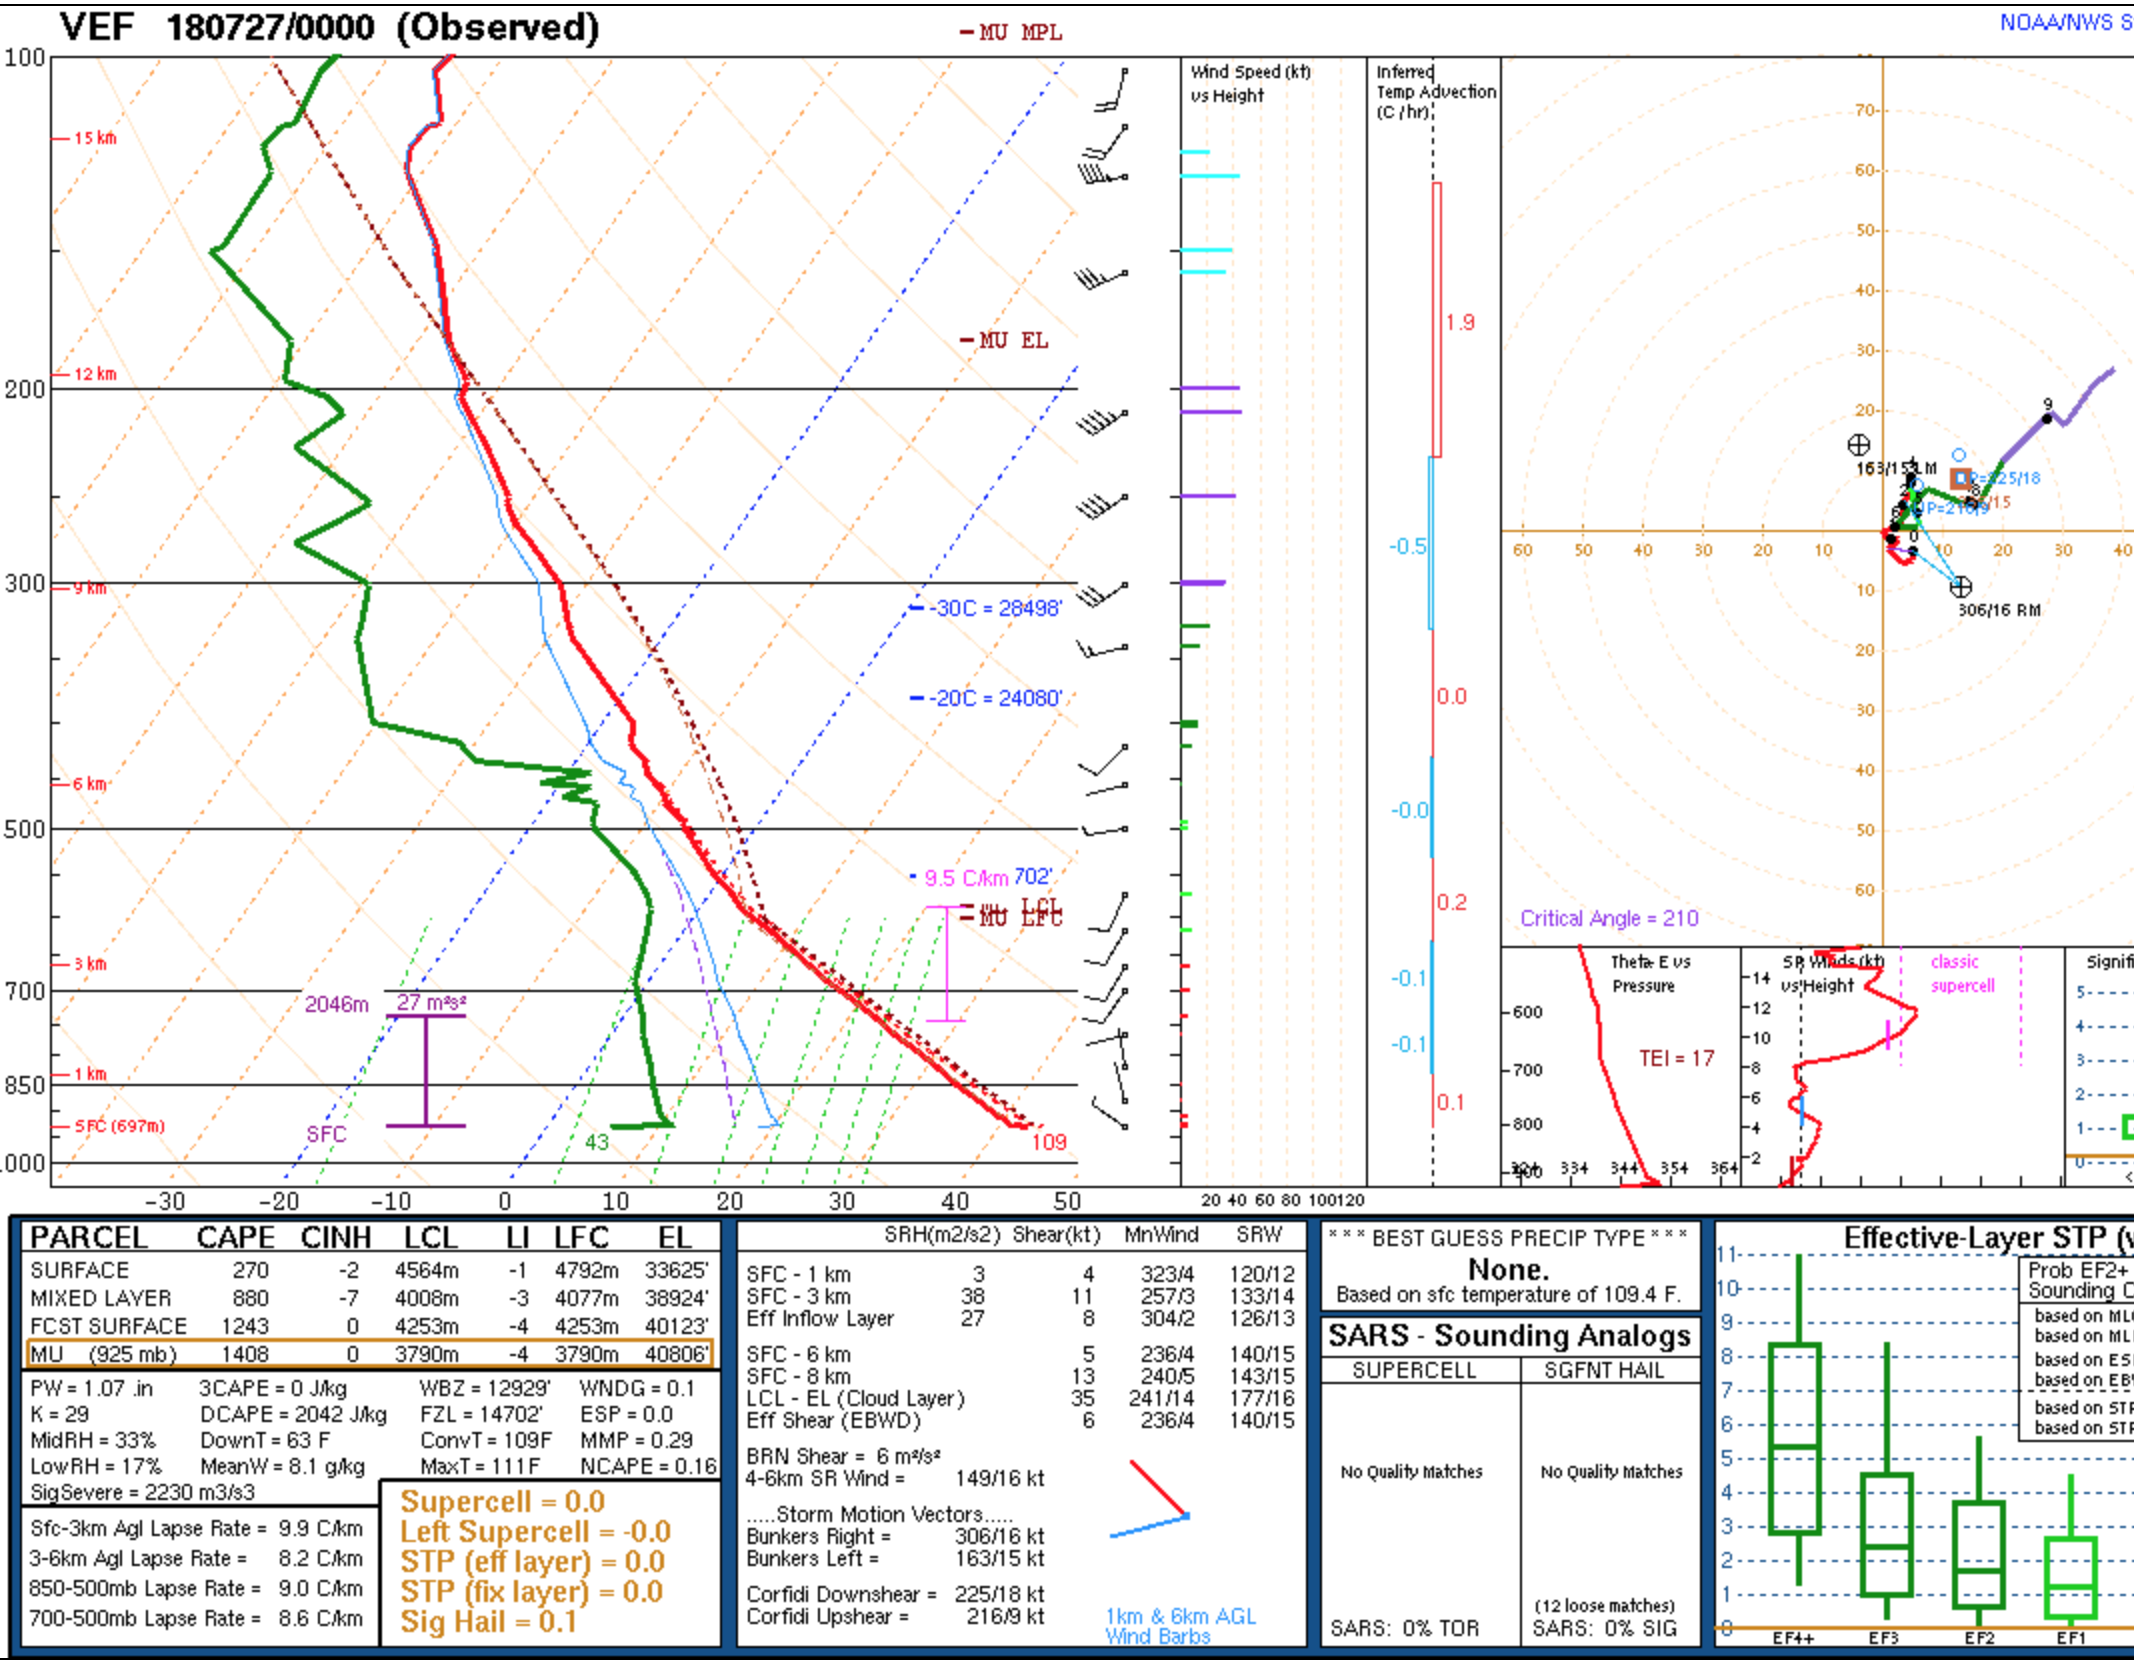

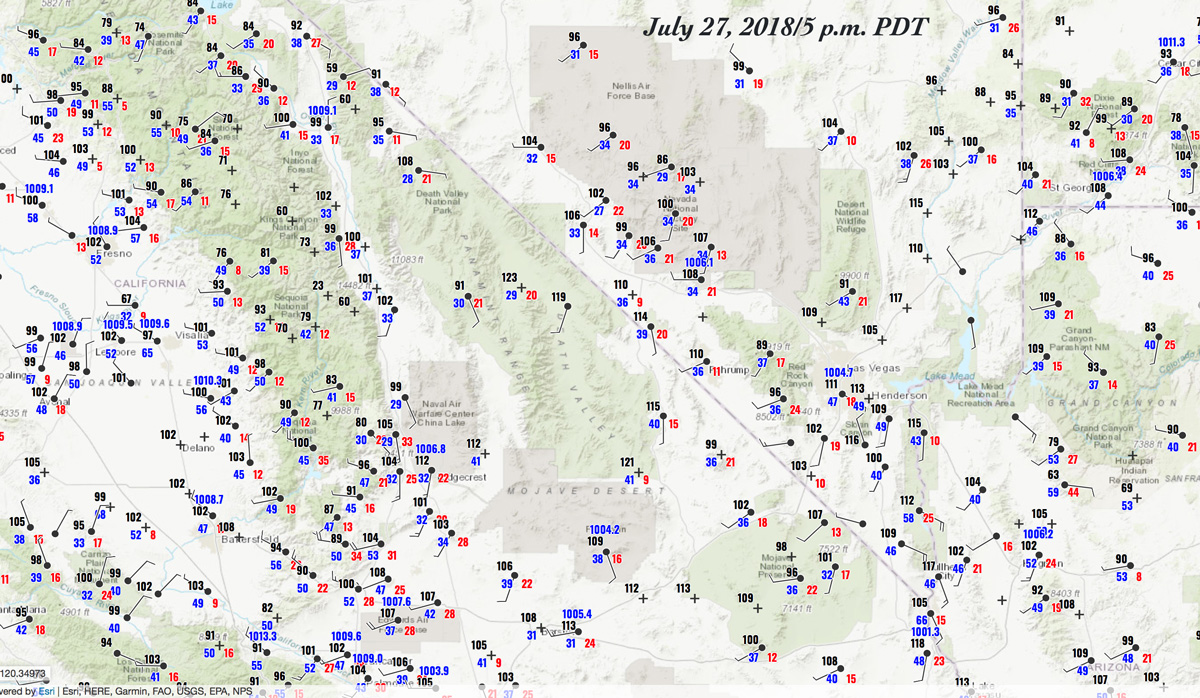
July 27
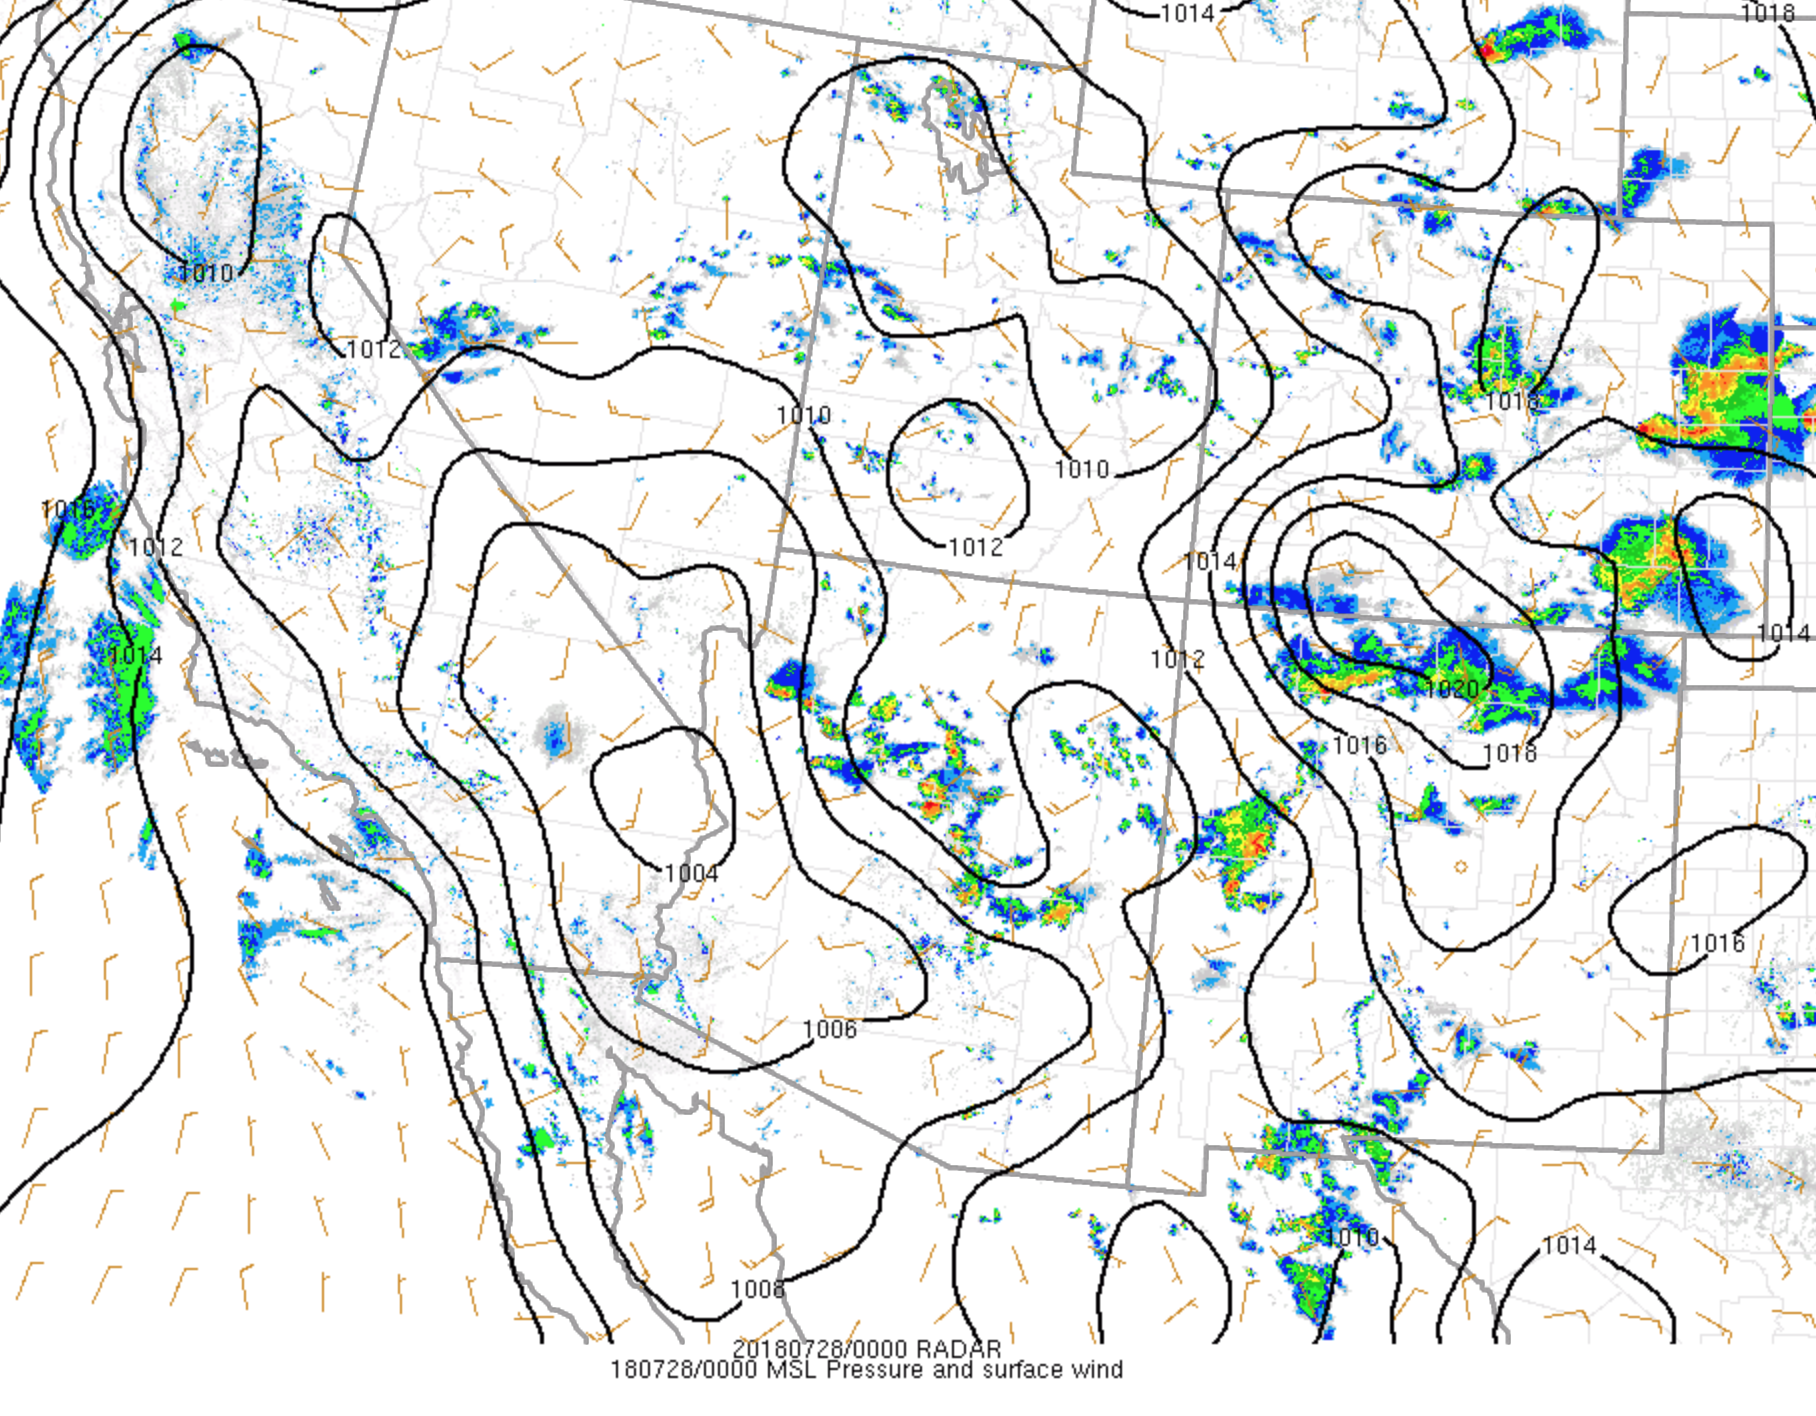
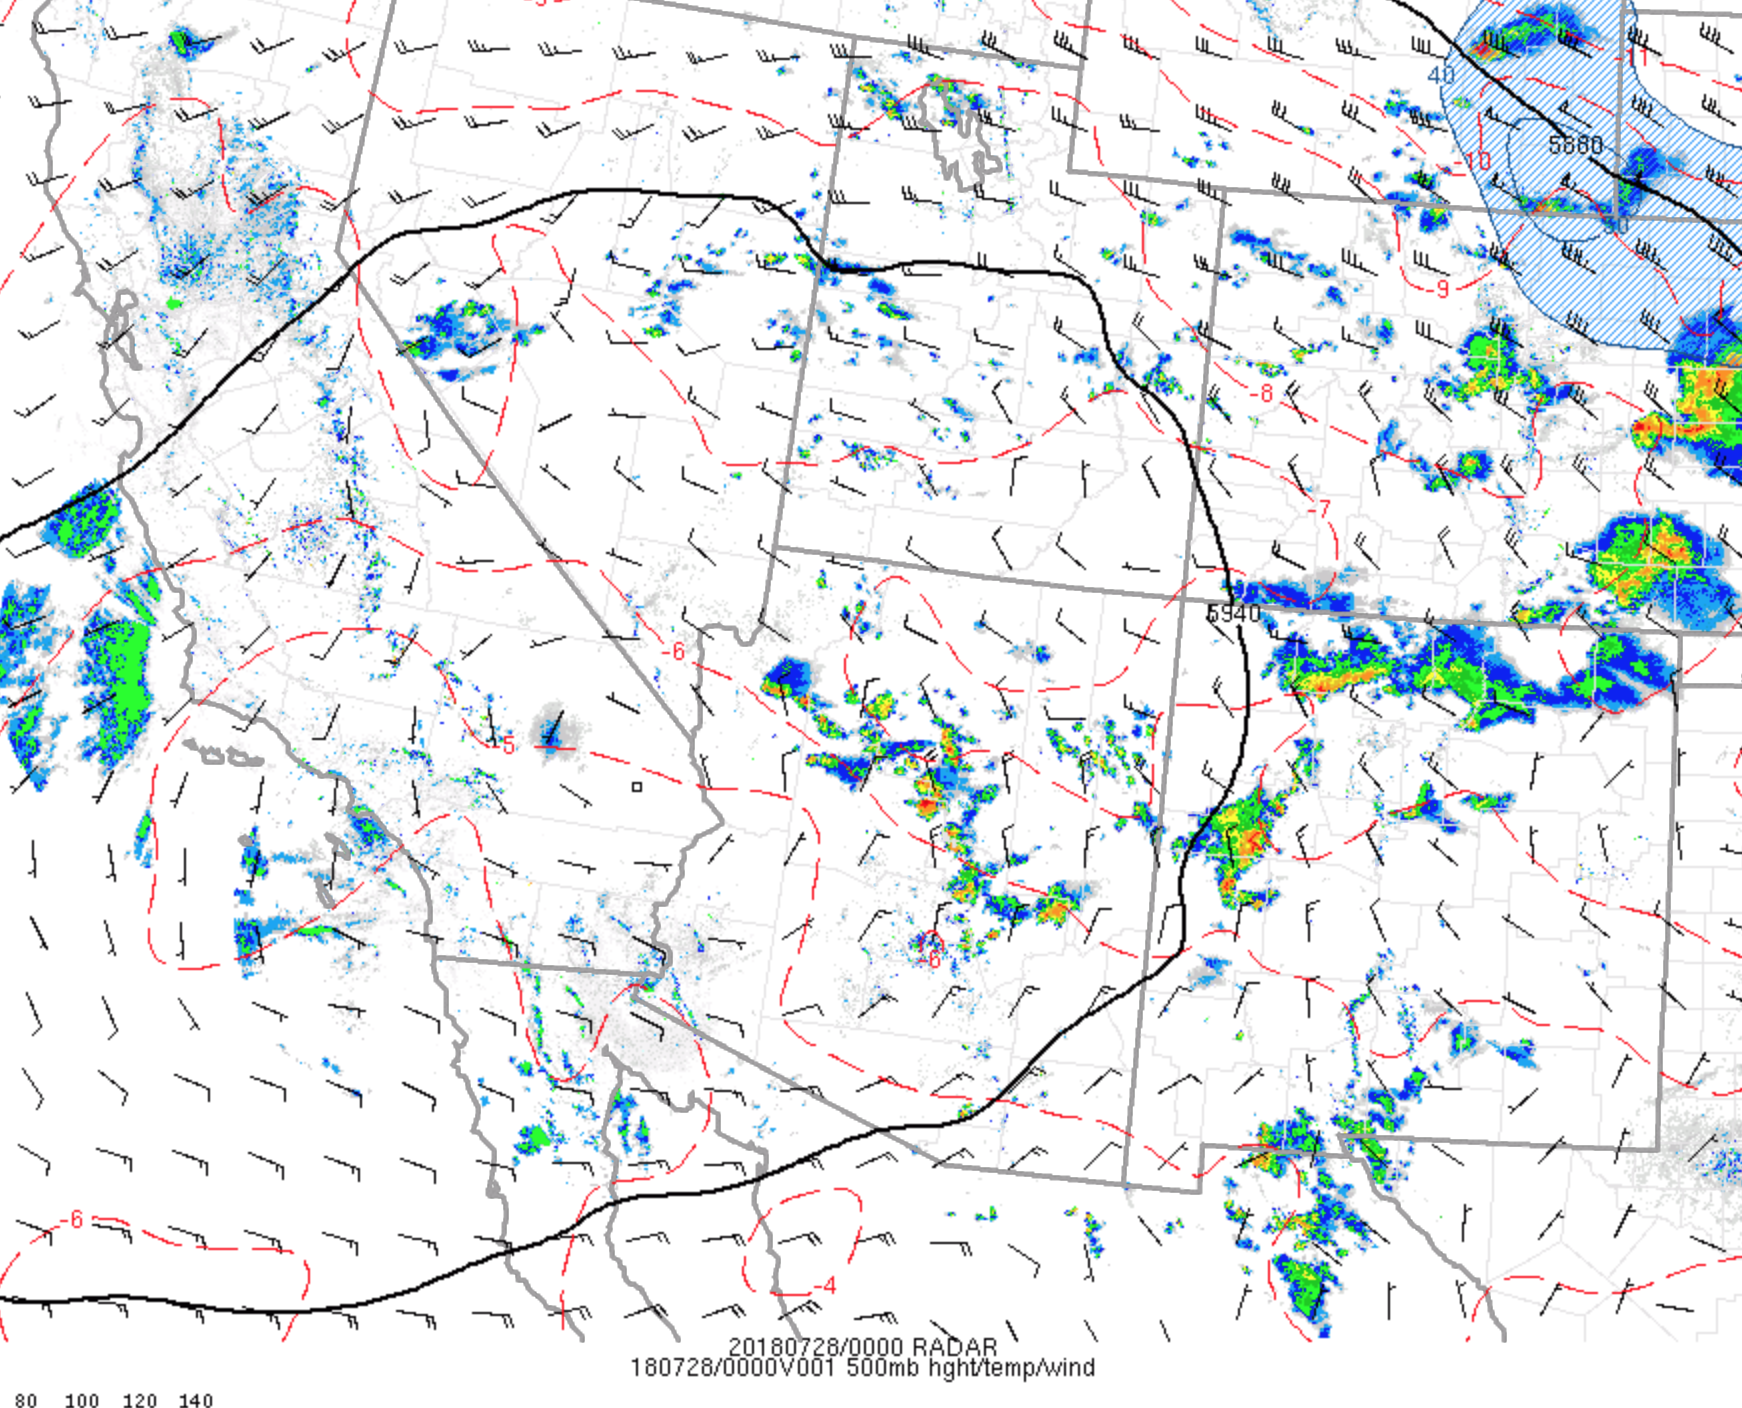


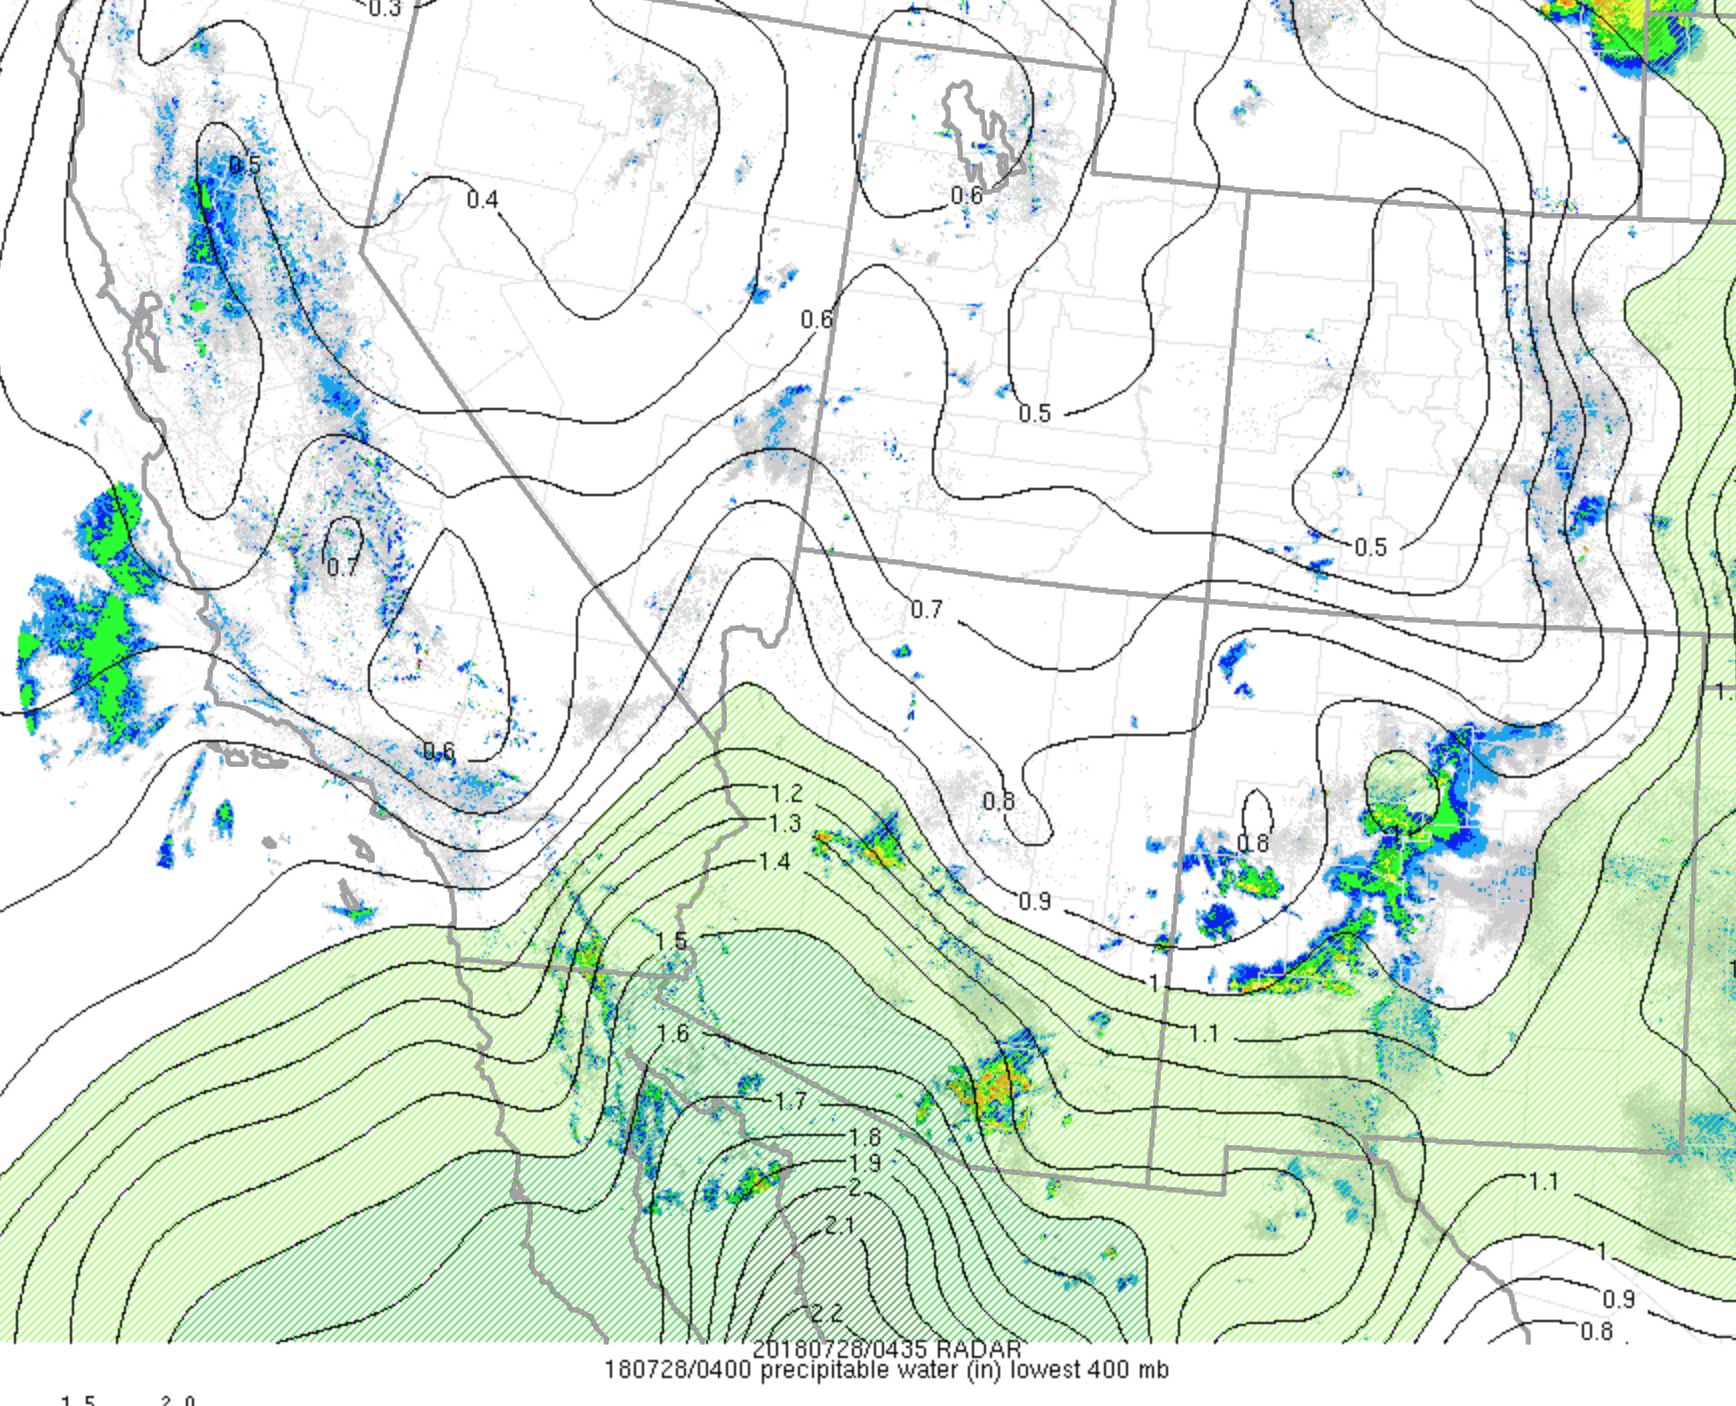
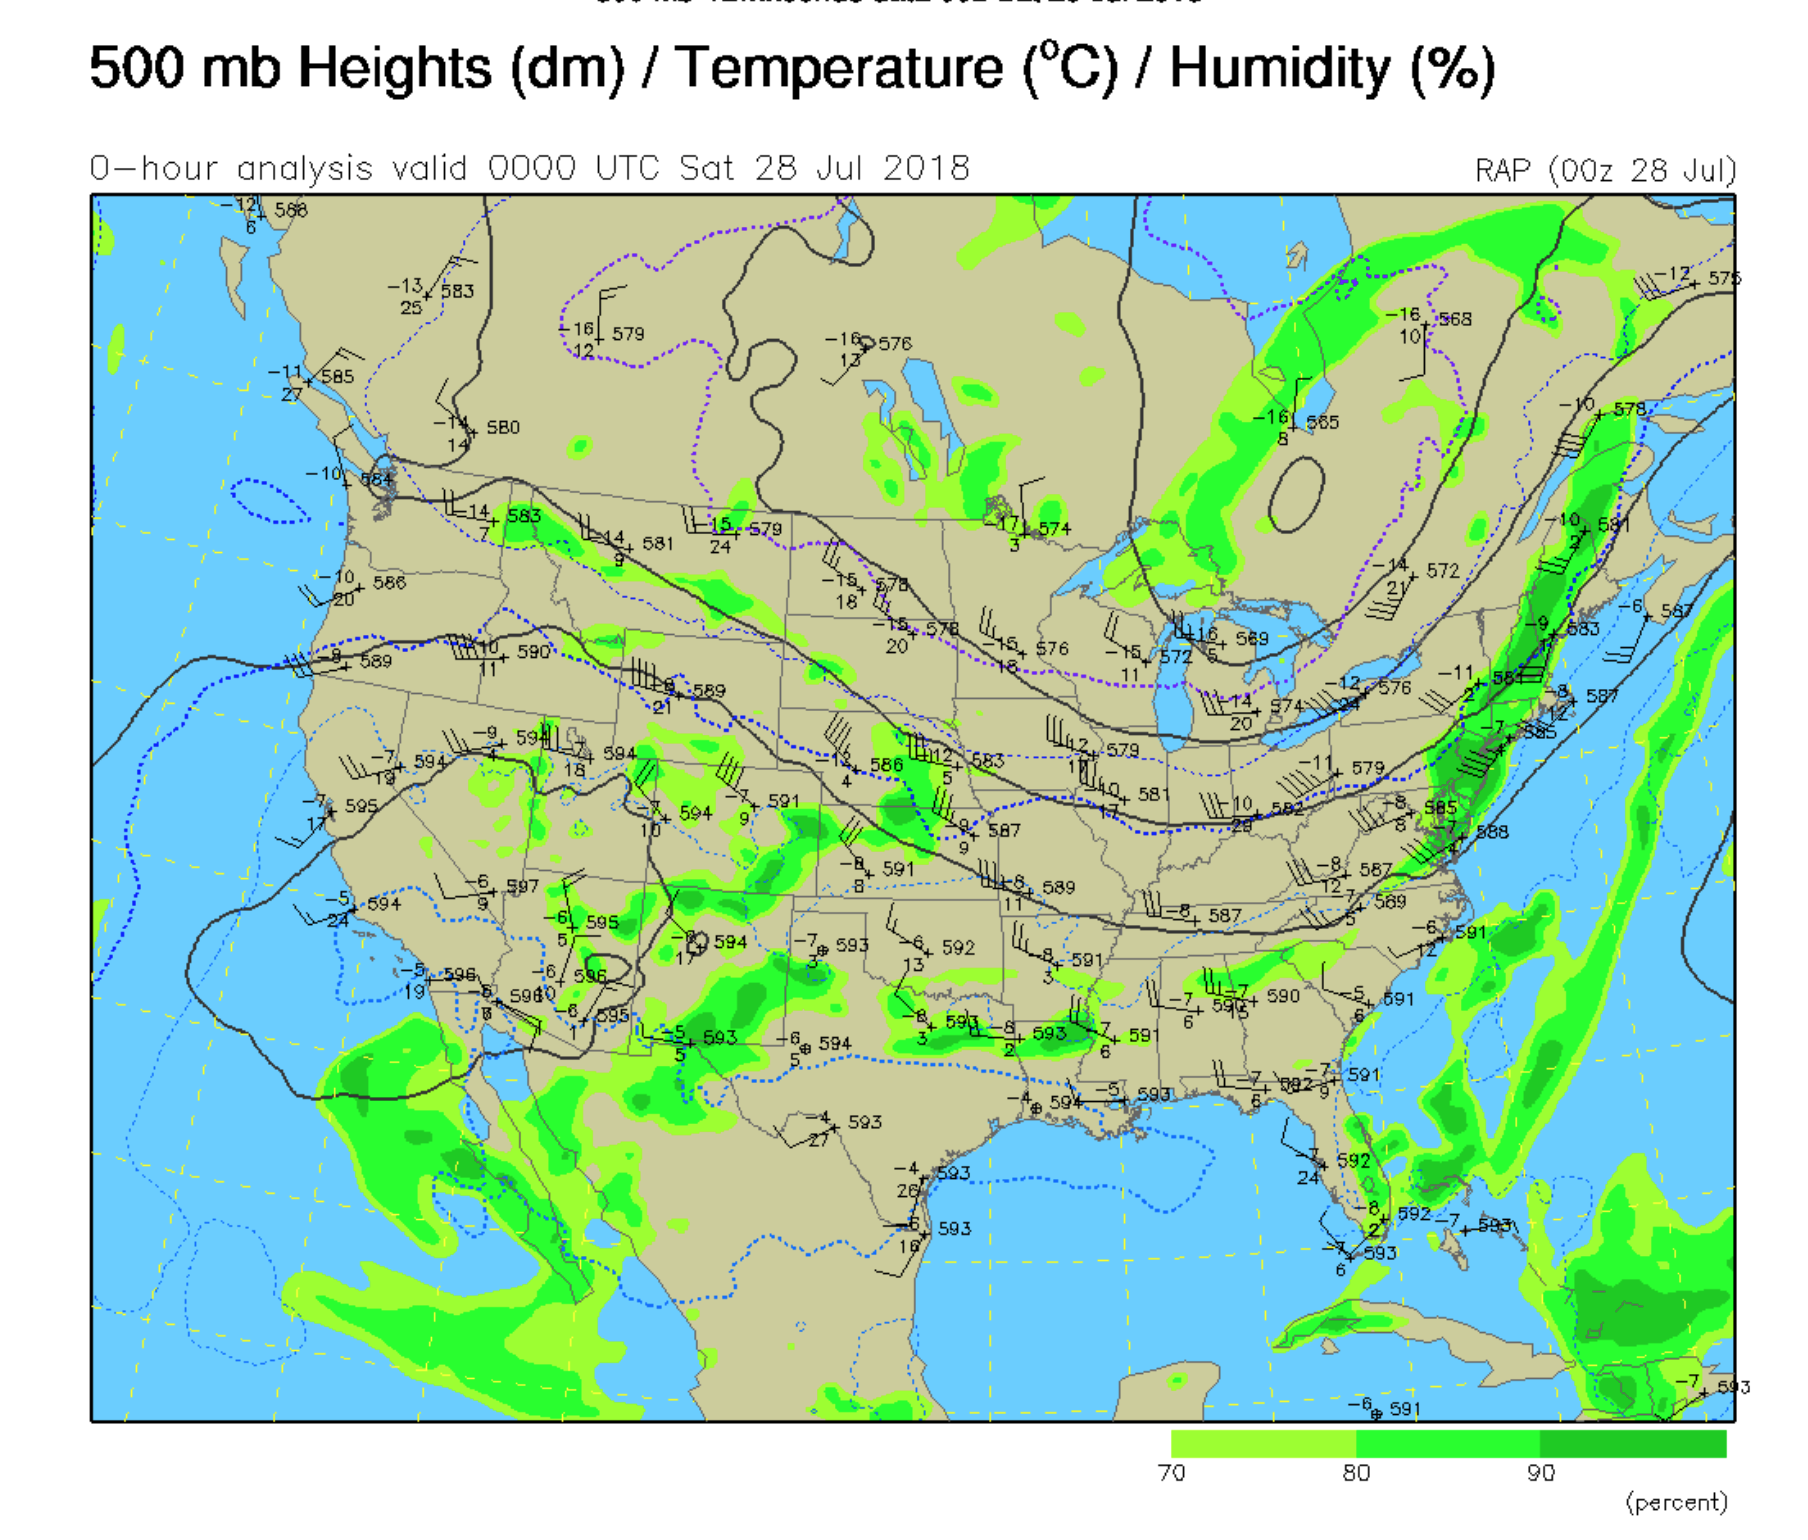

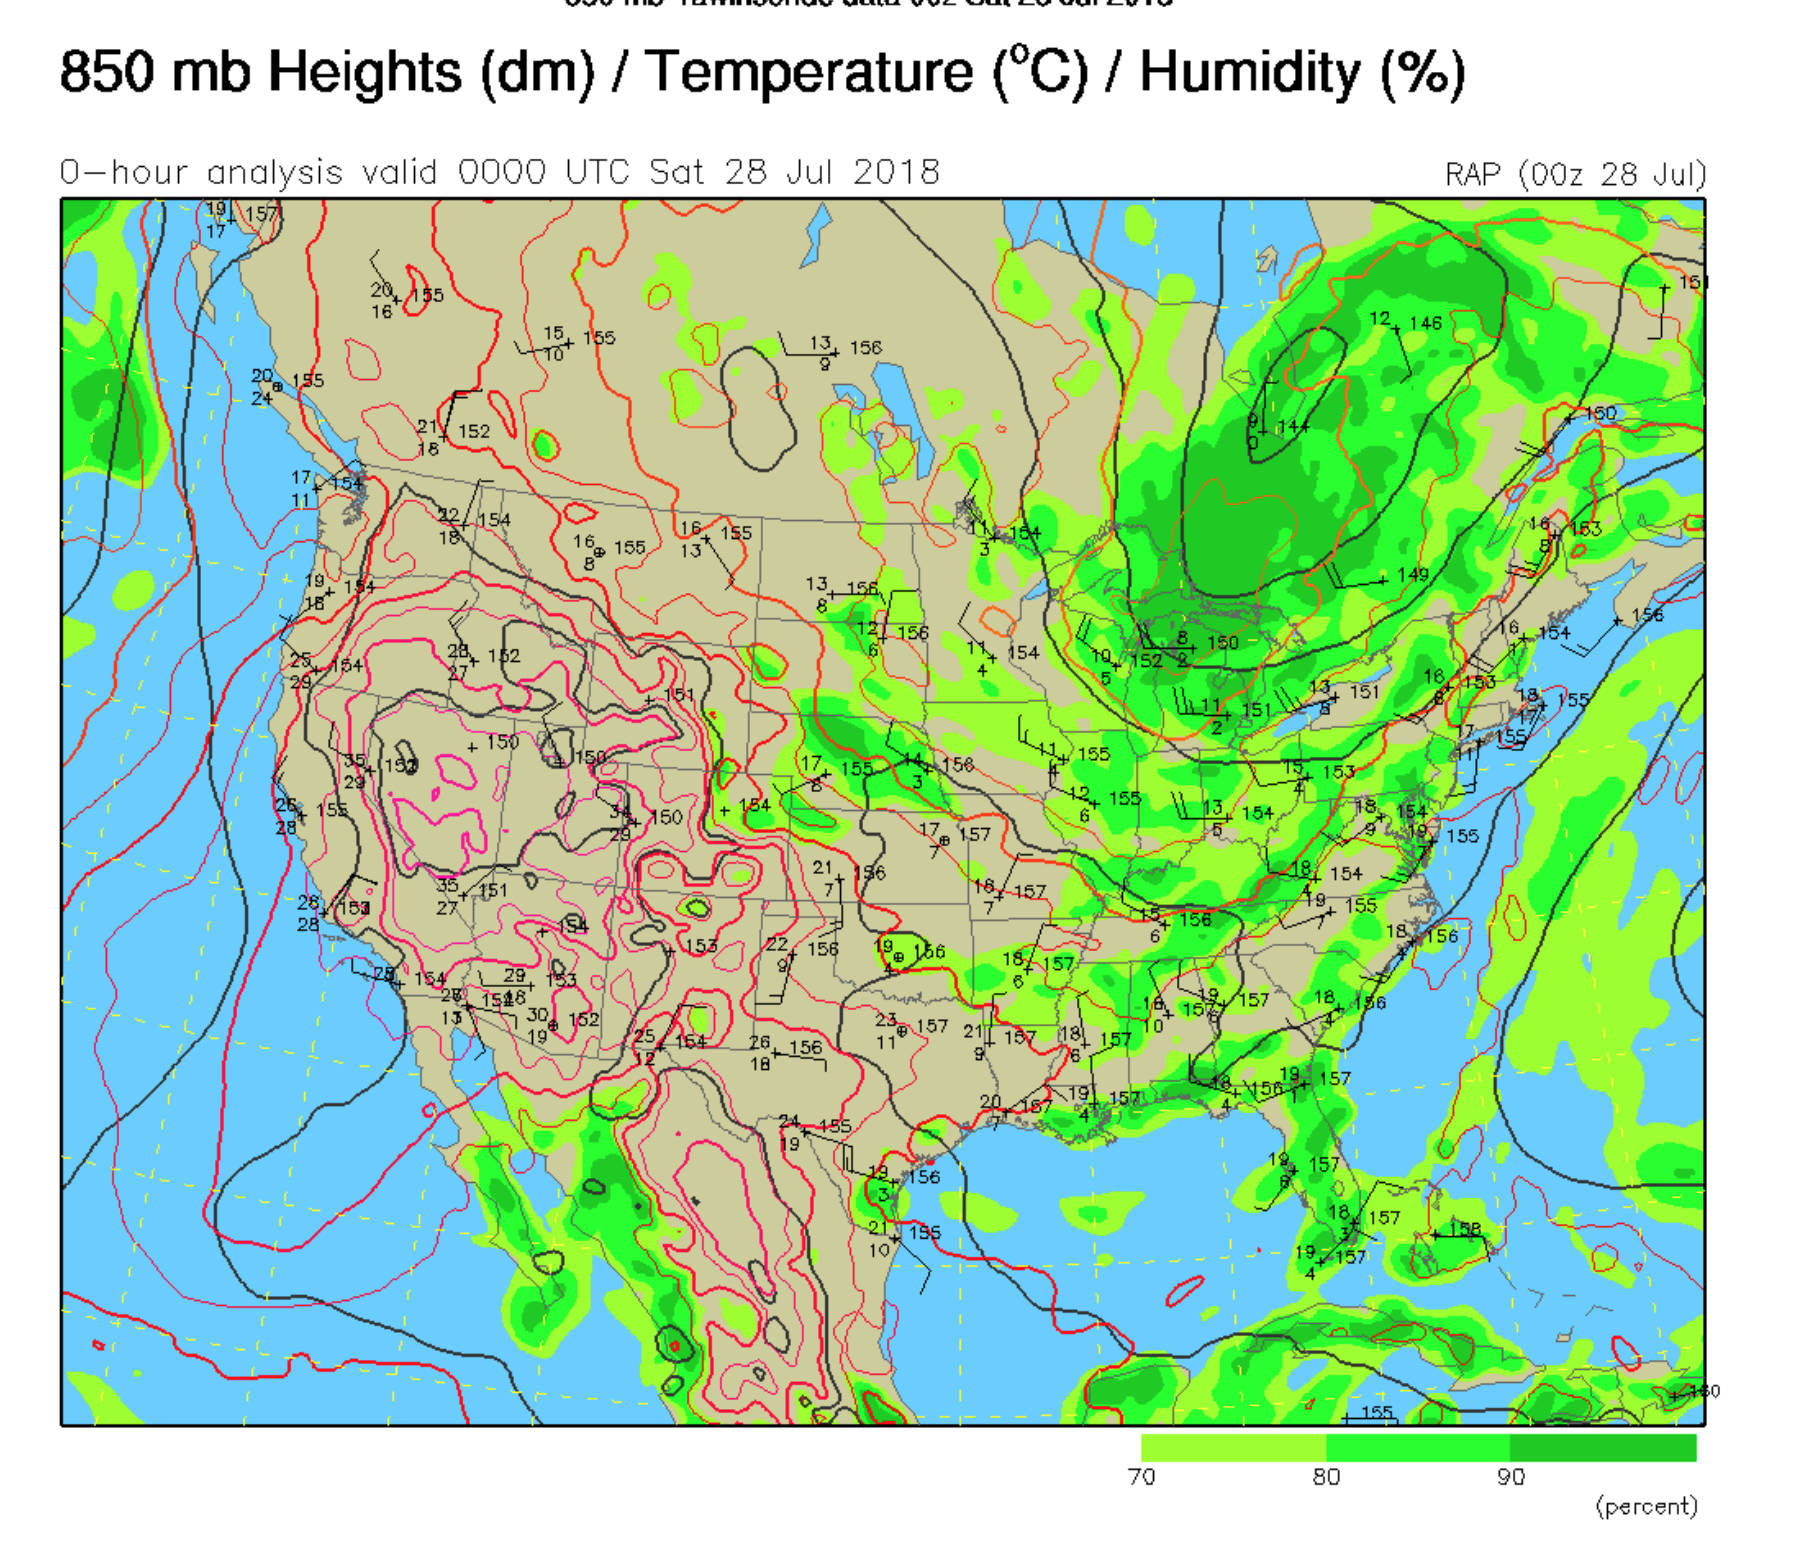
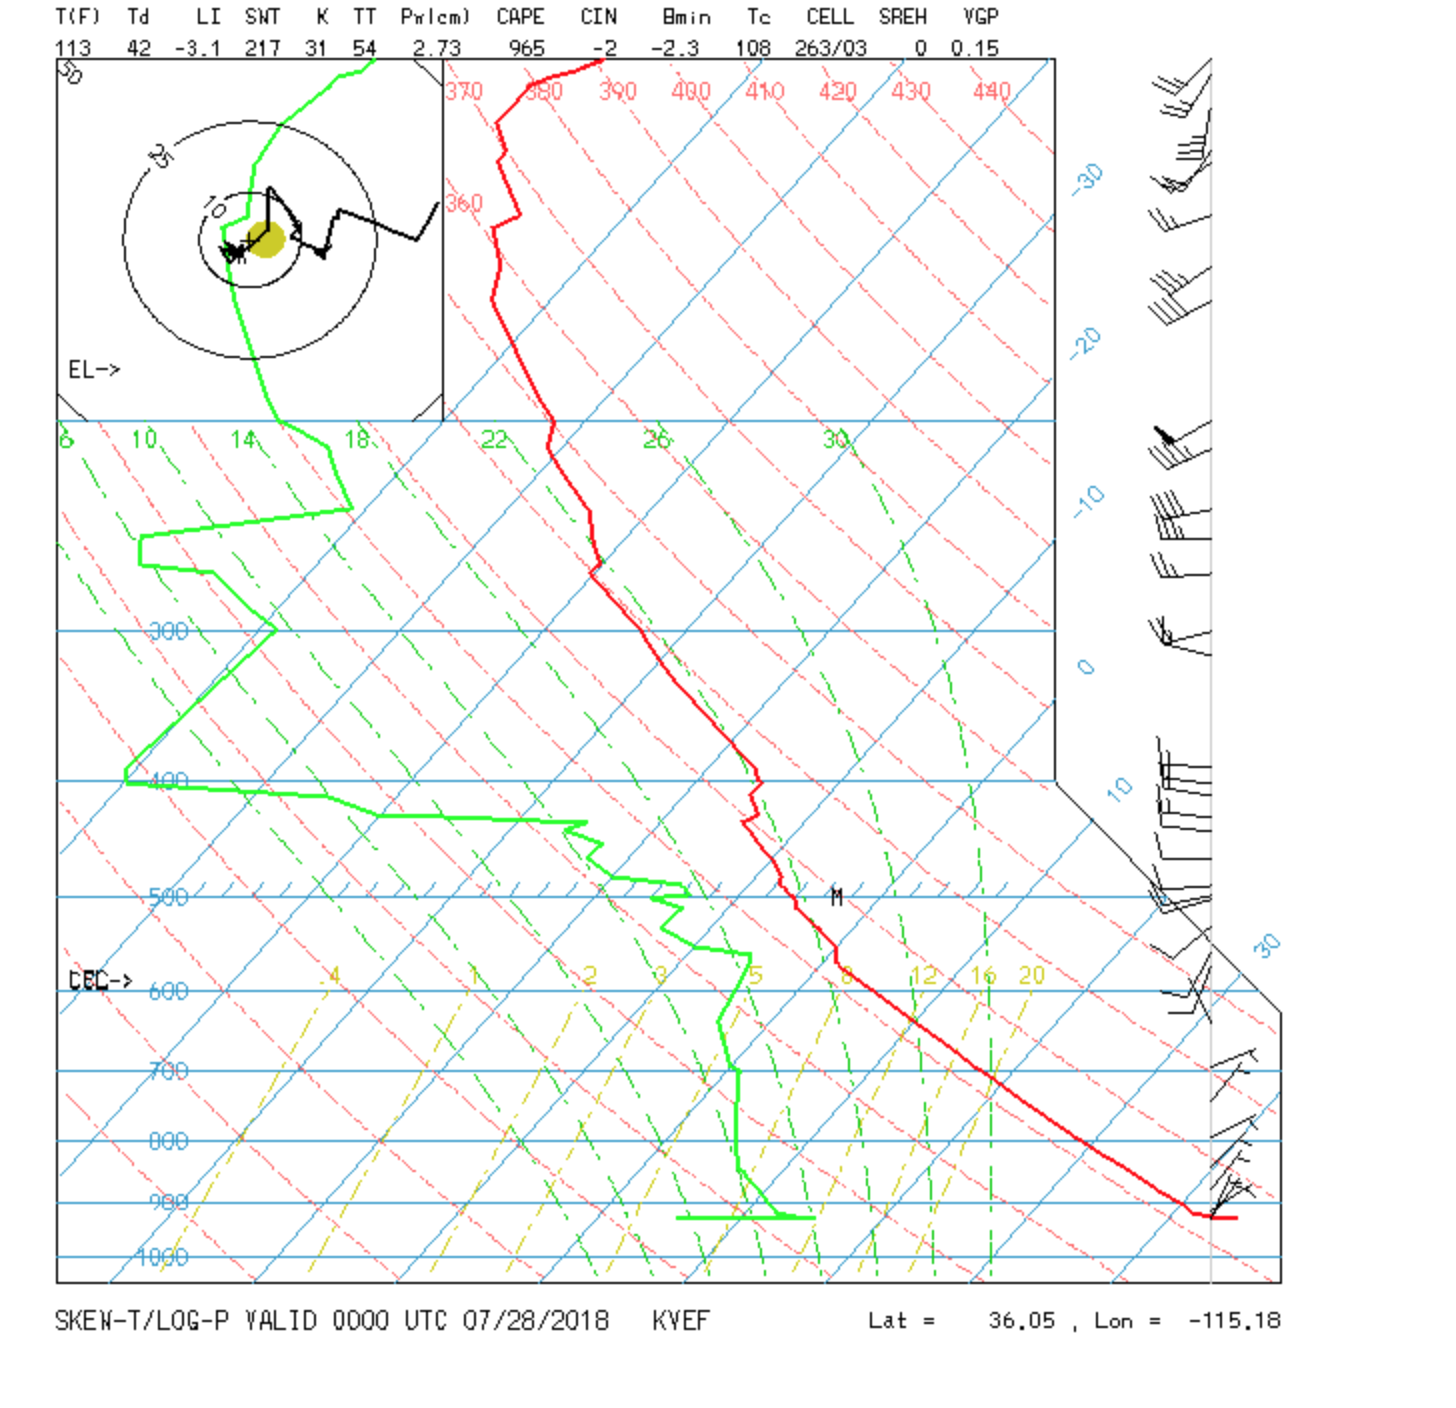
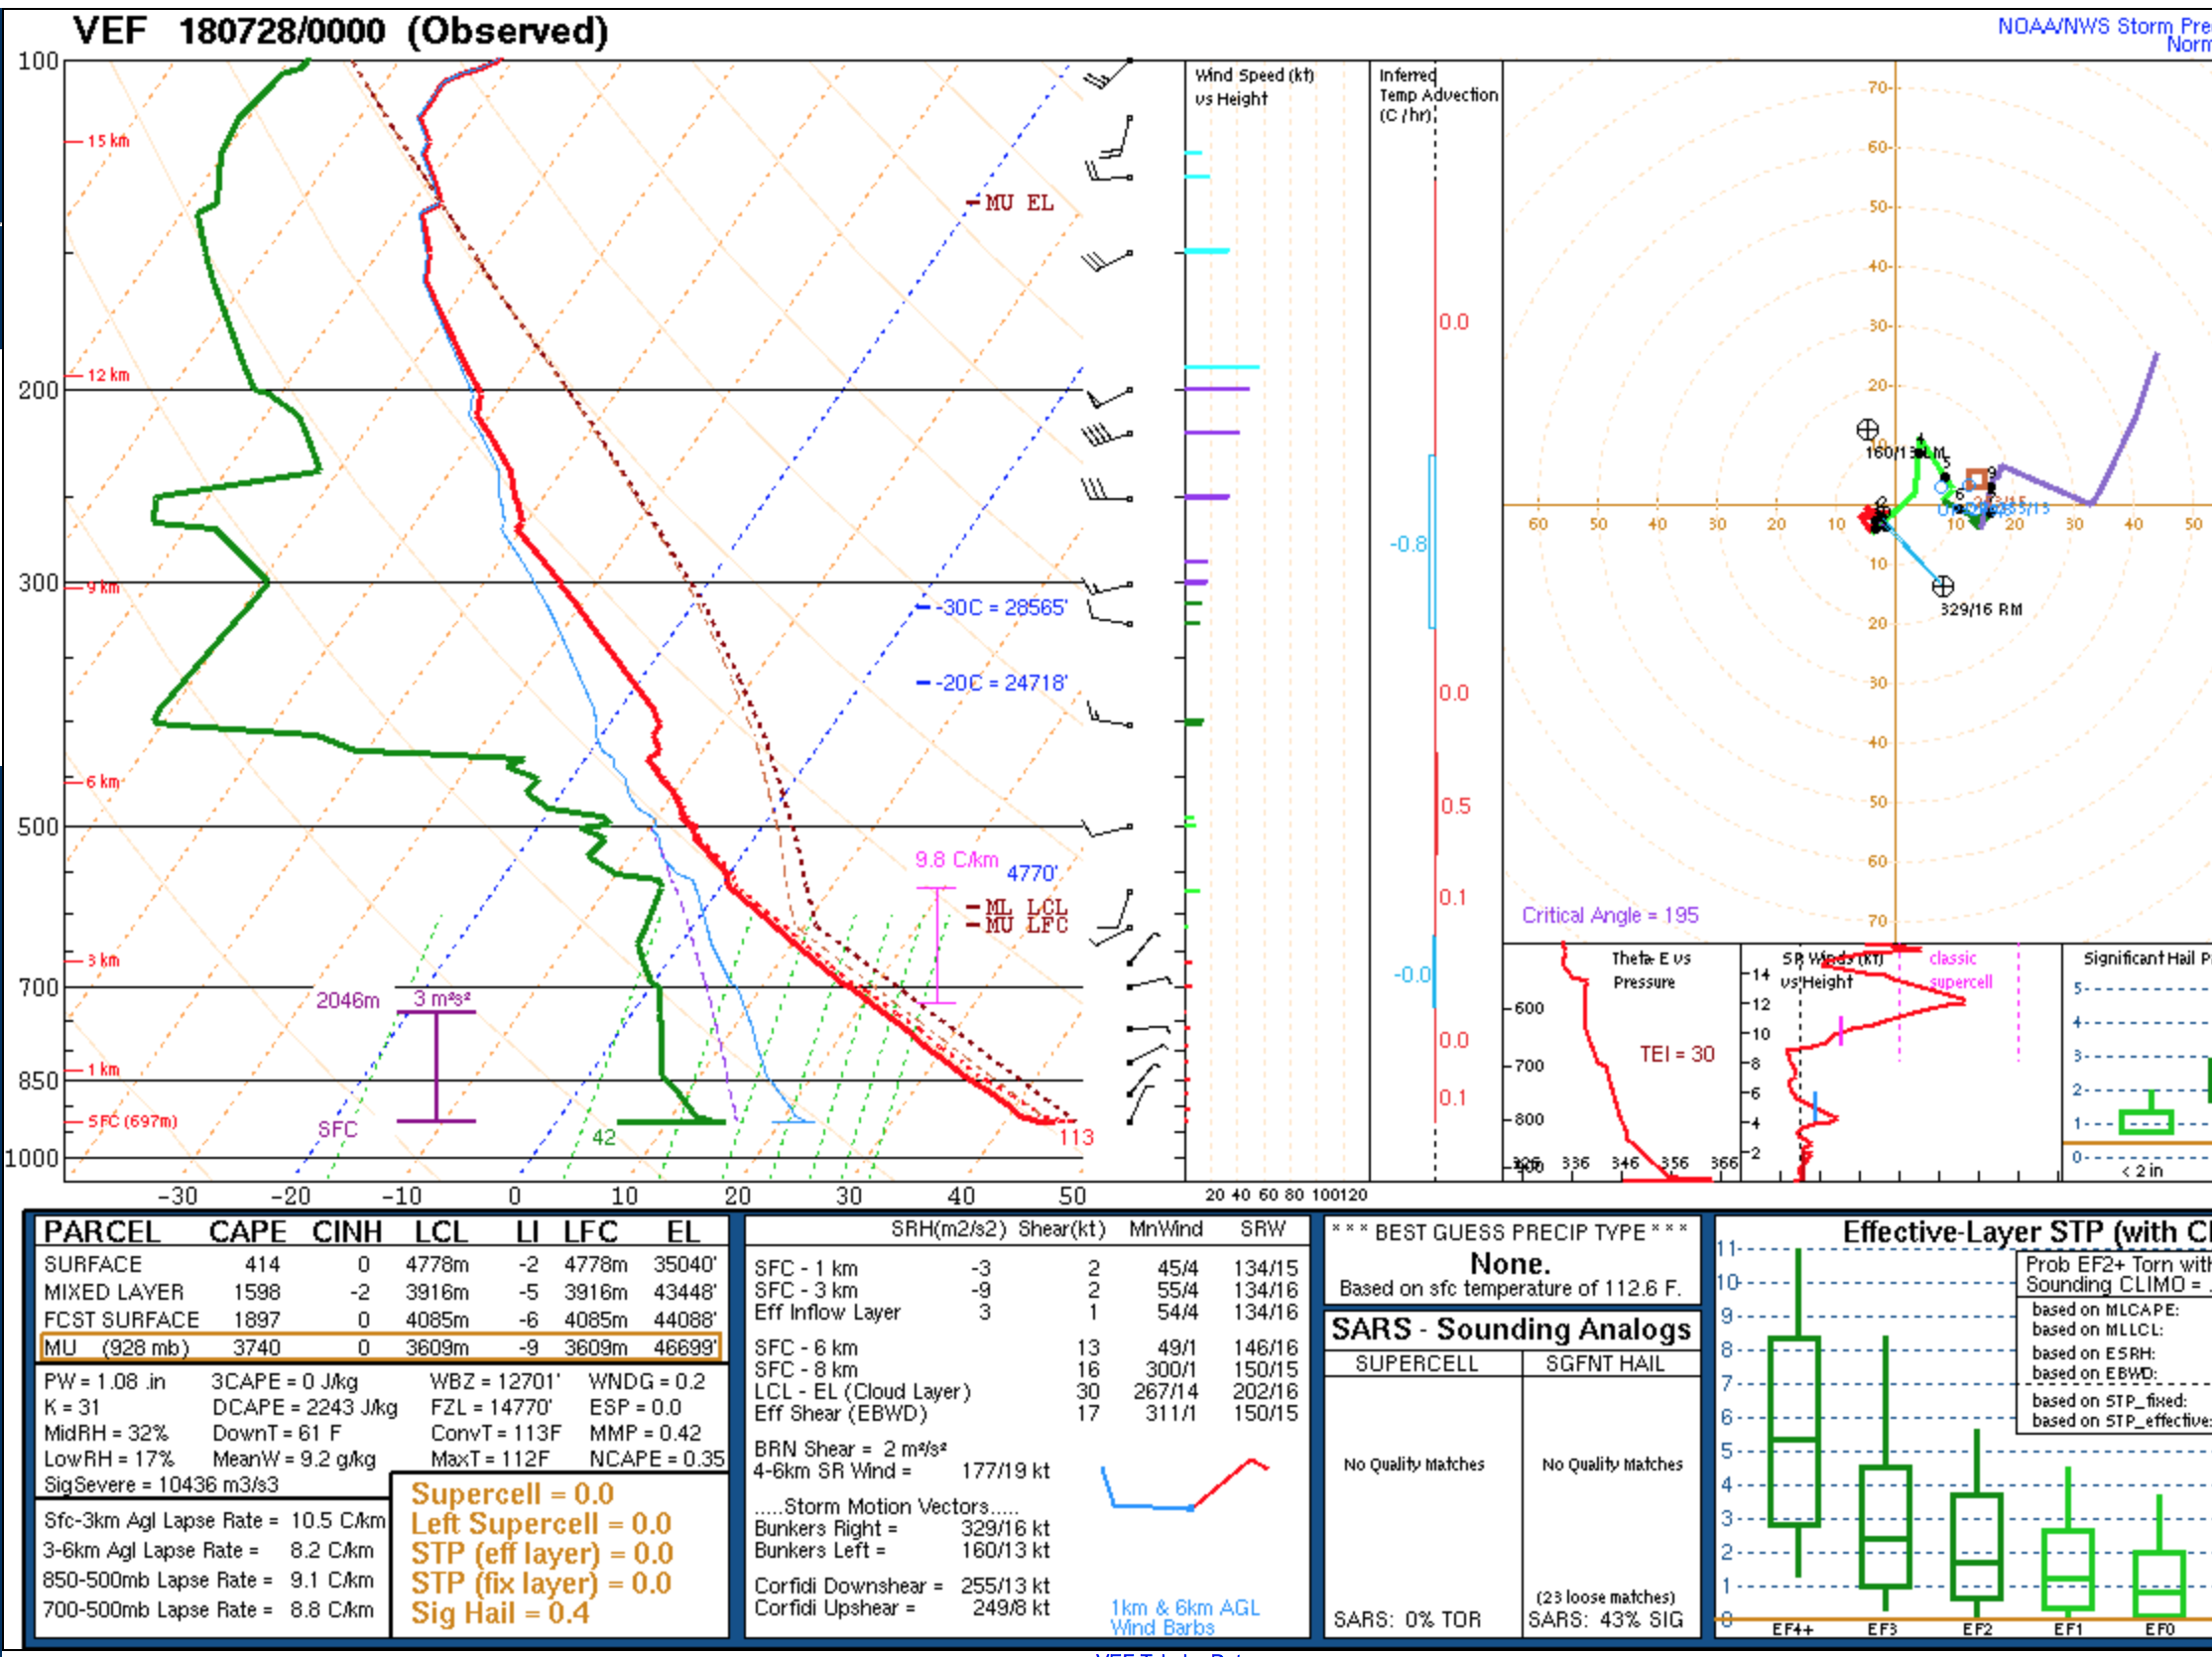
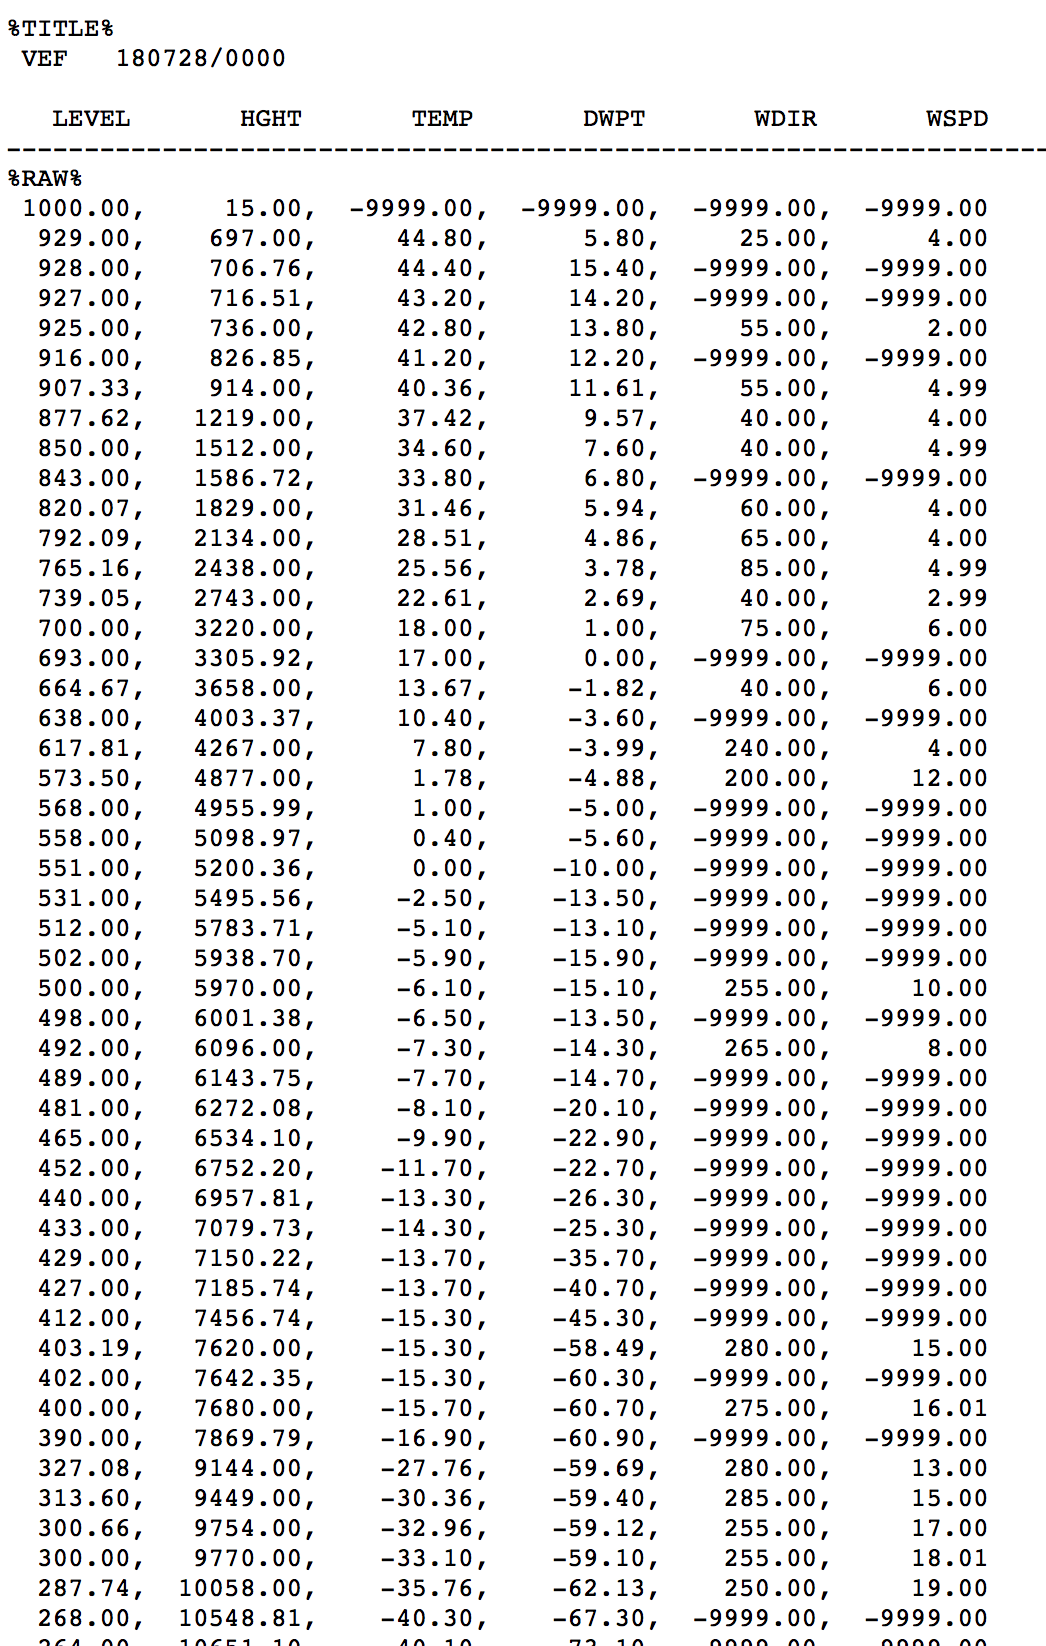
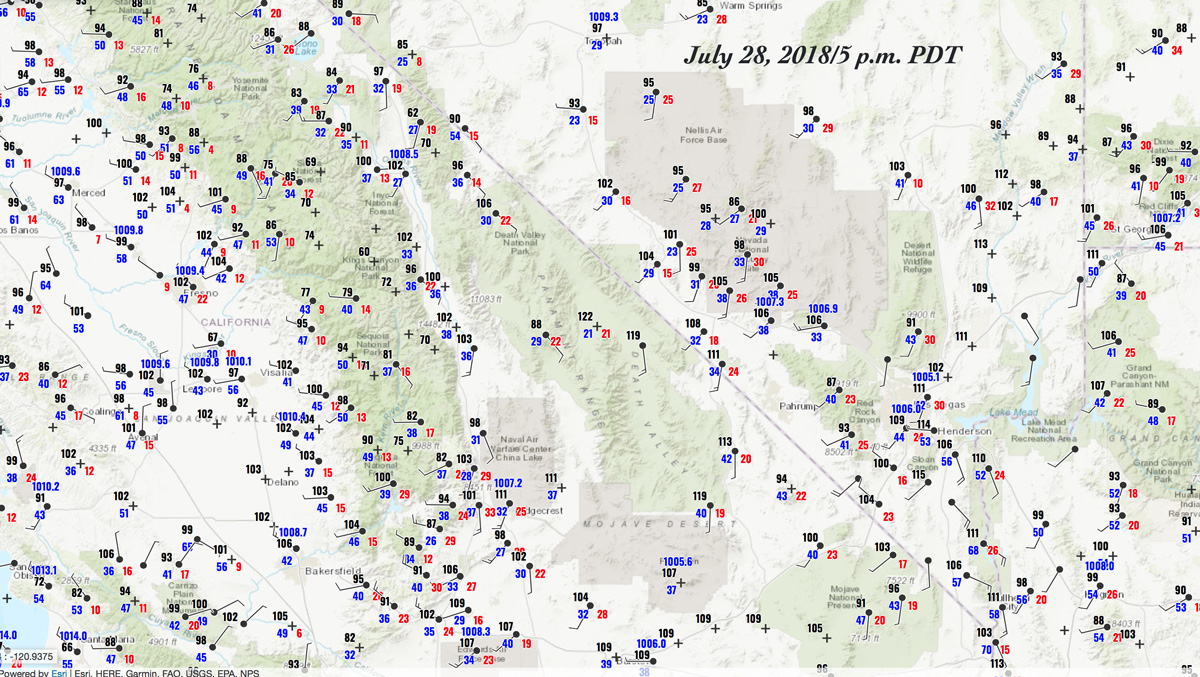
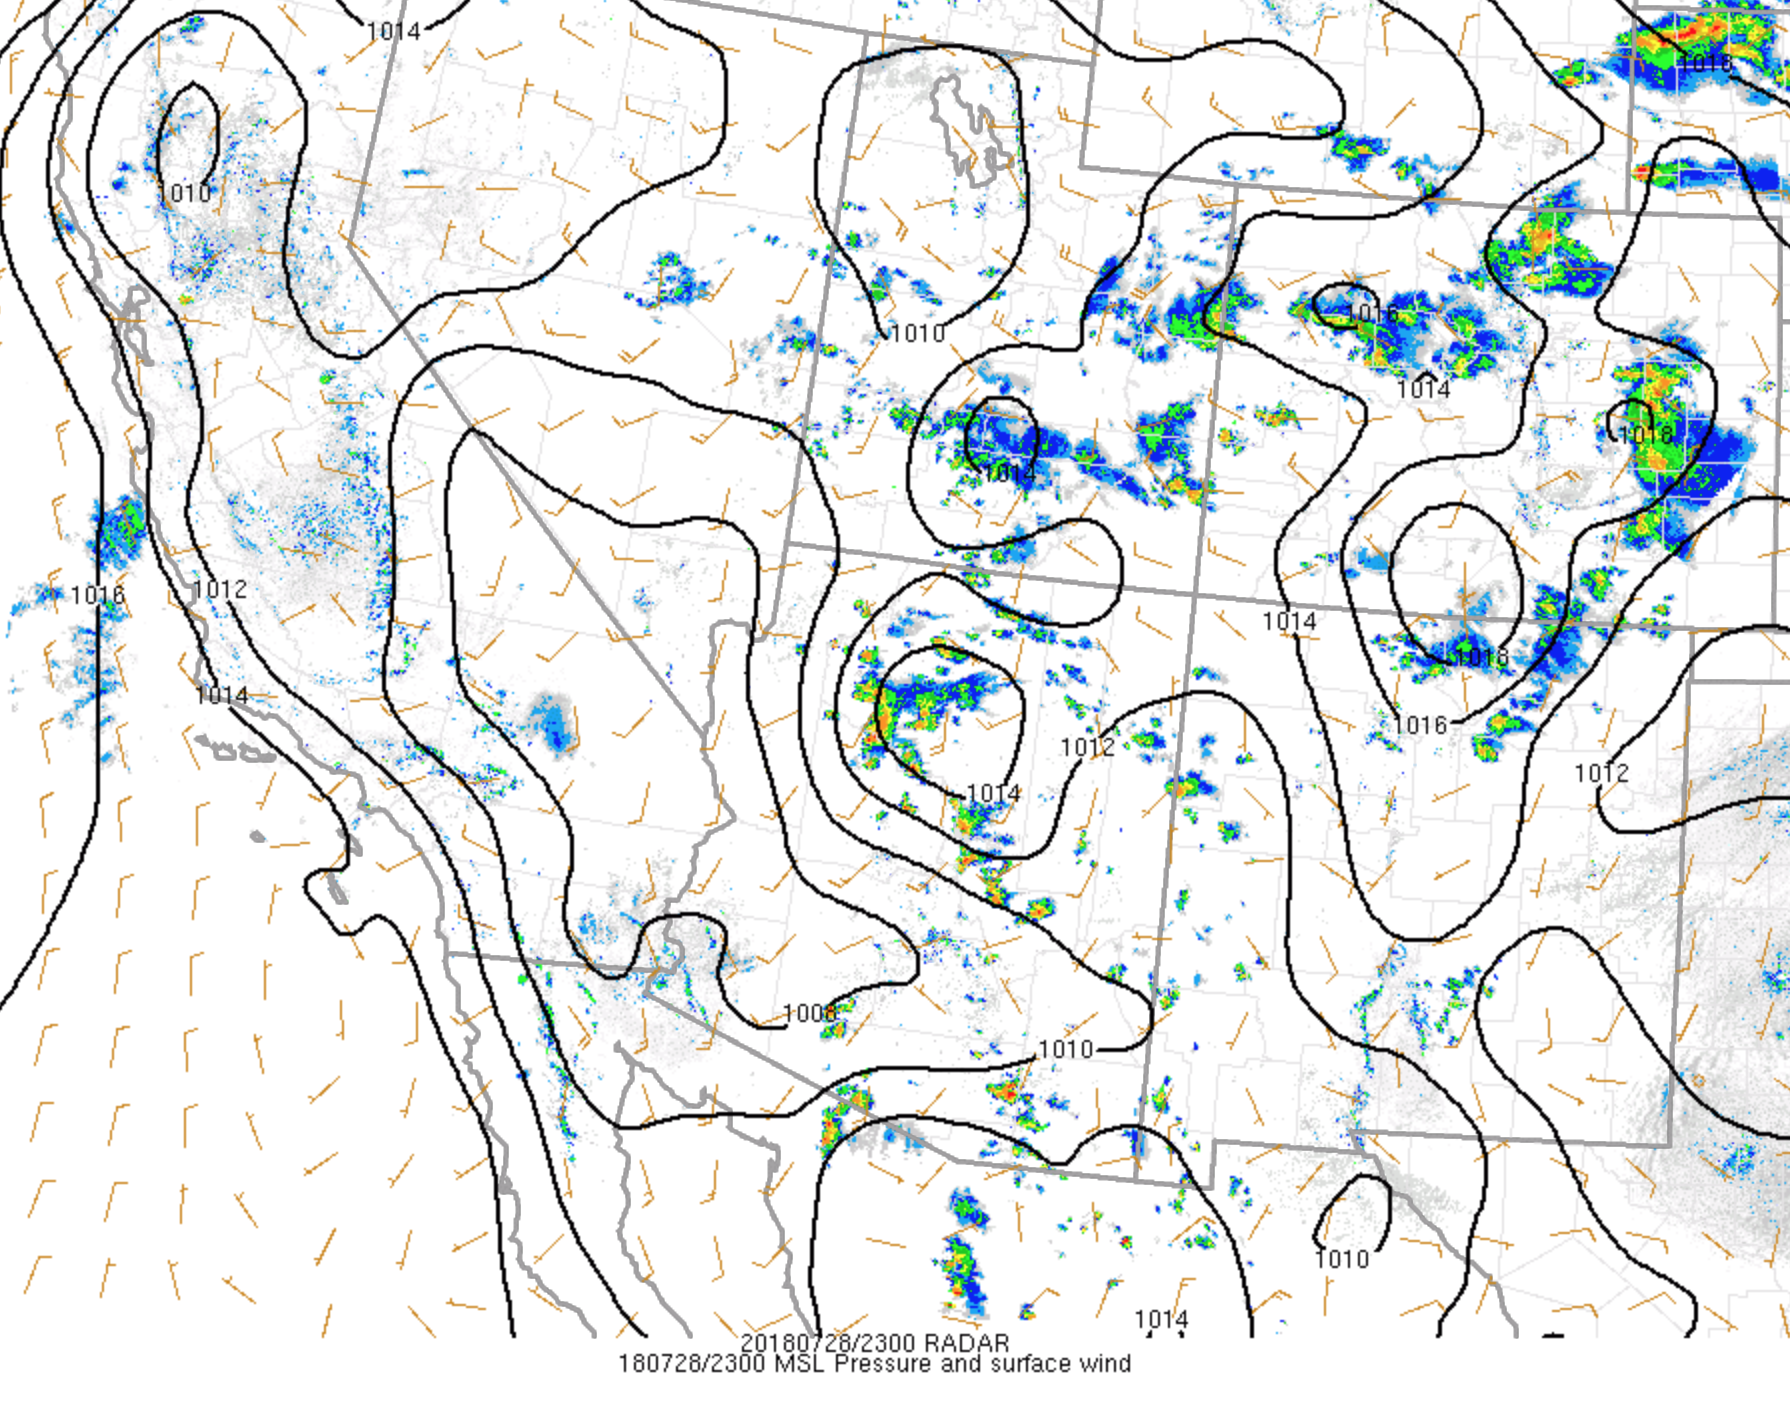
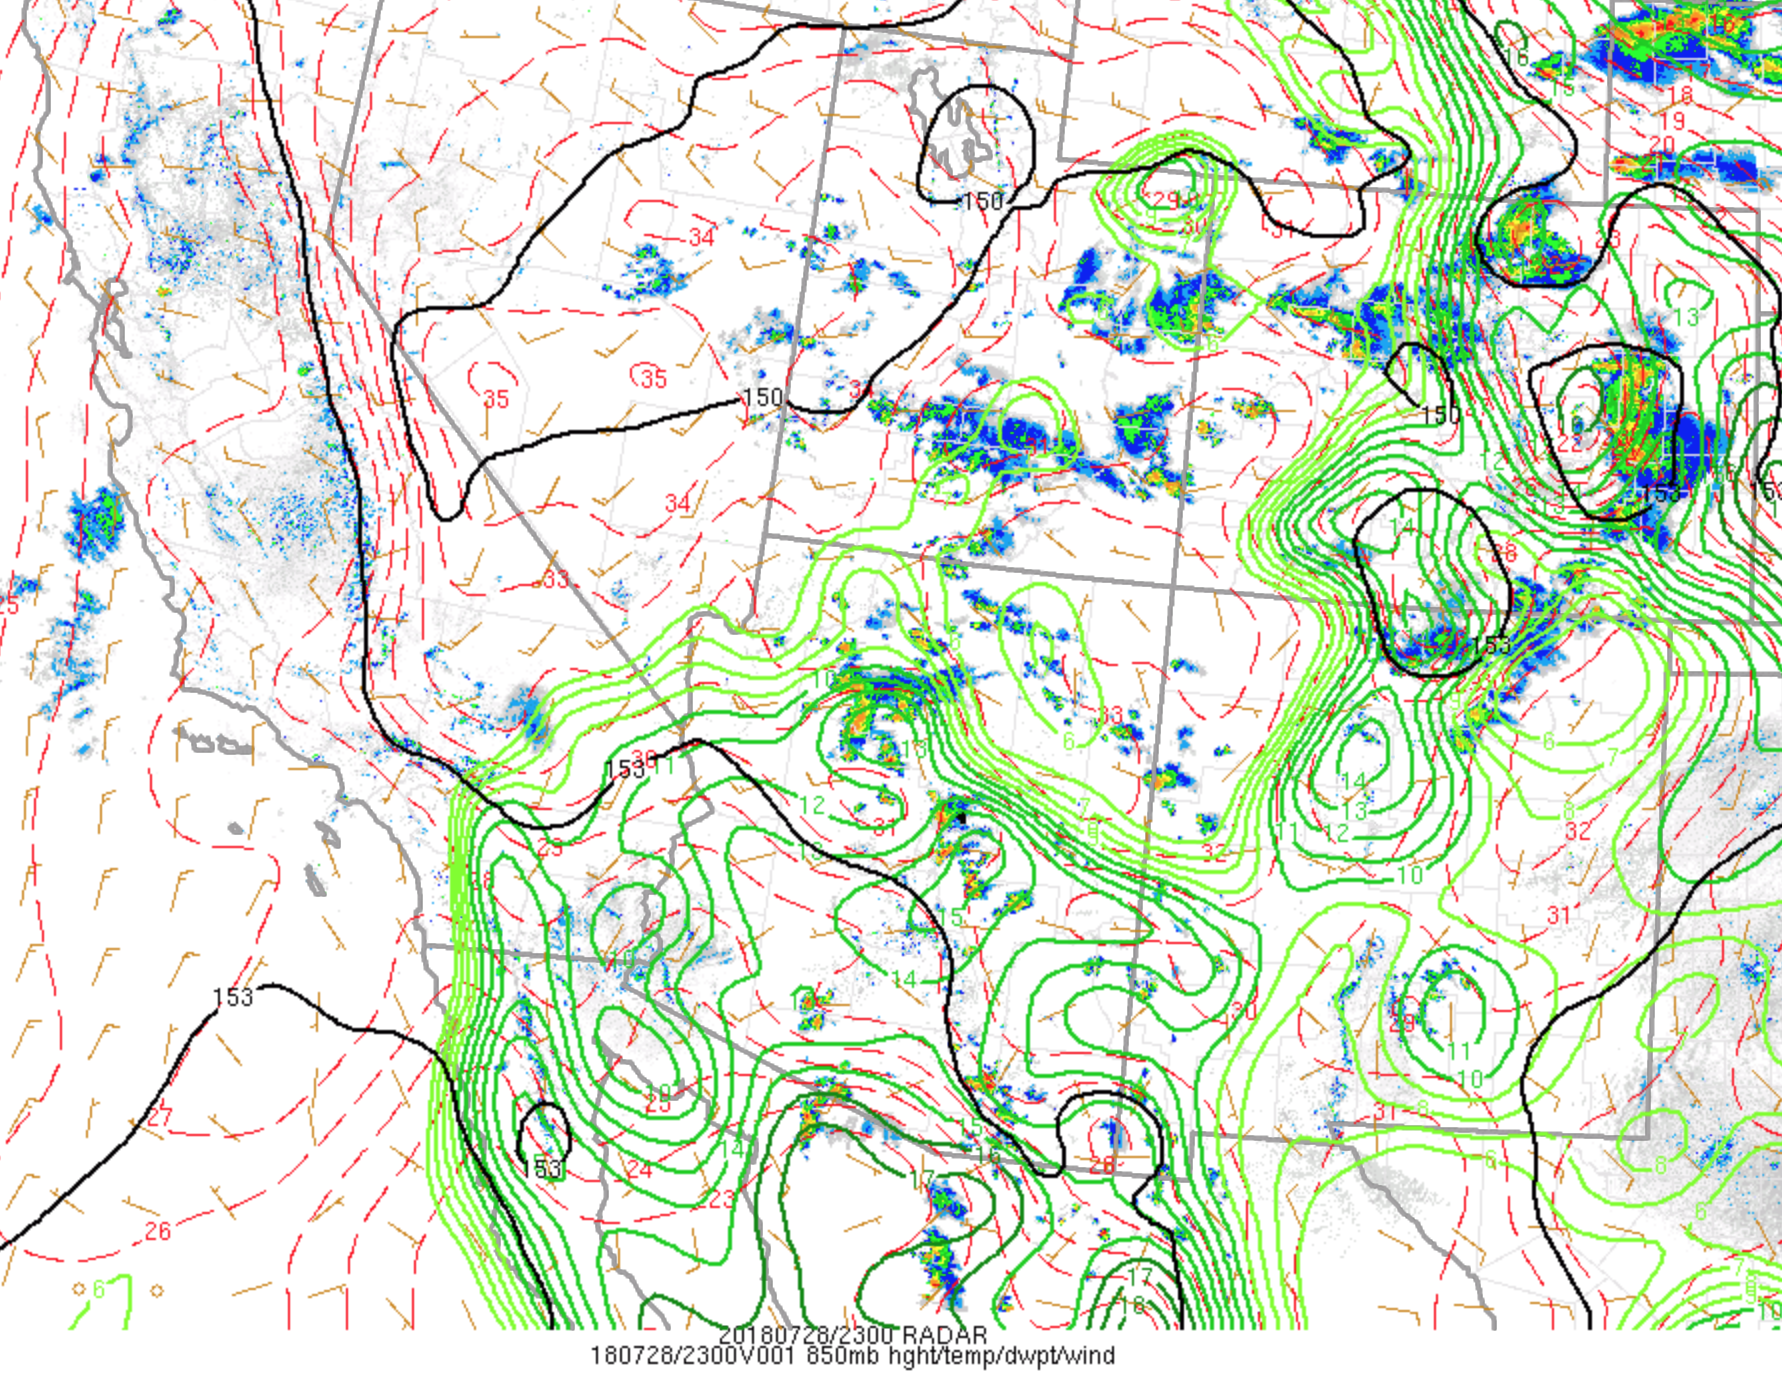
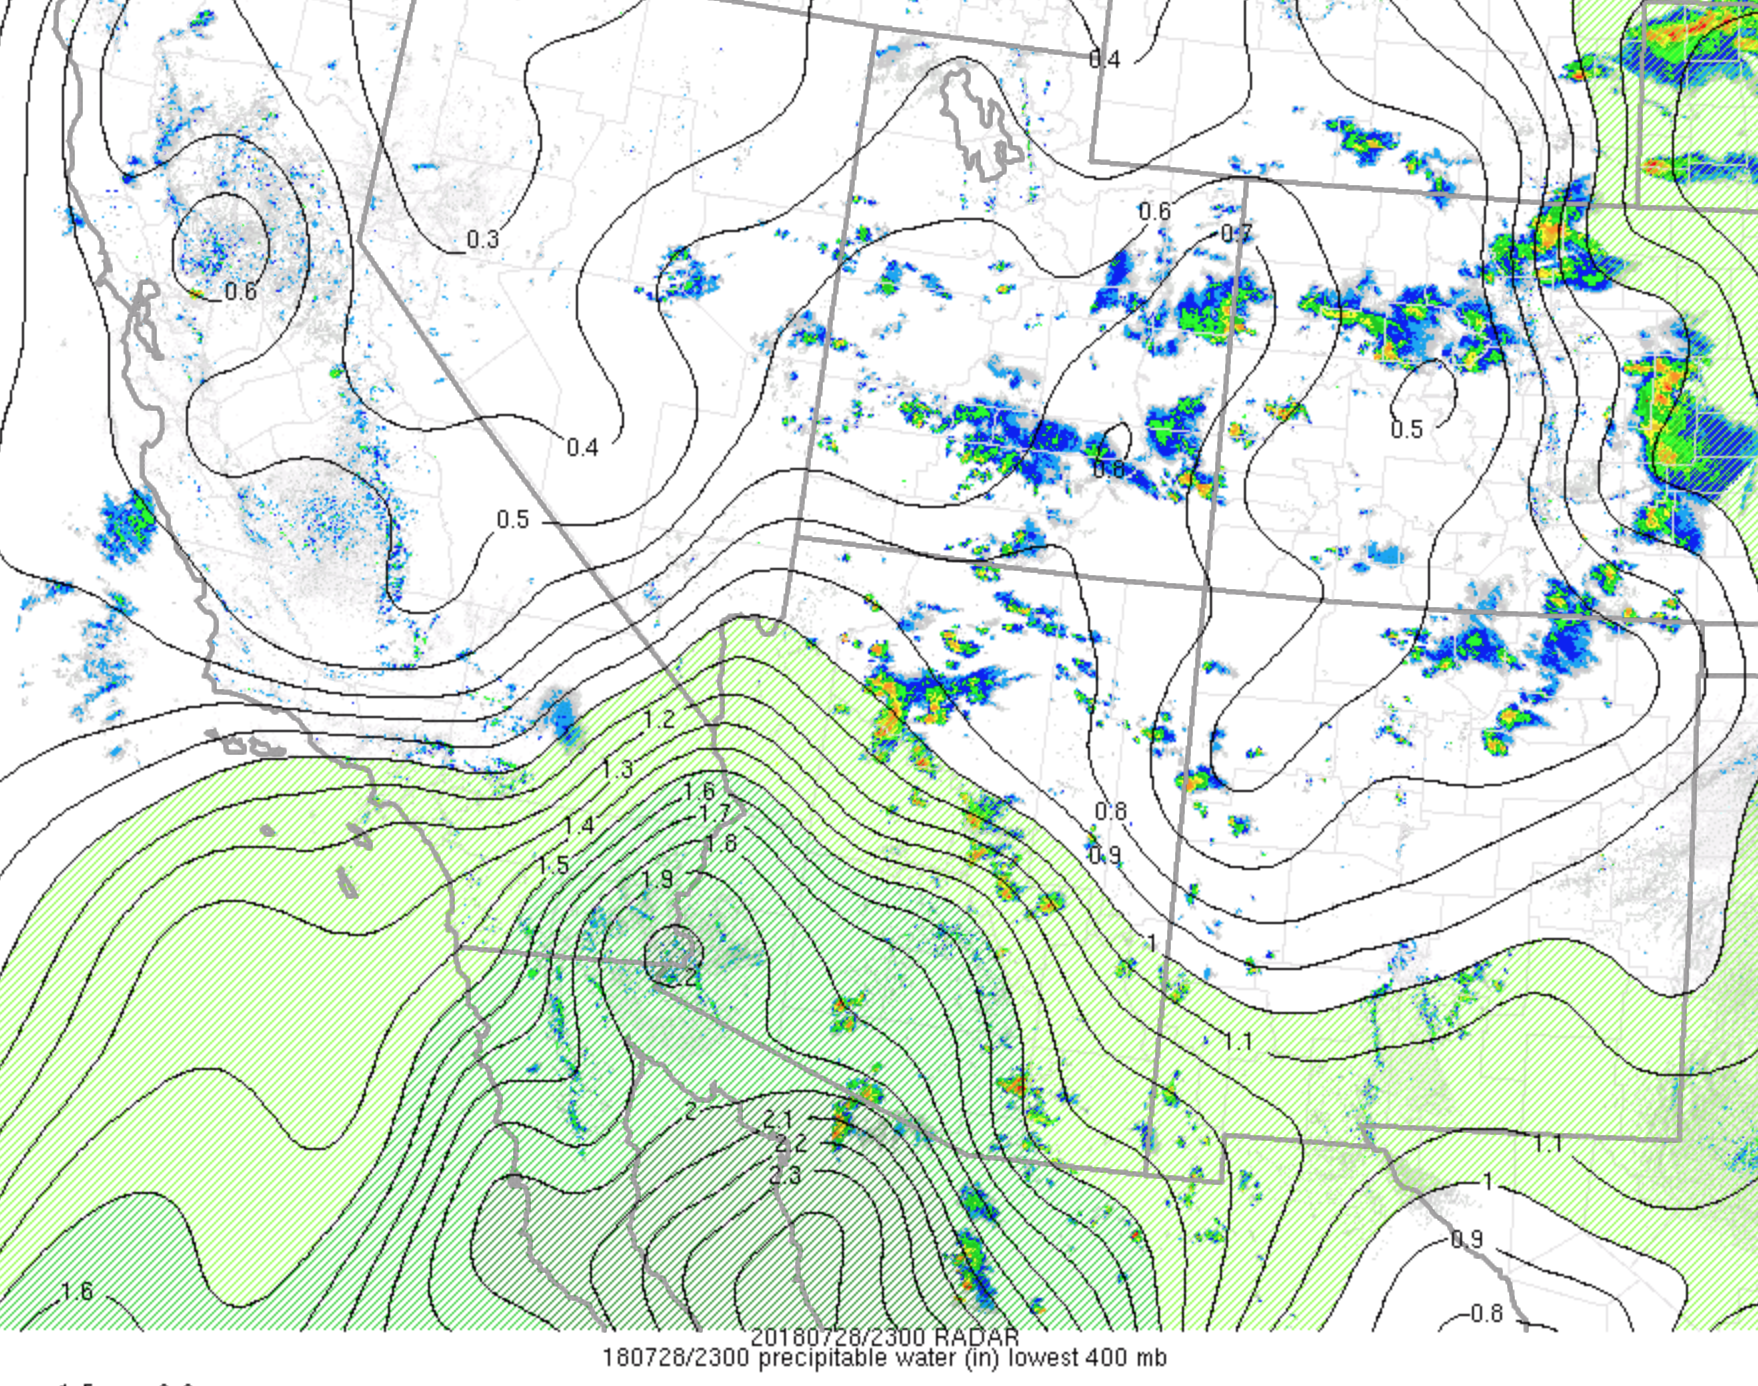
July 28


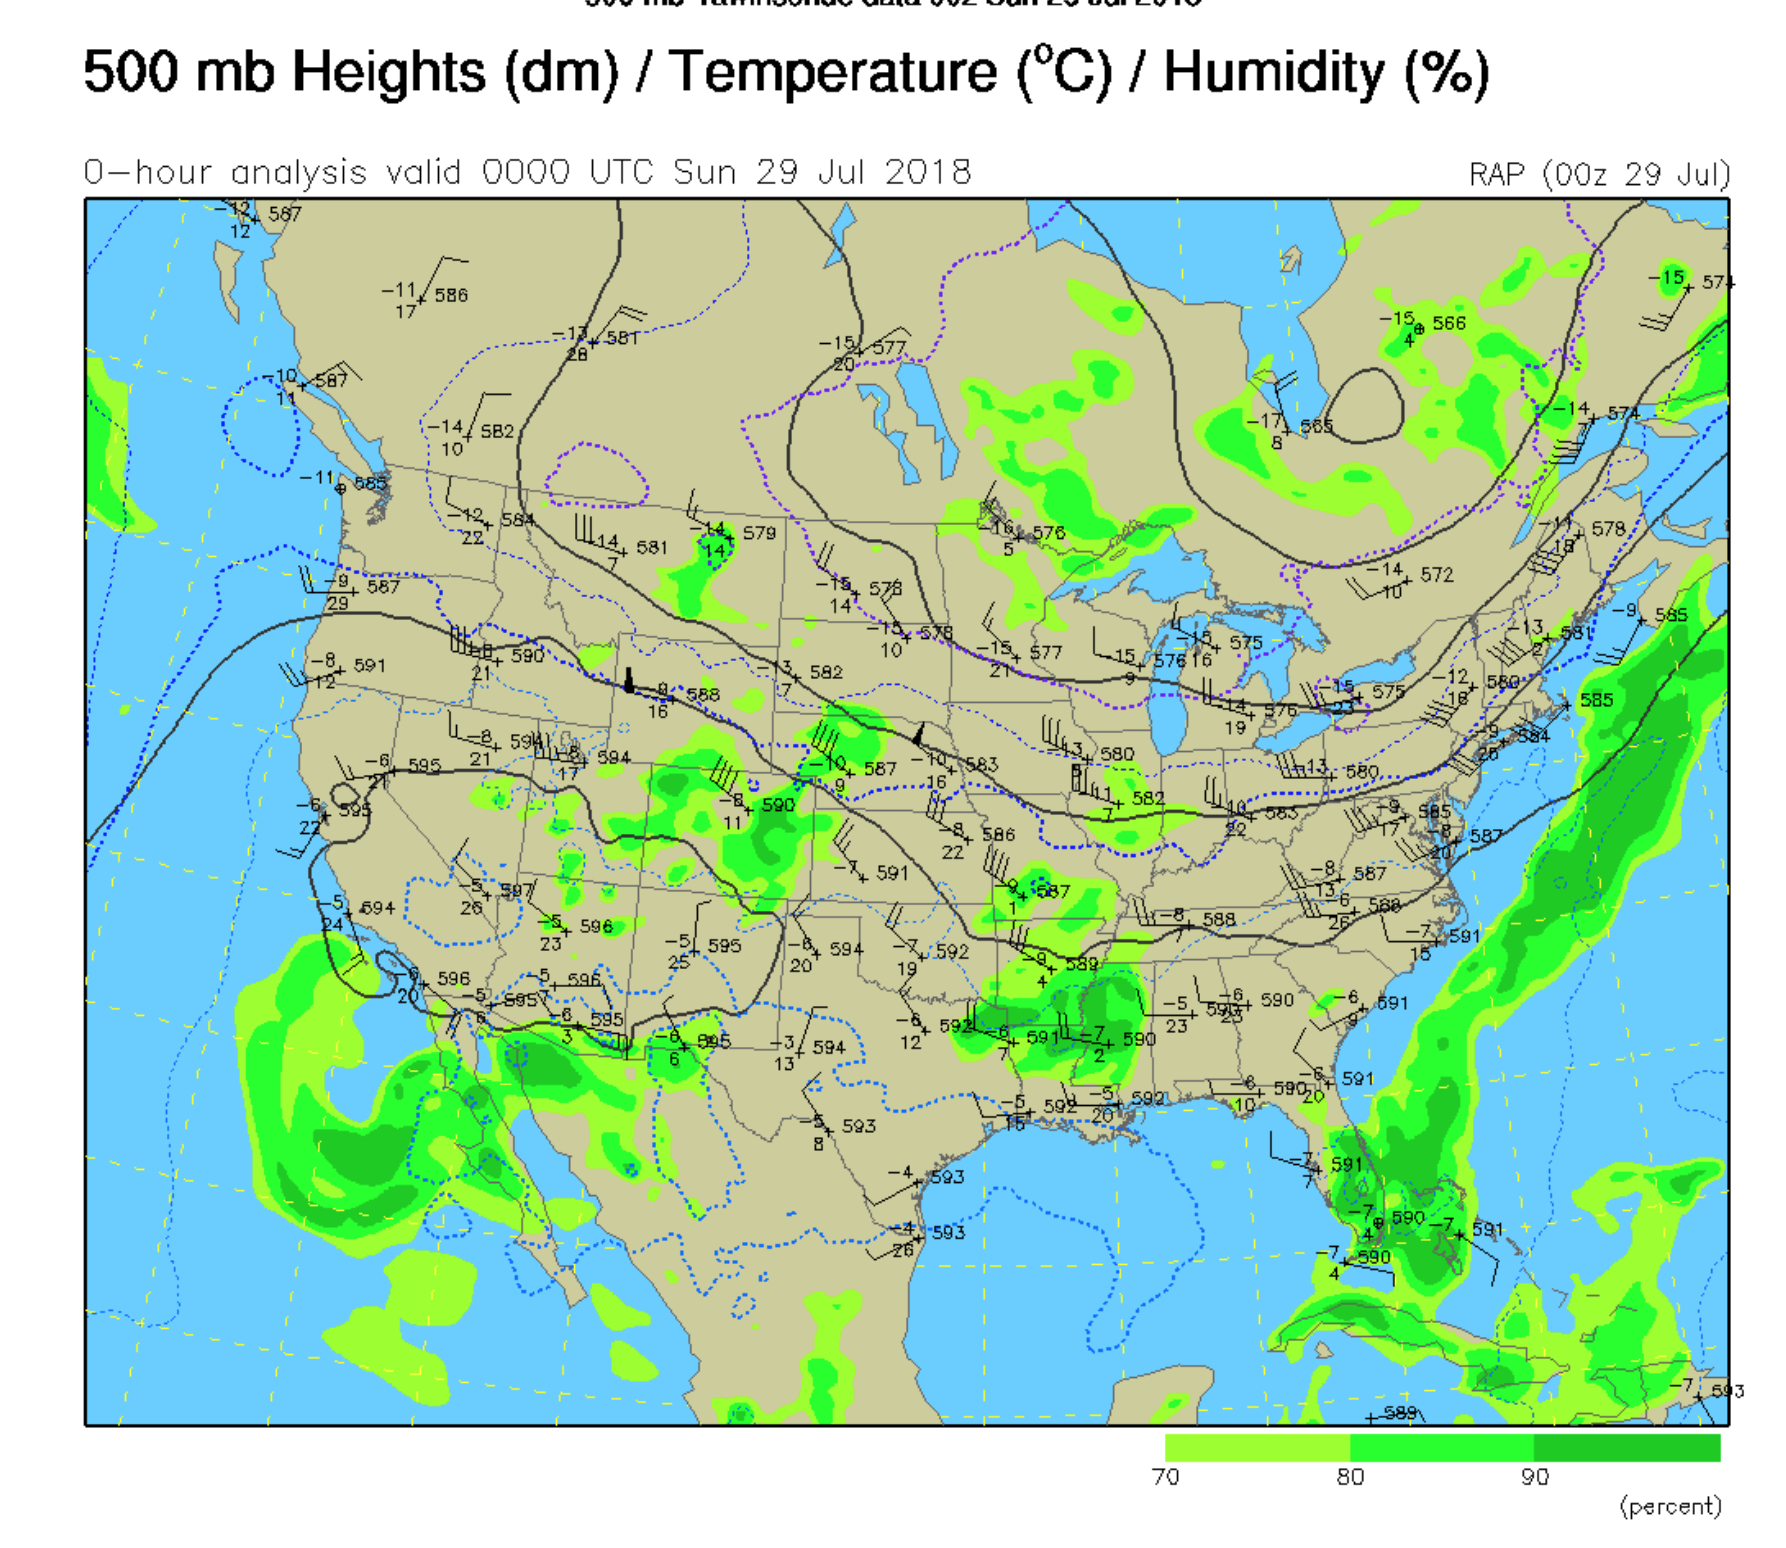
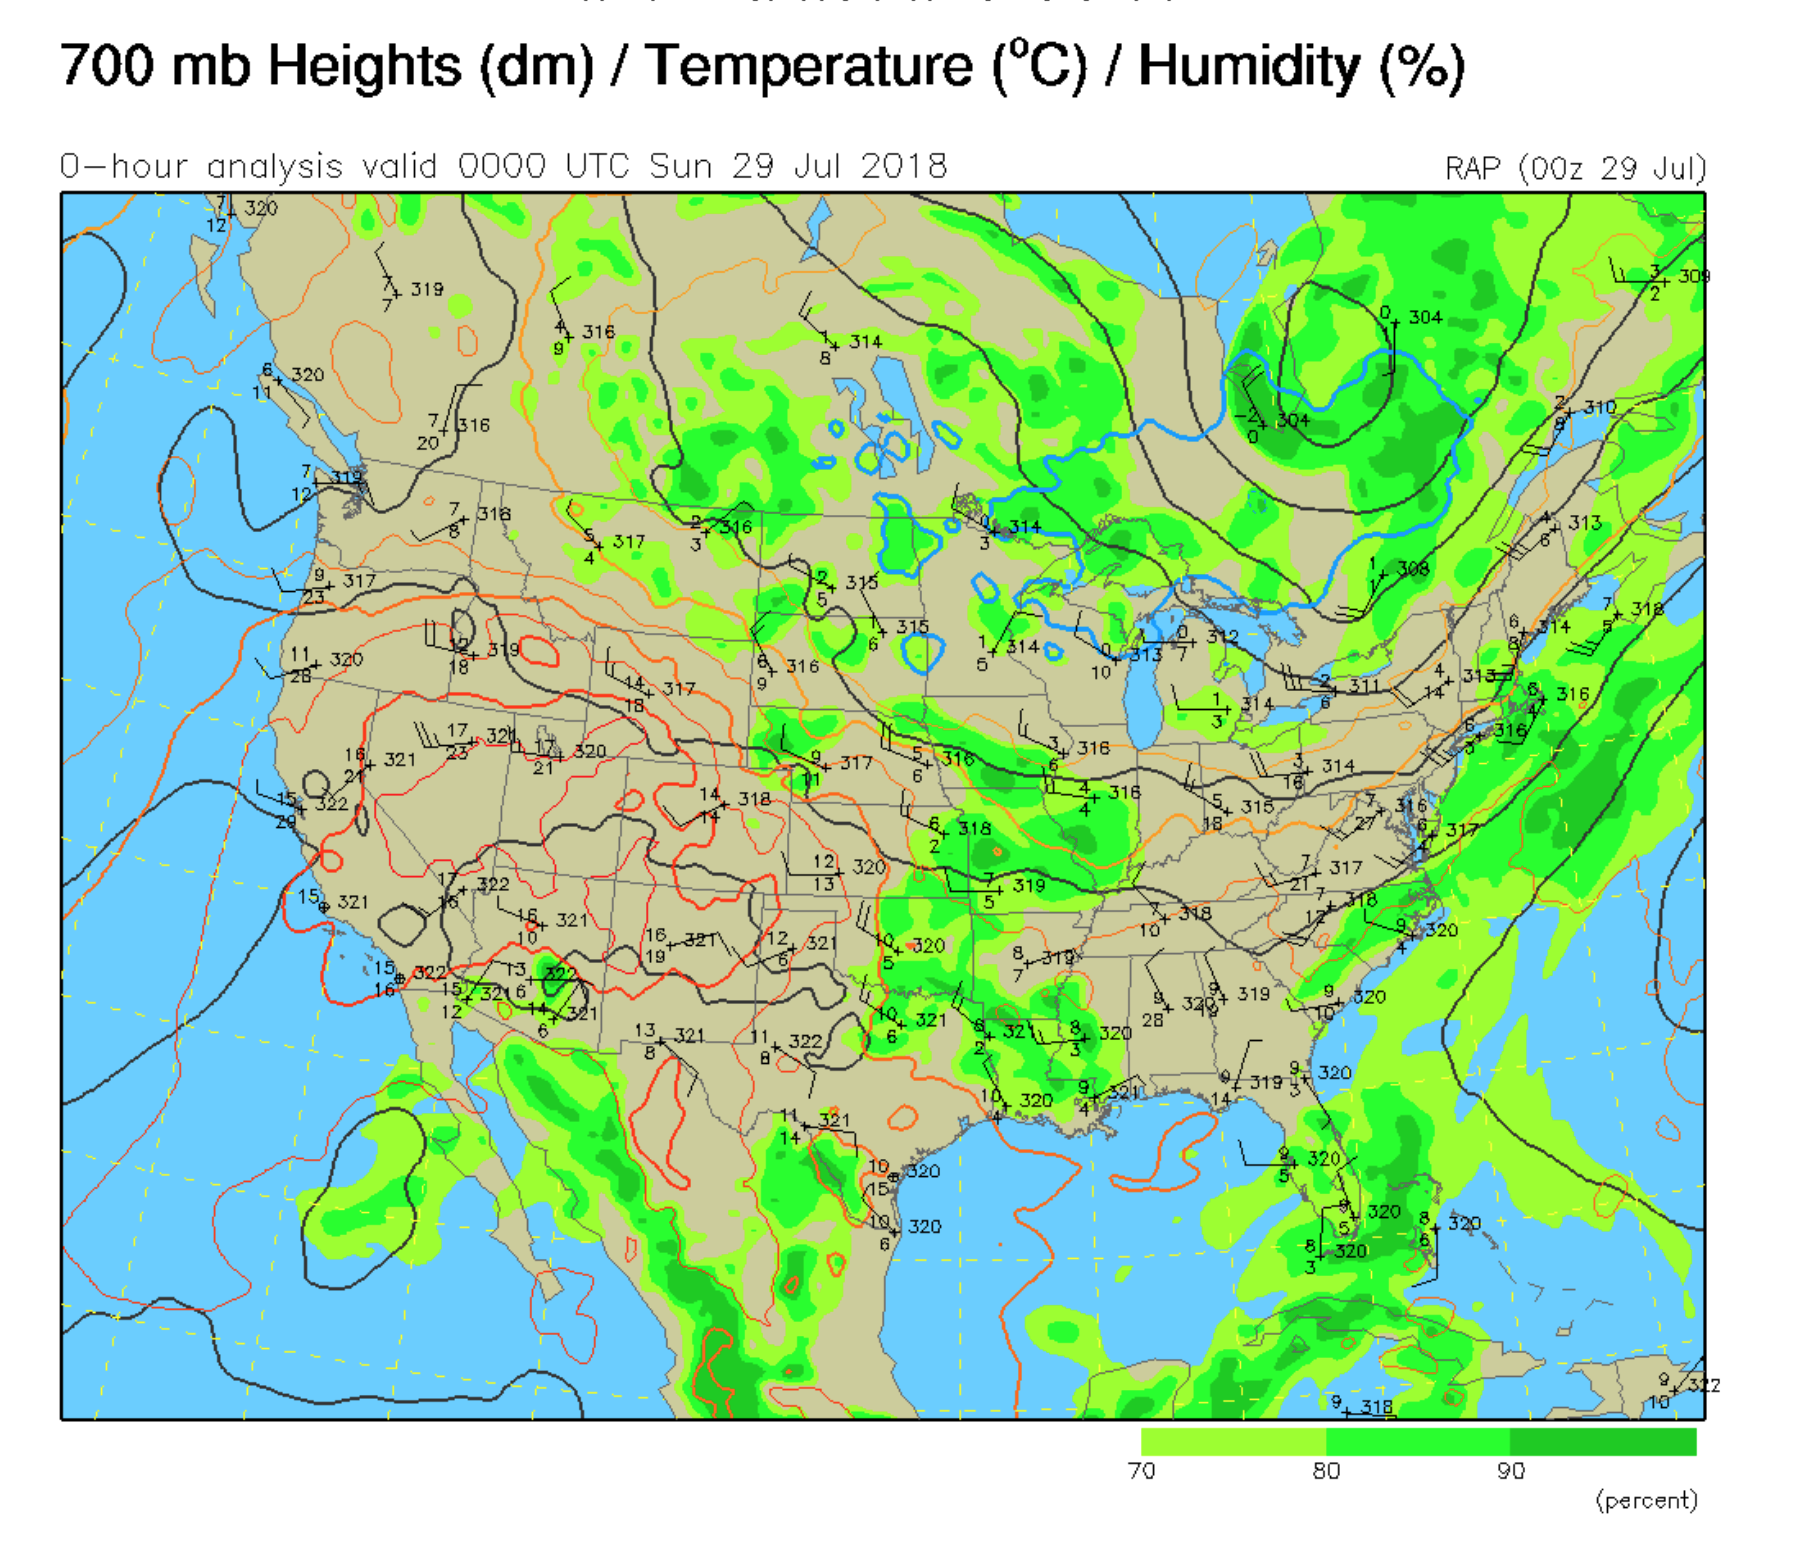
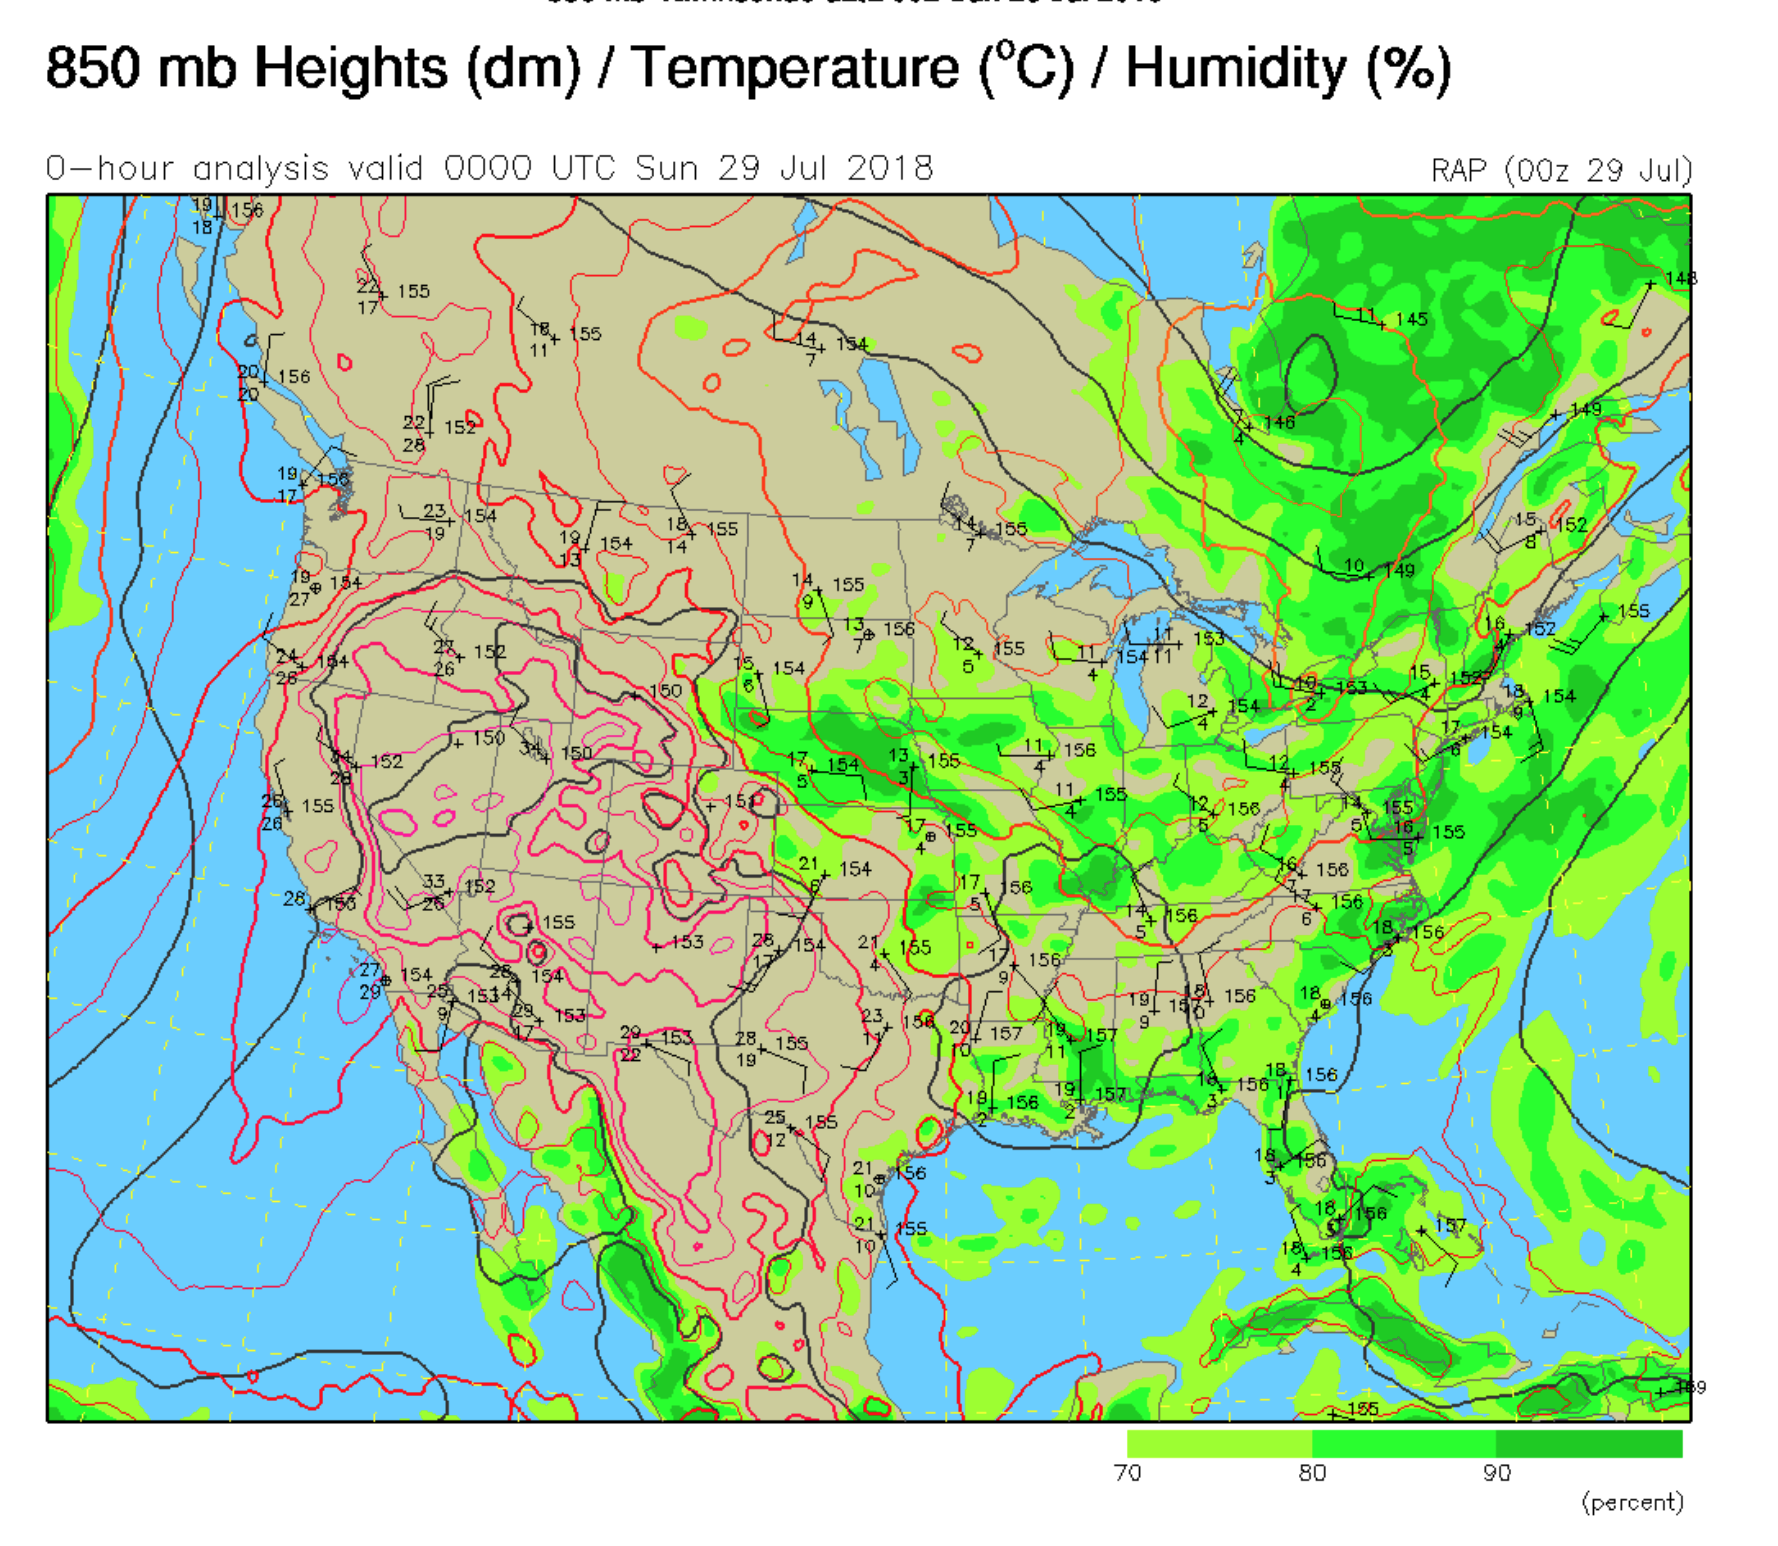
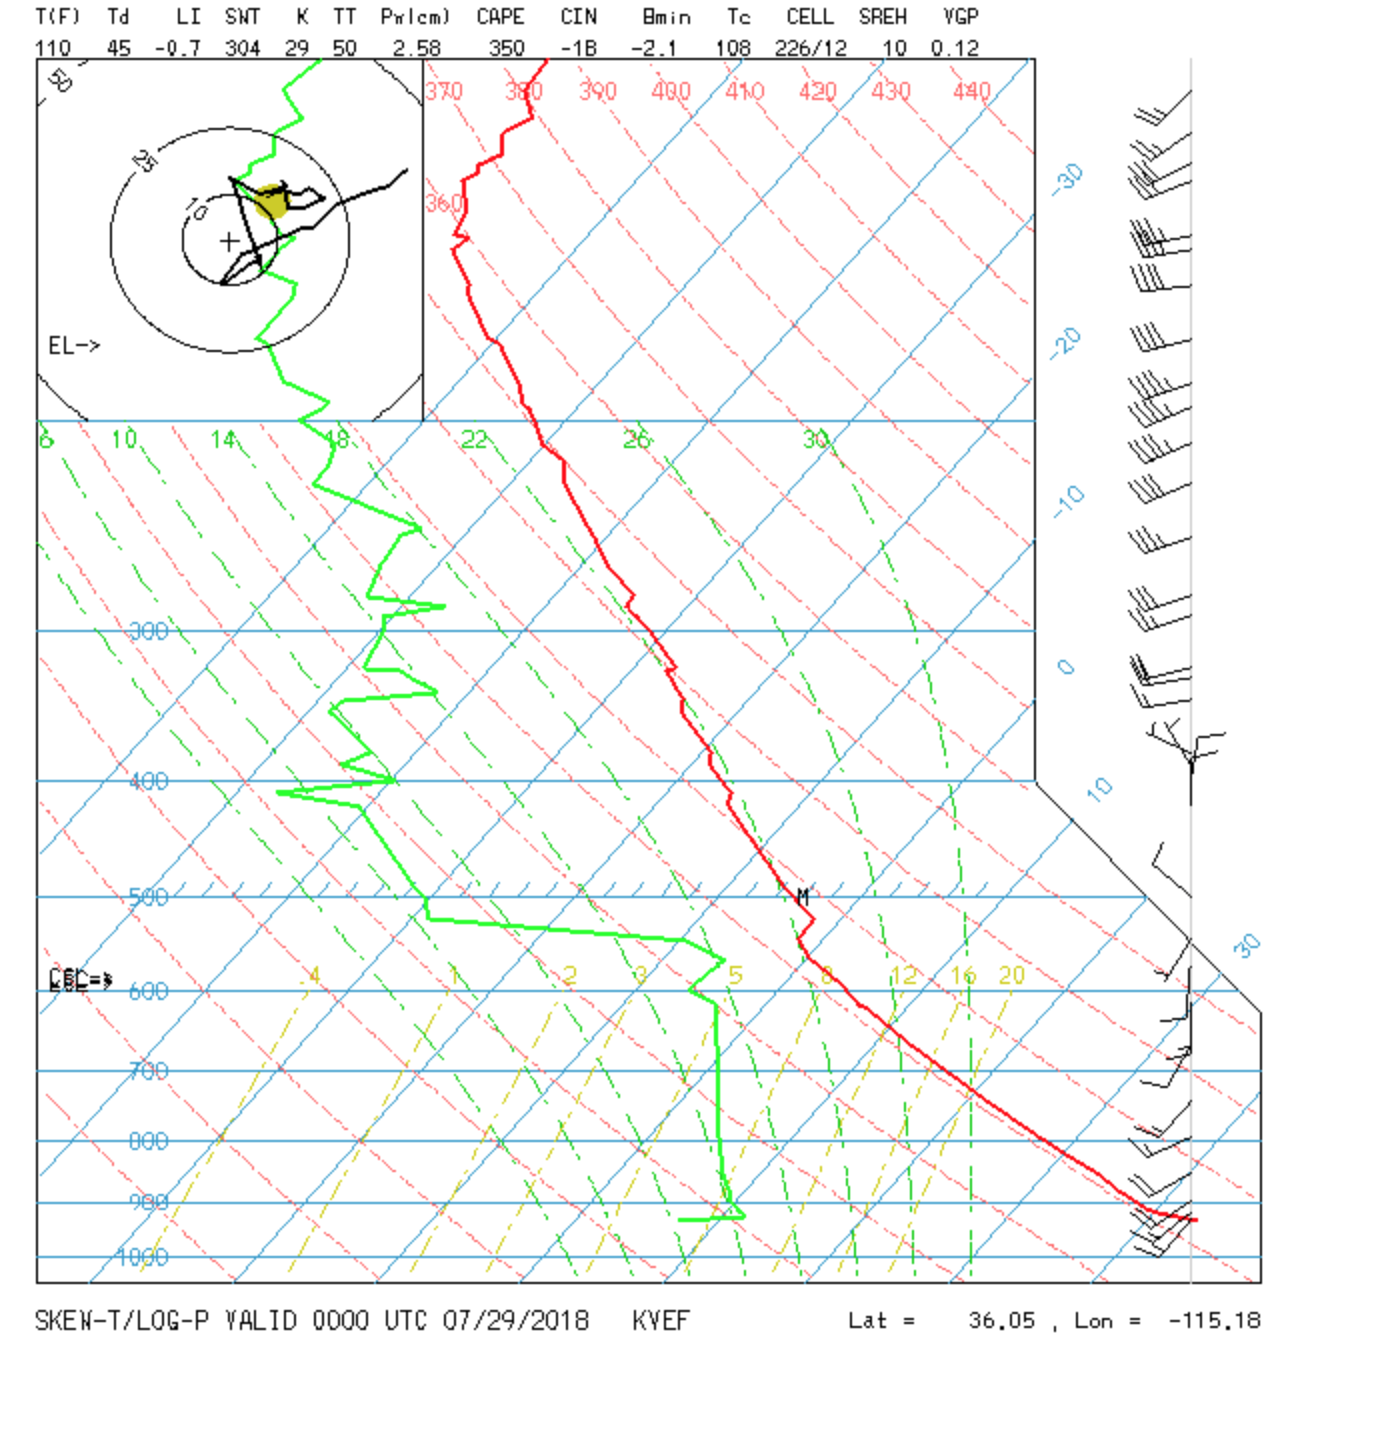
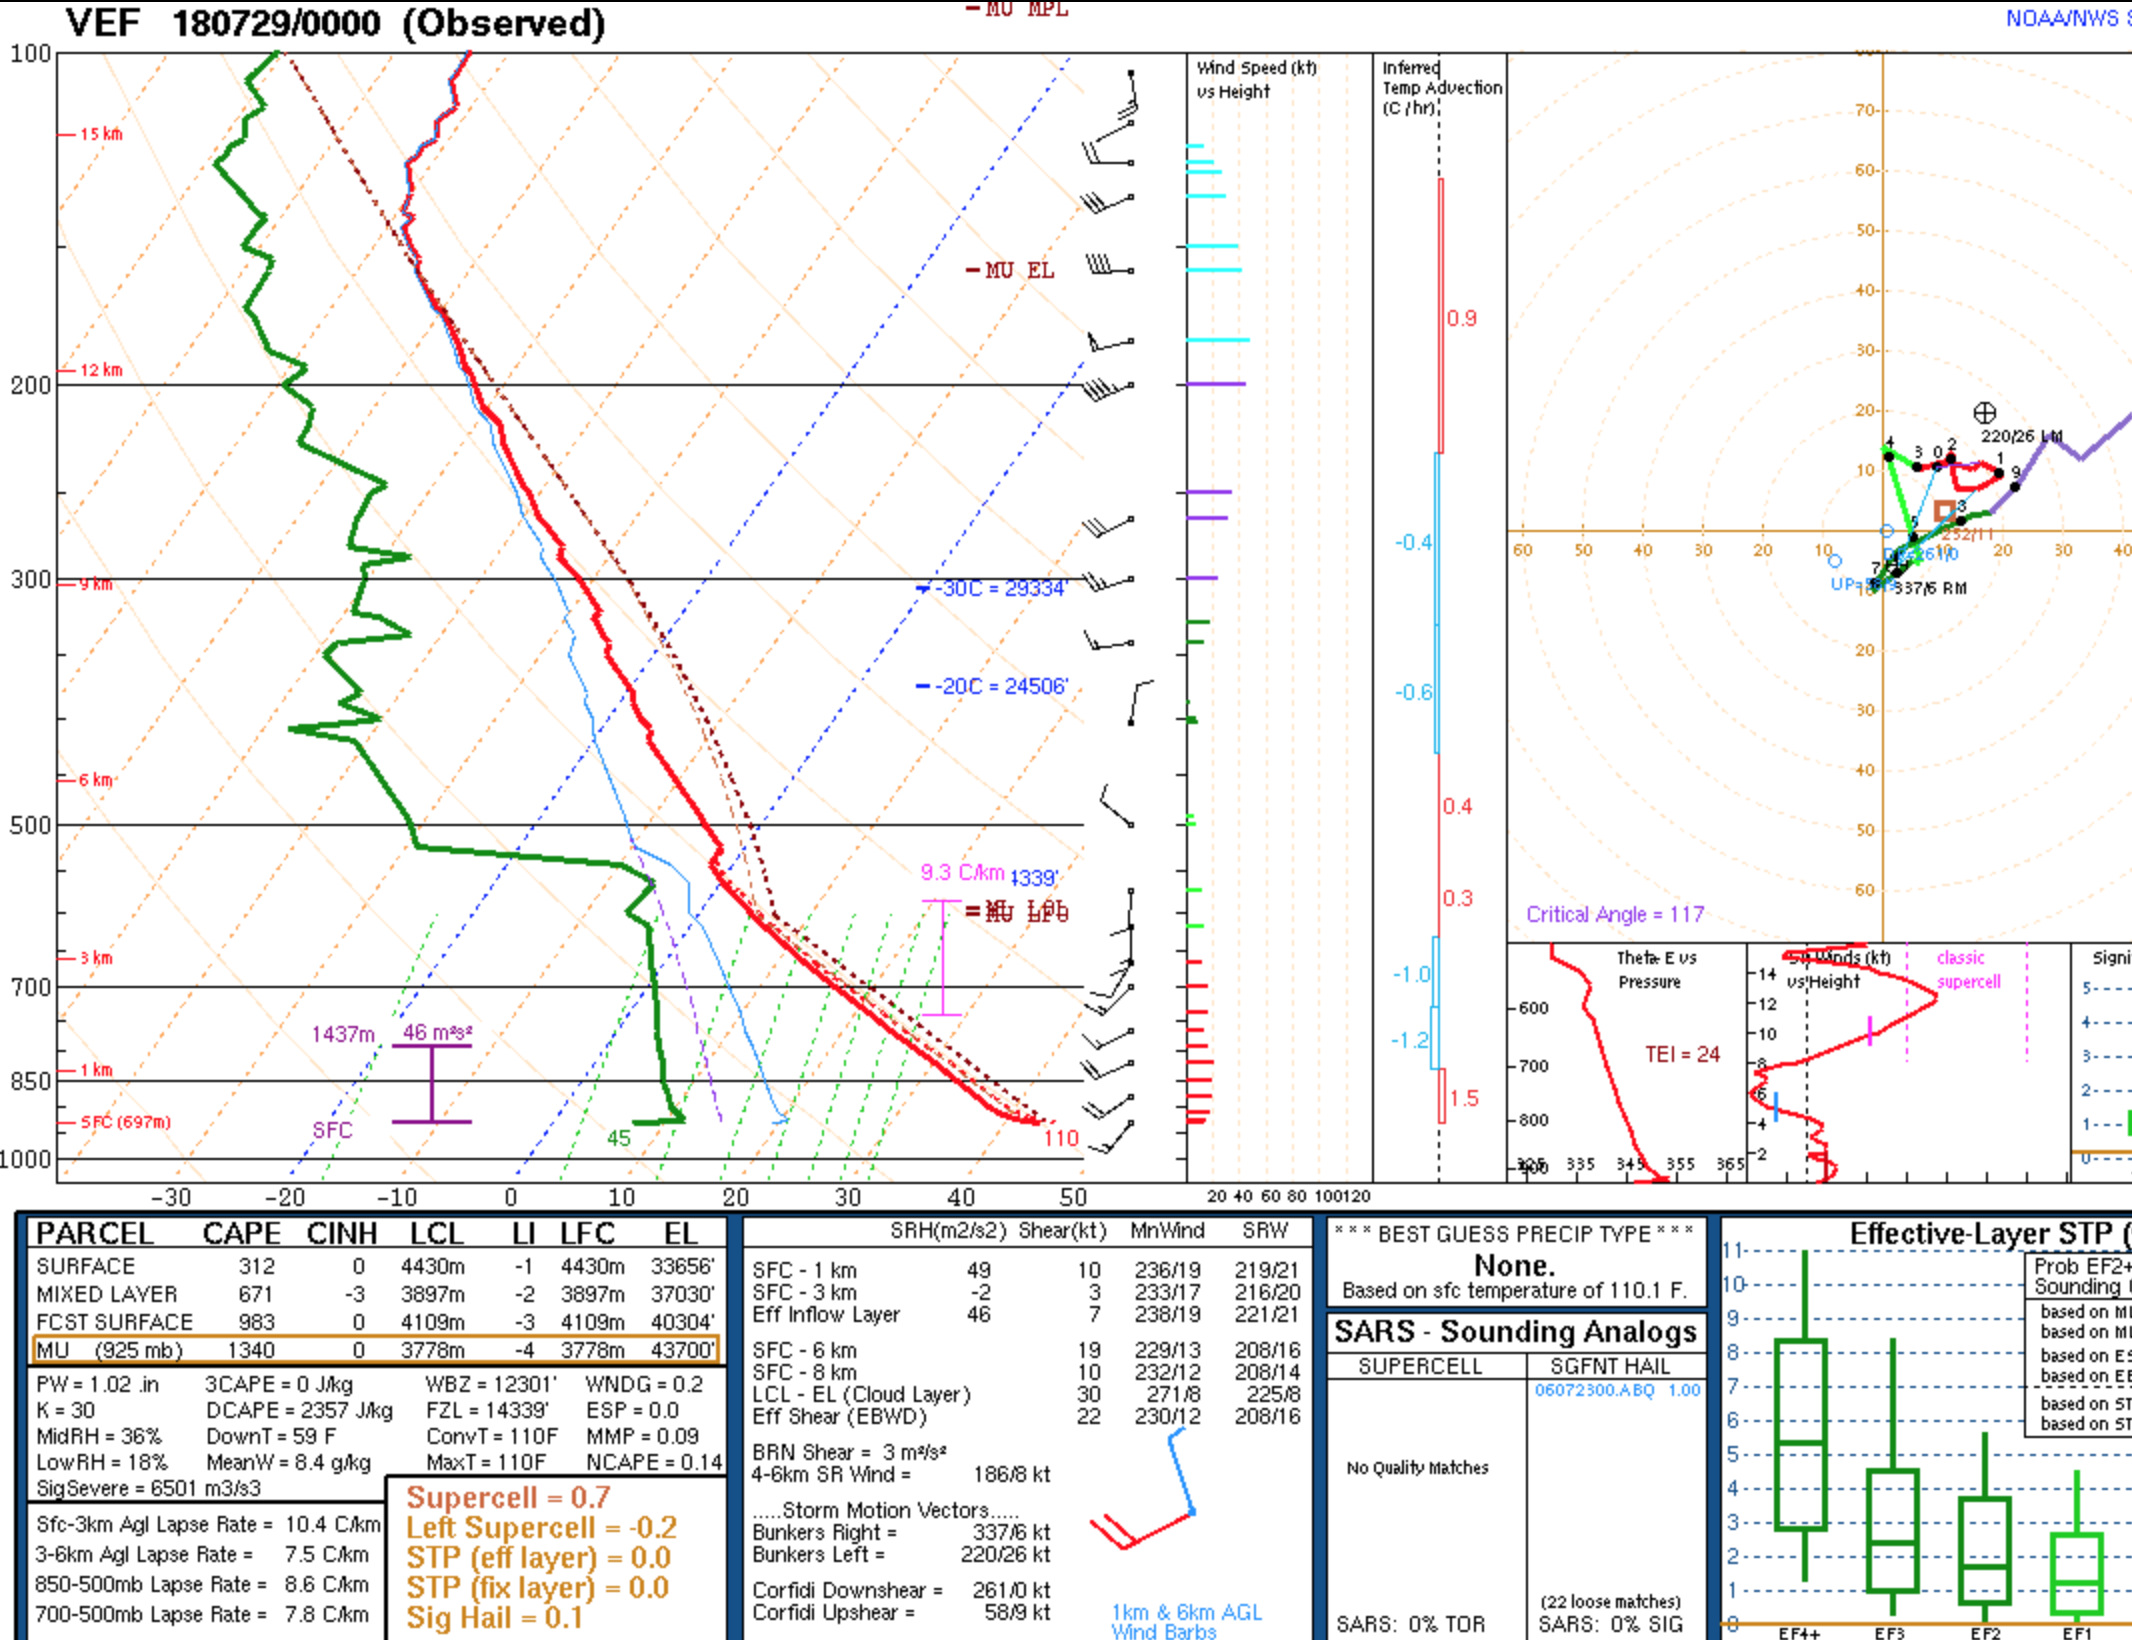
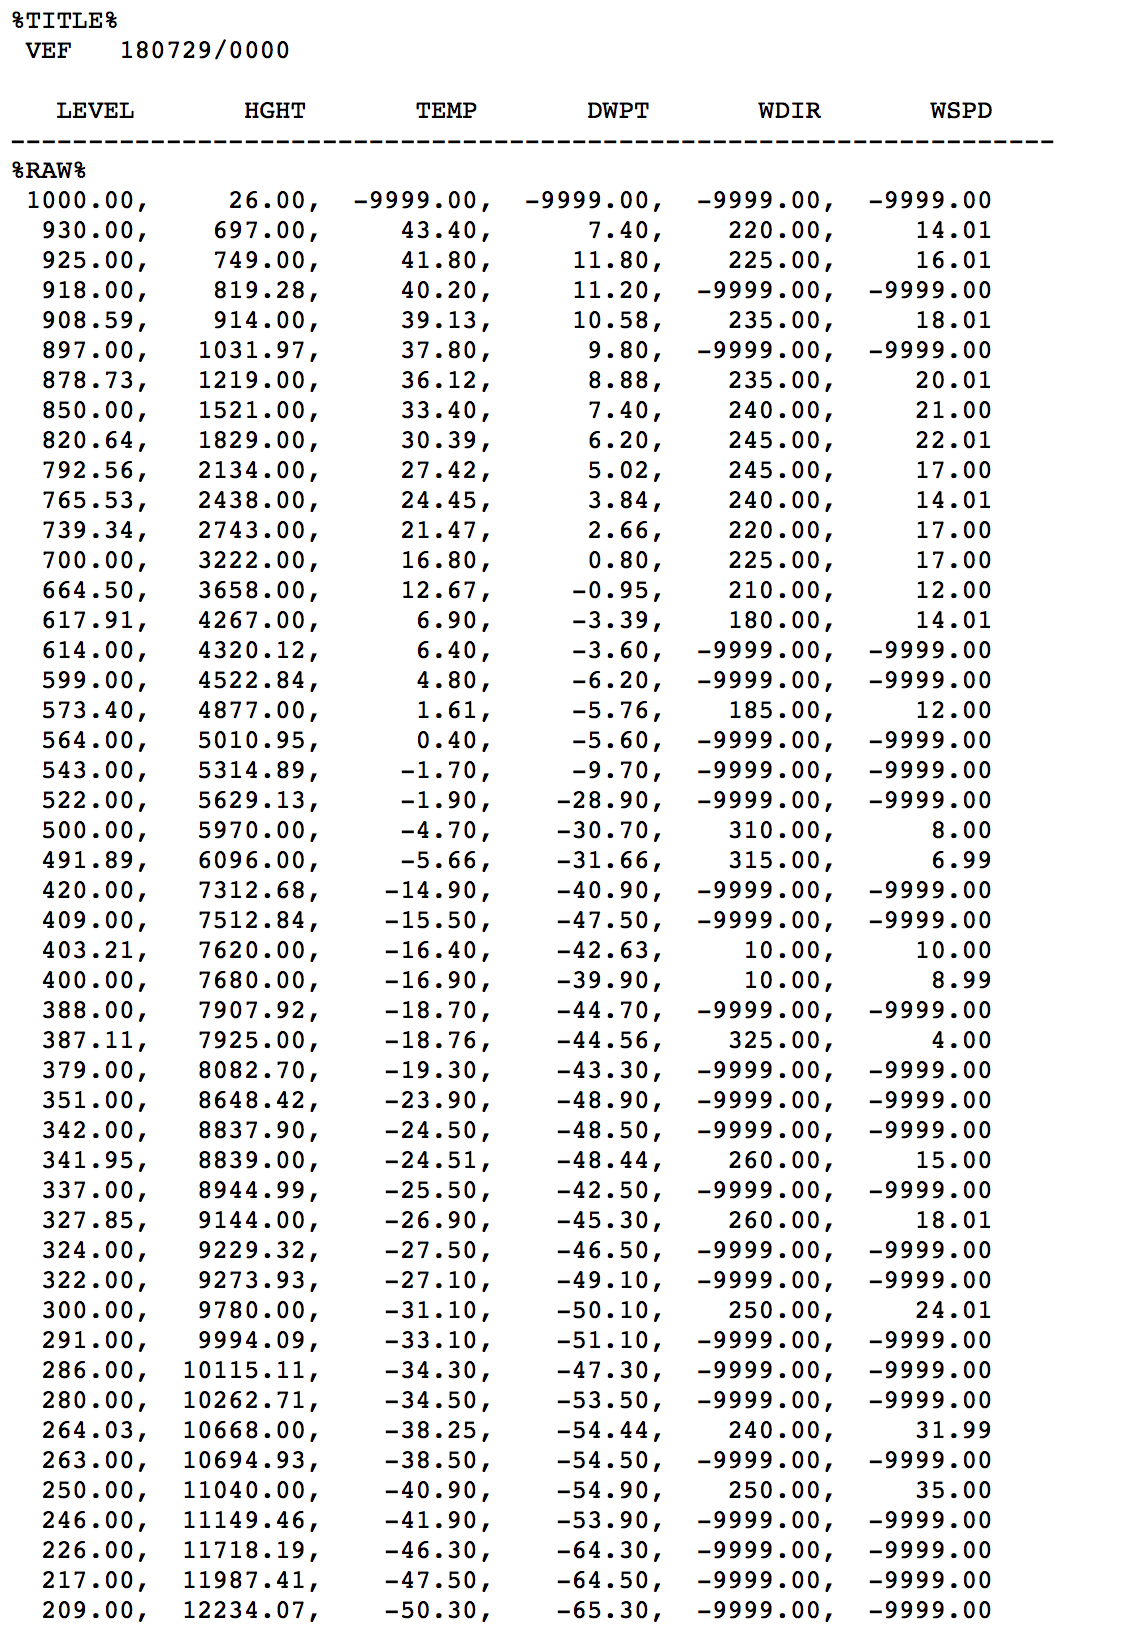
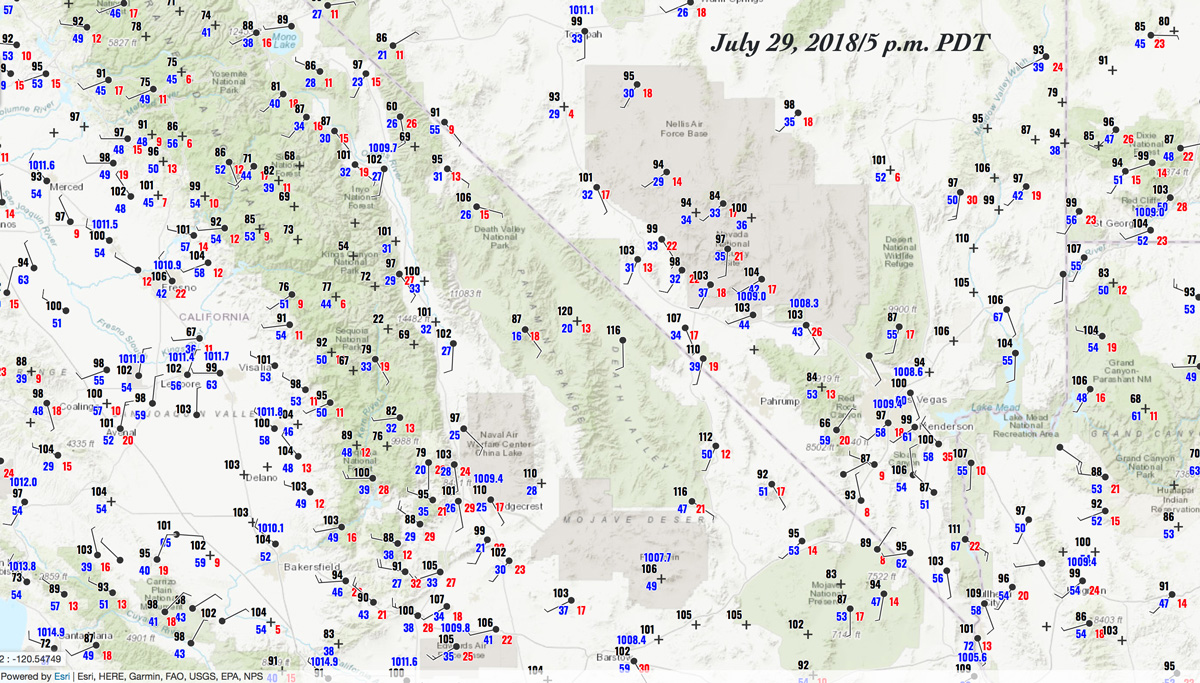
July 29

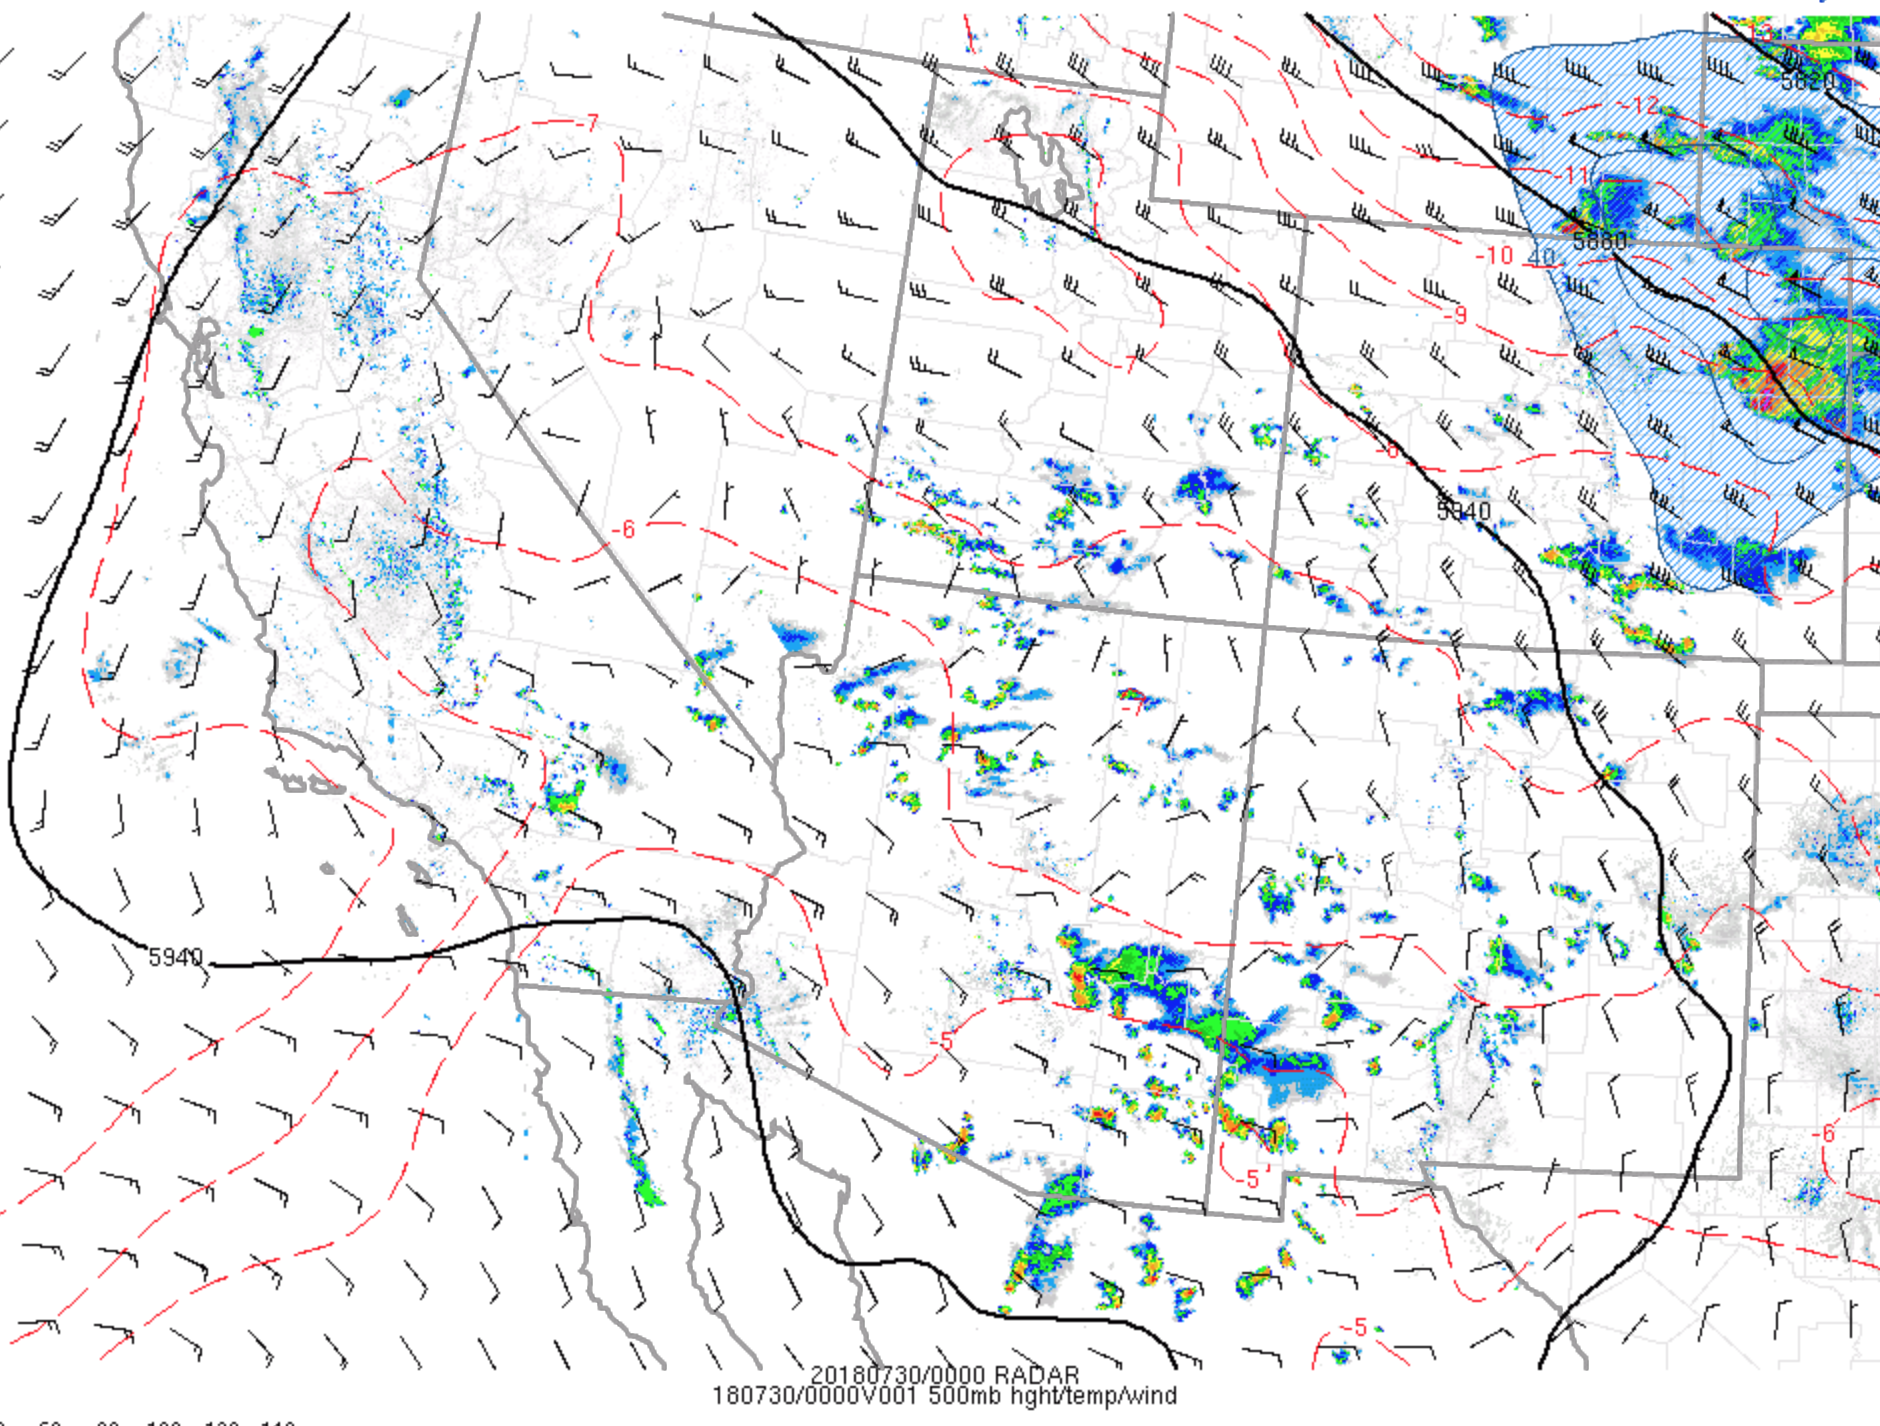
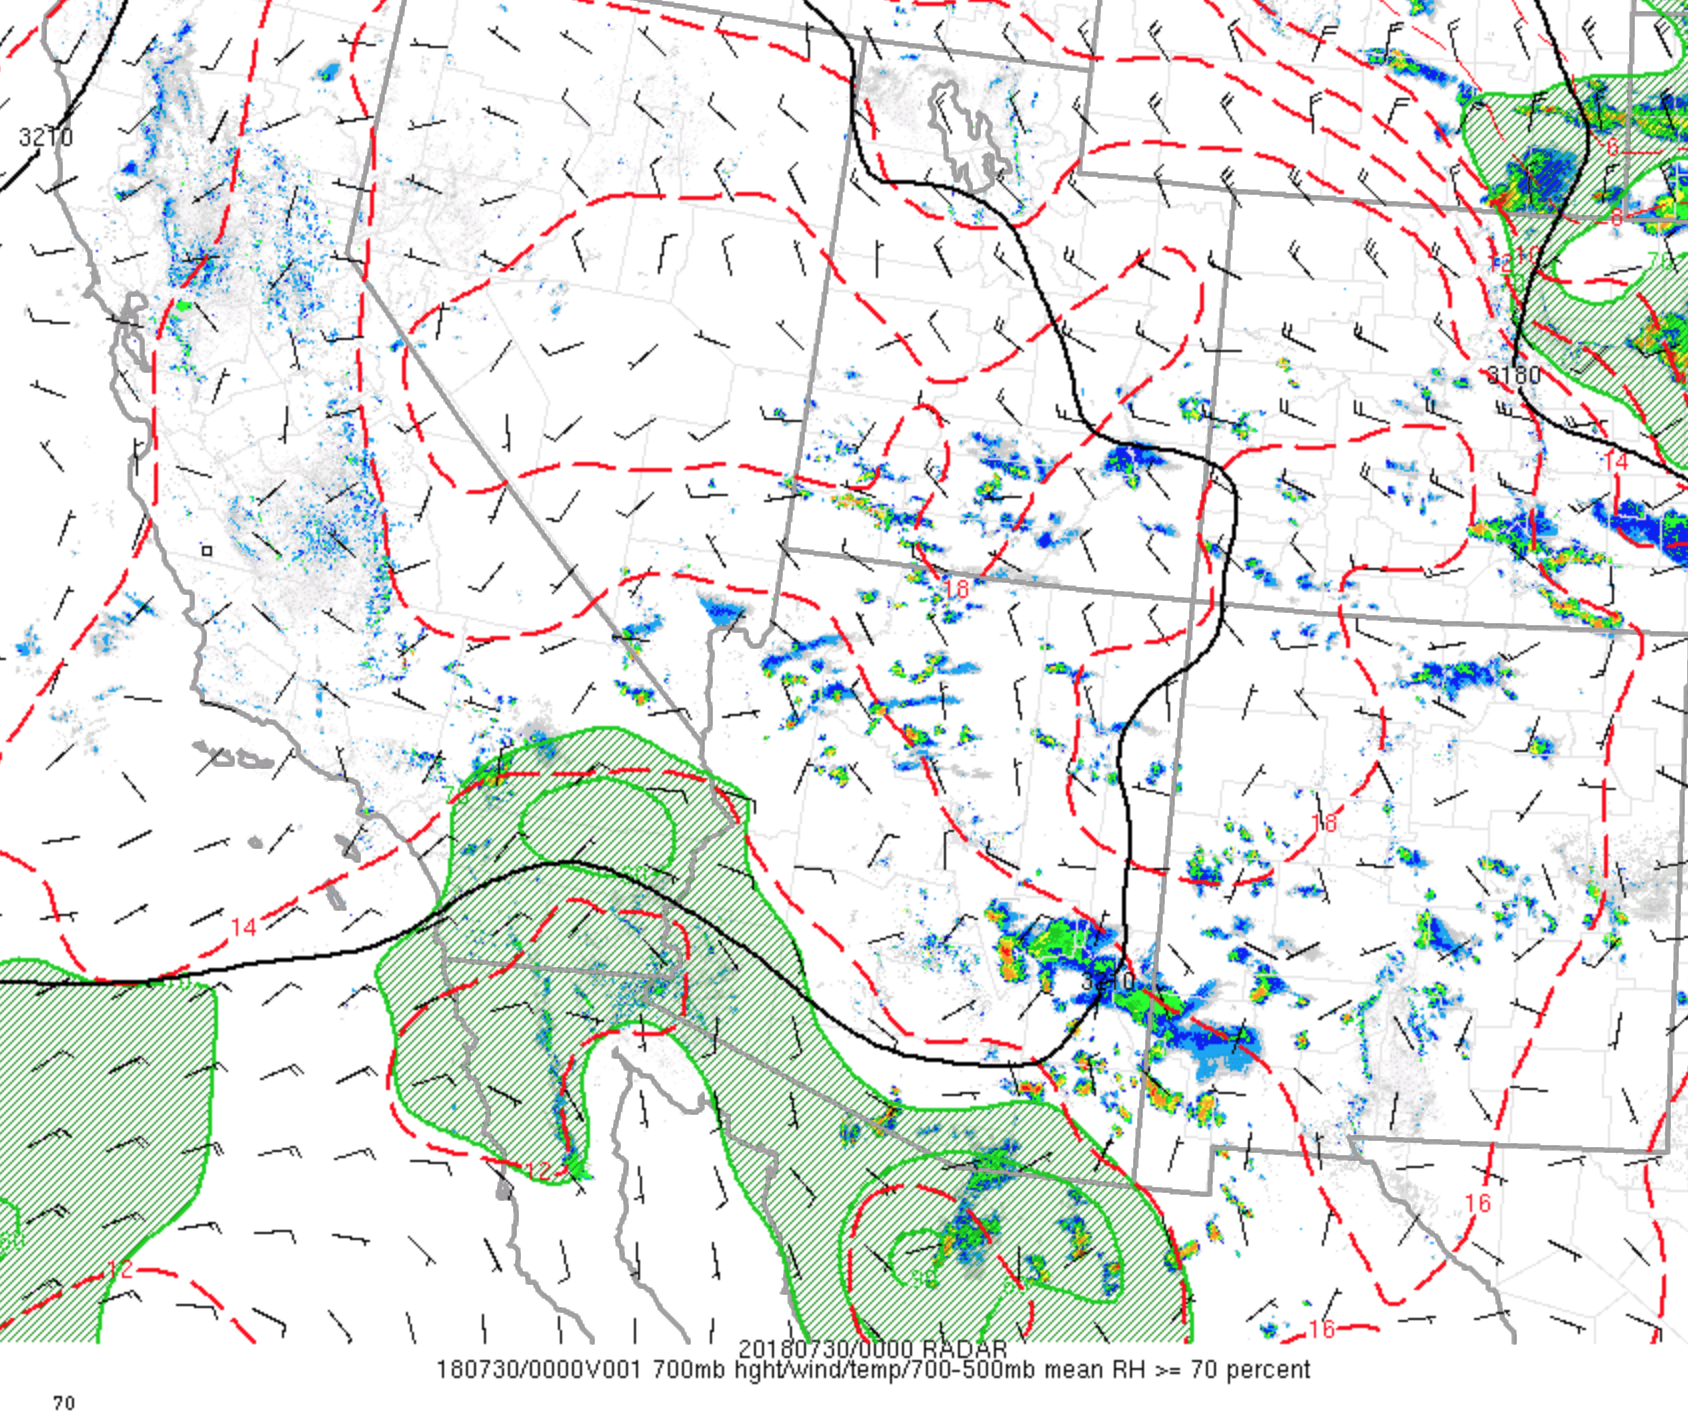
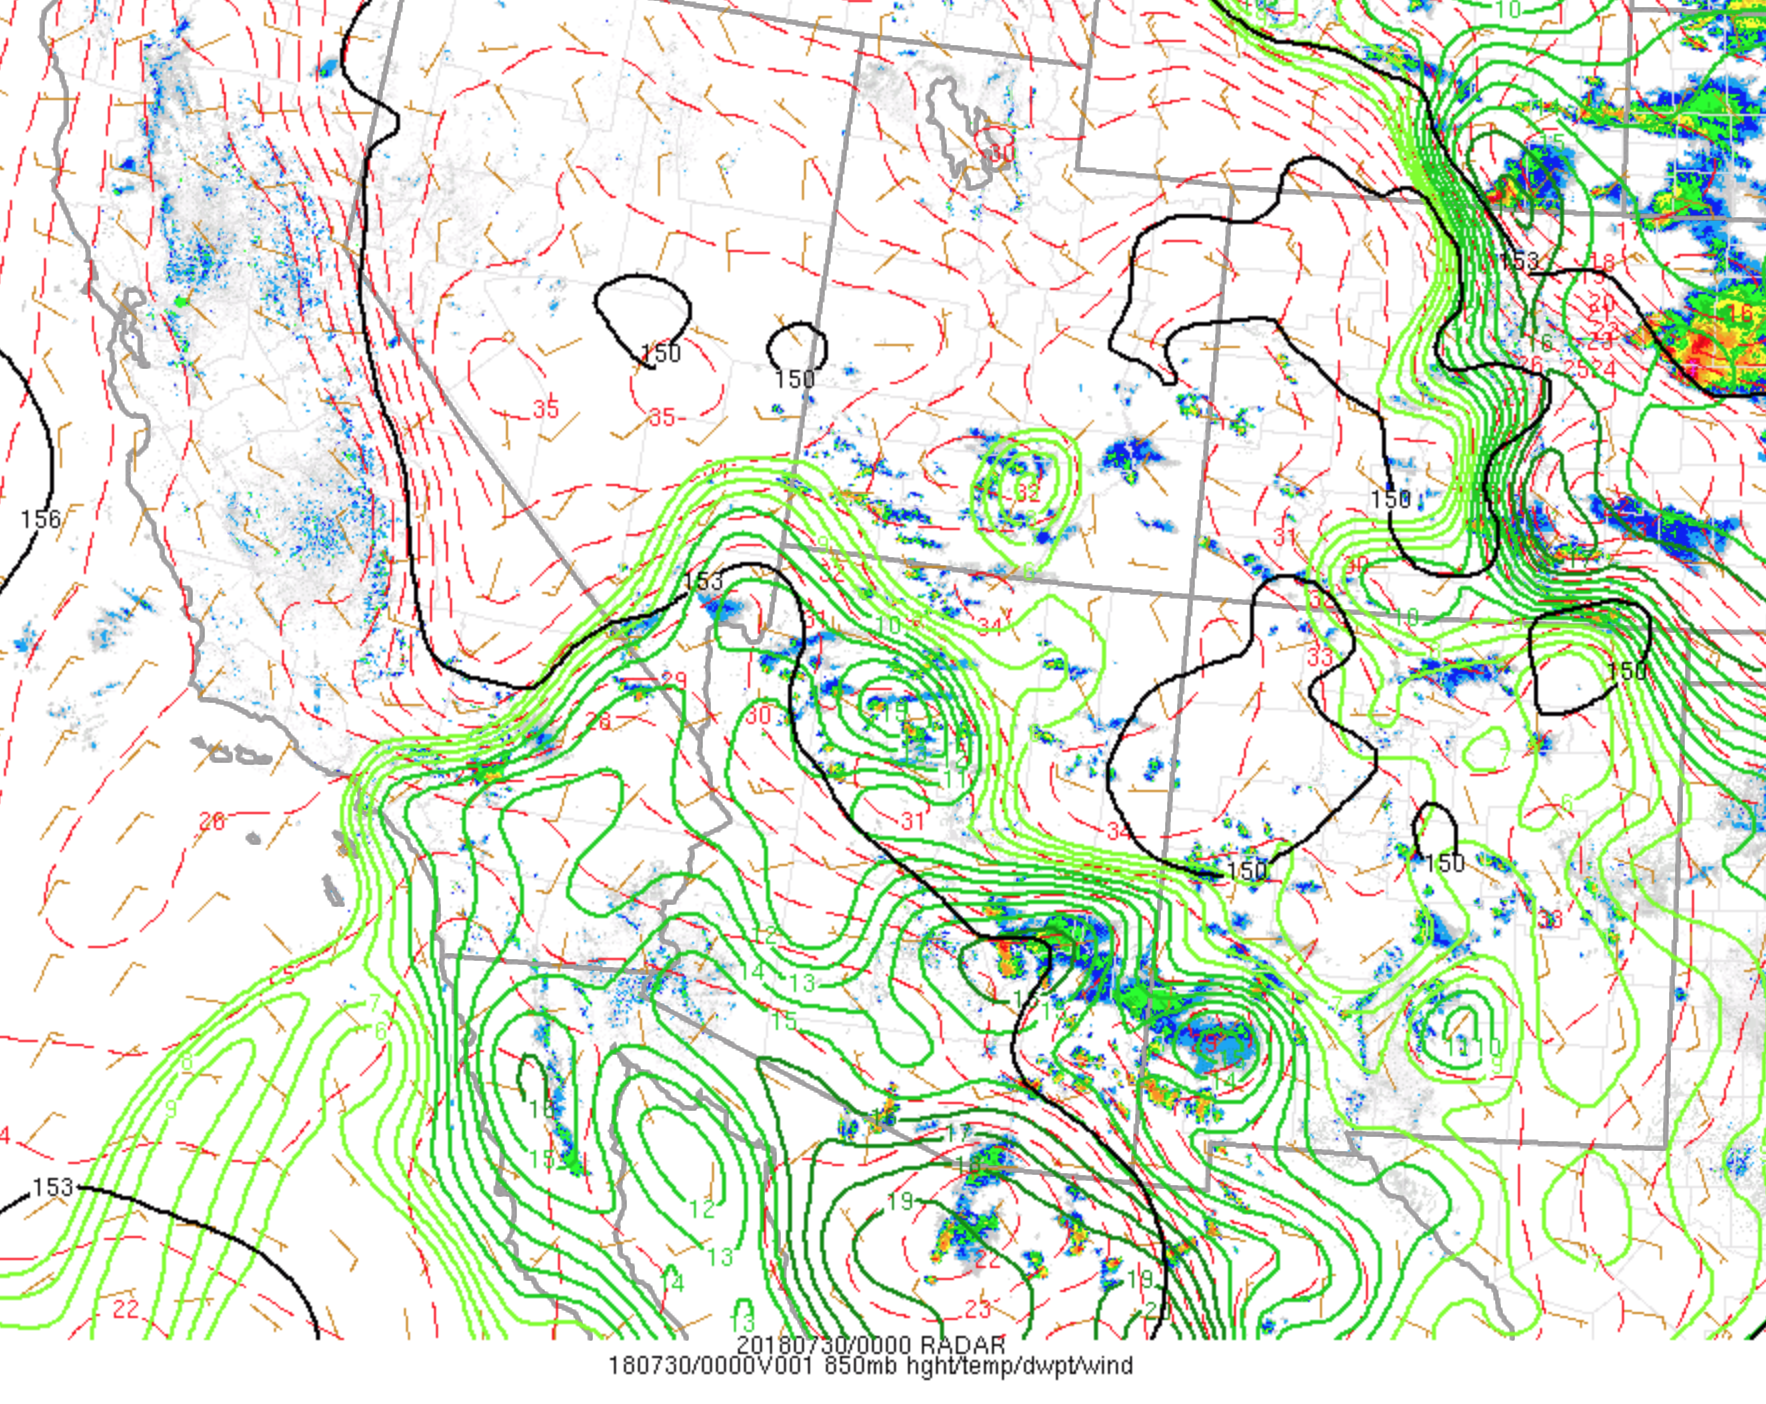
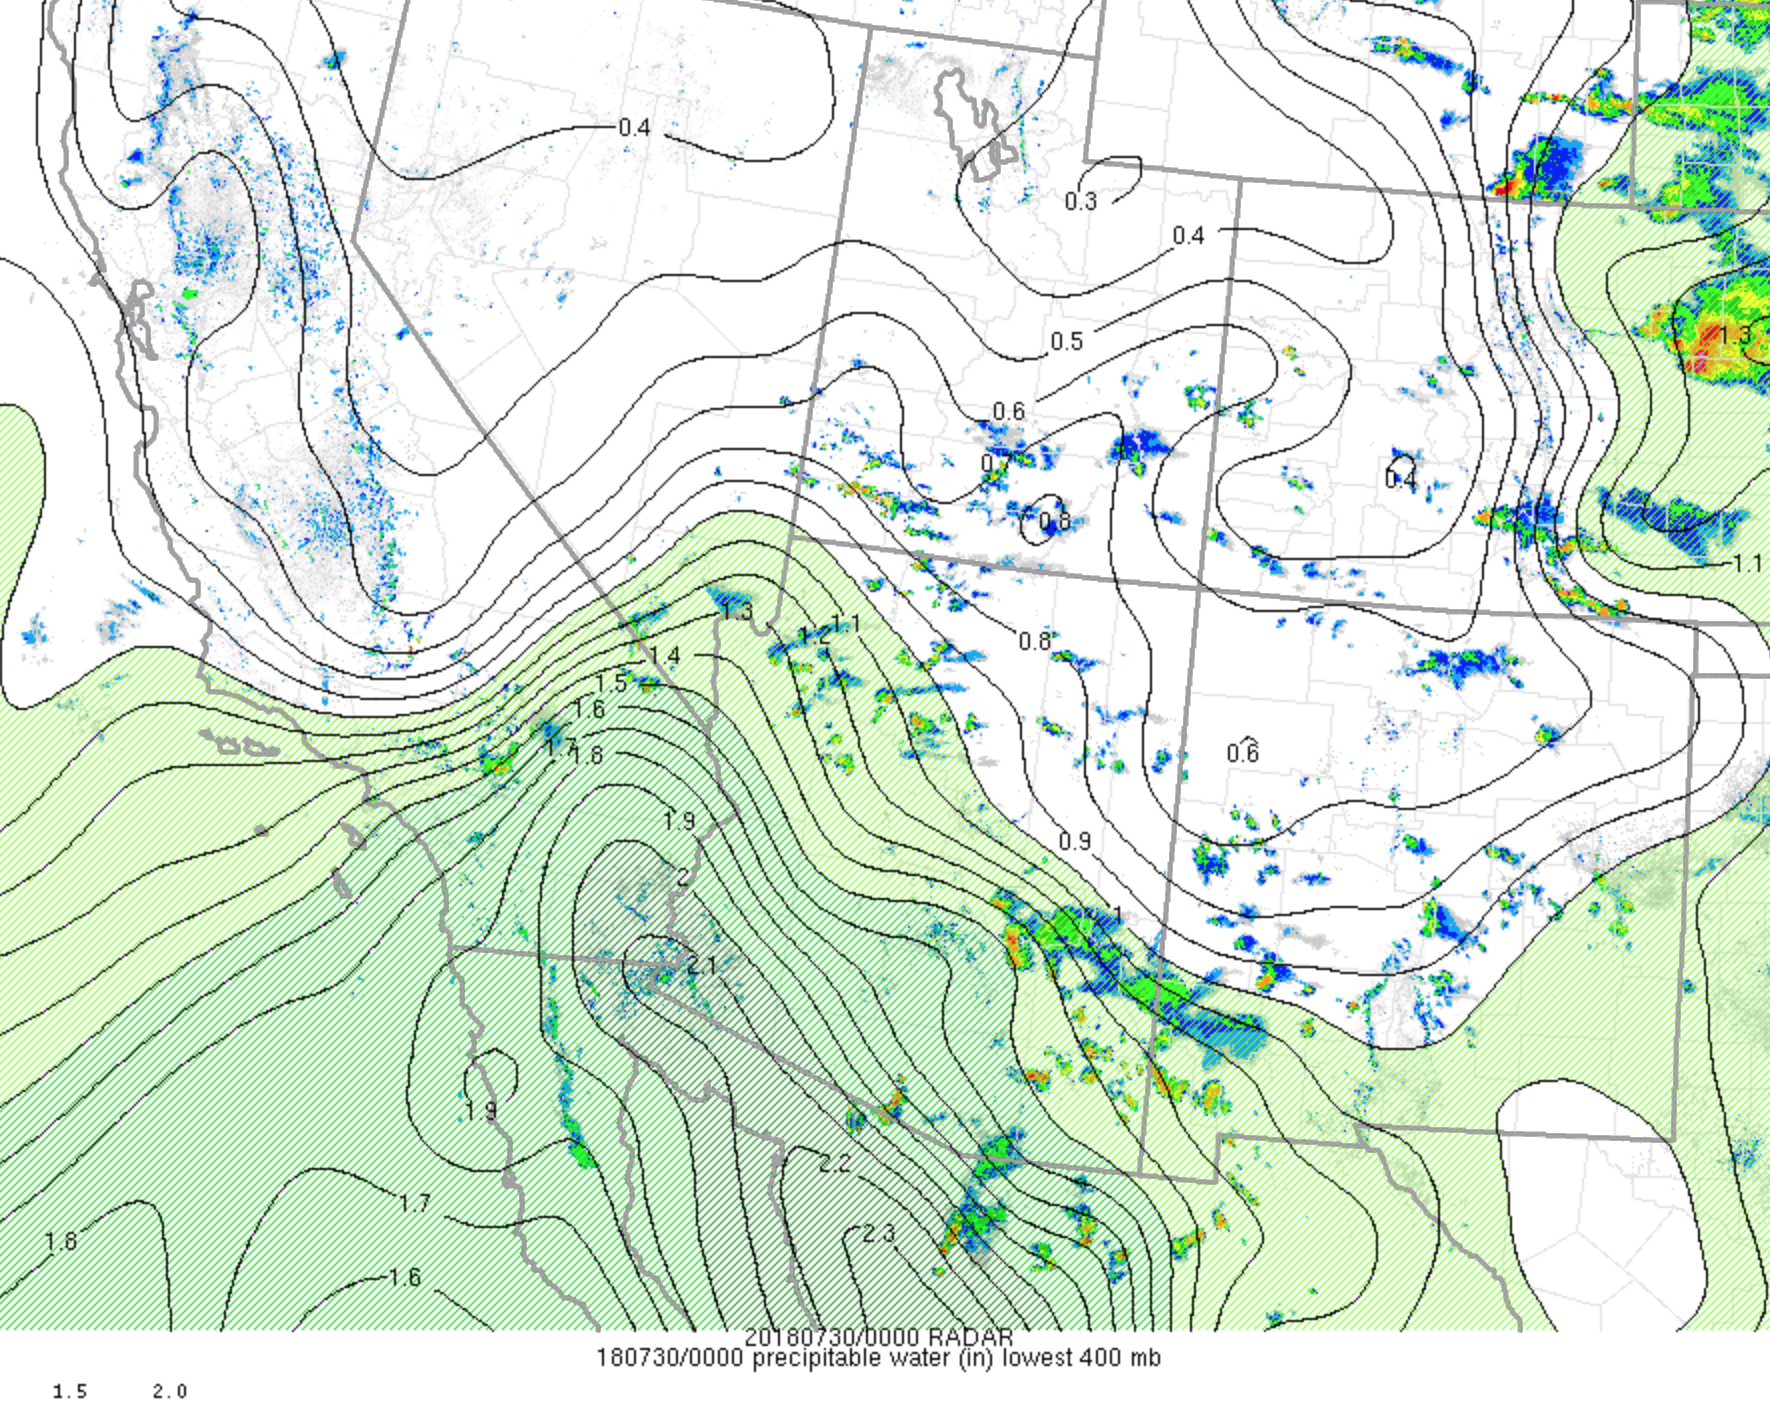


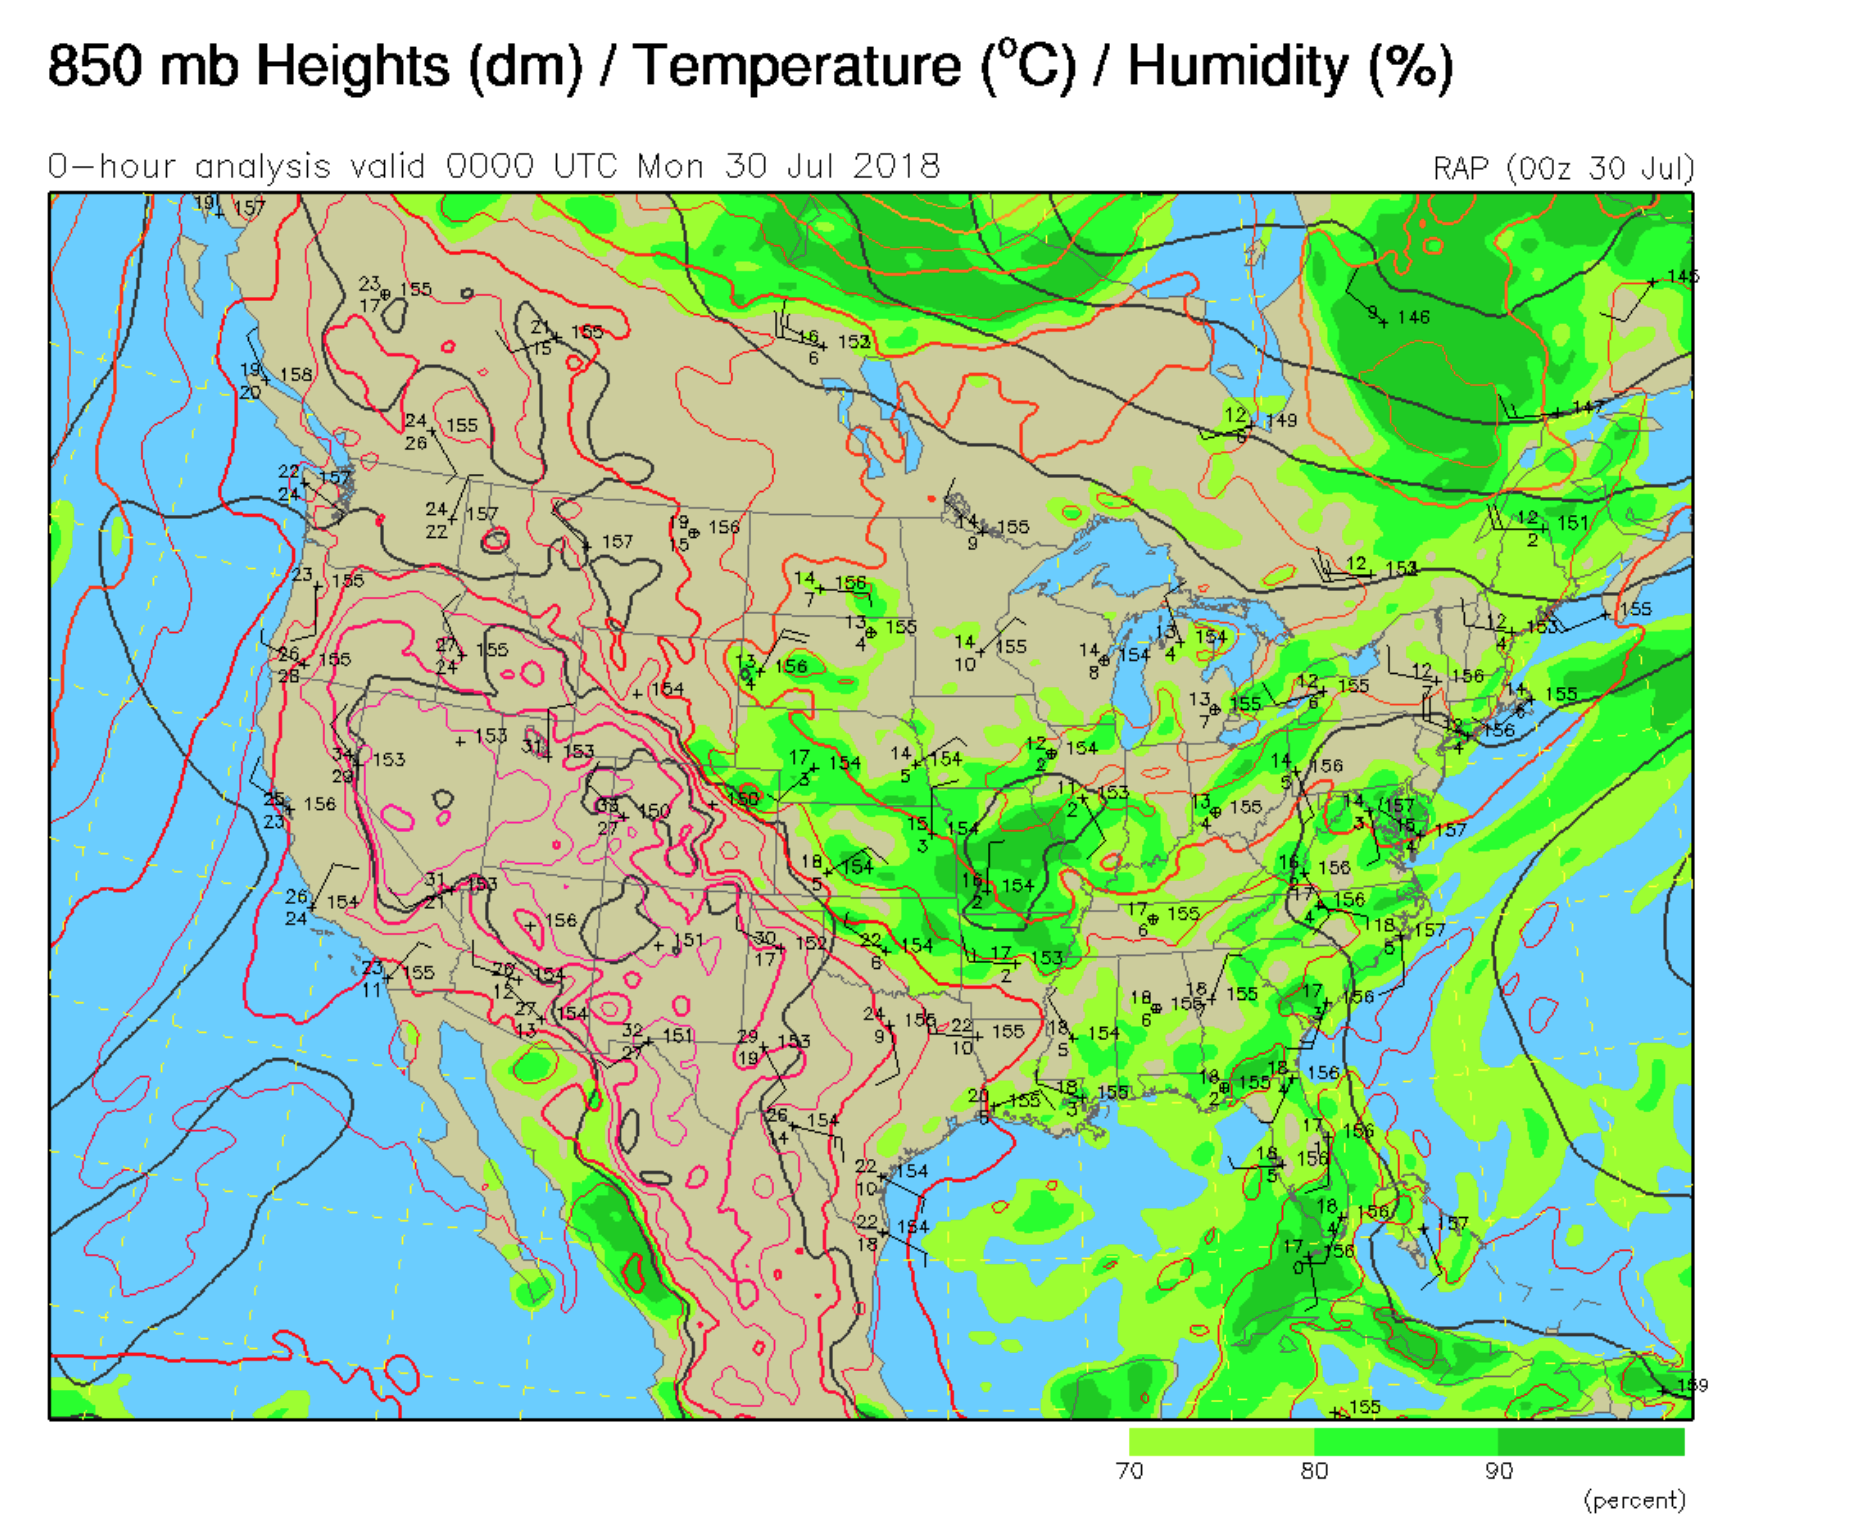

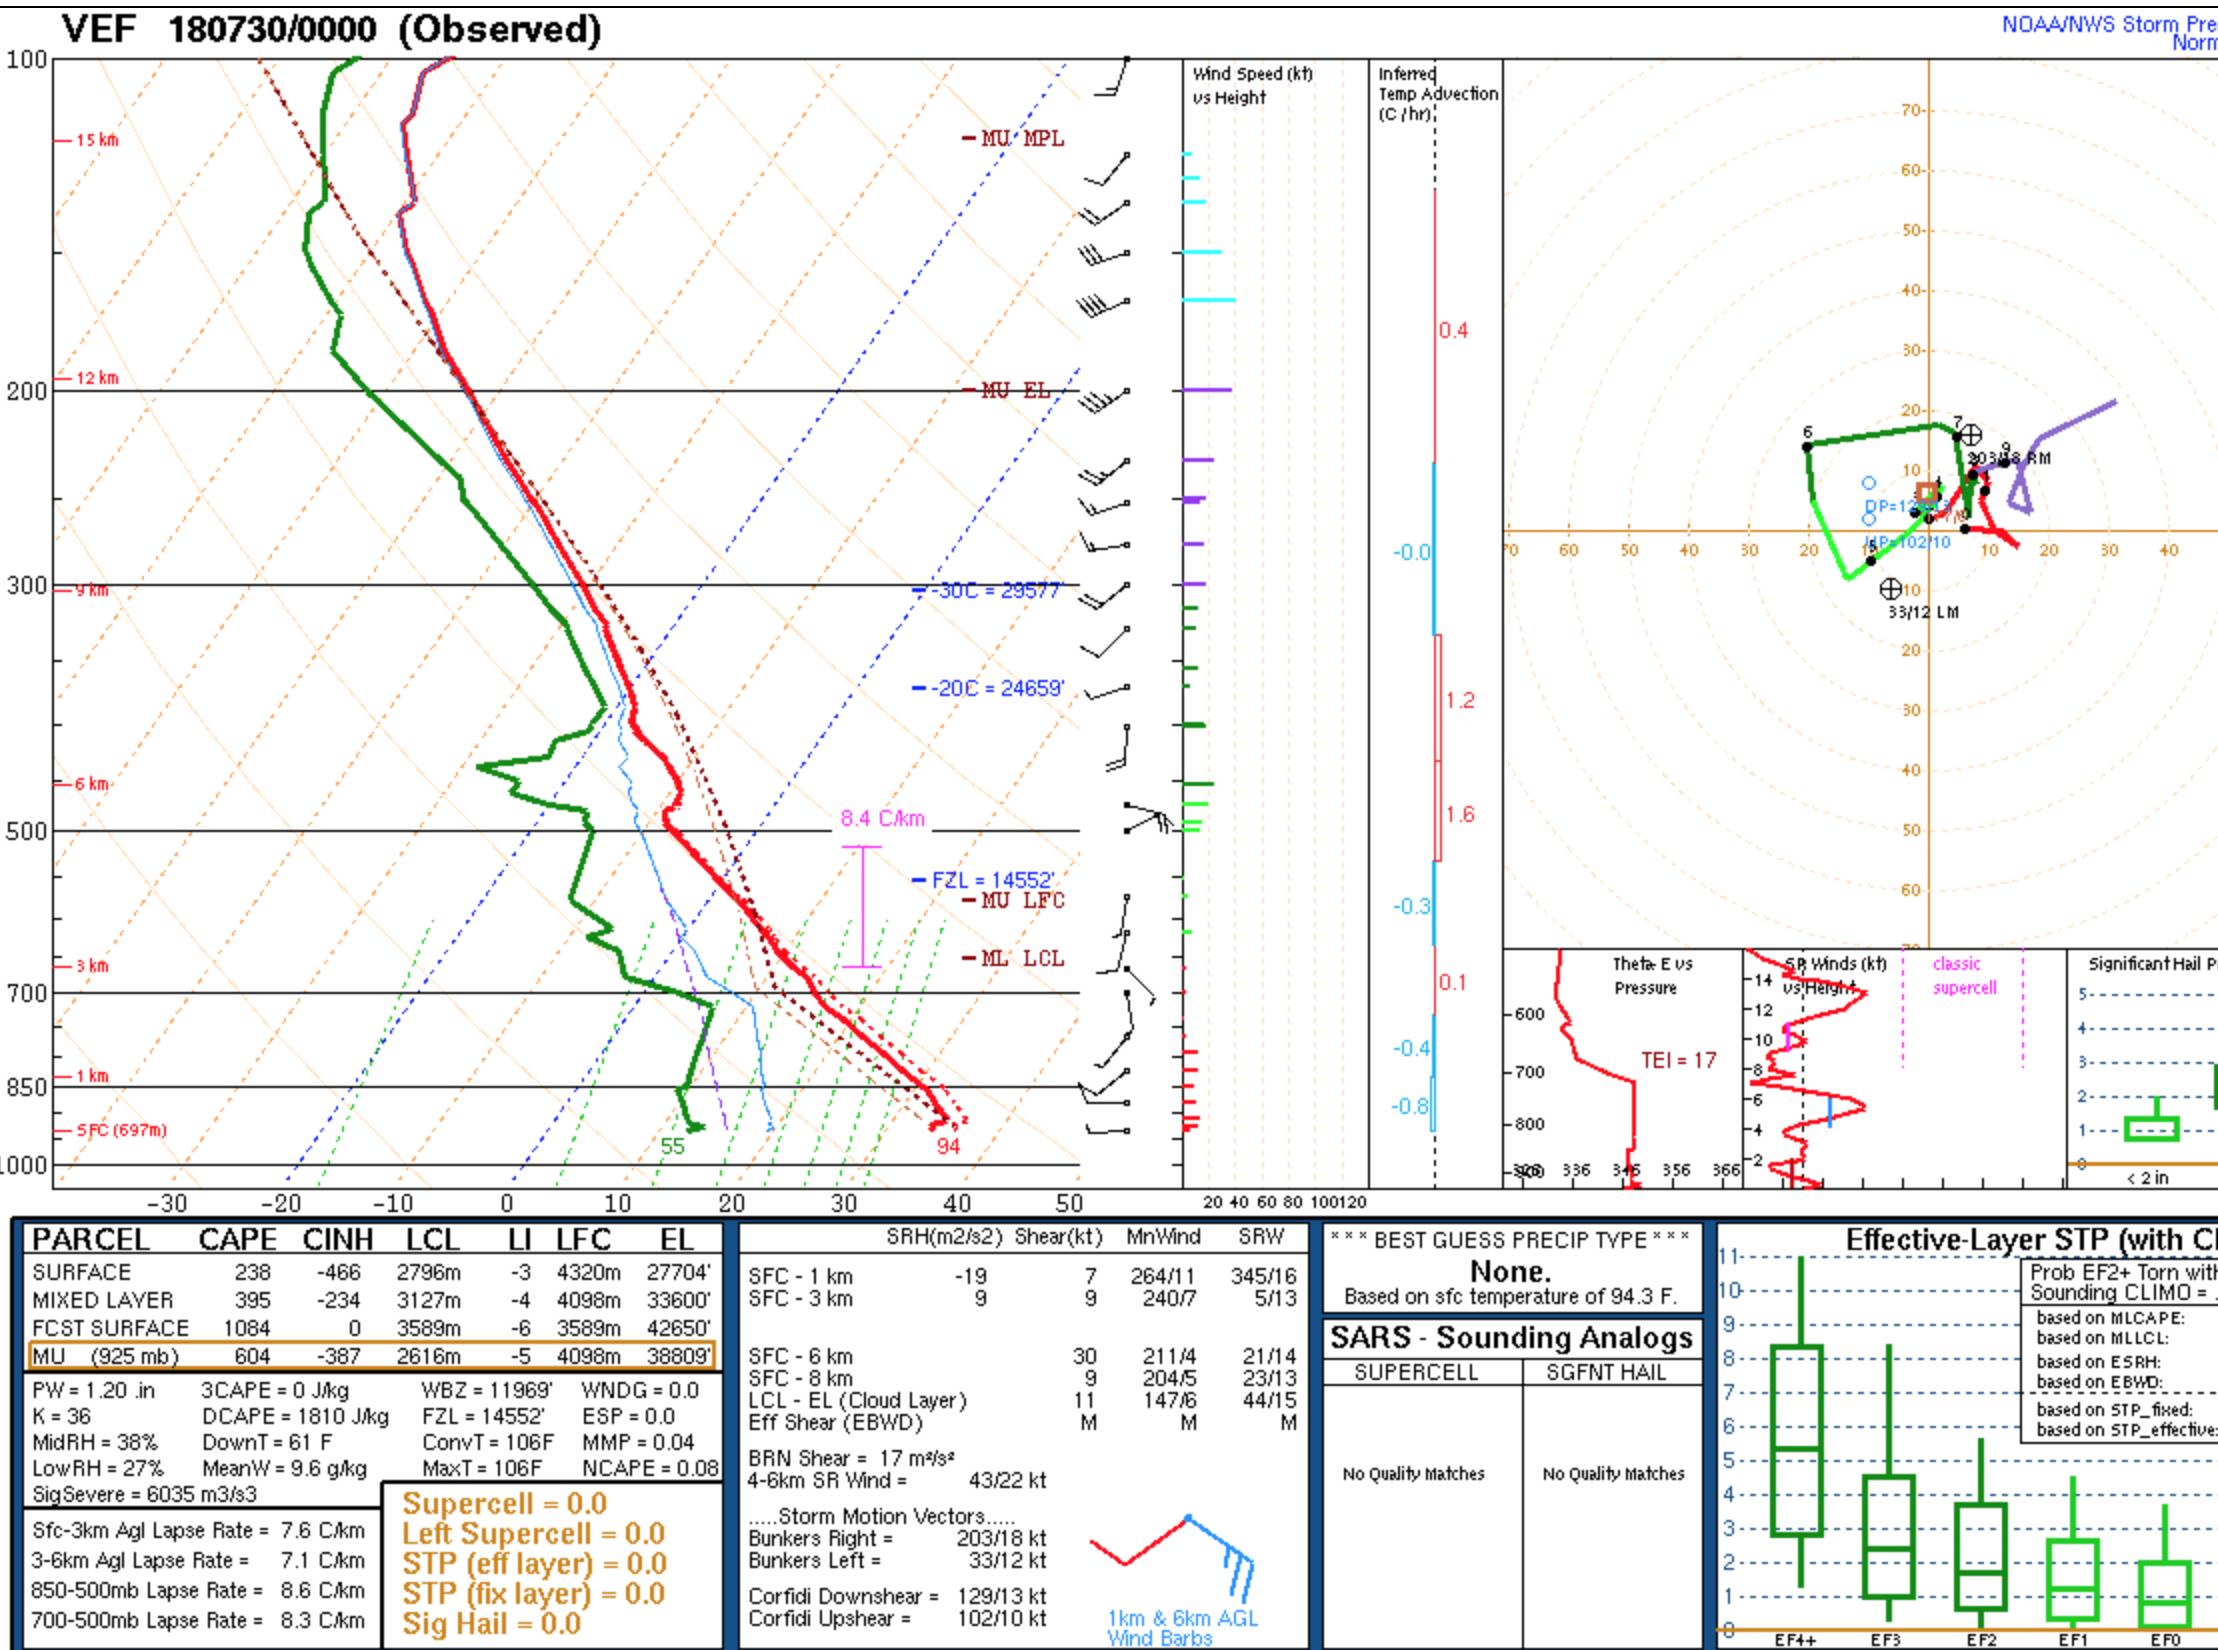

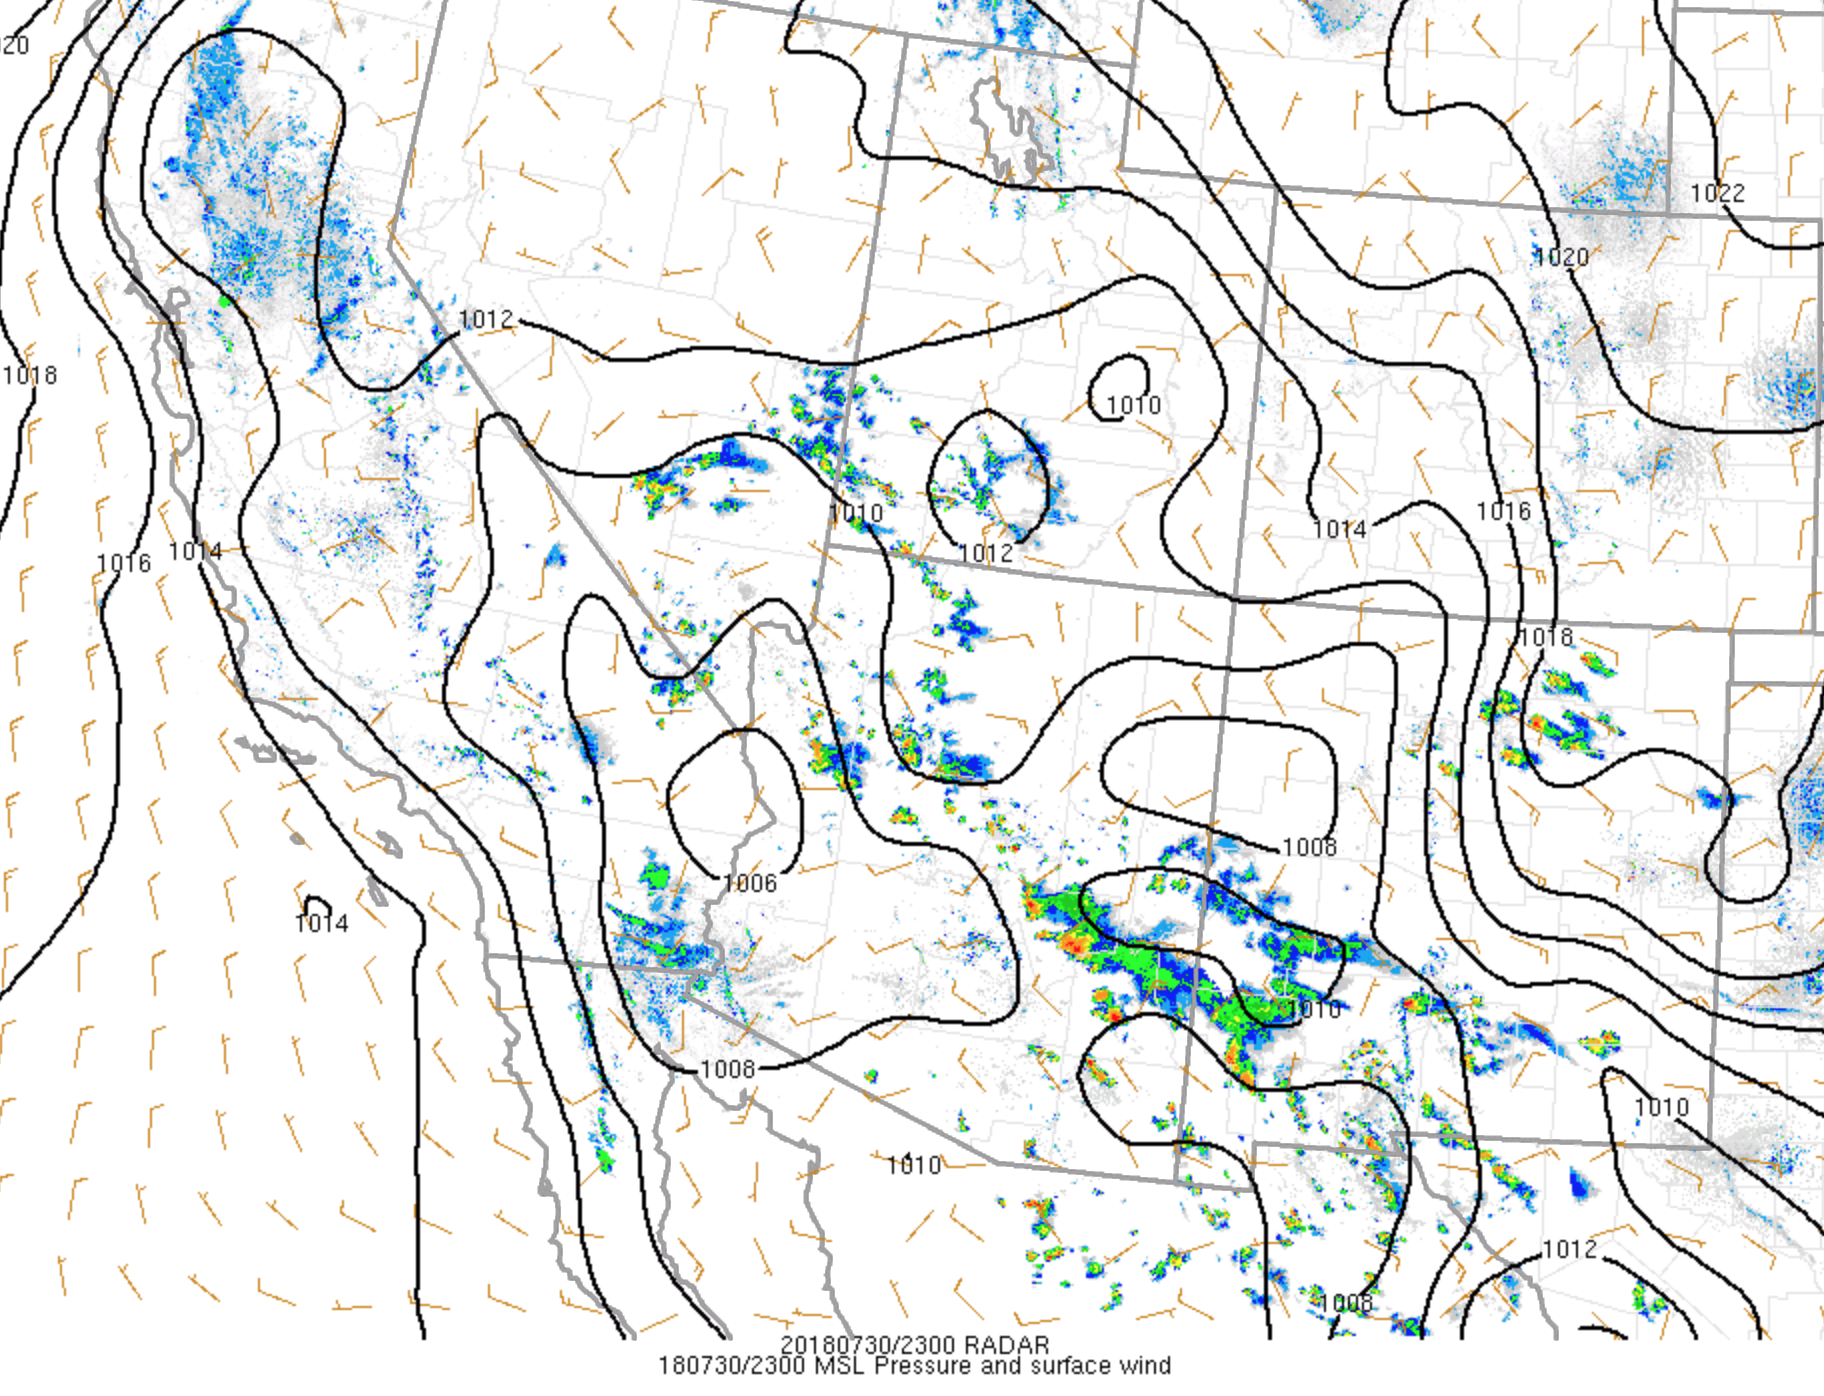
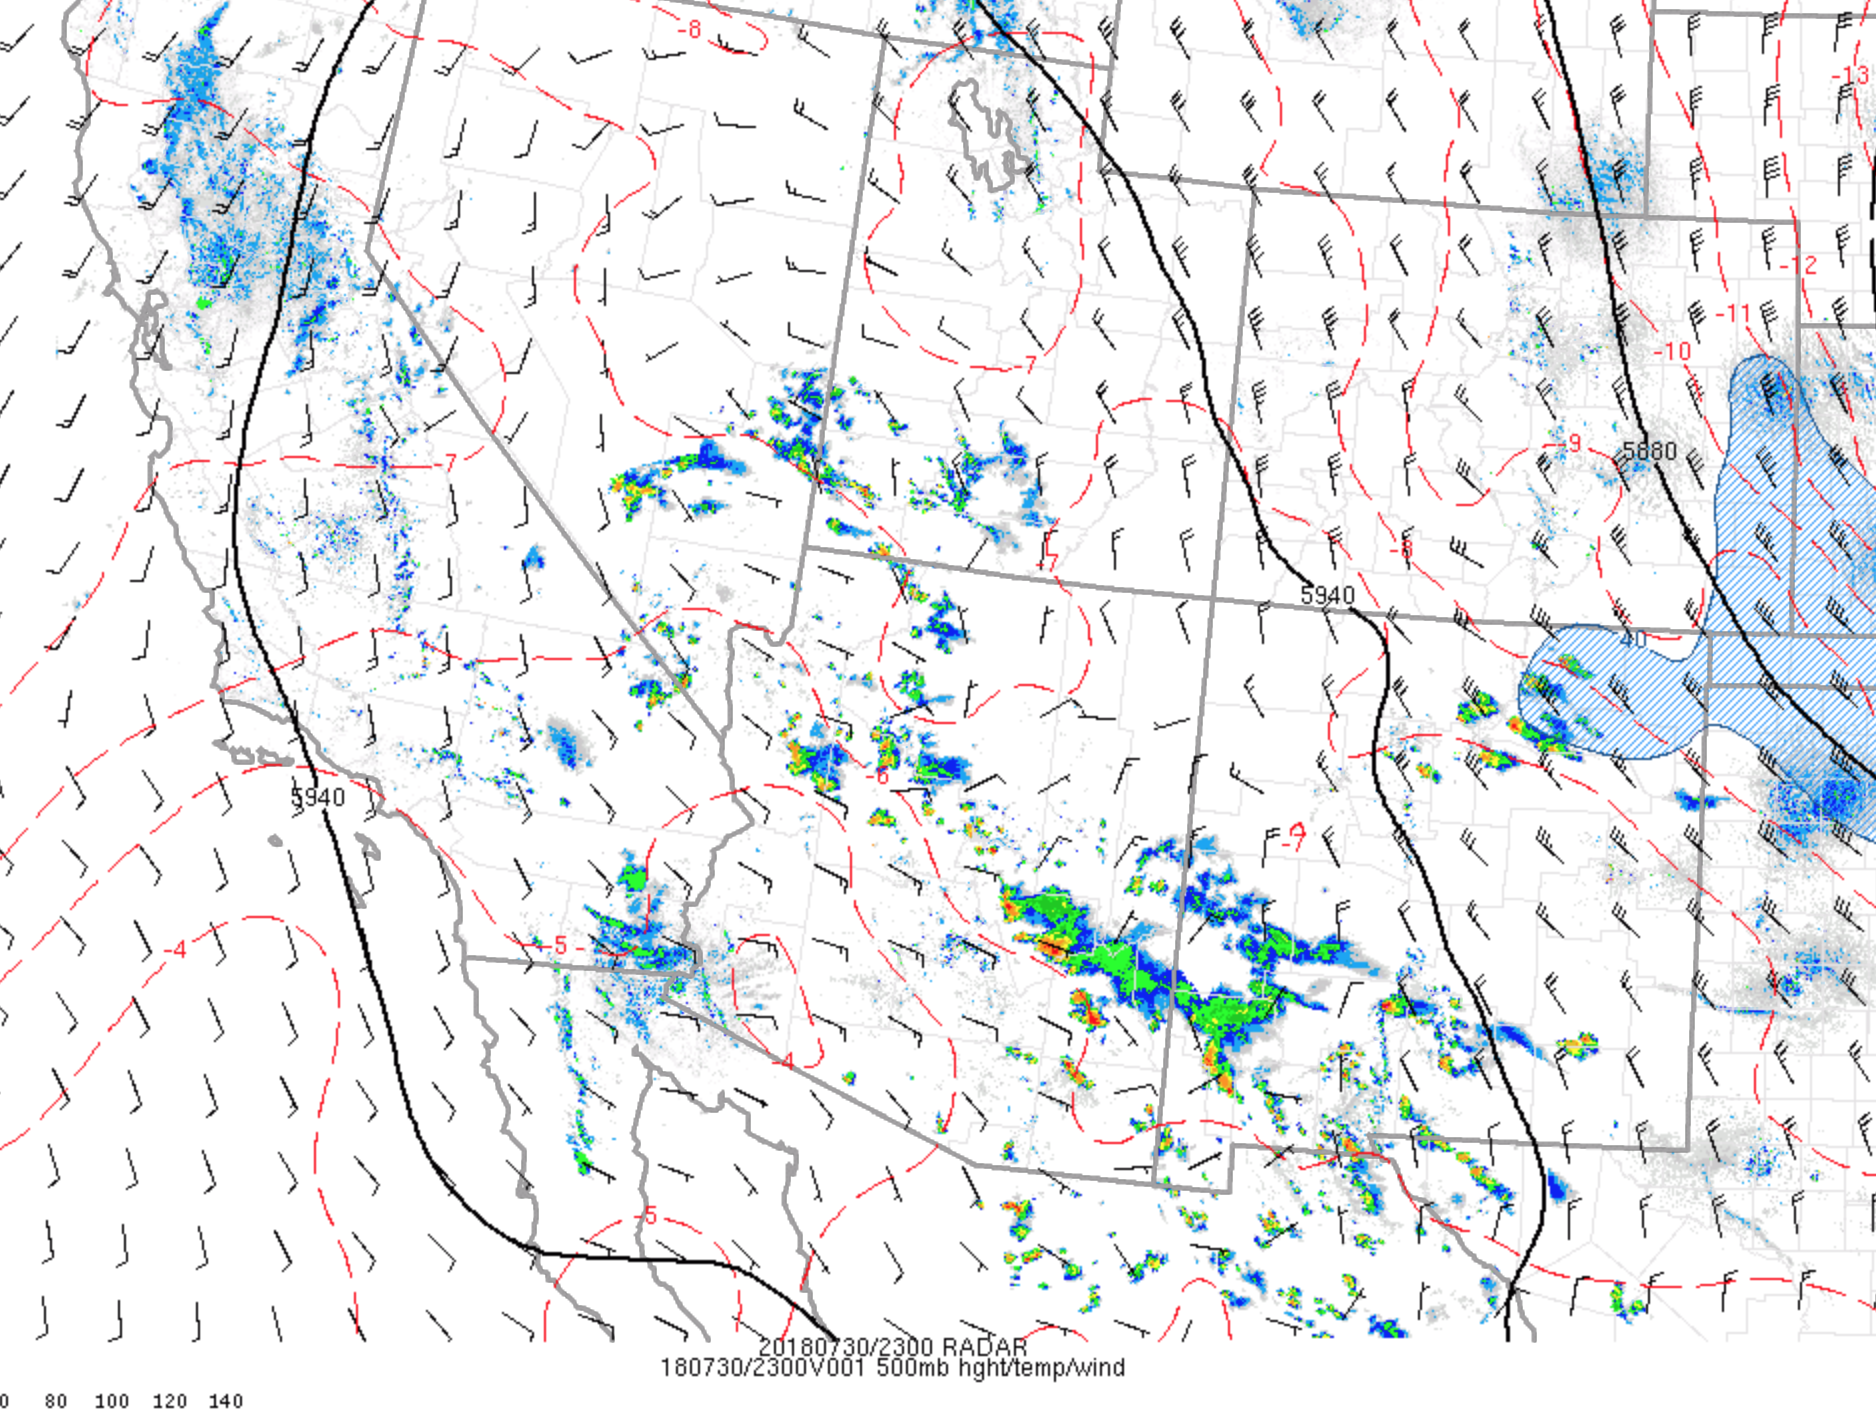
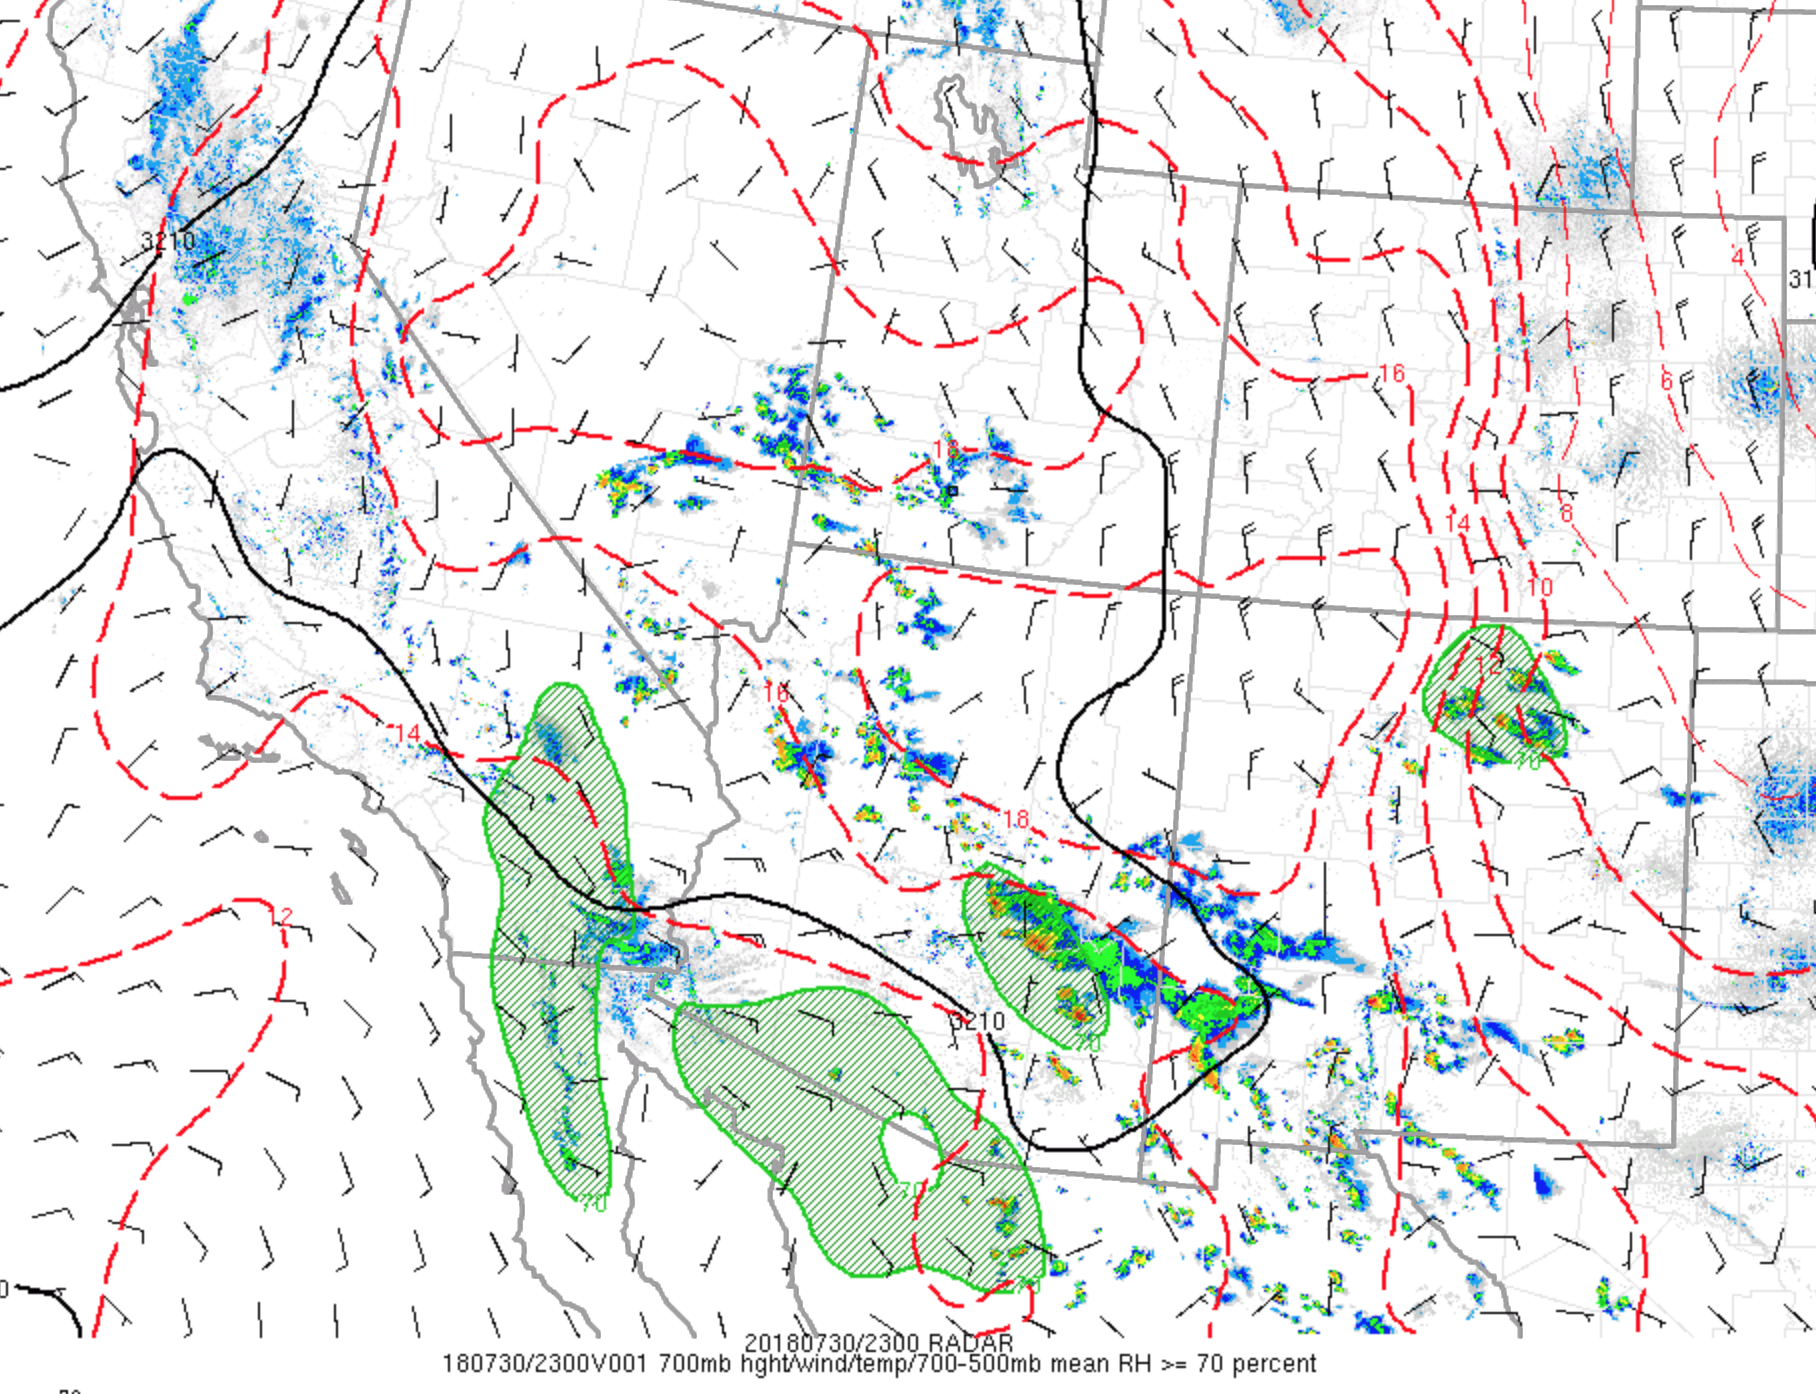
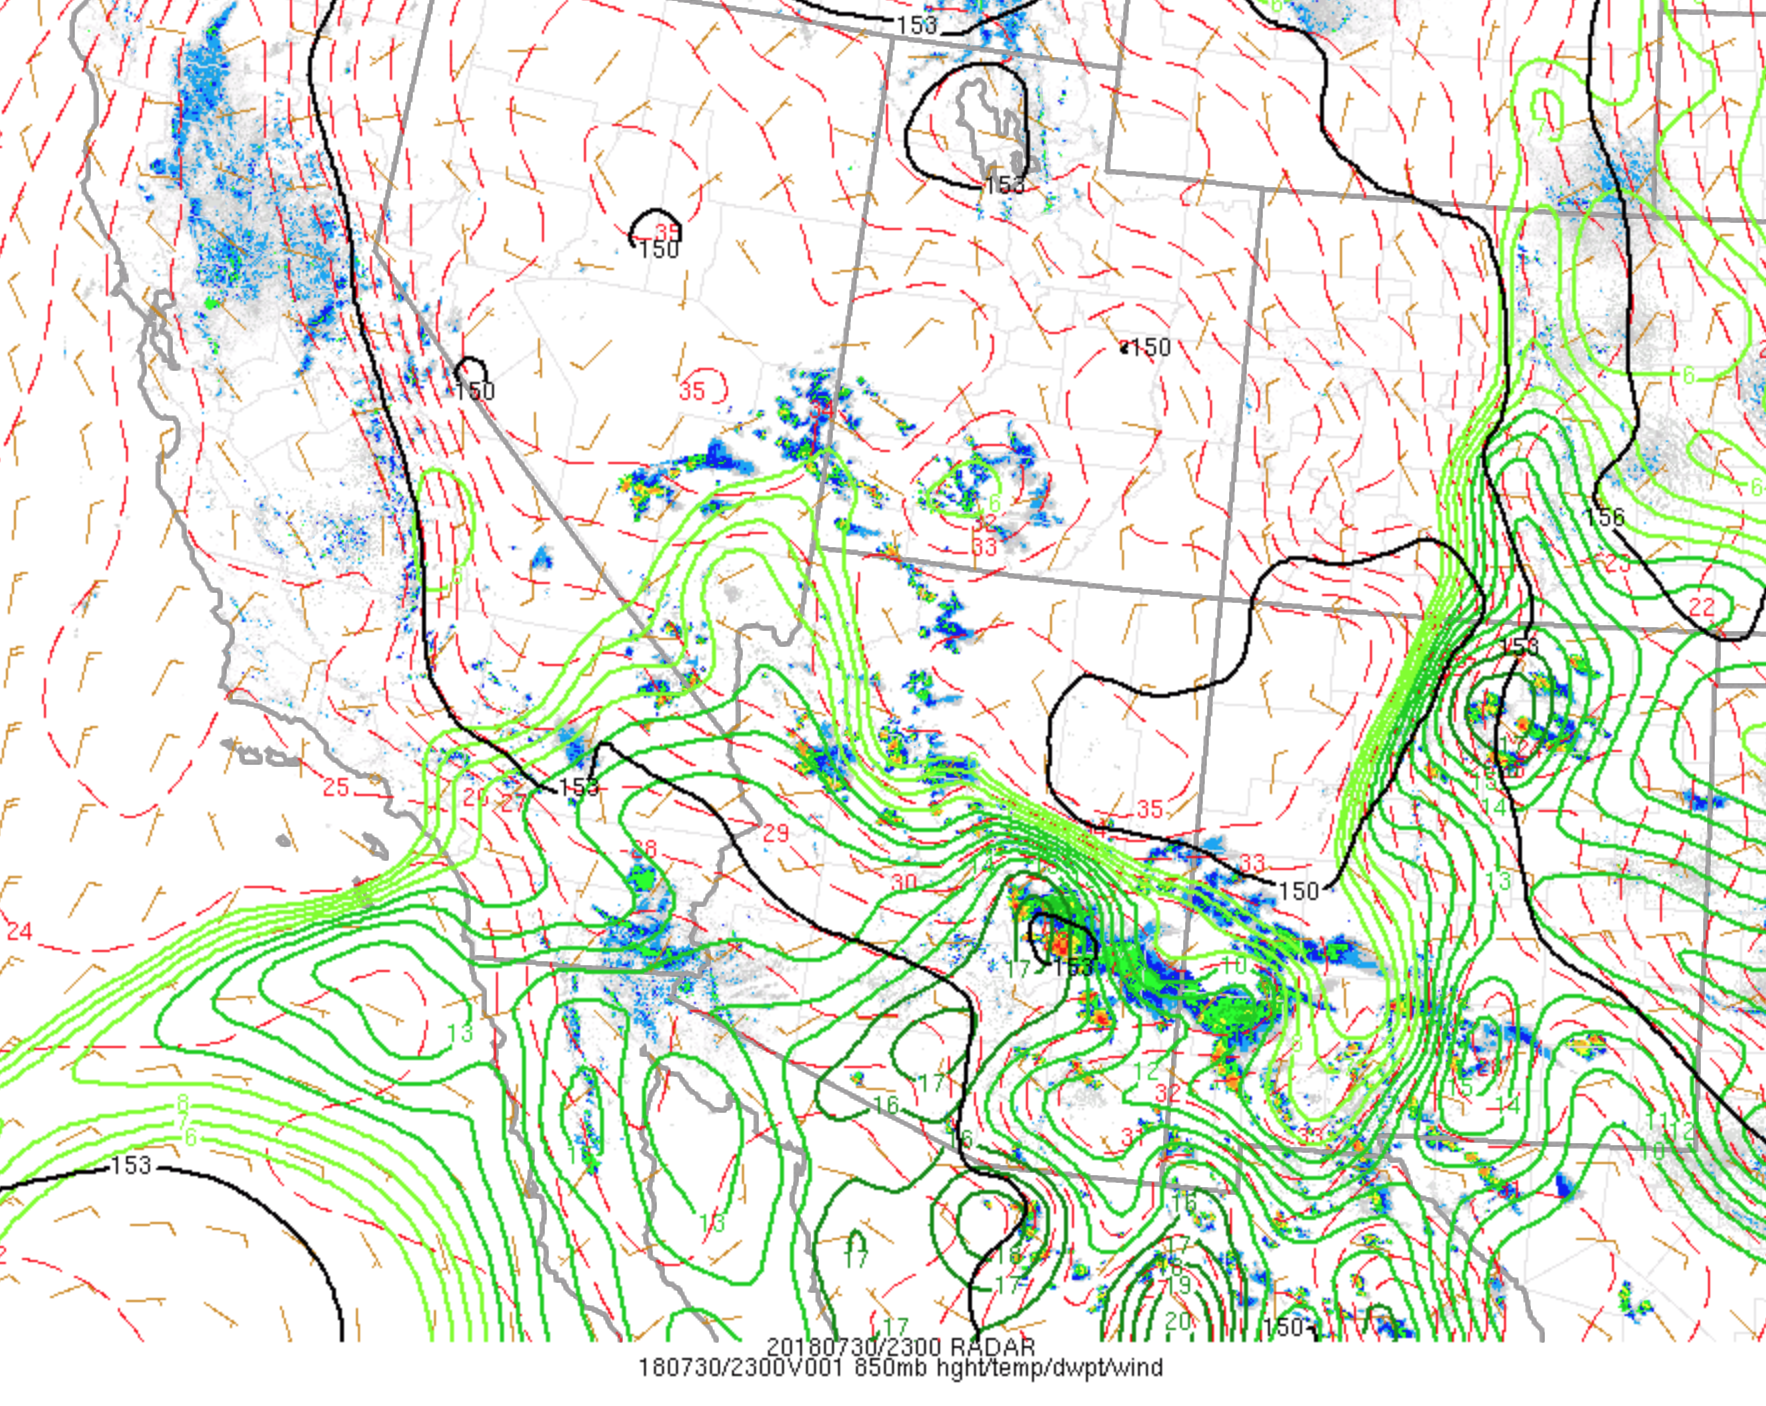
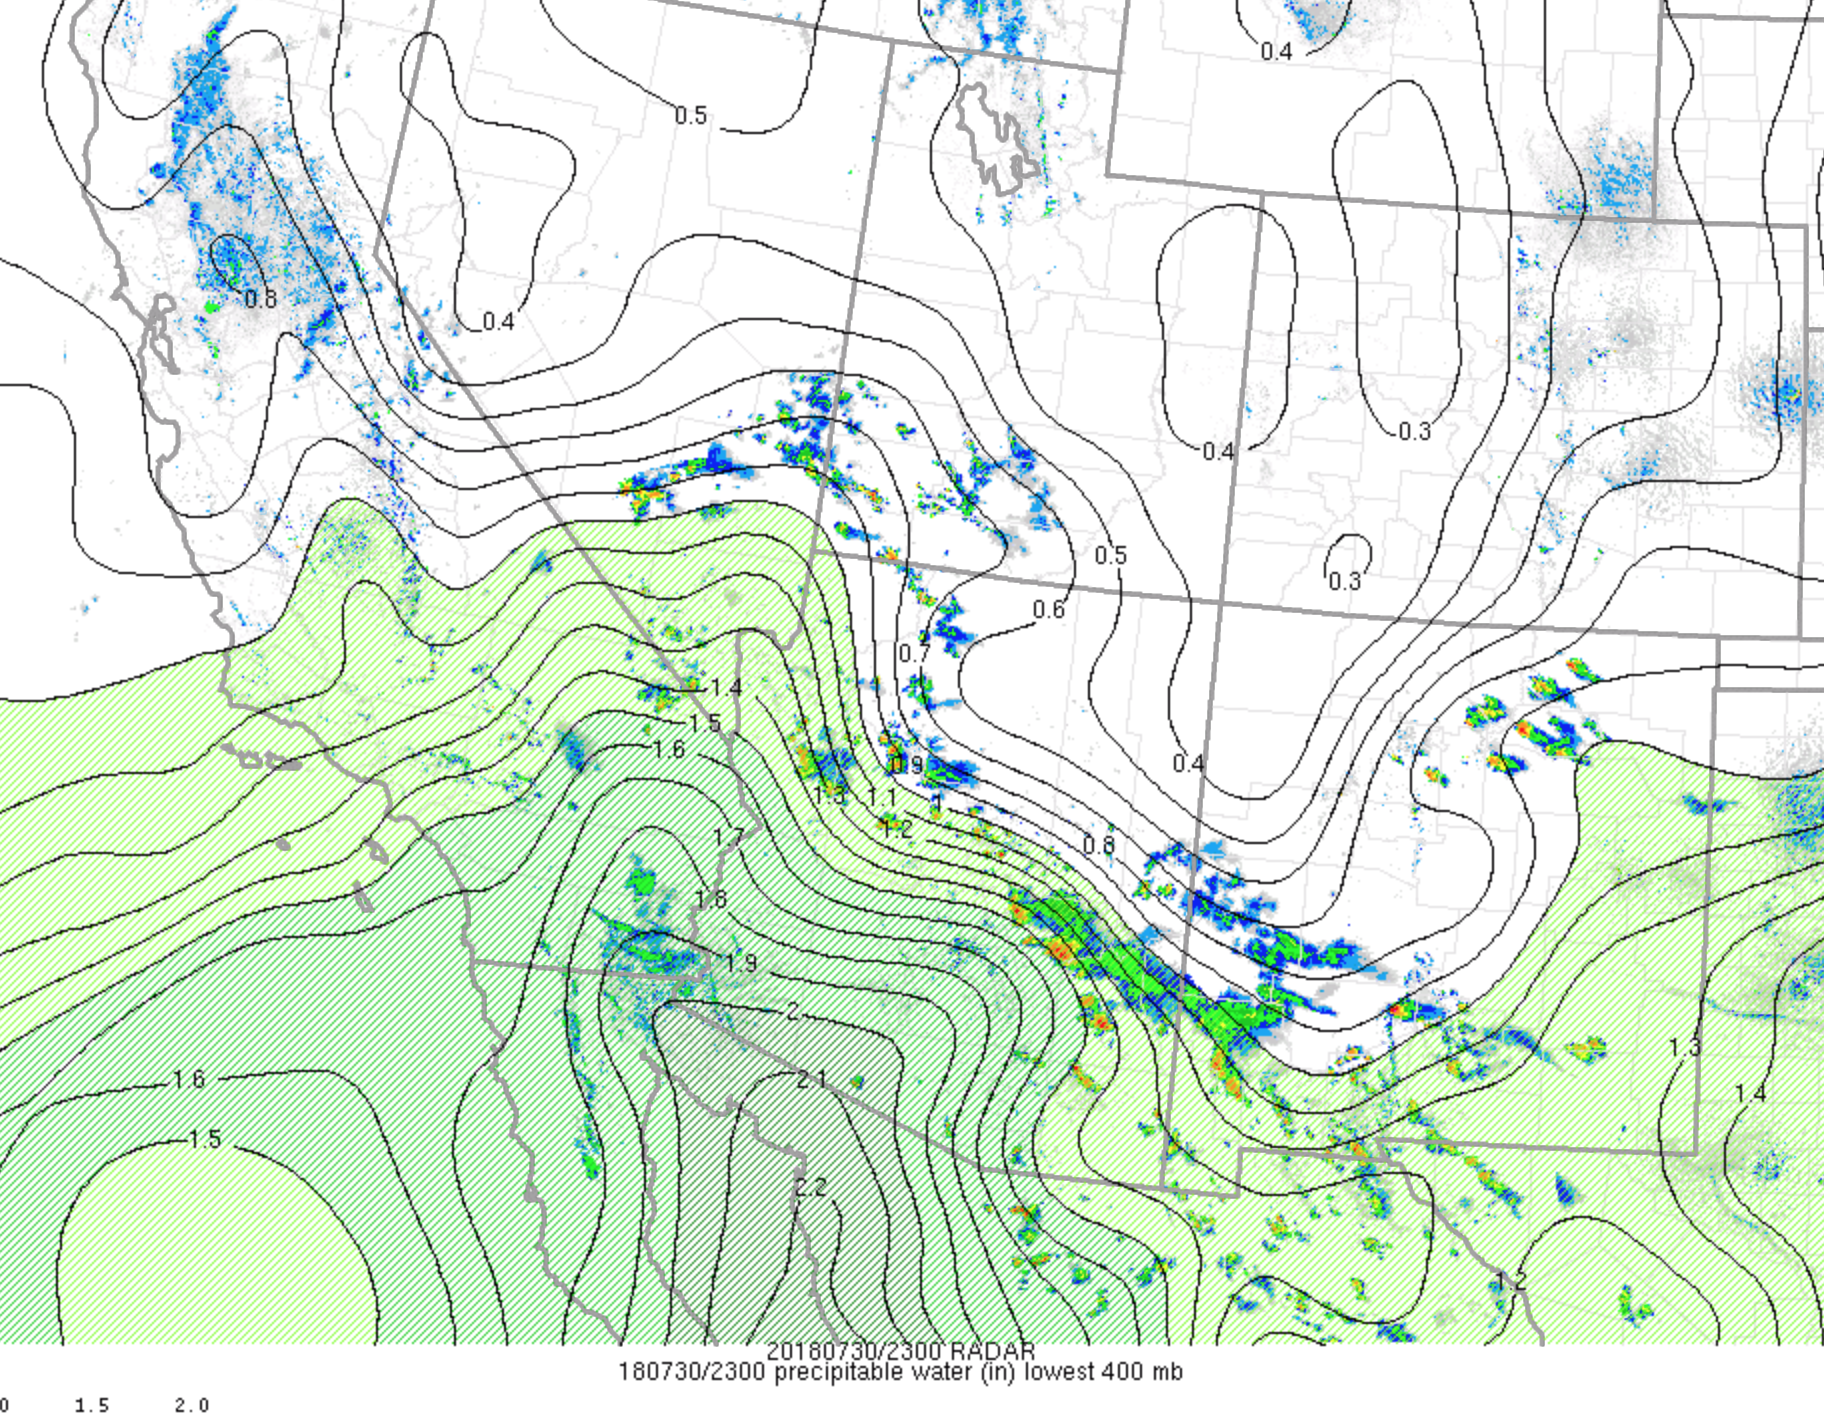
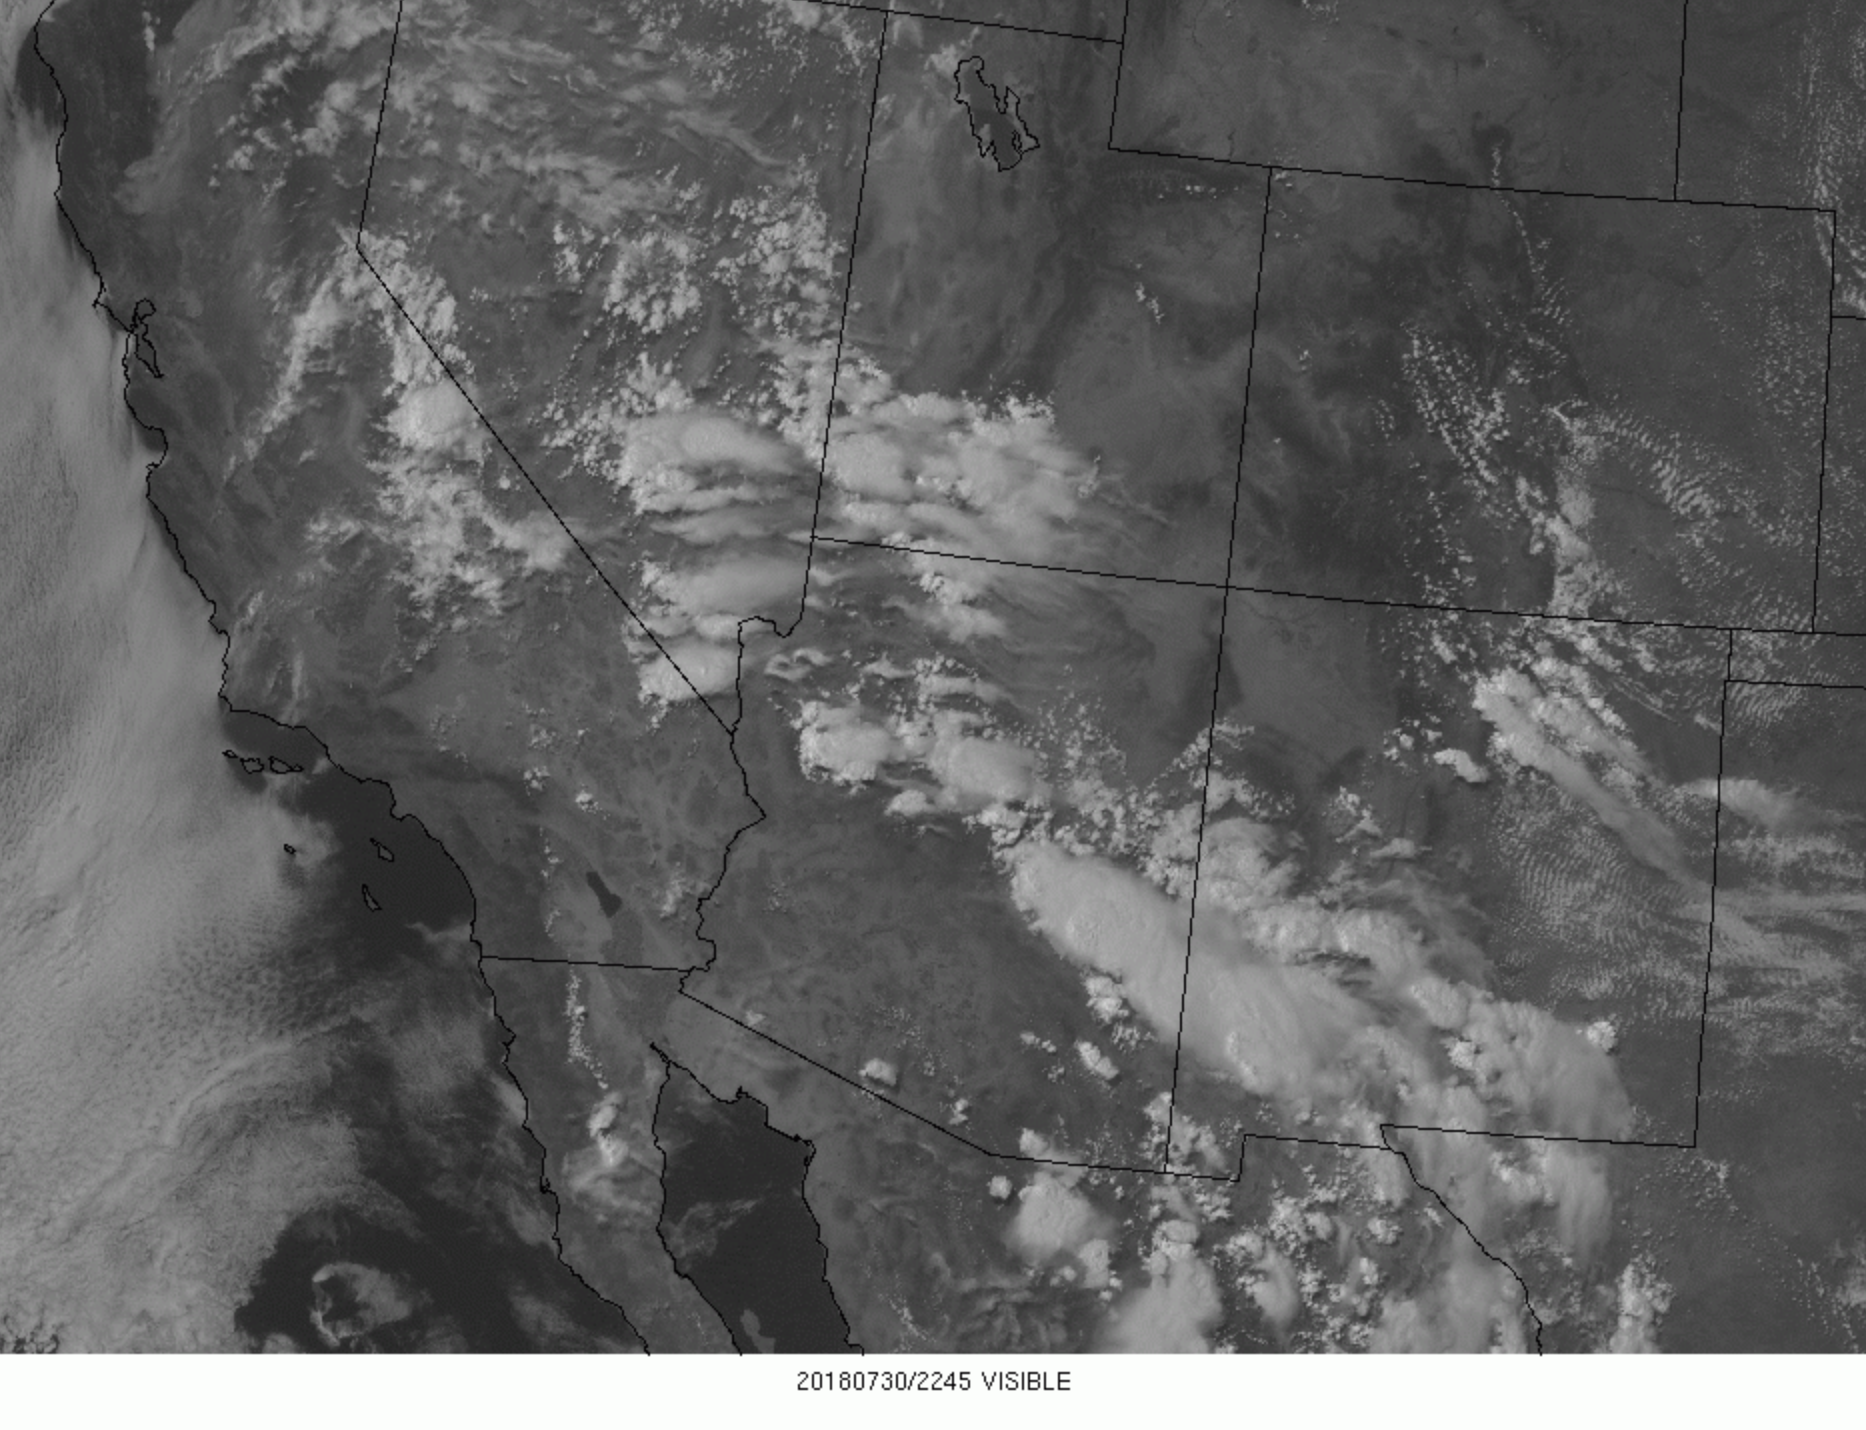
July 30

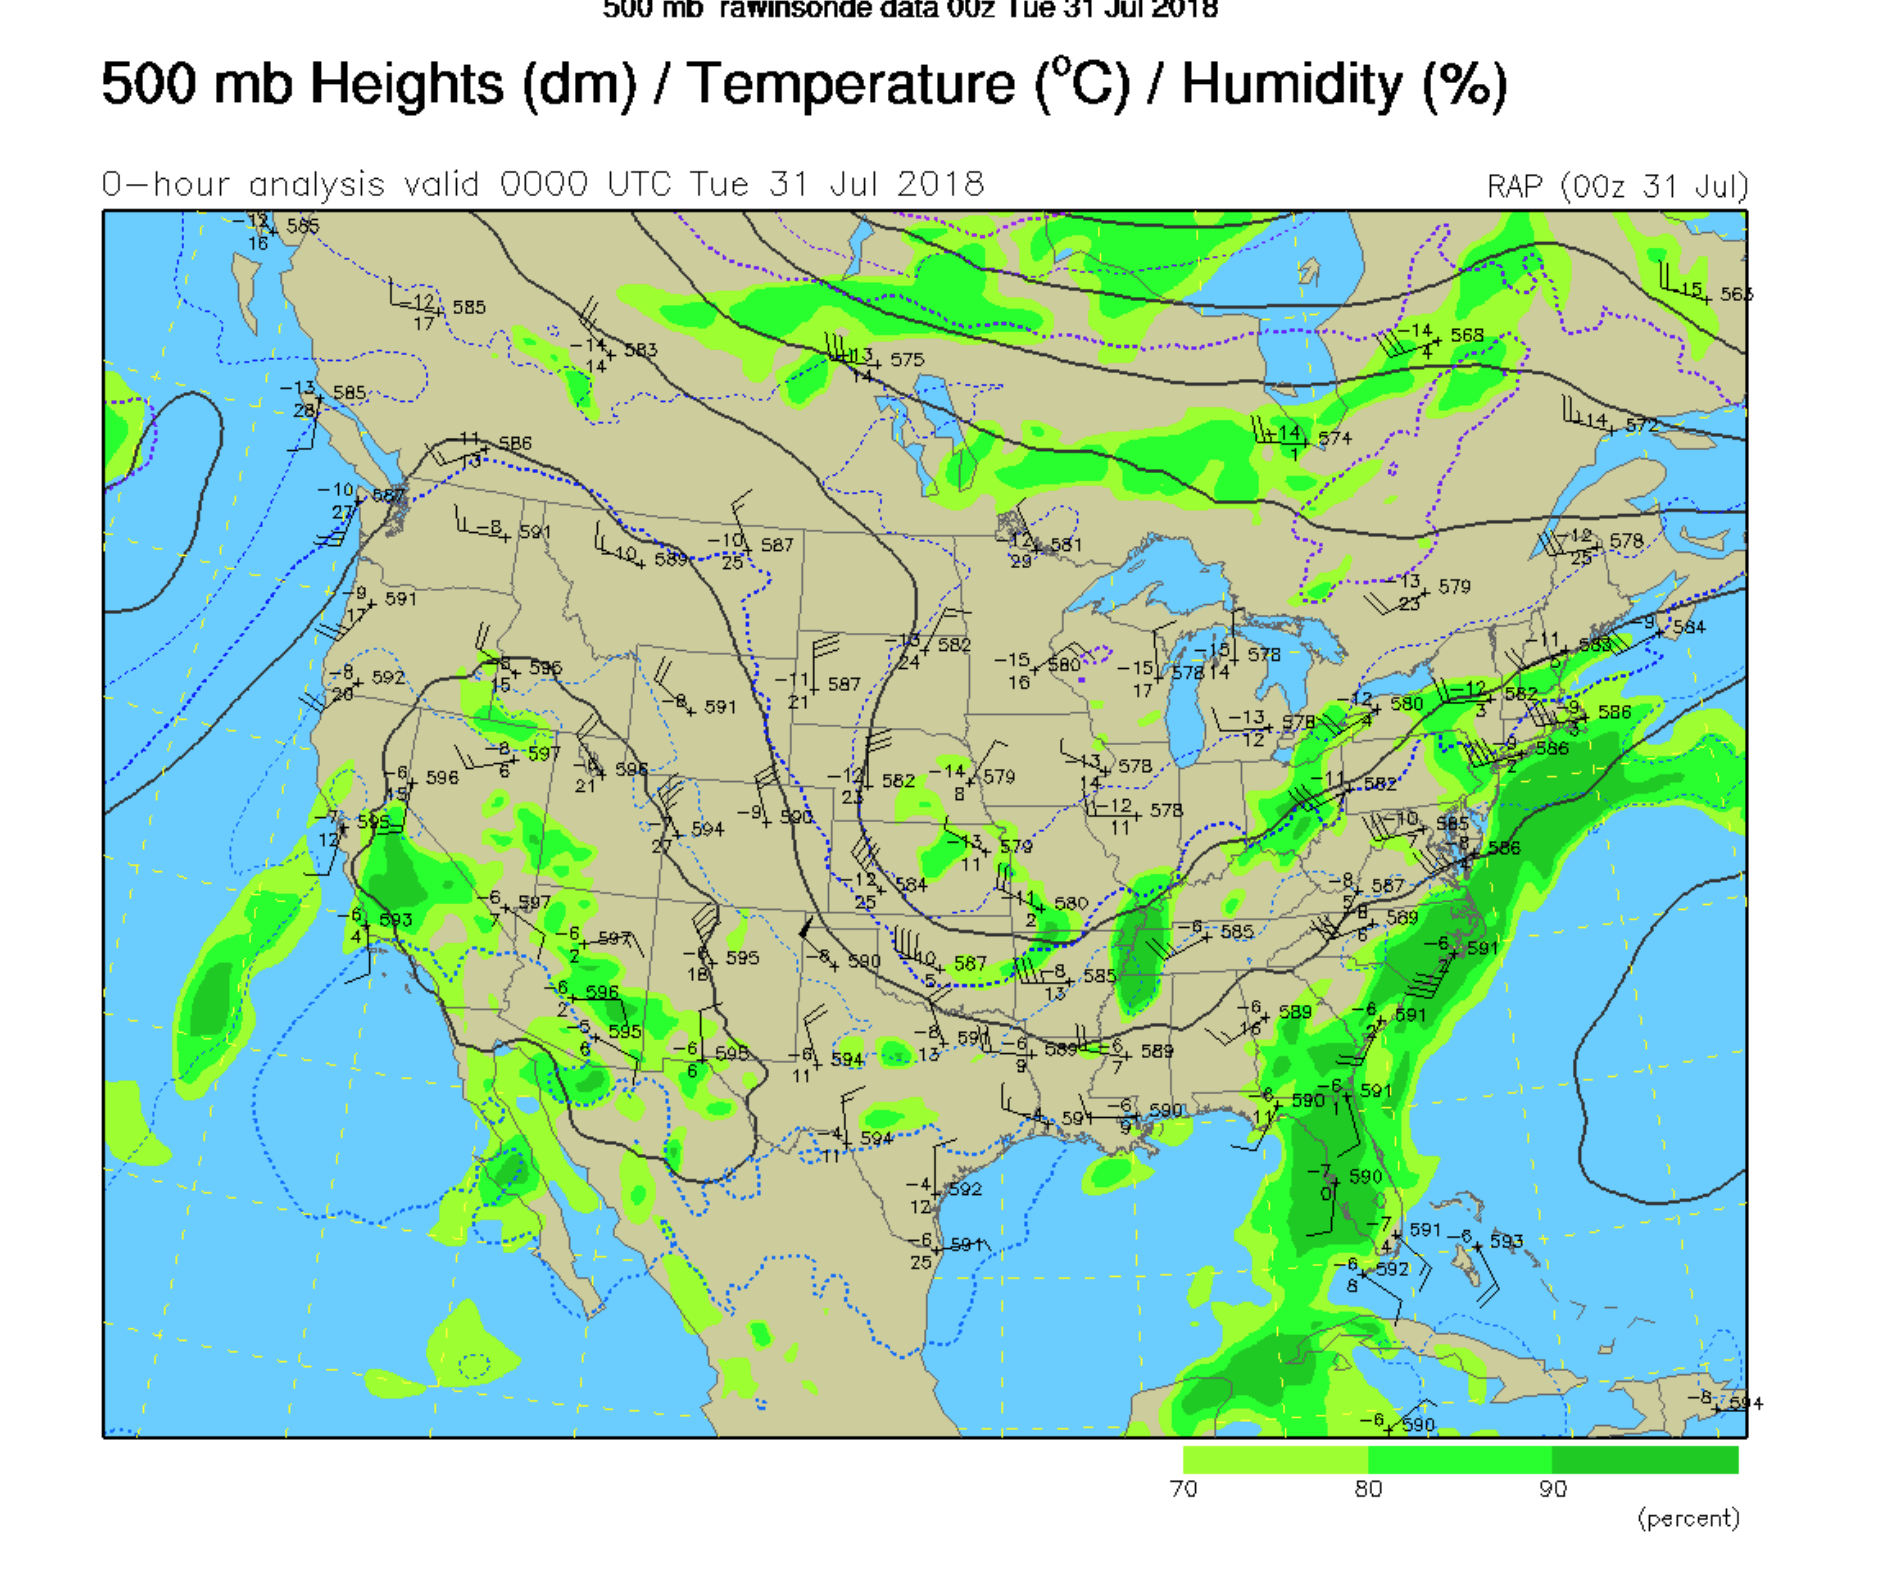


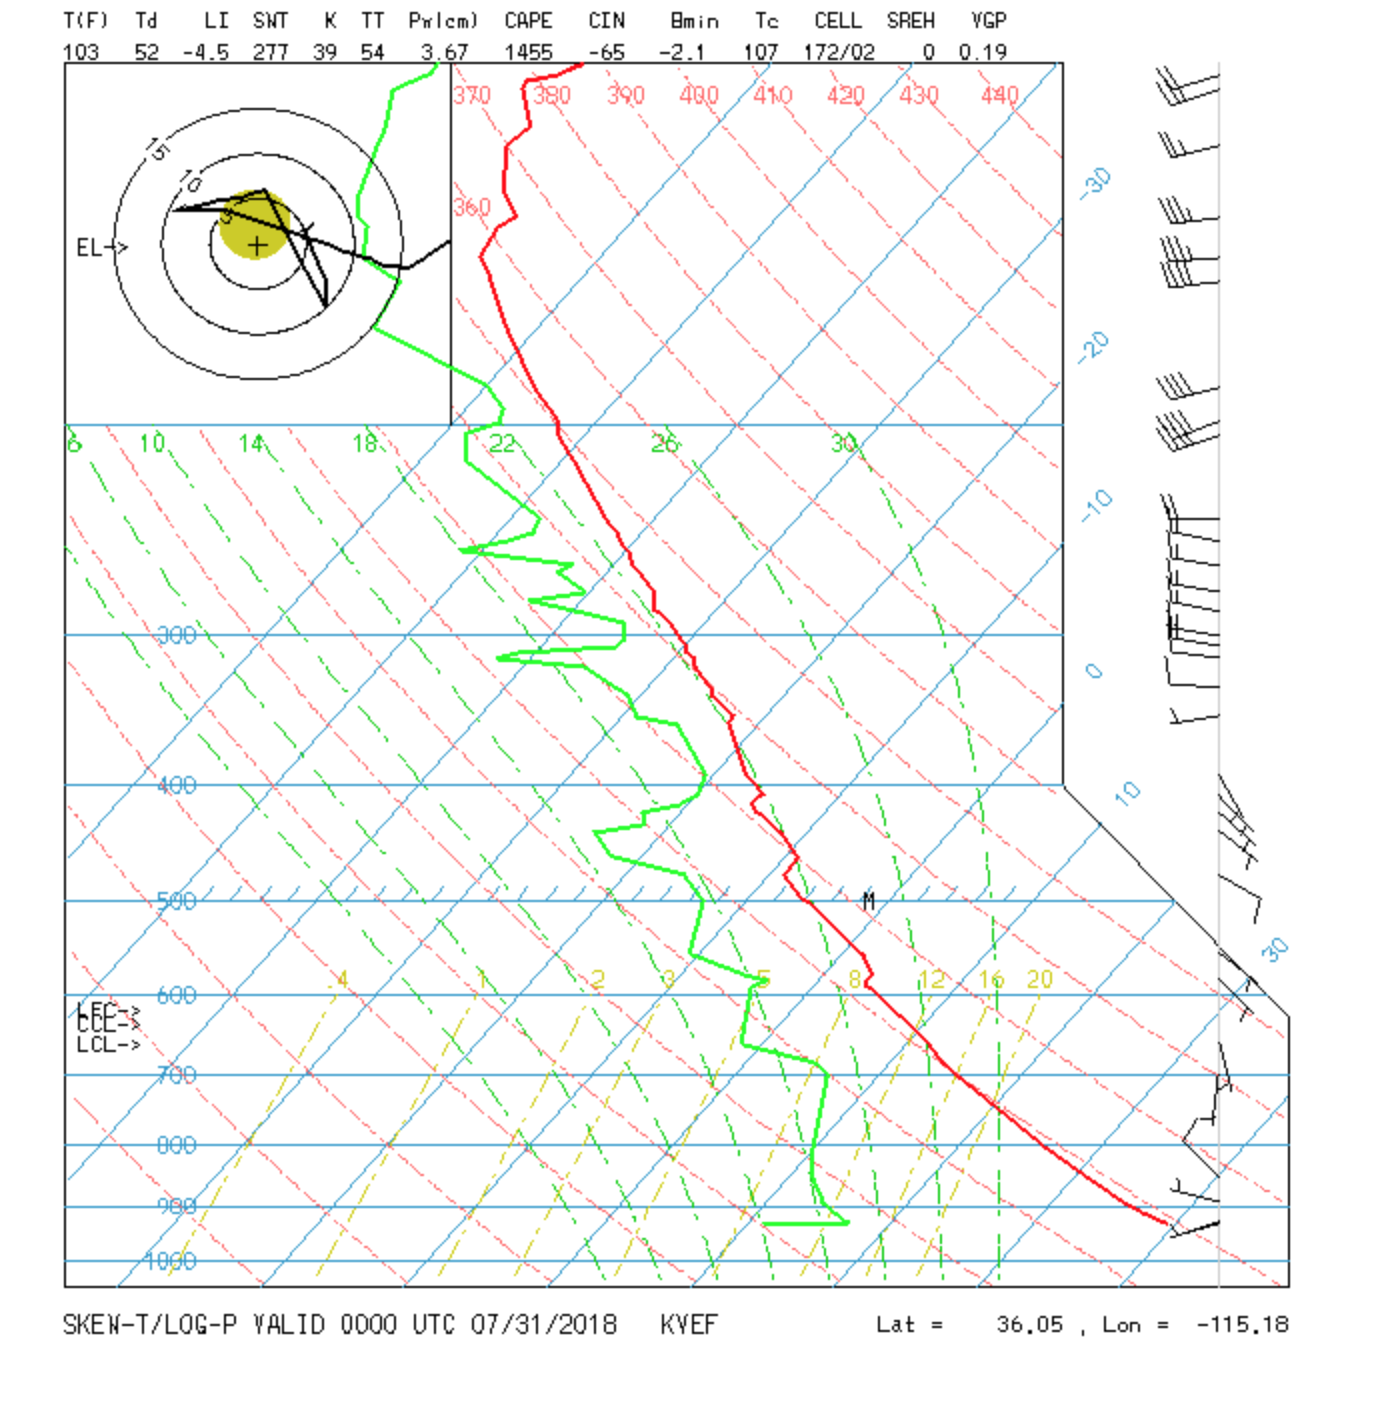
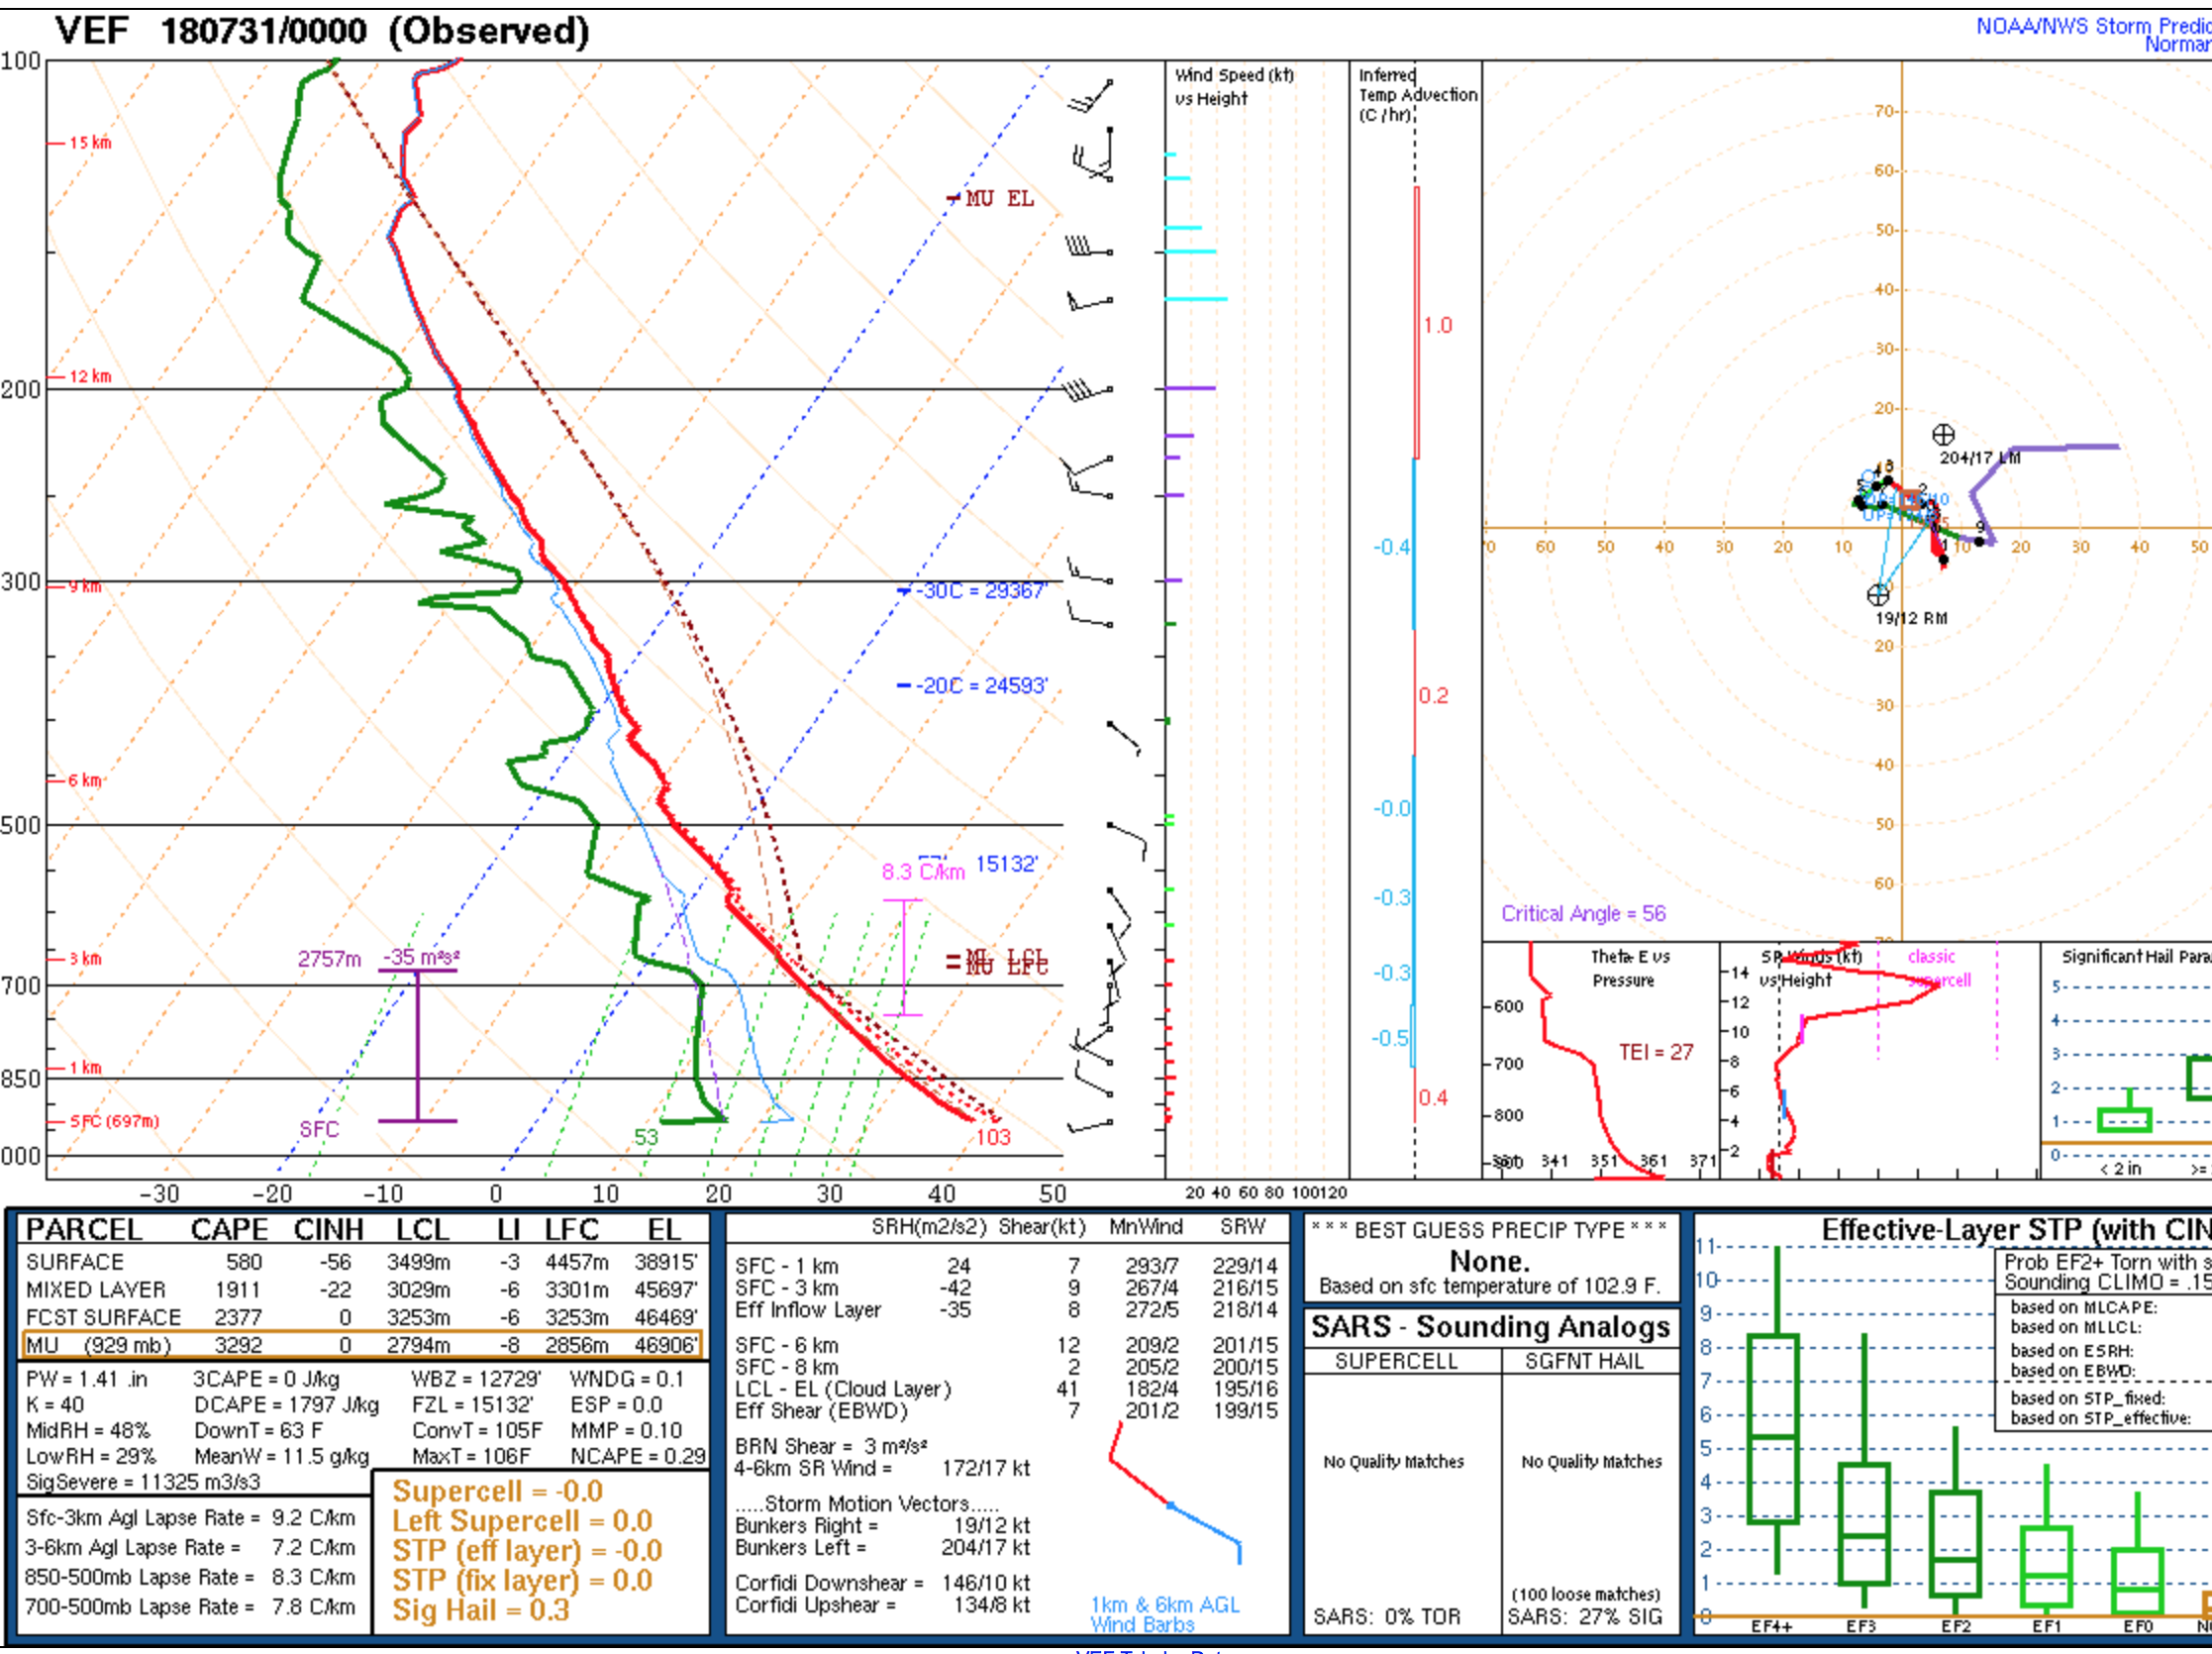
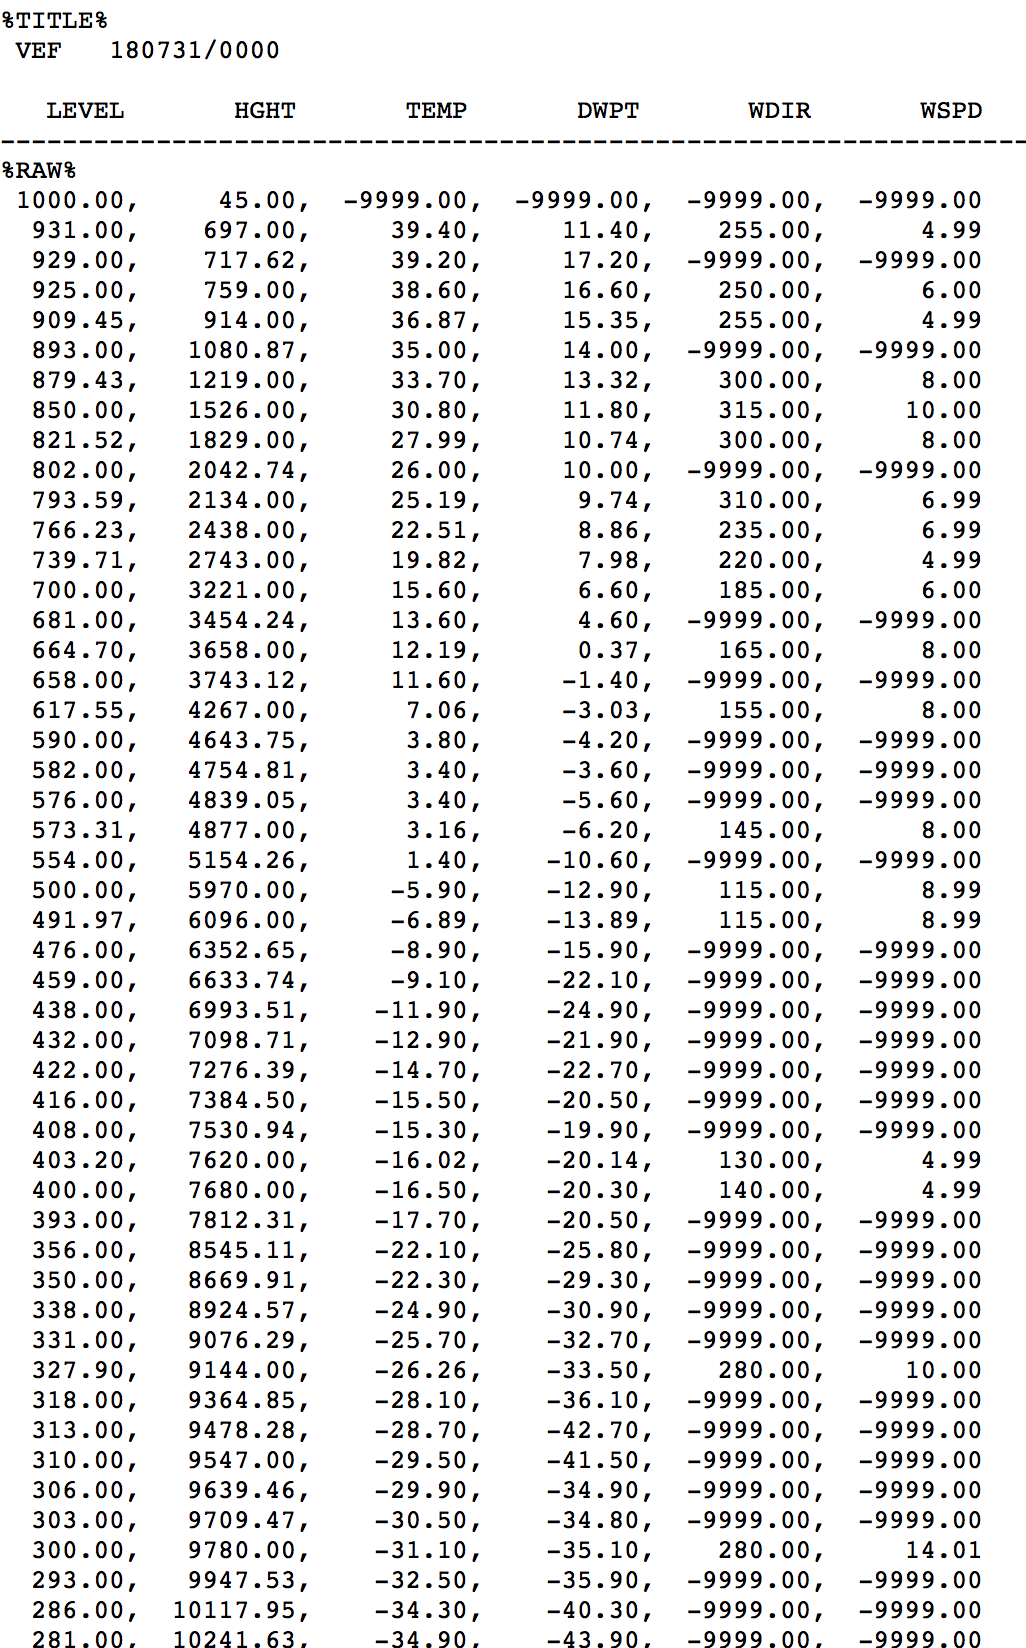
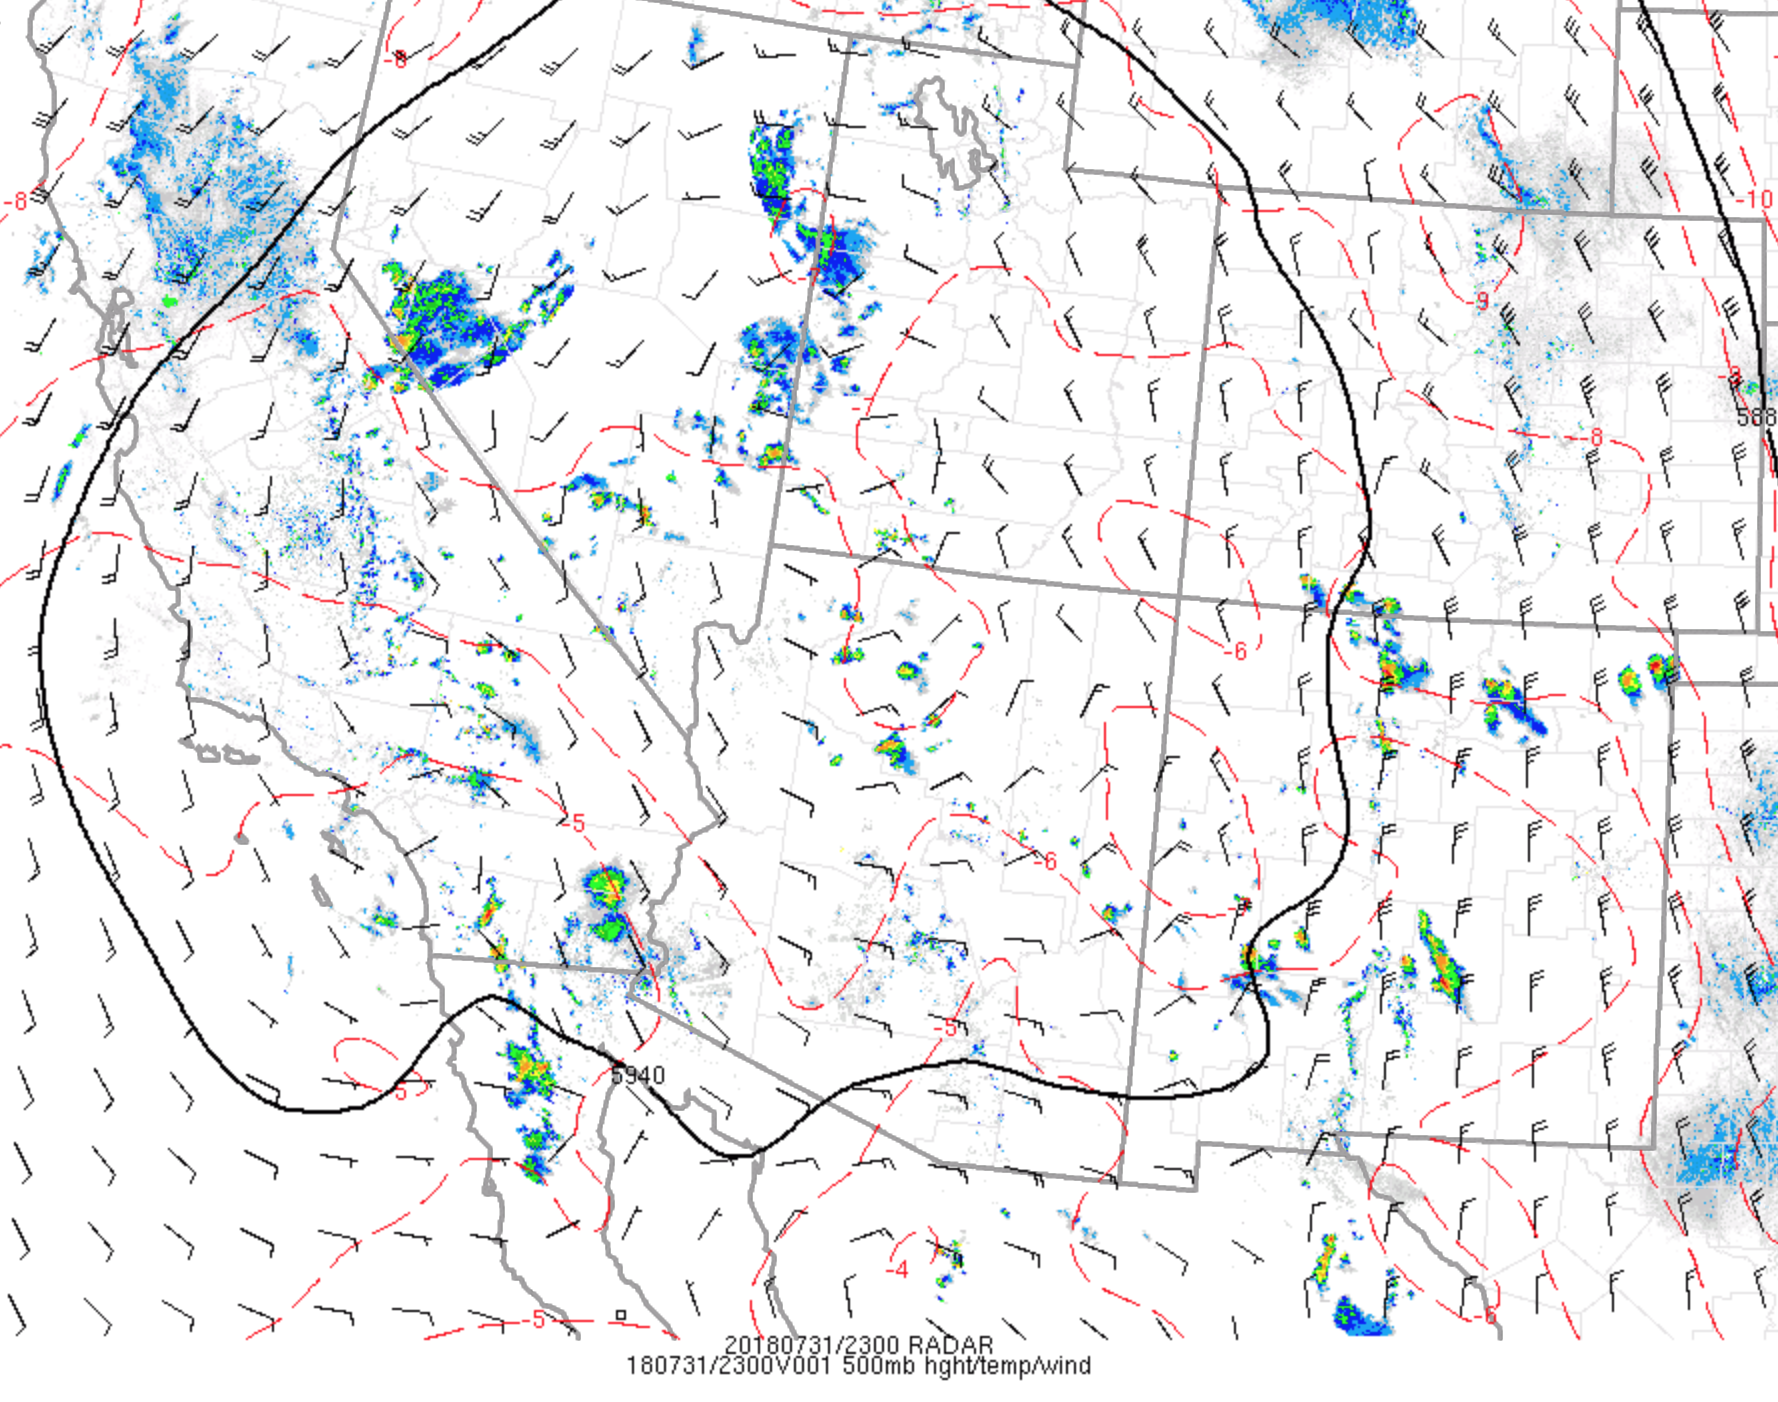
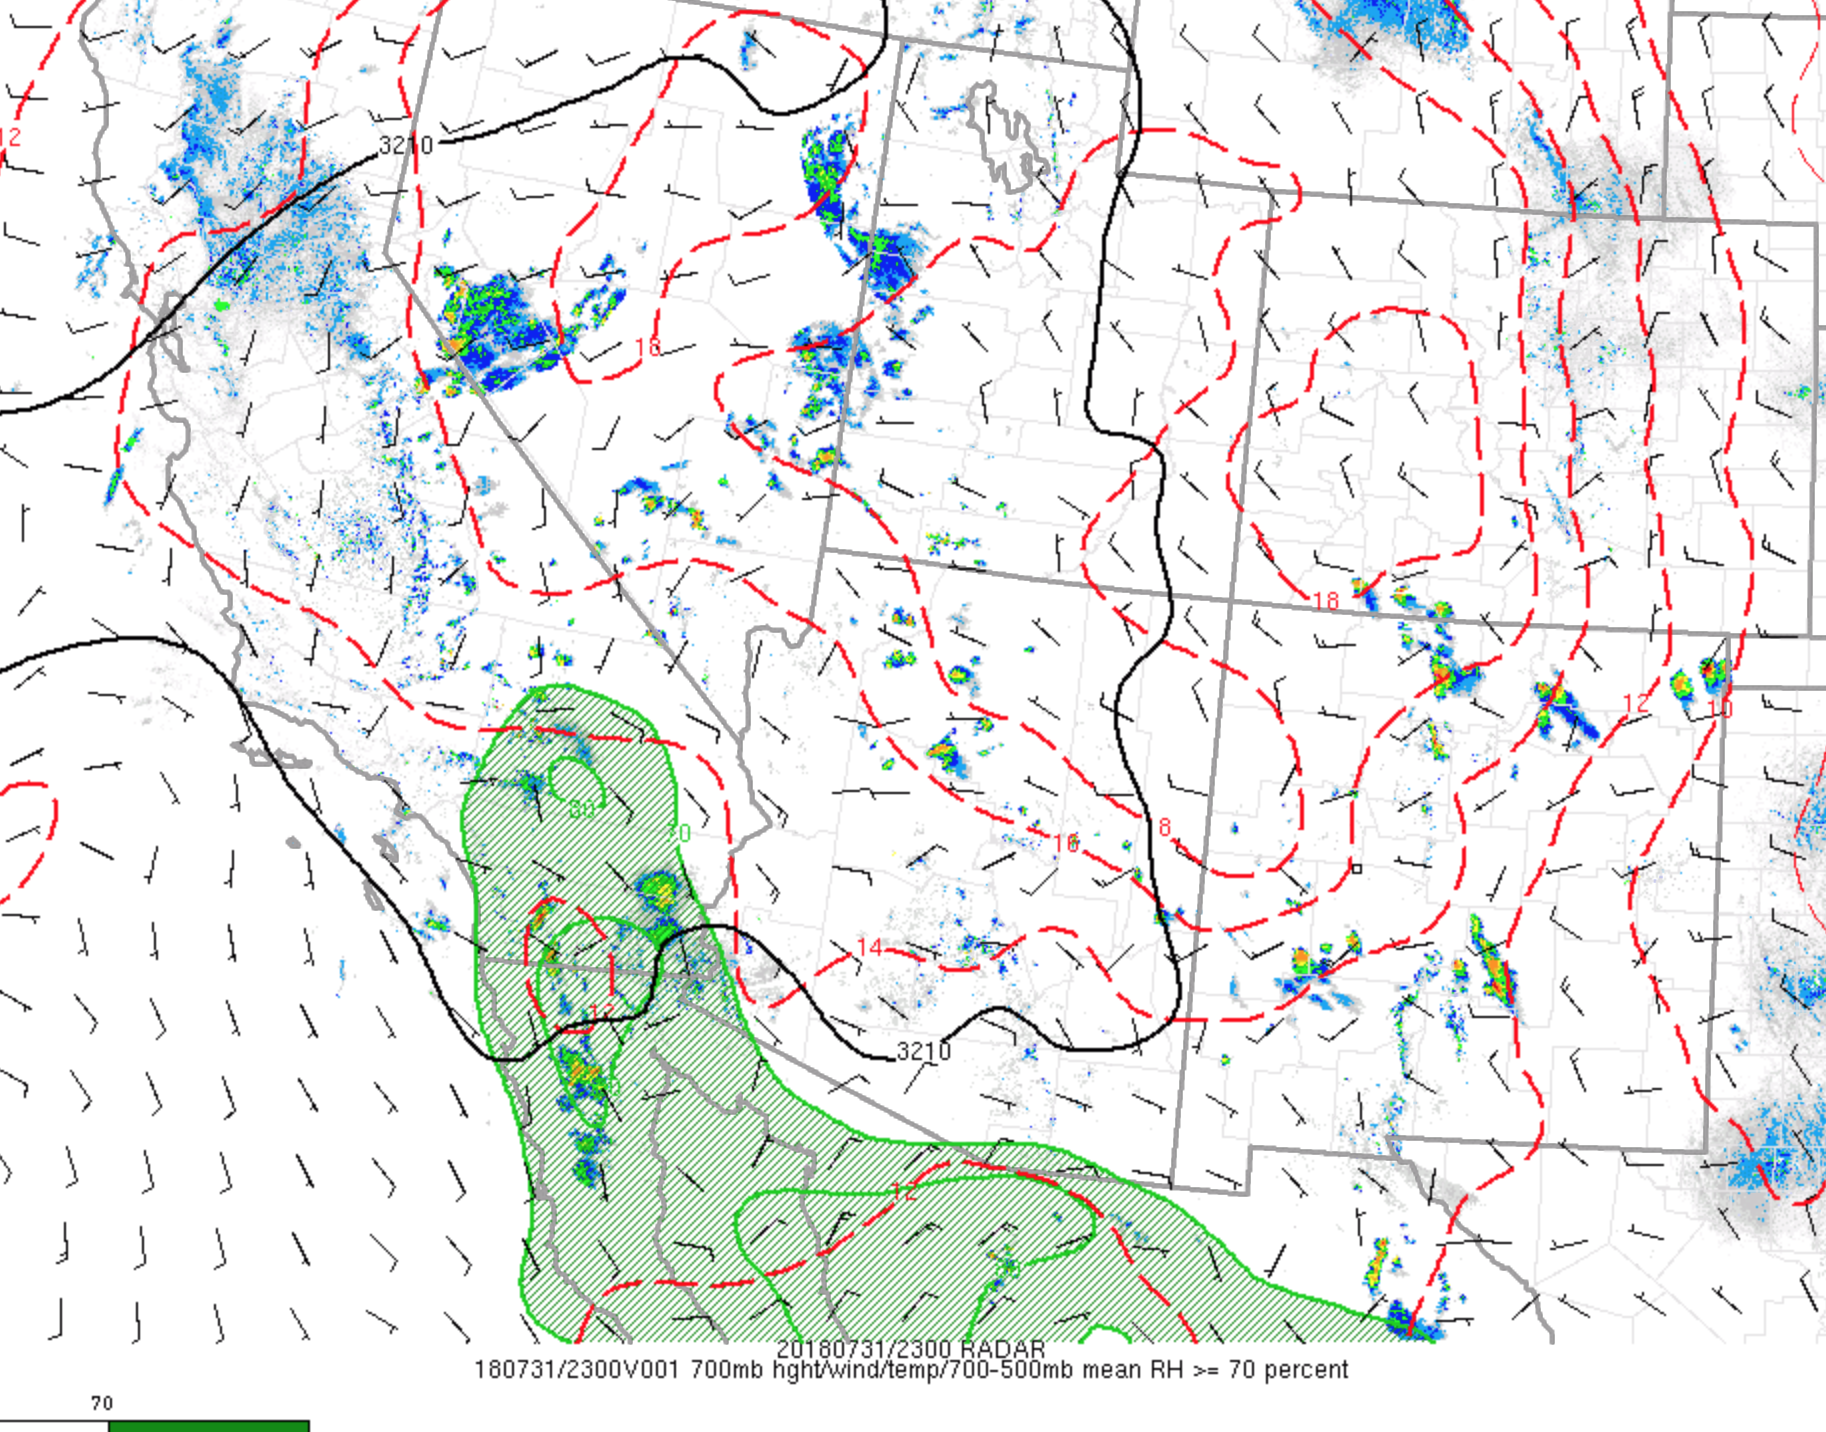
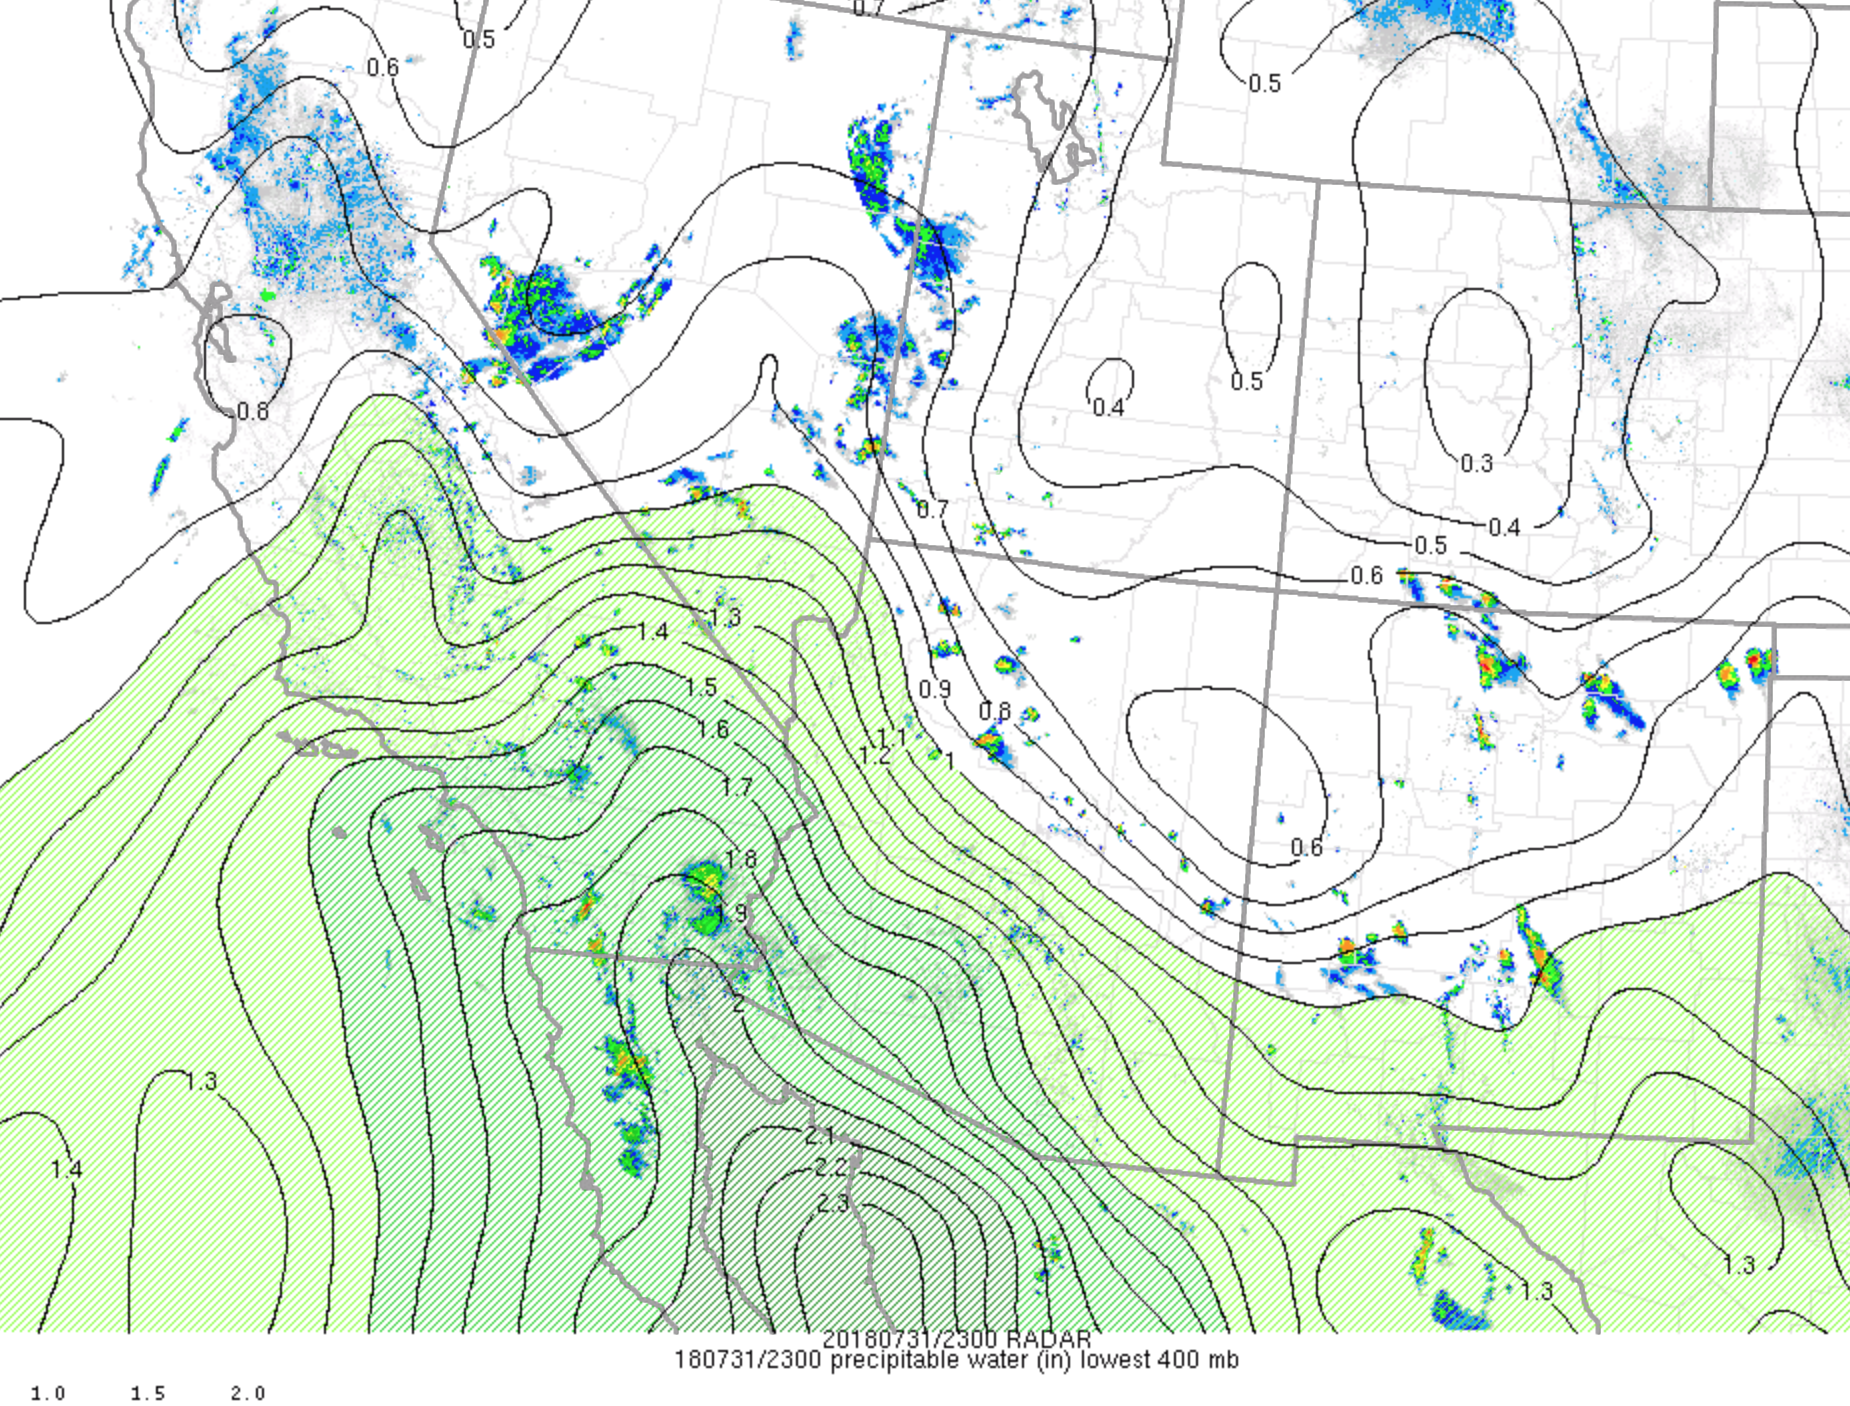
July 31


Leave a Reply
You must be logged in to post a comment.