A very warm airmass was forecast to build over the Death Valley region beginning about July 8. Heights of 6000 meters at the 500 millibar level were showing up in the forecast charts for the 10th and 11th, if I recall correctly. Temperatures of 19C to 20C at 700 millibars were expected from the 9th to the 11th. Numbers such as these have been associated with the very hottest days in the Death Valley region in summer in the previous few decades. The weather was looking good for another run at 130F at the Furnace Creek station in Death Valley! This station managed its first reliable maximum of 130F in the prior summer, with 129.9F on August 16, 2020. I missed out on being there last year by one day. as the hottest day (at Death Valley/Furnace Creek) wound up coming a day earlier than I was figuring and hoping. I had a work shift at LAX on the 130F day and was out there the following day, which reached 127F.
My writeup with the meteorology, charts and data for this event is here.
I needed to try again. I need to be out at the Death Valley weather station on the afternoon when the temperature hits 130F or more! For this current event, it was looking good as I had the day off on July 10th, which, along with the 11th, were looking like the hottest days. And, like deja vu all over again, as I was working an LAX shift on July 9th, Death Valley hit 130.0F. This entry is the story of my drive to Death Valley on the following day, July 10, when the official maximum temperature reached 129.4F.
It is about a 5-hour drive from Thousand Oaks to Furnace Creek, with a few stops along the way. Here are the times and temperatures for my trip on July 10, 2021:
8:55 a.m./Westlake Village/75F
9:20/101 and 405 freeways in Sherman Oaks/80F few Ac and good vis
9:52/Escondido Summit Hwy 14, 3258’/91F scattered Ac
10:02/Hwy 14 Lake Palmdale/97F west breeze
10:26/Hwy 14 and D in Lancaster/105F breezy
10:30/Rosamond/103F
11:13/Mojave/105F
11:29/Jawbone Canyon Rd and Hwy 14/110F
11:30/Hwy 14 and Garlock Road/109F
11:44/Garlock/108F light wind, few Ac
11:30/Hwy 14 and Garlock Road/109F
11:52/Hwy 395 and Garlock Road/106F
11:56/Searles Station Road and 395/106F
12:06/Trona Road and Searles Station Road/108F light wind and a few Cu and Ac
12:10/Trona Road hilltop/106.5F light wind
12:17/Hwy 178 and Trona Road/112F
12:26/Hwy 178 (Trona Road) at the Pinnacles Rd./112F
12:29/Westend/112F
12:32/Argus/113F
12:33/Trona/112F light east breeze 3-6 mph, few cu over mountains, and few Ac
12:50/Trona High School (north side of town)/115F
12:52/Inyo-San Bernardino County line on Trona-Wildrose Rd./105F Wind S 5 mph
1:04 p.m./Trona-Wildrose Rd at top of pass into Panamint Valley/109F
1:12/Trona-Wildrose Rd in Panamint Valley at Nadeau Road/116F
1:16/Trona-Wildrose Rd in Panamint Valley at Ballarat Road/118F light wind
1:24/5 miles north of Ballarat Road/118F
1:30/Trona-Wildrose Rd in Panamint Valley at Wildrose Road split/118F
1:36/Panamint Valley Rd. at Minnietta Road/118F
1:45/Highway 190 and Panamint Valley Rd./120F
1:47/Highway 190 across dry lake bed in Panamint Valley/118.5F
1:49/Hwy 190 grade eastbound, 2000’/118F
1:52/Hwy 190 grade eastbound, 3000’/113F
1:55/Hwy 190 grade eastbound, 4000’/108F
1:57/Hwy 190 at Towne Pass, 4956’/103F. dew point 53F, Ac and scattered flat Cu
2:03/Hwy 190 downgrade eastbound, 4000’/108F hazy to the east in the basin, light wind
2:05/Hwy 190, 3000’/112F
2:08/Hwy 190, Emigrant Ranger Station/115F
2:09/Hwy 190, 2000’/117F dew point 61F
2:12/Hwy 190, 1000’/123F
2:19/Hwy 190, Stovepipe Wells (+5? elevation)/126F light wind
2:29/190 at the Mesquite Sand Dunes/126.5F dew point 64F
2:33/190 at the Devils Cornfield/127F
2:34/sea level sign on 190 near road to Scottys Castle/125F
2:37/on 190 heading SSE to Furnace Creek/126F
2:38/sea level sign/128F
2:40/190 at Salt Creek Rd (below sea level)/129F
2:41/126F
2:43/129F
2:45/128F
2:47/126F light wind, scattered Ac
2:49/128F
2:51/190 at Cow Creek/127F
2:52/190 at Mustard Canyon/128F
2:53/190 at the Visitors Center/127F
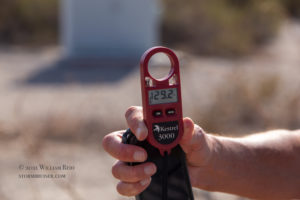
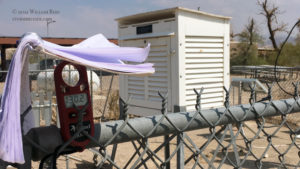
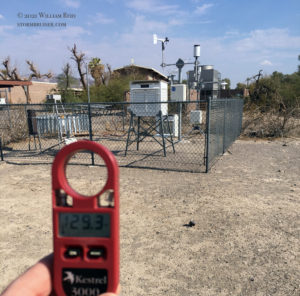
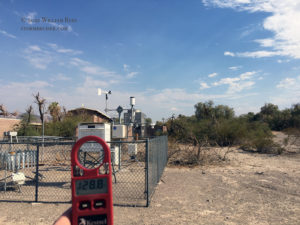
3:07 p.m. PDT/walking around the official Furnace Creek weather station near the Visitors Center/Kestrel readings ranging from about 127.5F to 130.0F. Wind light and from the WNW, estimated 4-8 mph. Kestrel readings of 127F when walking into the wind west of the station.
3:14 p.m./Kestrel reading of 127.6F when walking into the wind west of the station, wind estimated WNW at 7 mph.
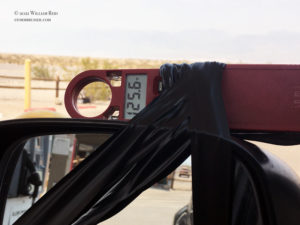
Temperature measurements while driving were with the Kestrel, mounted on the outside rear-view mirror, with very fast flow past the shaded sensor. I consider the Kestrel temperature readings to be very accurate. The instrument is very sensitive to temperature changes, and it is typical to see the readings covering a 2-to-4 degree F temperature range during a 5-10 second period while driving. That is normal for the desert on sunny summer afternoons. I chose a “middle-ground” or “average” temperature for the observations shown above. The actual sensor is generally shaded by the instrument’s plastic structure. See the images below for a good look at the Kestrel instrument and how I had it taped to the outside mirror for the readings while driving.
My Kestrel dew point readings are on the high side, and the values above are adjustments, usually 3-4 degrees F lower than the instrument reading. The values provided above are still five or more degrees higher than area stations were showing.
Image 1 to 10 above:
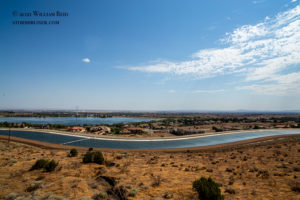
- looking northeast from Palmdale Lake Vista mid-morning
- a few altocumulus to the southwest along 395 late morning (north of Randsburg)
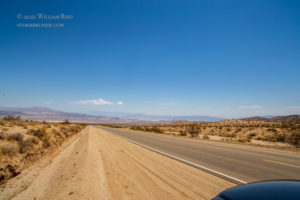
- view to the north, near the Spangler Hills southeast of Ridgecrest
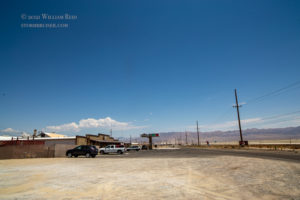
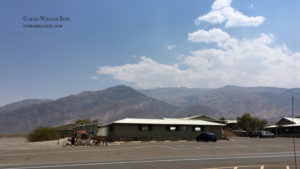
- view to the north from a Trona convenience store, about 12:30 and 112F
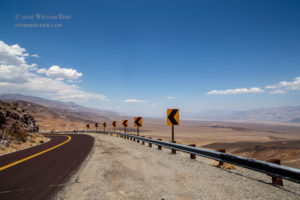
- Vista point looking NNE over the Panamint Valley (north of Trona)
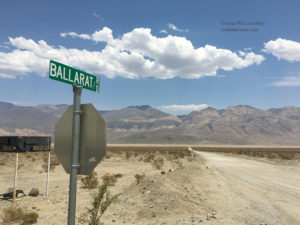
- Ballarat Rd in the Panamint Valley, looking east
- Ballarat Rd in the Panamint Valley, looking north
- Ballarat Rd in the Panamint Valley, looking east
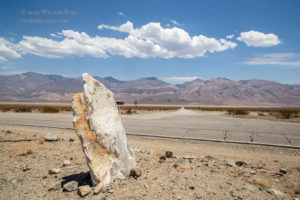
- Panamint Valley Road at Hwy 190, looking north, 120F at 1:45 p.m.
- Panamint Valley Road at Hwy 190, looking east towards the Panamint Range
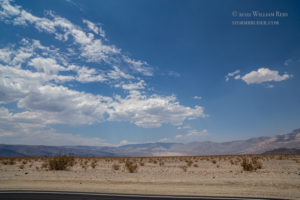
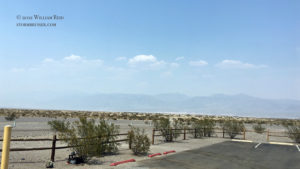
The main takeaway from the images above is the generally non-hazy skies. The atmosphere was quite a bit hazier upon descent into Death Valley, presumably due to higher humidity. The cumulus over the high mountain ranges, such as the Panamints, stayed fairly flat. Deep, moist convection was hindered by both warm air at mid-levels and by strong subsidence courtesy of the upper high. Winds were fairly light for the entire day trip to and from Death Valley.
Images 11 to 19 above:
11, 12 and 13) looking generally northeast towards Stovepipe Wells and into Death Valley from 190, while descending from Towne Pass
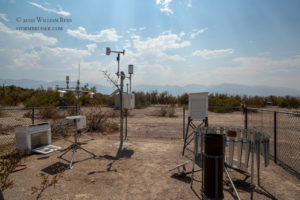
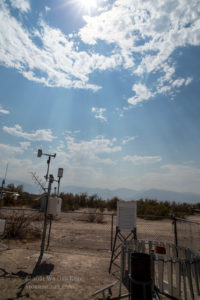
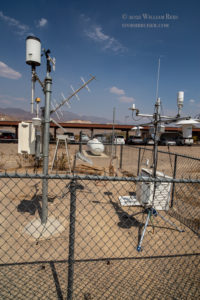
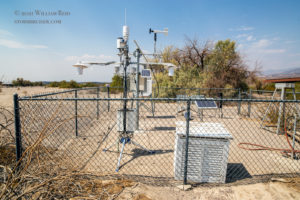
14 to 20) Death Valley weather station at Furnace Creek Visitors Center, looking west (14 and 15), looking southeast (16), looking east (17), and north (18) and east (19).
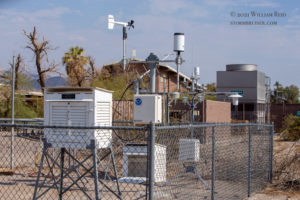
The Kestrel, in the shade of the notebook for a while, showed a consistent 128 to 130F during this timeframe (about 3:10 to 3:20 p.m. PDT). The official instrumentation (the Campbell Scientific instruments on the left side of image 17 above) registered temperatures ranging from 125.9 to 129.0F from 3 p.m. to 4 p.m. PDT. The Kestrel readings matched those of the official station quite well when I was walking with it into the wind.
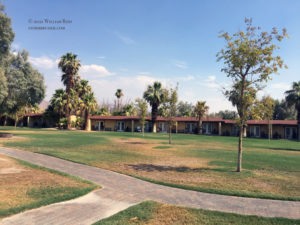
My weather buddy “Steve” was also here. We stuck his quality temperature probe on the hot ground and in the sand, and watched the temperature display head up into the 150s (F). I was expecting a bit higher! Later, at the grassy area at the ranch motel near the pool, we set instrument probe into some short-cut grass. The probe read about 103F, and this was when the ambient air temperature was about 126F to 128F.
The haze does not appear too bad in these photos, and by 5 p.m. or so it was not hazy at all. Presumably, the haze and low-level moisture had fully “mixed out.”
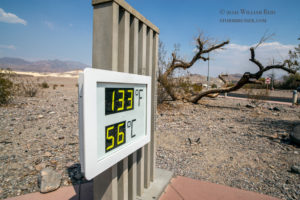
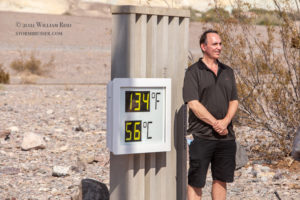
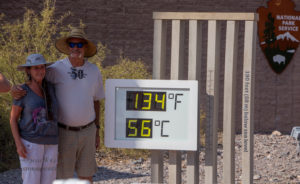
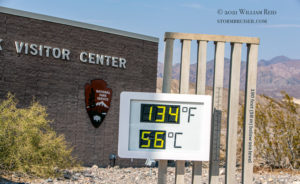
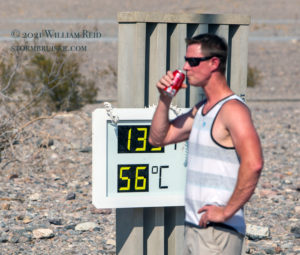
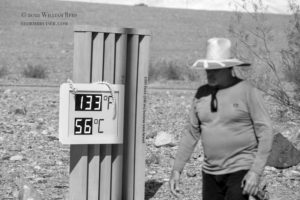
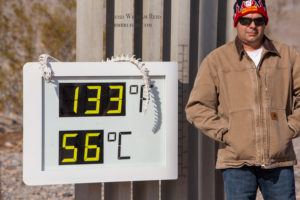
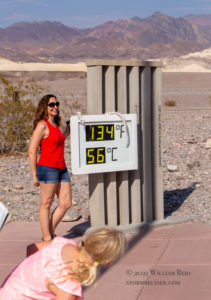
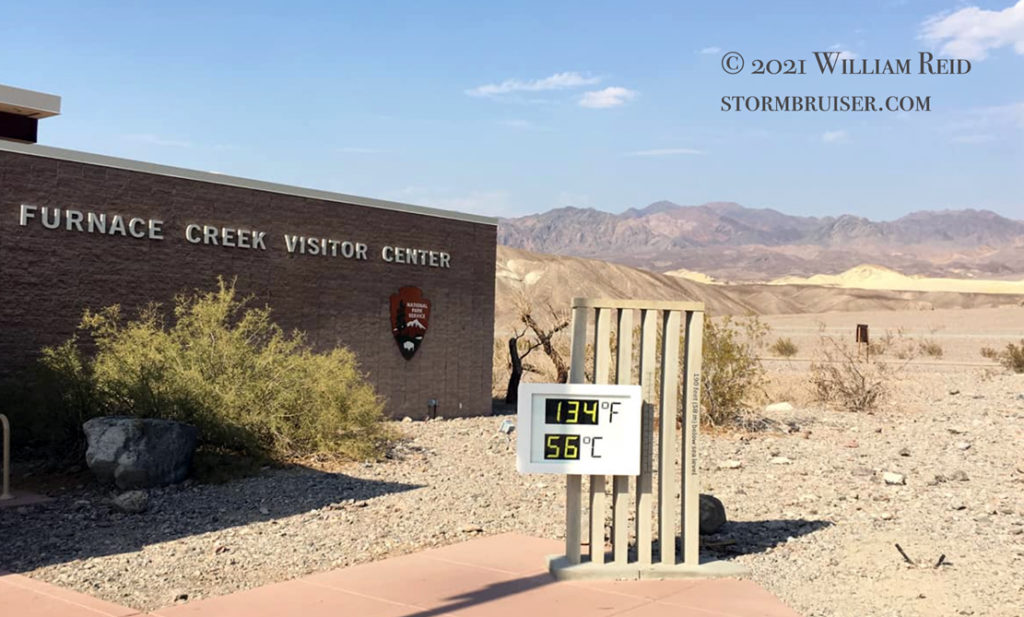
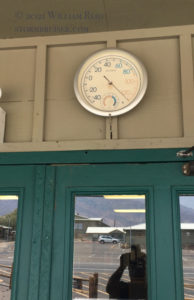
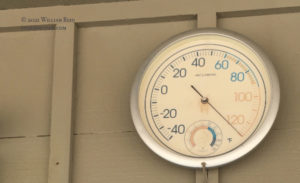
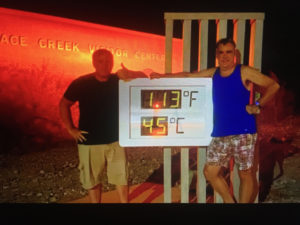
Below is a bunch of images from the front of the Visitors Center building around 3:30 p.m. A popular digital thermometer attracts crowds on the hot days. It runs close to five degrees too warm (under bright sunshine) compared to ambient temperature readings with my Kestrel and compared to the official station behind the Visitors Center.
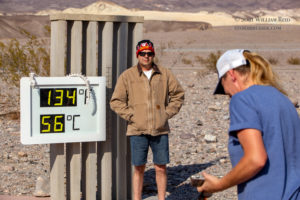
The highest reading observed on the outside digital thermometer was 135F, but it showed 133 and 134F for nearly the entire time I was nearby.
And below are additional images of the weather station and digital thermometer area, following a visit to the swimming pool to cool down. These were around 4:45 p.m. to 5 p.m.
And how about more images from July 10! These are from my iPhone, except for the final image (113F), which was taken by a friend who motored from Arizona and reached Death Valley around midnight. Pics 2 through 6 below were at Stovepipe Wells, and the remainder were at Furnace Creek.
iPhones are not very reliable for picture-taking (or anything else) on such afternoons. Mine was often shutting down (with a high temperature warning) while walking around the weather station and the outside digital thermometer areas.
My friend and I enjoyed a meal and I began my trek home around 7 p.m. Temperature was still very close to 126F from Furnace Creek to Stovepipe Wells, with 126F near sunset at Stovepipe Wells. These conditions are quite dangerous for most human beings. While walking in the sun outside of the visitors center and around the weather station (while the temperature was around 128 to 129F) I started to feel a little bit woozy. I made sure that I found some shade and water and/or an air-conditioned room fairly quickly.
Yes, it did feel REALY HOT, and there isn’t a better way to describe it. This visit to Death Valley did feel a little hotter than my visit on August 17th in 2020, when the official high temperature was 127F. When I reached Stovepipe Wells and was seeing consistent readings of 125F to 127F on the Kestrel (around 2:10 p.m.), I thought that this day had a pretty good chance at beating the 130.0F at Furnace Creek from the day prior. But, it fell short by 0.6F, with only “129.4F” for the official high temperature.
The images of the Furnace Creek weather station above show some additional instrumentation, by Campbell Scientific CS). The company is running some comparison tests at the station. I don’t yet know what the temporary equipment registered on temperature for this event. I queried the author, Dr. Dirk Baker, as to exactly how the official CS sensor determines the temperature. Here is his response:
The NWS station samples the sensors once per minute. The maxima and minima for the hourly reporting are based simply on the numerical maximum and minimum for a given hour and the time at which those occur. There is no additional processing.
That said, the sensor on that station is the CS215 which, according to its specifications, has a time constant of 120 seconds or less. Assuming (for the purposes of conversation) that it is exactly 120 seconds for that specific sensor; theoretically, it would take about 360 seconds for it to fully equilibrate to a step change in temperature. You probably already know this, but it is worth pointing out in a public post.
Whether that is truly equivalent to smoothing or averaging is probably debatable, but it will dampen the sensor’s response to short-duration fluctuations.
The details on the CS temperature sensor are here.
The latest Death Valley temperatures and weather data can be accessed here, by clicking on “decoded data.”
Based on Dirk’s answer, the official station updates the temperature every minute (and it provides a value to the nearest 1/10 of a degree F). Each one-minute value is “smoothed out” over a time span of at least a couple of minutes. This is similar to the official ASOS stations at airports here in the United States. The ASOS updates the official temperature to the nearest whole degree F every minute. These one-minute (official) temperatures are averages of the temperatures measured by ASOS for each of the last five minutes.
This may sound a little messy, so here is another explanation. ASOS shows a temperature that is updated every minute, and this value is likely a one-minute average. We will call this the “not-publicly distributed” temperature. The “not-publicly distributed” temperature is not the official “one-minute” temperature, and it can only be accessed by someone, such as the observer, who is signed into the ASOS computer. Five of these “not publicly distributed” temperatures are averaged in order to determine the official “one-minute” temperature. So, if ASOS shows 99F at 6:01, 99F at 6:02, 99F at 6:03, 100F at 6:04, and 100F at 6:05, then the official one-minute temperature at 6:05 for that station is 99F. The ASOS maximum and minimum temperatures for the day are based solely on the official one-minute temperatures, so the official high for the day might be only 99F in this instance if no other one-minute temperatures exceeded 99F.
Anyhow, the main message is that these official maximum and minimum temperatures (and the official one-minute temperatures) are not based on instantaneous readings, such as the ones off of my Kestrel. They are generally based on conditions averaged over the previous few minutes or so. The old-style liquid-in-glass thermometers in the weather shelters were (or are) less-sensitive to small temperature changes. The current, more-sensitive official NWS-sanctioned instruments, are “programmed” to smooth-over the short timescale fluctuations to more closely approximate the temperatures which would be registered on the old-style equipment.
And, speaking of the old-style equipment, the National Weather Service still has a CRS (cotton region shelter) and its max and min thermometers at the Death Valley/Furnace Creek station site. It is there, presumably, as back-up instrumentation in case of a malfunction of the CS equipment. And, it is there to help make sure that the temperatures off of the automatic equipment are not out of whack. The National Park Service continues to have rangers checking the shelter temperature readings daily around 8 a.m., and the NPS is asked to let the NWS know if the numbers between the manual and automatic instrumentation start to get more than a degree or two apart. The NPS is reluctant to share the numbers read off to the thermometers, saying (in a phone conversation with me on July 10) that the equipment belongs to the NWS and I need to reach out to the NWS if I want the temperatures. (I e-mailed the NWS in Las Vegas recently with regard to this, and have had no response.)
Steve (referenced above!) was at the DV station around 8 a.m. the following day, and observed the NPS ranger as she was taking the manual readings off of the thermometers. The ranger took a photo of the maximum thermometer, which showed 131F. However, Steve reports that the instrument was in the horizontal position for the photo and for the reading, and that he could see that the mercury was discontinuous right near the bulb constriction on the maximum thermometer. The ranger reset the thermometer with a spin without reading it properly. A proper observation would have been if the maximum thermometer were positioned up and down, or vertically. Given the improper reading procedure and the separation in the column as observed by Steve, the 131F observation from the shelter must be discarded.
Okay, here is my little diatribe. Today’s weather observations at cooperative stations are almost human-proof. That is, the observation is difficult to mess up. Most stations have the MMTS equipment and their digital display, and the observer presses a button a few times and writes down the high and low temperatures for the day (in the comfort of their home or office). At other stations, like at Death Valley, the official instrumentation is automatic, and no observers are required as the data are uploaded and disseminated electronically. Death Valley is one of the few places with the old thermometer shelter still in use, though it is just back-up equipment now. The NPS knows this. The routine of checking the daily extremes off of the back-up thermometers in the shelter is probably considered a very low-end priority task by the NPS staff, and the low-man on the totem pole likely is the one heading outside at 8 a.m. most days. These observers are, presumably, not weather geeks, and neither are, presumably, the higher staff person who has shown the new employee how an observation is to be properly made. (In other words, the observers might not know how to properly read the thermometers.) The NWS is not out at the station every few months to make sure that the observer knows how to read the thermometers properly. It would seem to me that when temperatures are very close to record highs (i.e., near 130F), that SOMEONE in the NPS or NWS would make sure that the maximum thermometer in the shelter is read properly. I mean, it might only be the highest and most-reliably registered official temperature indicated on a maximum thermometer in the history of the Planet Earth. Am I being too critical or unfair?! End diatribe.
















Leave a Reply
You must be logged in to post a comment.