Stormbruiser.com

William T. Reid

  • About
  • Video Links
  • Climate
  • Categories
    • Astronomy
    • Aurora/Northern Lights
    • Artsy
    • Airports (LAX and VNY)
    • Animal Day
    • Beach
    • BEST and MOST POPULAR
    • Chase Season Summary
    • Chasers and friends
    • Cumulonimbus
    • Death Valley
    • Desert
    • Desert/Mountains
    • Elevated photography
    • Eyesores
    • Fire
    • Flooding
    • Hurricane
    • Landscapes
    • Lightning
    • Local: Conejo Valley/San Fernando Valley
    • Mid and High Clouds
    • Nighttime photography
    • Old Stuff
    • Rainbows/Optical Phenomena
    • San Nicolas Island
    • Storm Video Sales
    • Stormy Skies
    • Stupid Bugs
    • Sunsets and Storms
    • Supercells
    • The City
    • Tornadoes
    • Unusual Clouds
    • Vegetation
    • Wind and Dust
    • Winter Weather
  • Contact
You are here: Home / 2021 / August 25, 2021 New Weather Station in Death Valley, at Badwater!

August 25, 2021 New Weather Station in Death Valley, at Badwater!

August 25, 2021 By William Reid Leave a Comment


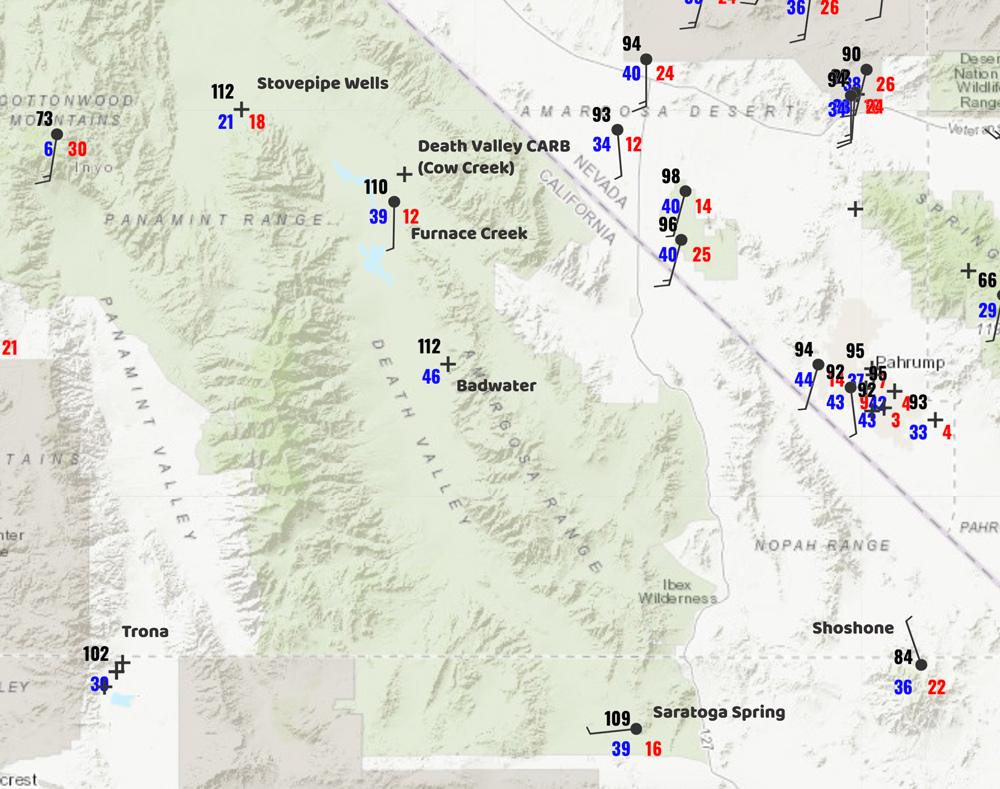
Stop the presses — the National Weather Service has installed a new online weather station at the hottest spot in Death Valley, which also happens to be the hottest spot in the country and perhaps in the world!  I noticed the new station data show up on the NWS/NOAA weather map on August 24th when I zoomed into the Death Valley area.  Apparently the first observations were uploaded on August 23rd.  The map images below show the location of the Badwater station.


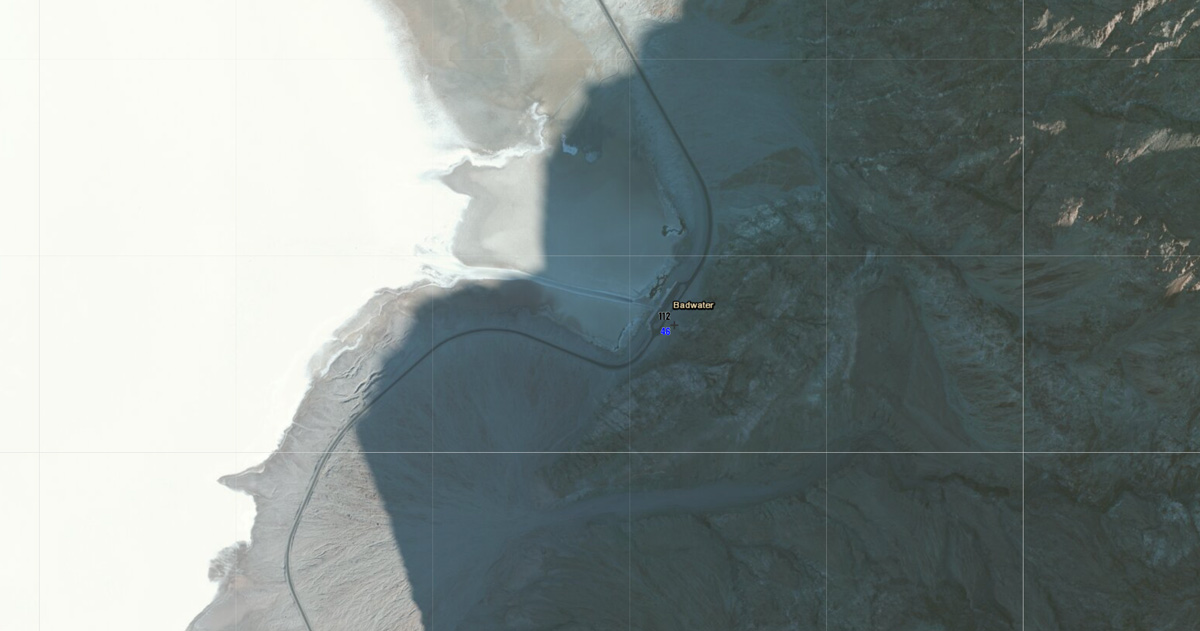
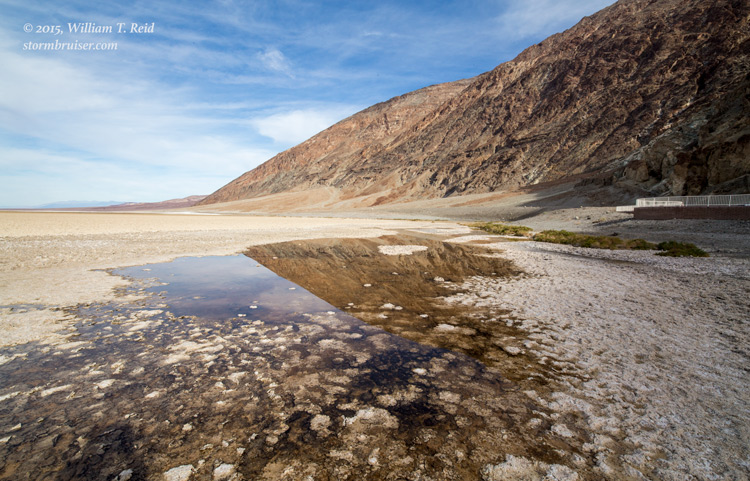
If the location on the map is correct, the Badwater instrumentation is very close to the highway.  It looks to be just across from the Badwater parking area, on the east side of the highway, a stone’s throw from the steep-sided slopes just to the east.  The elevation is -219 feet, which puts it about 60 feet above the Badwater pond on the west side of the highway.

This location, or station siting, is excellent for measuring the very hot conditions at Badwater.  The area is in a wind-protected niche of sorts.  Most summer afternoon winds through Death Valley are from the south, and this “niche” is protected to a significant degree from southerly winds by the higher terrain which juts out to the west, just to the south of Badwater.  In fact, elevations rise to over 1000 feet just a half mile or so to the south.  Given the steep slopes just to the east, the bare ground all around, and the wind-protected environs, the Badwater area is a local “hotspot” in Death Valley on summer afternoons.  The incoming solar radiation in mid-afternoon in July hits those dark slopes on the east side of Badwater at right angles.  This is a made-to-order landscape for hot afternoon temperatures in summer.

It will be fun to see how the Badwater maximums compare to the other Death Valley stations.  Though the station is in a wind-protected spot, there is no vegetation or man-made stuff around which might promote higher afternoon temperatures.  I haven’t seen the new station in person, but I figure that the overall instrument exposure would be “very good – to – excellent.”  This is in contrast to the official NWS station at Furnace Creek, where vegetation and nearby structures cause somewhat reduced ventilation and thus somewhat inflated summer maximum temperatures.

There are now five high-quality stations in Death Valley (near or below sea level in elevation) with near real-time data online.  Here are some of the particulars, north-to-south, with the links to the data:


Stovepipe Wells

USCRN SITE NEAR STOVEPIPE WELLS 1SW, CA. ISWC1 (CRN)
Elev: 80 ft.; Lat/Lon: 36.60194/-117.14500
This is a very well-exposed climate station with very high quality control.  The temperature sensors/radiation shields are aspirated and about 5-6 feet above the ground.
Home page for Stovepipe Wells
Latest 5-minute data for Stovepipe Wells from NWS/NOAA
Data Page for Stovepipe Wells
Info on USCRN station type
Instrumentation
—
Death Valley Park Village (CARB)
Death Valley Natl Park, CA. CQ162 (CARB)
Elev: 410 ft.; Lat/Lon: 36.5070/-116.8478
Latest hourly data for Death Valley (CARB)
CARB stations and info
It looks like one must click on the link above to access the Death Valley Park Village data sets.  Scroll down the station list to “Death Valley” and then look for temperature for the temperature records.  Data go back about 30 years, and you can see hourly temperatures!
This California Air Resources Board station is a little different than most “standard” weather stations. It is extremely well-exposed, up on slopes just above the Cow Creek village (three miles north of Furnace Creek).  The temperature sensor and shield are well up on a tall pole, perhaps more than 25 feet above the ground.  This provides VERY conservative temperatures on sunny summer afternoons here, perhaps 2-3 degrees cooler compared to temperature at five feet above the ground.  The temperature data are updated just once per hour, at the top of the hour, and the temperature provided is the HIGHEST temperature measured during the previous hour.  So, this site is great for providing high temperatures in the air 25-30 feet above a very well-exposed locale!  It is not unusual to see summer maximums at this site some 6-7 degrees (F) lower than the maximums measured at the nearby NWS Death Valley station in Furnace Creek.
The elevation here, 410 feet above sea level, is 600 feet higher than at Furnace Creek.  That alone would help make it about 3 degrees (F) cooler comparably on a typical sunny summer afternoon with good mixing.  The stark differences in station exposure and sensor height above the ground account for the typical 3-to-4 degrees of remaining high temperature difference.
—
Death Valley (Furnace Creek/NPS Visitors Center)
VISITORS CENTER AT FURNACE CREEK DEATH VALLEY, CA. DEVC1 (HADS)
Elev: -193 ft.; Lat/Lon: 36.46222/-116.86361
Latest hourly data for Death Valley
More detailed data (up to last 7 days)
Long term Death Valley climate data and records from the Western Region Climate Center
The old cooperative station climate forms (from NCDC) for Greenland Ranch, Death Valley, and Cow Creek can be accessed here.
This is the official NWS cooperative weather station for Death Valley.  It is at -193 feet, and is just northwest of the NPS Visitors Center building.
—
Badwater
DEATH VALLEY NP – BADWATER BASIN, CA. BWBC1 (HADS)
Elev: -219 ft.; Lat/Lon: 36.22944/-116.76694
Latest hourly data for Badwater
More detailed data for Badwater (last 7 days)
List of HADS stations in California
—
Saratoga Spring
SARATOGA SPRING, CA. TOGC1 (RAWS)
Elev: 198 ft.; Lat/Lon: 35.680514/-116.422208
Latest hourly RAWS data for Saratoga Spring
Data Page for Saratoga Spring
Southern California RAWS stations
RAWS stations archive
Check out the Data Page above to access all old Saratoga Spring records, back to 2013.  In it, you can get the “real” high and low daily temperatures in the monthly summaries.  Usually the high and low temperatures are a little different than the highest and lowest hourly readings provided.
I have found some RAWS stations to be AWFUL on temperature measurement in bright sunshine with light winds.  Some, and perhaps most, RAWS stations show inflated temperatures with these conditions.  Some RAWS stations seem to be routinely plagued with this issue, some not so much, or hardly at all.  It seems that the instrumentation (radiation shields and sensors) is just not up-to-par quality-wise to provide excellent, reliable, and trustworthy and authentic temperature measurements in sunshine with light wind (under about 8 mph).
Having said that, most RAWS stations are very well-sited at well-exposed locales, such as on ridge-tops and hilltops.  The RAWS stations are generally nowhere near obstructions such as buildings and trees.  Thus, RAWS stations are typically in spots where the air is well-mixed and where high temperatures are naturally quite conservative, comparably.  The typical instrument siting tends to effectively diminish, or “mask,” any artificially or inflated high temperature measurements which might occur (due to somewhat inadequate instrumentation).
So, does the Saratoga Spring RAWS station seem to be afflicted with routinely inflated maximum temperatures due to instrumentation problems?  It does not seem to be the case.  The station is likely very well-exposed, and it does tend to be quite breezy on summer afternoons in the area, which greatly minimizes this problem.  I have seem some hourly temperature readings at Saratoga Spring which seem a little too warm, during light winds.  But, I honestly have not studied the data from here that closely.  Its record of annual and monthly maximums in summer appear very reasonable when compared to surrounding stations.  So, thankfully, I cannot say that the high temperature record from this RAWS station is “very shaky” as I do for many other RAWS stations.  BUT — it is a RAWS station and it must be stated that all high temperature data from RAWS stations should be considered as possibly problematic.

Filed Under: 2021, BLOG, Climate, Death Valley, Weather and Climate Blog, Weather Stations

Leave a Reply

You must be logged in to post a comment.

Search

August 2021
S M T W T F S
1234567
891011121314
15161718192021
22232425262728
293031  
« Jul   Sep »

Categories

Archives

Copyright © 2025 stormbruiser.com · Log in