March 1, 2022
Today I am posting the first of what I hope will be many entries regarding bad, poor, lousy, incorrect, and/or dubious weather data. I have been studying and looking at weather data, both official and unofficial, for more than 40 years. I think it is important to share what I have learned while pointing out data, past and present, which appear to be untrustworthy. Hopefully this might help all of you future climatologists and researchers out there who wind up looking back at some of this weather data. Since I live in Southern California and I am most familiar with the local and regional climate and conditions, you can expect to see plenty of examples from California here. If you come across some weather data which looks “off,” you can contact me and I might decide to showcase the problem here on BAD WEATHER DATA. This post also reviews the good and bad of the current Los Angeles weather station, all at no cost to you.
Let’s start with the current status (the first week of March, 2022) of the official station for Downtown Los Angeles, California. It is also known as “the USC” station, and “KCQT.” The first official Los Angeles station opened in 1877. This is the long-term station-of-record for Los Angeles. Its location has bounced around a little bit in the previous 145 years, including a rooftop siting. The L.A. station has been the automatic (ASOS) one on the USC campus near Vermont and Jefferson since the 1990s, and it is operated and maintained by National Weather Service staff based in Oxnard.
Temperature data from the Los Angeles Civic Center/USC station appears to be a few degrees (F) too low as of March 1, 2022. Comparisons with other nearby stations, including the Hawthorne AP ASOS station suggest that the Los Angeles temperatures have been at least a couple of degrees too low (on both maximums and minimums) for a few months or more. As with a lot of questionable weather and temperature data, the current readings are “close enough” so that they might not appear to be “bad” with just a casual glance. Thus, the bad data tend to go unnoticed, and they continue. A friend with the NWS in Oxnard (who suspects the same problem as I do) reports that the NWS is aware that the station’s temperatures might be off some.
I did a quick comparison between average maximums and minimums between Los Angeles (KCQT) and Hawthorne AP (KHHR) and found that L.A. has averaged a degree or two cooler than KHHR for the past three months (Dec/Jan/Feb). A check of the same three months for the previous few winters shows that Hawthorne AP is typically the cooler station of the two (by a degree or two). Hawthorne AP is closer to the cool waters of the Pacific Ocean, and thus it averages cooler on high temperature on a typical fair winter day with a weak afternoon sea breeze.
The temperature problem at Los Angeles/USC became quite apparent during a warm spell in mid-February, 2022. Offshore flow caused much-above normal maximums throughout the Los Angeles Basin. Here are some reported maximums for the area from February 9-13:
Los Angeles/USC/KCQT: 83/83/82/86/84 ave 83.6
Hawthorne AP/KHHR: 86/85/84/89/87 ave 86.2
Los Angeles AP/KLAX: 85/82/81/89/85 ave 84.4
Long Beach AP/KLGB: 86/88/81/89/87 ave 86.2
Burbank AP/KBUR: 88/89/86/88/88 ave 87.8
The stations above are the closest airports with ASOS instrumentation. There was moderate offshore flow over the region during this timeframe. Skies were sunny, the airmass was very dry, and any afternoon sea breeze was either weak or late and/or quite modified. It looks like the sea breeze was early enough on the 11th to keep the maximum only in the lower 80s at LAX and LGB. Otherwise, maximums were 84F to 89F at all of the stations (except at downtown Los Angeles!).
Here are some other unofficial maximums for the same period (Feb 9-13) from nearby stations, of varying degrees of “official-ness”:
L.A.-North Main St/CARB 285′ 86/85/84/89/87 ave 86.2
Hollywood–L.A. EW1845/APRS 387′ 85/88/85/91/89 ave 87.6
W Hollywood–N Kings Rd/SCE 416′ 83/86/82/87/85 ave 84.6
Santa Monica AP/KSMO 174′ 82/82/79/90/84 ave 83.4
Baldwin Hills–Overhill Dr/SCE 415′ 83/82/80/87/84 ave 83.2
Montebello KE6JPV/APRS 233′ 85/85/84/89/87 ave 86.0
S Pasadena–Illinois Dr/SCE 866′ 84/85/83/85/84 ave 84.2
…and, in case you forgot or can’t scroll upwards, the average maximum at downtown L.A. for the 5-day period was 83.6F.
Note—the maximums in this second table of stations are based on reports provided every 10 minutes, for the most part. In most instances one can assume that the REAL maximum temperature for the day is that which is indicated here, or perhaps a degree warmer. The KSMO ASOS maximums are based on the hourly observations only. All of these maximums appear to be very trustworthy. The SCE stations are excellent and are generally very well-exposed. The maximums from the SCE stations are quite conservative due to the good exposure and because the instrumentation is high up on a utility pole. During sunny afternoons, temperature is usually a couple of degrees cooler some 25-35 feet above the “standard” 5-6 feet above the ground for conventional stations. The L.A. CARB station temperatures are also from a sensor high on a pole and/or rooftop (based on the other CARB stations that I am familiar with) and so maximums are also very conservative comparably. The bottom line: A standard station sited near the base of a CARB or SCE utility pole would typically provide maximum temperatures some 2-3 degrees F WARMER than a SCE or CARB sensor 20-30 feet above.
On such sunny winter days when offshore flow prevails over all or most of the L.A. basin (and when the sea breeze is basically a non-player more than a few miles inland as far as moderating high temperature), the Los Angeles Civic Center/USC station is USUALLY among the warmest on high temperature reports at these stations in the Los Angeles Basin. Such was not the case from Feb 9-13, 2022. Based on the climate history, one would expect the maximums at Los Angeles to be very close to or even a little warmer than the maximums at Hawthorne AP and Long Beach AP.
A Diversion into the Siting of the Los Angeles Weather Station:
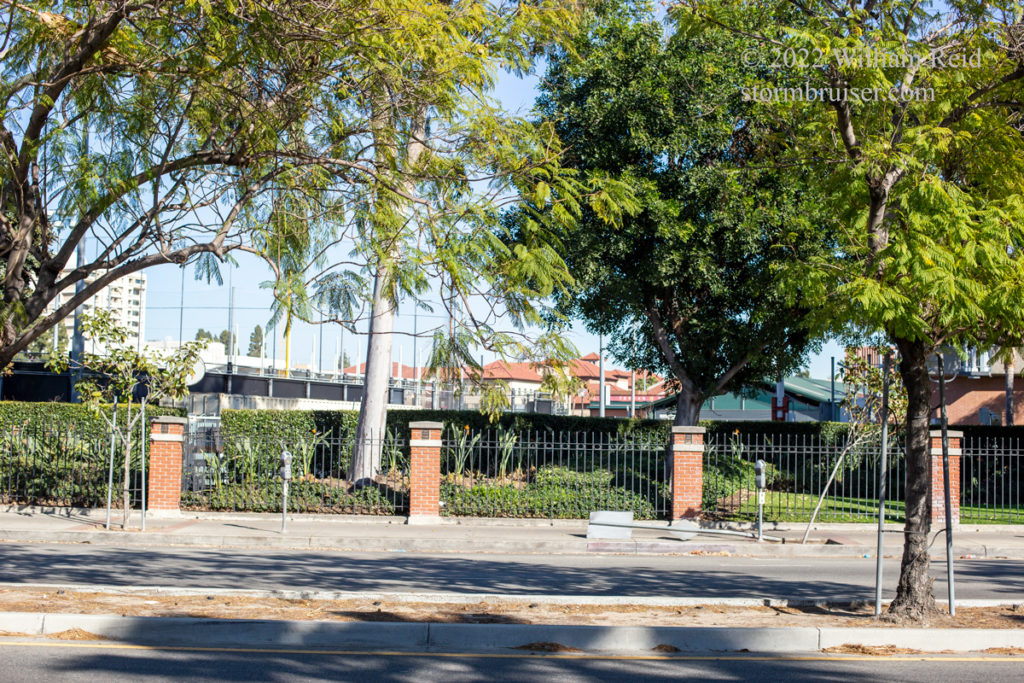
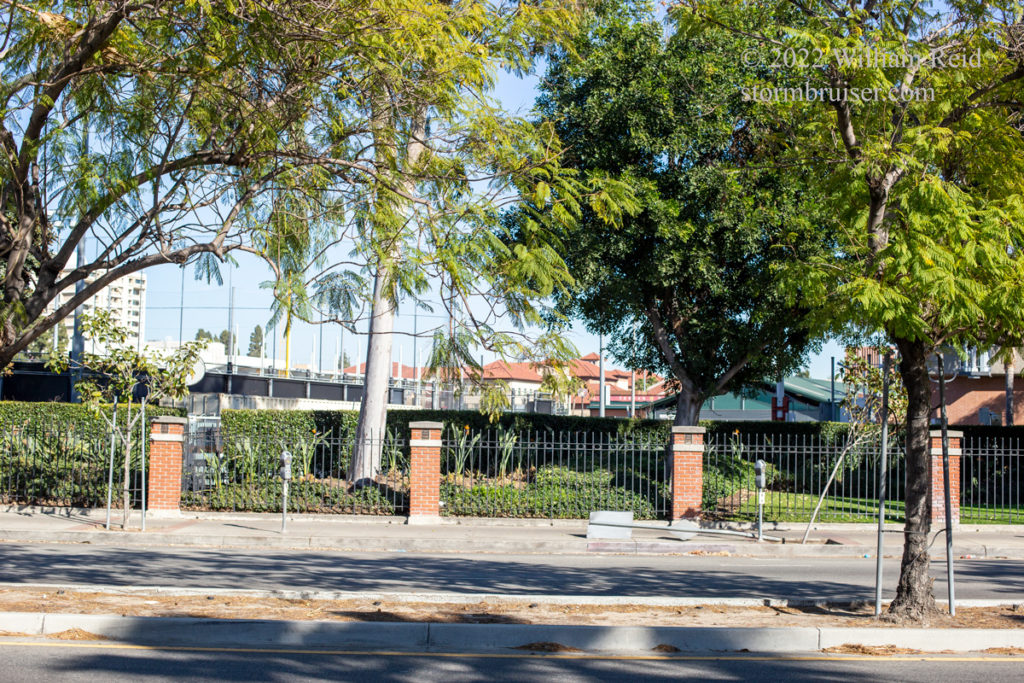
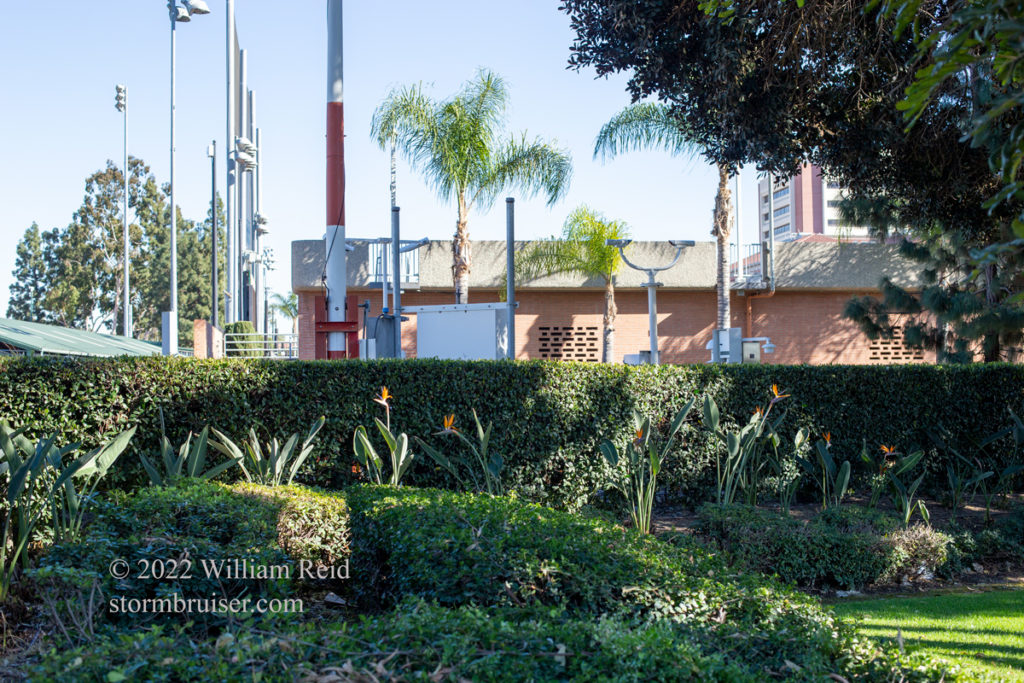
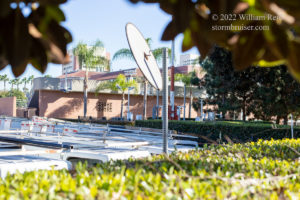
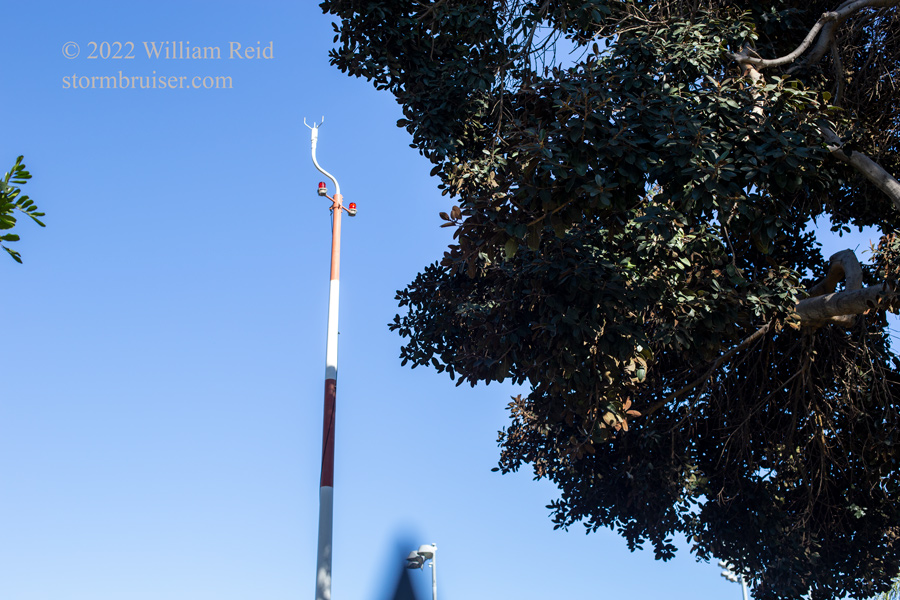
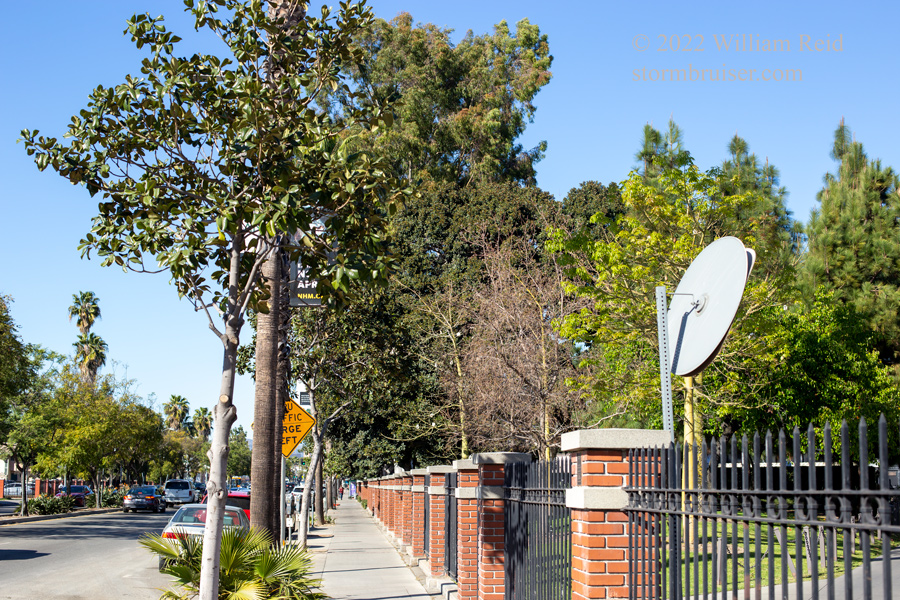
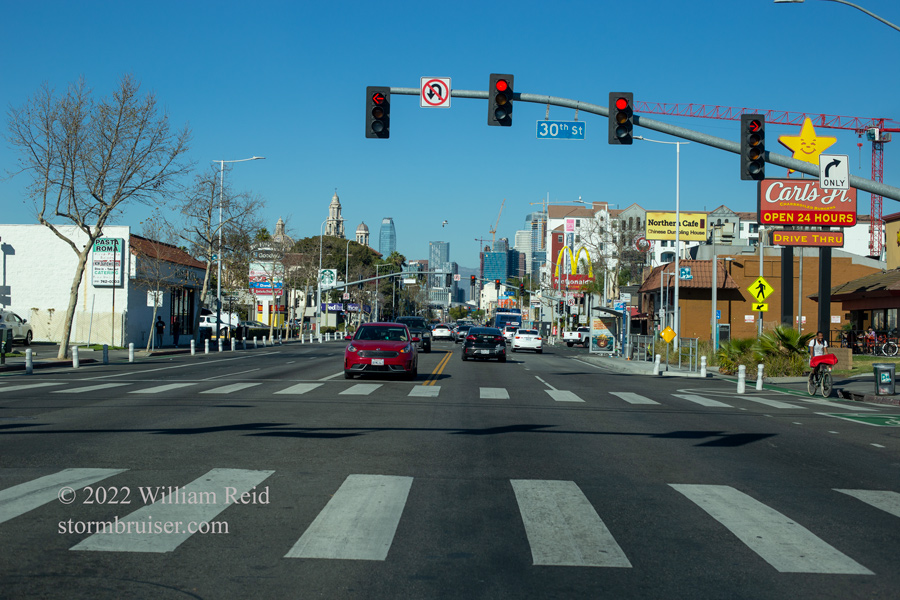
The Los Angeles station’s ASOS equipment is on the western edge of the USC campus, along South Vermont Avenue and between Jefferson and Exposition. The location is about one mile south of I-10 (Santa Monica Fwy) and one mile west of I-110 (Harbor Fwy). Images 1-5 below show the station area from Vermont Ave. on February 28, 2022. Image 1 is a view of the station from the west side of Vermont, looking eastward across the street. Image 2 is also towards the east, but on the east side of Vermont. Image 3 is towards the SE, as I hold the camera up above a hedge. Image 4 shows the top of the 10-meter pole with the wind sensors. Image 5 is looking north along Vermont, near the ASOS. Image 6 is along Figueroa near USC, looking NNE at the L.A. skyline, a couple of miles distant.
Here are some overhead/satellite views of the L.A. ASOS area:
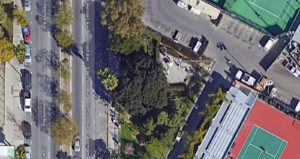
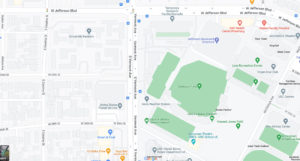
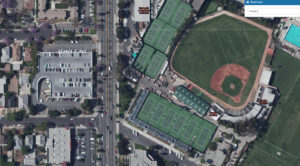
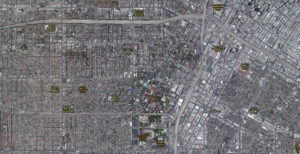
The satellite images show very, very little open space and very little grassy and vegetated areas in the neighborhoods near the L.A. ASOS. However, a large baseball field and football field are just east of the ASOS! These grassy areas would have much greater cooling on clear nights than the surrounding urban environment, and they would also be a little cooler during midday sunshine, too. We know that densely-developed urban environments are subject to the “urban heat island” effects. Los Angeles is no stranger to these effects! It is extremely rare for the city to set new daily minimum temperature records, given that records go back to times when the ground cover was largely natural. So, with regard to maximum temperatures, is the Los Angeles ASOS weather station in a comparatively cool spot or a warm spot? The answer is not particularly easy and some researchers might have other ideas, but I think the consensus (which I agree with) is that the station provides somewhat warm-ish maximums.
The common problem, though, is to determine exactly what is a good standard location for such urban weather stations? Should the station be above a grassy field adjacent to a football field and a baseball diamond? In this case, it would be “cool-ish” and it would not be especially representative of the adjacent highly-developed areas. Should the station be up on a rooftop so that the ventilation and exposure are really good? In the rooftop situations, the maximums and minimums are generally very conservative (maximums are cooler and minimums are warmer compared to surface-based stations). Rooftop stations are good for wind obs, but the rain gages on roofs tend to catch less rain. How close is too close to trees, to walls, to buildings, to pavement, to air conditioning equipment, to solar panels, to parking lots with trucks and automobiles?
The current Los Angeles ASOS weather station equipment is in a locale which cannot be considered “well-ventilated.” Nearby hedges, trees and buildings drastically reduce the wind flow at the height of the ASOS temperature sensor (which is presumably about 5-6 feet above the ground). I might characterize the exposure and ventilation for such an important weather station as “less than adequate.” Such an exposure promotes warmer-than-desired maximum temperature measurements (if the surface cover is not moist) on days with abundant sunshine. However, it could be argued that there are very few sites in the vicinity with adequate exposure, and that the current station site IS INDEED representative of the neighborhood in this regard.
The ground cover directly beneath the instrumentation and in the ASOS station area appears to be unnatural, and of a light or white color based on the satellite views. Perhaps this is a light-colored crushed rock of some sort which does not tend to get too hot in the direct sunlight. Still, the ground cover for this station is not natural, it is not grassy, and it would promote somewhat warmer-than-desired maximum temperature measurements on days with abundant sunshine. Unnatural ground cover is far and away the norm for this neighborhood and for the Los Angeles Civic Center area, and thus the station’s groundcover does again represent the general area in this regard.
The nearby obstructions to the wind and the immediate ground cover at the Los Angeles ASOS station contribute to “warm-ish” maximums on sunny afternoons. Fortunately, this “warm-ish” bias is probably mitigated to some extent by the surrounding “cool-ish” grassy areas of the baseball and football stadiums (and the ring of grass immediately around the station), and by the large tree(s) which appear to shade the ASOS area during the mid and late afternoon. The general area also appears to be quite a bit more “open” compared to adjacent areas. The station is near the wide boulevard and the sports complex with the fields and tennis courts. And, most buildings in the vicinity are only one-story tall. Though the immediate ASOS area is poorly ventilated due to the nearby hedges and trees and fences and low buildings, the general surrounding area (within about 100 meters) is generally “open” compared to most of Los Angeles.
The influences which reduce ventilation, the immediate ground cover, and some adjacent ground cover that is paved (such as Vermont Avenue) contribute overall to a “warm-ish” bias on maximum temperatures at the Los Angeles ASOS station. (This is relative to an ideal station in a wide-open and undeveloped area above a natural ground surface!) But we are talking about a dense urban area here, so I do think that this ASOS station is in a decent spot which provides very reasonable temperature measurements. One should expect warmer maximums here on sunny days compared to nearby airports where ASOS instrumentation enjoys far better exposure.
The current ASOS station is a couple of miles closer to the ocean than the previous official Los Angeles weather stations. When the site was changed from downtown L.A. to this USC site, it was thought by some that the new site might be significantly cooler on maximums comparably (since it was closer to the cool ocean). There was conjecture that the long temperature-climate history of Los Angeles might suffer some due to the site change. However, it may be that the somewhat warm-ish bias of the USC station compensates for its “closer-to-the-ocean” siting, and that the long-term continuity of the maximum-temperature record at Los Angeles is still reasonably good.
End of Diversion!
Getting back to the current status of the L.A. station, the maximums during the February 2022 warm spell (provided above) strongly suggest that the Los Angeles/USC station was (and still is) about three degrees (F) too cool comparably. This notion is supported by my quick comparison of average maximums for recent winter months between Los Angeles and Hawthorne AP. And, it is supported by own personal temperature comparison made on February 28, 2022. On that date, I compared the Los Angeles temperature with readings off of my handheld Kestrel thermometer (which is very reliable and accurate!). I approached the L.A./USC station from the west just prior to the 2:47 p.m. METAR, and was getting readings generally close to 80F along Exposition Blvd. My walks along the sidewalk adjacent to the station yielded readings mostly from 80 to 81F. This was maybe 5-10 minutes after the 2:47 p.m. observation at L.A., which gave a temperature of 76F. The sunshine was bright and winds were quite light at the time, with a very weak westerly sea breeze going. Thus, my measurements strongly suggested that the Los Angeles temperature report was at least 3 degrees (F) too cool.
Eventually the NWS technician will switch out the sensor and/or do what he needs to do in order to get the station’s temperature correctly calibrated again. I will let you know when that happens!
I do suspect that the sensor is out of calibration. I don’t know why this happens or how it happens, but it does not seem to be that rare of an occurrence with the ASOS equipment. Through the years I have seen numerous ASOS stations suddenly start providing bad temperature data. It is commonly just by a few degrees or so, it is usually on the “too warm” side, and it is commonly not quite enough of a discrepancy for it to be easily noticed. There was a period of a couple of years (at least) around 2019-2021 when the ASOS at Camarillo AP was running 3 degrees too warm on temperature (night and day). Camarillo set all sorts of temperature records and was hottest in the nation numerous times during this stretch. Unfortunately, its temperatures were not valid. I bugged my buddies at the NWS in Oxnard about it on occasion, but it took maybe two years before the NWS switched out the sensor. All of a sudden, the Camarillo temperatures again matched up properly with the surrounding stations once the new sensor was installed!
Unfortunately, it seems likely that the climate records of Camarillo and now Los Angeles will be impaired some due to such problems. The moral of this story is this: Weather stations wear out, instruments fail, glitches occur, and occasionally some unreliable weather reports wind up in the record. If a climate record looks bad, it just might be bad. And even if a climate record looks okay, it still might be bad!
Other notes that some climatologists might share:
What is the deal with the humongous tree that is very close to the Los Angeles ASOS station on the west side?! That thing does not lose its leaves in winter, and it is perfectly situated to shade the ASOS area by about 2 p.m. every afternoon. That tree has got to be modifying mid-late afternoon temperatures at the station by a couple of degrees at least, I would estimate! Whether or not the tree’s presence is a good thing or a bad thing with regard to temperature measurements is debatable. The afternoon shade would have a big impact on maximum temperatures, presumably. It would also pretty much cancel out the poor ventilation issue which promotes the warm-ish bias. Temperature at this station often reaches a peak around noon, and then levels off or falls slightly when a sea breeze front passes through. Temperature often starts to creep back up into the mid-late afternoon hours, but by then the station is shaded, and maximum temperature winds up being not as warm as it otherwise would be if the tree were not there. Presumably the tree has increased substantially in size since the station opened. I suspect that the tree now might keep the maximum temperatures down a few degrees compared to the first decade or two when the tree was much smaller. (It would be fun to compare the average hourly temperatures early in the station’s existence to today.) My advice is to get rid of that tree and any others within a stone’s throw of the station. The tree is obnoxiously close to the top of the wind pole, and the wind data suffer. Is there any other ASOS station out there that is so close to such a large tree?!
And speaking of wind data, I suspect that the Los Angeles/USC ASOS station has the lowest average annual wind speed of any ASOS in the nation. Check out the hourly wind readings from Los Angeles — any time of the day or the year, it really doesn’t matter! Chances are very good that you will see a long line of “calms” and/or speeds of only 3-6 mph, and plenty of variable wind directions. The area is one which is subject infrequently to moderate and strong winds, and the poor ventilation due to the nearby trees and buildings reduce further what wind there is.
Just for fun I checked the average wind speed for this station for February 2022. It was a paltry 1.4 mph. For both last June and July it was 1.5 mph. Don’t expect much excitement there if you like to fly kites!

Leave a Reply
You must be logged in to post a comment.