The mega heat event of late June, 2021, smashed all-time high temperature records for many stations in the Pacific Northwest of the United States. This quick-and-dirty entry provides links (and some discussion) to the official NWS investigations into the new records set for Washington and Oregon.
This link is for the paper on the Washington record. A reading of 120F at Hanford, WA, on June 29, 2021, was deemed reliable and valid by the investigators. The old record for Washington was 118F.
This is the link for the Oregon record. Measurements of 119F were accepted at stations at Pelton Dam and Moody Farms East Satellite. These maximums tied the long-time state high of 119F at Prineville in 1898.
Canada also had an all-time record high temperature on June 29, 2021, with 121F at Lytton, in British Columbia. (See the Washington Post story here and a better one here.) The old record for all of Canada was previously 113F.
Both papers (on the WA and OR records) are quite comprehensive and informative. The authors touch upon many details and items which I discuss in my Death Valley temperature research, such as station siting problems (if any), the length of time averaged for the temperature measurements, etc. And, I have no problems or issues regarding the findings and determinations by the investigative committees. That saves me a lot of time, right?!
(Added in DEC 2022: I came across this paper by Schumacher et al. which provides details on the causes of the PNW heat wave of late June 2021. Air in the slowly eastward-moving upper high over the region (in an Omega-block pattern) was much hotter than climatology in large part due to excessive latent heat release upwind over areas of the North Pacific Ocean. Beneath the hot upper-level anticyclone and its subsiding air, soil moisture values for much of the region were at very low levels. Thus, the dry soils allowed enhanced ambient daytime temperatures under the high midday sun. Several days beneath the strong upper high combined with the drier-than-normal soils permitted deeper-than-normal boundary layers, or surface-based mixed layers, during the afternoons. The deeper boundary layers meant that air with increasingly higher potential temperatures aloft was accessed with time until the height of the event. The event is certainly quite similar to heat events in the Death Valley region, in that it was associated with a very warm air mass aloft that was associated with an upper-level high (i.e. a mid-upper-level anticyclone), and dry soil conditions. Of course, the Death Valley region experiences such conditions on a regular basis during the warm season. Death Valley is much closer to the subtropical latitudes, where these upper highs are much more common in summer, and the soil conditions in the Death Valley region are generally very dry and in “heat-wave-ready mode” by early summer every year.
This extreme event in the PNW in June 2021 was so “bad” in large part because of the pattern upwind over the North Pacific Ocean. A Pacific storm system and its high water content resulted in very high latent heat release due to condensation. The heat was entrained into the building upper high over the PNW and vicinity. The “blocking” pattern allowed the persistence of the upper high over the same region for a number of days, allowing the warm-to-hot air to build. Relatively dry weather and drought conditions in the months prior to the event translated to very dry soils, deeper mixing during the afternoons, stronger super-adiabatic lapse rates in the lowest 10-30 meters or so at the surface, and thus hotter maximum temperature measurements at stations above natural surfaces (comparably). You know the story — drought begets drought, and record-setting heat waves are associated with very dry periods. See the Dust Bowl temperature records on the Great Plains during the 1930s!
121F at Lytton, BC
There are a few things for me to highlight on the write-ups for the WA and OR records. But first, let’s look at the new record for Canada. The little town of Lytton is along the Fraser River, and its weather station is at an elevation of 751 feet. Its maximum of 121F/49.6C on the 29th was the third of three consecutive days with a new all-time record maximum temperature for Canada. From Wikipedia:
The record occurred after consecutively setting new record highs of 46.6 °C (115.9 °F) on June 27 and 47.9 °C (118.2 °F) on June 28. It is also the highest temperature ever recorded north of 45°N, the highest temperature in the U.S. or Canada recorded outside the Desert Southwest, and higher than the absolute maximum temperatures of Europe or South America.
Interestingly, the Wikipedia site indicates that a second “more modern” weather station in Lytton had a maximum 1 degree Celsius cooler than the 49.6C. (I have no other info to share on this other “more modern” station.) Wikipedia references this blog article, which includes images of the Lytton weather station and environs. Thus, as far as I know, the record 121F measurement at Lytton is from the automatic station that is plotted on the NWS/NOAA “weather and hazards” maps, and is the station shown in that foreign-language blog article. This Lytton station has a web cam, which provides a great look at the station siting, ground cover, and some instrumentation.
Not surprisingly, Lytton is in a fabulous spot (with regard to local topography) for generating relatively warm (or hot) maximum temperatures during afternoon sunshine. The maps below show area observations at 5 p.m. on June 29, 2021, which is close to the time when Lytton hit 121F. Lytton is well inland, so there was little or no mild marine air filtering into those low-elevation areas along the Fraser River, presumably. These topo maps show Lytton surrounded by much higher terrain for the most part.
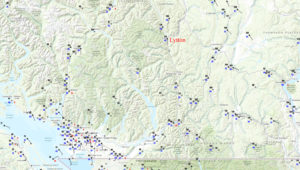
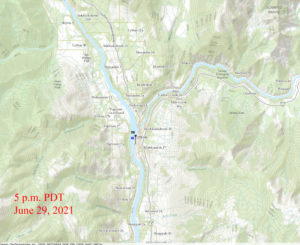
The strong upper-level high-pressure system and its associated subsidence effectively prevented the intrusion of any maritime air. Like a typical summer afternoon in the Mojave Desert, there (no doubt) was deep surface-based mixing in the lower troposphere. The mixing promoted a lapse rate approximating the dry adiabatic lapse rate up to the 600 mb level (or thereabouts). The higher terrain around Lytton contributed to diminished wind movement through the Fraser Canyon valley or canyon. This helps some to keep surface-heated/low-level air from mixing upwards as quickly. Wind was light (under 8 mph) and from the south during the afternoon at Lytton.
Also contributing to high-temperature readings (and a steeper super-adiabatic lapse rate in the lowest 5-10 feet above the ground) is the weather station environment. The weather station plot on the NWS/NOAA map shows the station between the western edge of the town and the Fraser River.
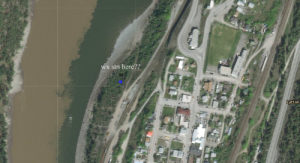
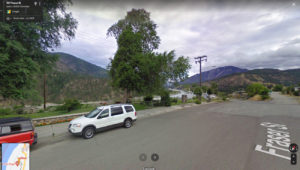
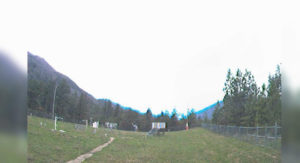
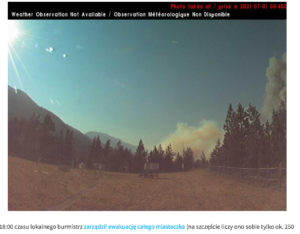
The first image of the four above shows the station to be in a little forested swath. If the plot is correct, then those trees have been cleared out. The second photo above is a Google street-view look towards the northwest from the N-S road that is just east of the station (or east of the station plot, I should probably say!). It appears that the land slopes downward to the river from the edge of town. The final two images are from the weather station web cam. I think that the view is to the north. The first image is a screenshot which shows conditions on April 1, 2022. The bottom image is from the blog article mentioned above, and I believe that this is from the timeframe of the record-high temperature readings. Smoke is in the distance, and much of Lytton was devastated by a wildfire on the day following the record-setting maximum temperature.
Not surprisingly, the weather station environment appears to favor (or promote) enhanced maximum temperatures on sunny summer afternoons. The ground cover, grassy in the spring of 2022, is quite dry and barren in the image of late June, 2021. Of course, a barren ground heats up under a high sun much more than a grassy surface. (If the entire weather station area were grassy and well-watered, it is doubtful that the maximum temperature in June, 2021, would have exceeded about 117F.) The next part of the equation is the ventilation through the weather station area. The intense summer sunshine has heated the mostly barren ground surface, and the air right next to the ground is heated in turn. Is this locale well-exposed? Is the normal airflow through the vicinity of the station hindered or slowed at all, which would contribute to higher maximums because the hot air near the ground is not effectively and efficiently mixed out? The answers appears to be “no” and “yes!” No, the exposure is not very good. Yes, breezes through the area would be slowed as tall pine trees surround the weather station site. This looks like an ideal weather station environment if one is looking to register extra-high maximum temperatures.
Though the station is near the cool river waters, I think we can conclude that southerly breezes through the station during the afternoons of the heat wave were not modified by the river.
So, to wrap up my thoughts on the Lytton reading of 121F…
…the general regional topography, with Lytton at the bottom of a canyon environment, promotes higher maximum temperatures (as opposed to better-exposed locations along slopes or on ridges)
…the immediate surroundings and ground cover of the Lytton weather station site in late June 2021 promoted relatively higher maximum temperatures during the heat wave. The ground was bare for the most part, and nearby tall trees diminished the ventilation through the site. The nearby town probably doesn’t affect maximums at the station significantly one way or the other.
…Lytton’s relatively low elevation under 1000 feet contributed to the excessive maximums, obviously. Its maximum of 121F compares rather closely to record maximums at stations at elevations around 1000 to 1500 feet in the Death Valley and Mojave Desert regions.
…there appears to be no reason to doubt the high temperature reports from this Lytton station. The station appears to be fairly high-end, though I have no idea how well-maintained it is.
Though the station is in a rather poorly-ventilated locale, I see no reason to NOT accept the Lytton 121F record as authentic. There isn’t a perfect place to site a weather station in such a confined area with the river, the town, and the surrounding woods and slopes. If this were a wide-open and flat area, the maximum temperature registered under the same conditions aloft would probably be a few degrees cooler due to better mixing. Lytton is a hot spot, and its weather station is in a hot spot. Though I describe the exposure as “not very good,” I would still regard the exposure as adequate for a weather station.
120F for WA and 119F for OR
The detailed analyses of the records (linked above) is/are good stuff! Several items are worth discussing.
First, there was assembled two “State Climate Extremes Committees” (SCEC), one for WA and one for OR, and they collaborated to some extent. Experts from local and regional NWS offices, the Western Region Climate Center, NCEI, and the state climatologist offices teamed up to examine the temperature data recorded for the event. This brings up the question: Is there an SCEC for California?! We might not need an SCEC from California to review the recent 130F maximums in Death Valley (which appear valid). We need (in my opinion) an SCEC to review the likely bogus Death Valley temperature records of July 1913. Is it not somewhat strange that an official review of the 134F temperature of July 10, 1913, has never transpired? If states are assembling teams to review a record high temperature, then should not a team be assembled to review the long-accepted (but disputed) high-temperature record of the country?
Second, both teams discussed the old high-temperature records for their states. These old records did not appear to be especially solid…and I will leave it at that! It is good that the high-temperature records are reliable now.
Third, both SCEC teams rejected a good number of maximums which were higher than the 120F for WA and the 119F for OR, and for a variety of reasons! Of course, there are standards which must be met if a station is to be considered a candidate for such records. In the past, it was just the USWB/NWS cooperative stations, the First Order stations, the airport weather stations, etc., which were candidates. The USWB and NWS generally dismissed the notion of considering temperature readings off of non-standard instruments and from non-standardized equipment. And, the weather station had to meet certain siting and exposure requirements. Today there is a myriad of weather stations online, and most are not under the auspices of the NWS. The SCEC committees had to weed through the records and the available station information to determine if any of these non-NWS stations were suitable for consideration of the new state high-temperature record.
The committee for Washington dismissed the high readings from stations provided by the WA Dept of Ecology, which ran as hot as 134F. They say that their station sitings are “not ideal,” but I think that the main problem is the radiation shield and its close proximity to the metal equipment and solar panels. Good decision to dump these stations!
A CWOP station at Winona, WA, had 131F. This was well above all of the other reasonable readings, and the 131F was discarded. The committee didn’t specifically say why, however. I wonder, if this private Winona station had measured 121F, if it would have been recognized as valid. Several WSDOT (Washington State Dept of Transportation) stations reached as high as 119F. Fortunately for the reviewers of the WA data, all they had to do was throw out the goofy Ecology stations and that one bogus CWOP station. Next in line was the 120F at the reliable Hanford mesonet. The 120F measurement at station 100F passed muster — it was consistent with the other closest mesonet and ASOS and cooperative station maximums.
In the table provided with the list of maximums (for both the valid and discarded stations), I would have liked to have seen the station elevation included, as well as the height of the sensor above ground. How high above the ground are those WSDOT sensors?
The SCEC group for Oregon looked to have a more difficult task, as numerous maximums of 120F and higher from numerous different types of stations were dismissed. A few maximums from 128F to 131F were discarded as they were obviously too hot. These were from USGS, WU, and railroad providers. Maximums from 120F to 123F were discarded at stations provided by UPRR, ODOT, USGS, COOP, CWOP and WU. These were the tough ones to discard, and to their credit, the SCEC team provided a reason that the maximums were considered to be too high and therefore not eligible. Two ODOT stations hit 122F, and the reasons for eliminating these was somewhat weak: 5-6 degrees too hot compared to neighboring stations. If so, then why are these stations reading too warm? Why not figure it out and offer a remedy so ODOT temperature measurement can be updated and considered authentic?
The USGS stations run too hot. If these government agencies are going to the expense of setting up weather stations and are putting the data online, then why can’t they make sure that the temperature data are reasonable and are close to NWS standards?
The UPRR (railroad) station high temperatures are eliminated because they run too hot. The Oregon committee says that the stations are next to railroad tracks (and a paved road in at least one instance). I figure that the reason that the UPRR stations run too hot is something else, and is not the nearby ground cover. Usually these transportation agency stations have their temperature sensors well up on a pole, where the influence of ground cover is minimal. And, these stations tend to be very well-exposed. (Though I suppose a long train sitting right next to the station would be problematic). Why do these UPRR stations read too high? Is the radiation shield a junky one?
A WU station in Salem was discarded (with 120F) because it was warmer than nearby sites and because it was over asphalt. Good decision! However, what if there were no nearby sites? Would it get the axe just because it was over asphalt? Probably.
An “inactive” coop site at Lebanon hit 120F and a WU site at Lebanon AP had 119F. Both of these were eliminated. The coop site was eliminated because it was no longer maintained. It would be nice to know more about this station. Is the exposure still good? Are the data from this station still good? The station at Lebanon AP is up on a pole, 15-20 feet above the ground, but above the asphalt runway. Typically, the air at this height is a degree or two cooler than that at the standard shelter level of 5-6 feet above the ground. The committee did not like that it was above asphalt and that the maintenance record was unknown.
So, I do have to quibble some regarding the elimination by the SCEC of these readings from Lebanon. The readings support each other. The ground cover is not that big of an issue if the sensor is 15-20 feet above the ground, and an airport exposure should be excellent. If I were on the committee for Oregon, then I would have been looking a lot more closely at the two Lebanon stations. Lebanon is at about 350 feet above sea level. Salem AP (205 feet) isn’t too far away and it reached 117F. I suspect that these Lebanon maximums of 120F and 119F are fairly trustworthy, but I would want to inspect the stations and their recent records before accepting the maximums.
The 119F readings at Pelton Dam (coop) and Moody Farms (Agrimet) appear legitimate and were accepted by the SCEC, tying the old record of 119F (from 1898) in Oregon. Again, in the discussion and tables, the elevations of these stations and the sensor heights above the ground are not provided. Please include this information in your next summary!
The Pelton Dam station is at about 1410 feet elevation, and is situated in a fairly narrow V-shaped canyon. The canyon environment likely helped to slow the wind and ventilation some on this hot day (June 29, when it hit 119F). The picture of the station (in the summary for Oregon) shows the MMTS (thermometer radiation shield) above somewhat bare ground with very dried-out grass. A fairly large home-like structure is less than 30 feet away. This building no doubt helps to diminish mixing and ventilation through the Pelton Dam temperature equipment. Thus, much like the current Death Valley station, maximum temperatures here are likely inflated a bit (2-3 degrees F?) due to the combination of very dry ground around the station and the diminished ventilation due to the nearby structure. See the map below for the location of the Pelton Dam station (P) and the Moody Farms station (M). The weather plots are from about 5:45 p.m. PDT on June 29, 2021, or very close to the time of the highest readings in the area.
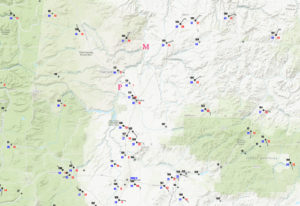
Pelton Dam is along the Deschutes River, only 4-5 miles northwest of the airport for Madras, Oregon. On June 29, Pelton Dam had a maximum of 119F. Nearby, the Madras cooperative station had 111F (elev. 2230′), Madras Municipal AP had 113F (elev. 2427′), an Agrimet station just north of the airport reached 112F (elev. 2440′), and an ODOT station in Madras reached 112F (elev. 2244′). Another nearby CWOP station, northwest of Madras and northeast of Pelton Dam, had 112F (elev. 2365′). (Except for the coop station, some of these maximums might have been a degree or so higher as these maximums were taken from the online observations provided only.) It is comforting to see that all of these Madras-area stations are in the same ballpark for the maximums on June 29. A RAWS station called “Warm Springs Base” is north of Pelton Dam at 1563 feet, and it reached 117F.
A Madras cooperative station has been in operation since about 1920! Its all-time high through 2021 is still the 112F attained in July, 1928. As noted above, the Madras cooperative station for this event reached only 111F.
If we can assume that the 113F at Madras AP is legitimate and authentic (it probably is, since it is an ASOS station and it is supported by the other nearby readings), then this temperature does support the 119F at Pelton Dam. The Pelton Dam station is 1017 feet lower than Madras AP, so figure about five degrees hotter at the dam compared to the airport based on elevation and compression. The dam station “bakes” a little, also, given the exposure and ventilation issues discussed above. Thus, a 119F reading is expected when compared to the nearby airport maximum. If all we had to compare with Pelton Dam was the Madras coop site, with 111F, then I might be saying that the Pelton Dam maximum looks a bit inflated. Madras is 820 feet higher than the dam station, so elevation and air compression would account for a four-degree difference between the two.
As for the Moody Farms Agrimet maximum of 119F, that measurement looks okay as the elevation here is a little lower than Pelton Dam, near 1260 feet. Images of the station show a fairly ideal setup, way out in the open with zero nearby obstructions to the wind. The ground beneath is bone dry, as expected. (One would never expect damp soil beneath a station which sets an all-time high temperature record in the western U.S. ) The Moody Farms radiation shield appears to be a little higher than the standard 5-6 feet above the ground. And, apparently the calibration was checked on the morning prior to the afternoon of the 29th, and it passed with flying colors. Yay, Moody Farms!
FYI, the area from Moody Farms to Madras cooled significantly from 5 p.m. to 8 p.m. on the 29th, as winds shifted from southeast to northwest and increased significantly. The AP station was 113F at 5 p.m., 100F at 6 p.m., and 93F at 7 p.m.
Somewhat impressive, or maybe more odd, is that Oregon’s all-time high temperature is from stations which are above 1000 feet. I would have figured that at least one station near the Columbia River, where elevations are about 200 to 500 feet, would have a legitimate 120F from this event. (Just across the river in Washington, Hanford had 120F.) These stations near the Columbia River have a 4-5 degree F advantage (versus Pelton Dam and Moody Farms) based on the lower elevations. Hermiston AP is at 636 feet, and it hit 118F. The Hermiston 2 NW coop station had 117F, elevation 460 feet. A couple of Pendleton stations had 118F according to Climatological Data for Oregon. Elevation there is near 1250 feet.
Those railroad stations in the Columbia gorge (between The Dalles and Hermiston, around 250 feet elevation) were showing temperatures of 123F, 128F, and 133F at 5 p.m. on the 29th! I am not very familiar with this gorge, but I have a hunch that if an official NWS cooperative weather station were sited in this gorge near those railroad tracks, then the temperature on the 29th would have easily surpassed 120F.
One other thing to ponder is that the Willamette Valley had highs of 115F to 117F on the 29th. Elevations here are about 1000 feet lower than the two stations to the east which hit 119F. Why would these lower elevation stations be a little cooler? Was a little cool marine air still around? I would surmise that the general region of the Willamette Valley still had some relatively moist soils and abundant green grass, and thus was not able to warm up to the extent that the drier inland (desert) areas did. Ground cover type can make a very big difference on maximum temperature on sunny summer afternoons, of course! A barren Death Valley-like surface for miles around is going to promote maximums perhaps 4-8 degrees F higher than areas covered by green grasses with moist soils.

Leave a Reply
You must be logged in to post a comment.