Daily temperature data (max and min, midnight to midnight) were meticulously compiled for the warm half of 2022 (the high-sun months of April through September) for five low-elevation weather stations in Death Valley. The tables below were prepared to allow easy comparisons on averages and extremes among the stations. The summer of 2022 was the first summer with a full compliment of data from the new NWS/NPS/HADS station at Badwater. This study was made in large part to learn how maximum temperatures at Badwater compare to those at the official NWS/NPS/HADS station at the Visitors Center in Furnace Creek. Somewhat surprisingly, the maximum temperatures at Furnace Creek averaged a little more than one degree (F) warmer than at Badwater. (A temporary station at Badwater in the summers of 1959, 60 and 61 averaged a couple of degrees hotter on maximums comparably.) I will attempt to explain the reasons and causes for the differences in the maximums and minimums among these Death Valley stations.
The first order of business here is to provide information on each of the weather stations (FC/Furnace Creek, CC/Cow Creek/CARB, BW/Badwater, SW/Stovepipe Wells 1SW, and SS/Saratoga Spring.) This recent blog entry contains a bunch of info with regard to this, and I will paste the regional map for that blog here:
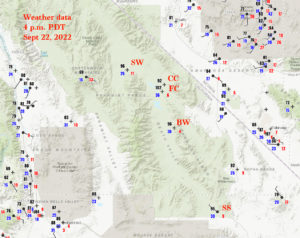
Death Valley is a long and narrow desert basin. The oasis and village of Furnace Creek (FC) is near the middle of the basin. The official NWS station for Death Valley is the one at the NPS Visitors Center at Furnace Creek. The temperatures from this station are the temperatures routinely provided by the NWS to the media. And, our climate record for Death Valley since 1911 is from Furnace Creek stations Greenland Ranch (1911-1961) and Death Valley (1961-present).
The Death Valley/Furnace Creek DEVC1 (FC, or DV/FC) station is at -193′ elevation, it is a HADS/NWS station with Campbell Scientific Intrumentation, and temperature is sampled every minute. Photos. This cooperative weather station switched from the cotton-region shelter (CRS) with its max/min thermometers to a MMTS electronic system in May 1999. (The MMTS equipment was positioned closer to the Visitors Center building and perhaps a couple hundred feet southeast of the fenced “weather corral” with the original, older-style instrumentation.) The NWS and NPS switched back to the old CRS in the weather station corral in September 2009. The temperature equipment in the corral was changed yet again by November 2015, with a switch from the CRS to the current Campbell Scientific (CS) instrumentation. The CS equipment automatically provides current weather updates online every hour. The CS temperature sensor is about six feet above the ground. The station exposure is fair, as it is somewhat close to buildings, trees, brush and other objects, especially SE to S to SW of the weather station. These obstructions combine to decrease the ventilation through the station area. This station is along the northwestern edge of an alluvial fan and is close to the desert “flats” in the bottom of the basin to the west. Link to current data.
Cow Creek/CARB (CC), also called “Death Valley NP — Park Village CQ162,” elevation +410′, California Air Resources Board/CARB station, 3.4 miles NNE of the official DV/FC station. Photo. The temperature sensor/radiation shield is near the top of a very tall mast. The station exposure is excellent, along low slopes of the Funeral Range above the NPS employee village of Cow Creek. I call this station “Cow Creek” or “Cow Creek/CARB” to help differentiate it from the other current Death Valley stations, but the official name is “Death Valley NP — Park Village.” (There was a USWB/NPS cooperative station at Cow Creek at an elevation of -152′ from 1934 to 1961 which is not related to this one.) Temperature at CARB stations is provided once per hour, and the hourly temperature reported is the highest temperature that has been measured during the previous hour. Since this CARB station is very well-exposed (as are most CARB stations) and since the radiation shield and temperature sensor are well above the ground, temperature measurements during an hour’s time tend to vary quite a bit less compared to a conventional desert weather station. Daily maximum and average maximum temperature data at Cow Creek/CARB would not be impacted one way or the other by this quirk of temperature reporting (since each hourly report is the highest temperature attained during the hour). But, there is no doubt that the reported daily minimum and average minimum temperature values are higher than a conventional station would report.
Badwater Basin BWBC1, or just called “Badwater” (BW). HADS/NWS station, elevation -219′, opened in August, 2021. It appears that this automatic Badwater station has very similar instrumentation (by Campbell Scientific) to that in use at the FC station (17 miles to its NNW), with the sensor at least 6 feet off of the ground, maybe close to 8 feet above the ground.
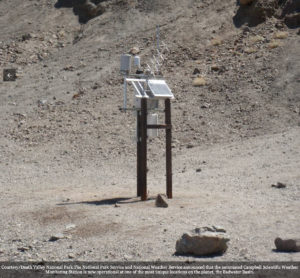
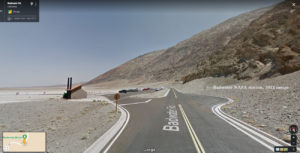
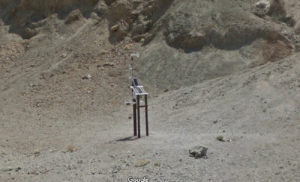
Exposure is very good, though the very high and steep slopes of the Black Mountains are a stone’s throw to the west. The instruments are on the east side of Badwater Road and not too far from the Badwater pool. The official elevation is -219 feet, but it does not look like the station is 60 feet higher than the Badwater pool, which purportedly is at -280 feet, according to the sign there. A topo map of the Badwater area shows a couple of low points at -273′ near the pool, and the station location is very close to the -240′ elevation line. I would hazard to guess that the ground just below the Badwater sensor is closer to -245′ than -219′. Google street-maps has good looks at the area from 2012 (as of this writing — see images above), when an automatic weather station installed by NASA was in place. It is my understanding that the new Badwater HADS station is in the same spot as that old NASA station…but don’t quote me on that. Badwater is in a bit of a topographic notch, or niche (just north of a small ridge). This locale and station site look to be in somewhat of a wind-protected spot with regard to nearby terrain, but wind here tends to be significantly stronger compared to the Furnace Creek station site on most summer afternoons (based on the online hourly data available in 2022). Though the nearby landforms likely help to support and promote Badwater’s reputation as a local hotspot on sunny summer afternoons, the active winds (generally from the south on summer afternoons) likely mitigate the buildup of local heat to some extent…perhaps to a large extent. Link to current data on the MesoWest site.
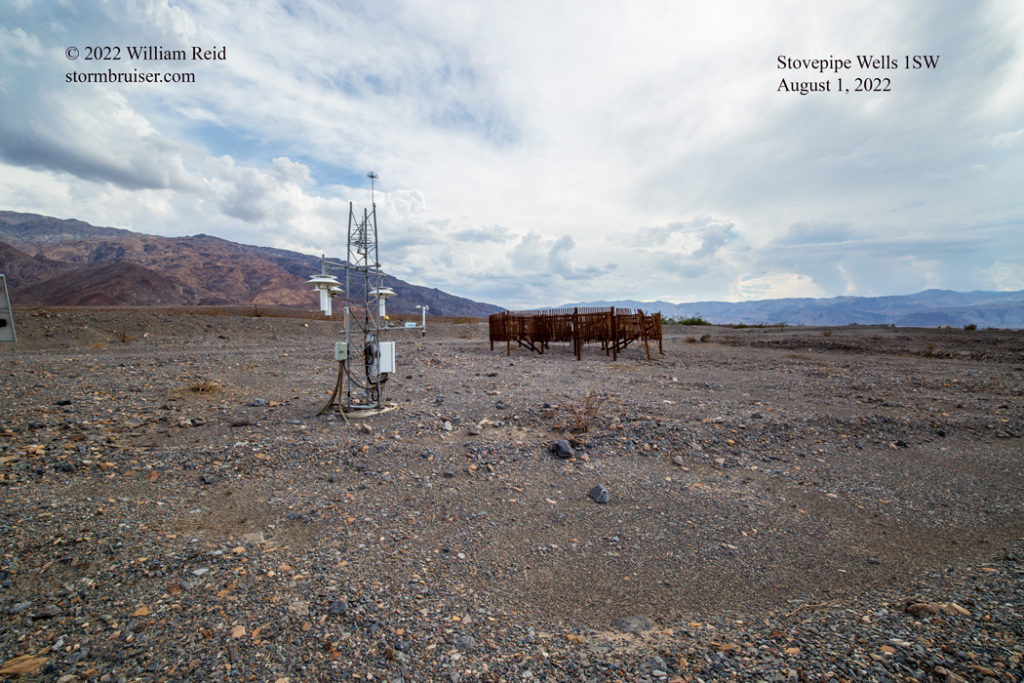
Stovepipe Wells 1SW ISWC1 (SW) or officially “USCRN Site near Stovepipe Wells 1SW,” elevation 80′ (80 feet above sea level, 274 feet higher than the FC station, 18.2 miles NW of FC). I am not sure why the station name has “1SW” (which infers that it is one mile southwest of Stovepipe Wells) included. This U.S. Climate Reference Network station is 0.3 miles SSE of the small village of Stovepipe Wells (elev. +5′), and not one mile southwest of it. Link to current data on the MesoWest site. Photos and more info from my August 2022 visit. Another link to SW data. Stovepipe Wells 1SW enjoys excellent exposure, and temperature updates every minute or more on three separate aspirated sensors that are about 5.5 feet above the ground. These USCRN stations are pretty much the “gold standard” when it comes to ambient air temperature measurement. One need not worry about calibration issues and aspiration fan problems due to the backup sensors and equipment. This station is on the gently sloping and bare terrain of an alluvial fan out of Mosaic Canyon.
Saratoga Spring TOGC1 (SS), elevation 198′, RAWS station, 59.5 miles SSW of FC. Link to Saratoga Spring data on MesoWest. Saratoga Spring RAWS is very well-exposed, between the nearby (typically dry) Amargosa River (to the south) and the springs and moist areas along slopes just to the north. Its low setting with regard to the terrain allows it to cool a lot more at night (due to cold-air pooling) compared to the other Death Valley stations. Through the years I have found that many RAWS stations are problematic on temperature during sunny conditions. It is my contention that the radiation shields in use at at least SOME (if not MOST) RAWS stations are rather poor. And, I have found that temperature readings at RAWS stations tend to go several degrees (F) too high with direct sunlight on the radiation shield when winds are on the light side (under 10 mph). Since RAWS stations tend to be in very well-exposed locales, where wind movement is generally good and where maximum temperatures are naturally tempered (i.e., more conservative, along ridges as opposed to valley bottoms), this RAWS radiation shield issue is often mitigated or “masked” to a large extent on sunny days. As for the Saratoga Spring RAWS, I have not yet seen enough obviously bad daytime temperature data to state that the station’s temperature data appear problematic (even though it is not in a locale which would be considered conservative on temperature). It does seem that temperature here remains unusually warm towards sunset on many summer days, but that characteristic seems to be the norm in the basin. One possibility is that the radiation shields on these RAWS stations are positioned too closely to the black solar panels. The panels get very hot in direct sunlight, of course, and super-heated air could wind up drifting into the shield when winds are on the light side. As far as I know, the shields at RAWS stations are not aspirated.
That was a lot of blather just to get through the station info. But, you still loved reading all of that, right? The weather station sitings and equipment characteristics are often very important for explaining temperature differences. Here is a quick look at the important details:
FC, -193 ft, fair exposure, non-aspirated shield 6 feet above bare ground
CC, 410 ft, excellent exposure, non-aspirated shield about 35 feet above bare ground, 3.4 miles NNE of FC
BW, -219 ft, very good to excellent exposure, non-aspirated shield about 7-8 feet above ground, 17 miles SSE of FC
SW, 80 ft, excellent exposure, aspirated shield about 5.5 feet above bare ground, 18 miles NW of FC
SS, 410 ft, very good to excellent exposure, non-aspirated shield perhaps 5 feet above bare ground, 60 miles SSE of FC.
Three of these stations are within 20 miles of Furnace Creek, with Saratoga Spring 60 miles distant. SW is the only station with an aspirated radiation shield. CC is the only station with the sensor well above the ground surface (which all but negates the need for an aspirated shield). All stations are above bare ground, thankfully, so we don’t have to be concerned (much) with any cooling influence due to nearby moist soils and vegetation. And, most importantly, all of the stations enjoy more-than-adequate exposure EXCEPT for the Furnace Creek station. It will be shown that the somewhat wind-protected locale for the FC station, combined with its non-aspirated radiation shield (which has documented problems during bright sunshine and light winds—see this blog entry) results in inflated maximum temperatures.
(Note: I would describe the exposure of the current Furnace Creek station as closer to “fair” than “good” or “poor.” Its exposure is “adequate,” perhaps “barely adequate,” with regard to what a climatologist would hope to see for a very rural weather station. The exposure does meet the standards of the NWS at this time. However, the exposure is not as good now compared to earlier station exposures at Furnace Creek/Greenland Ranch. Given that this is one of the most important weather stations in the country, this decline in the quality of station exposure is quite unfortunate.)
Charts:
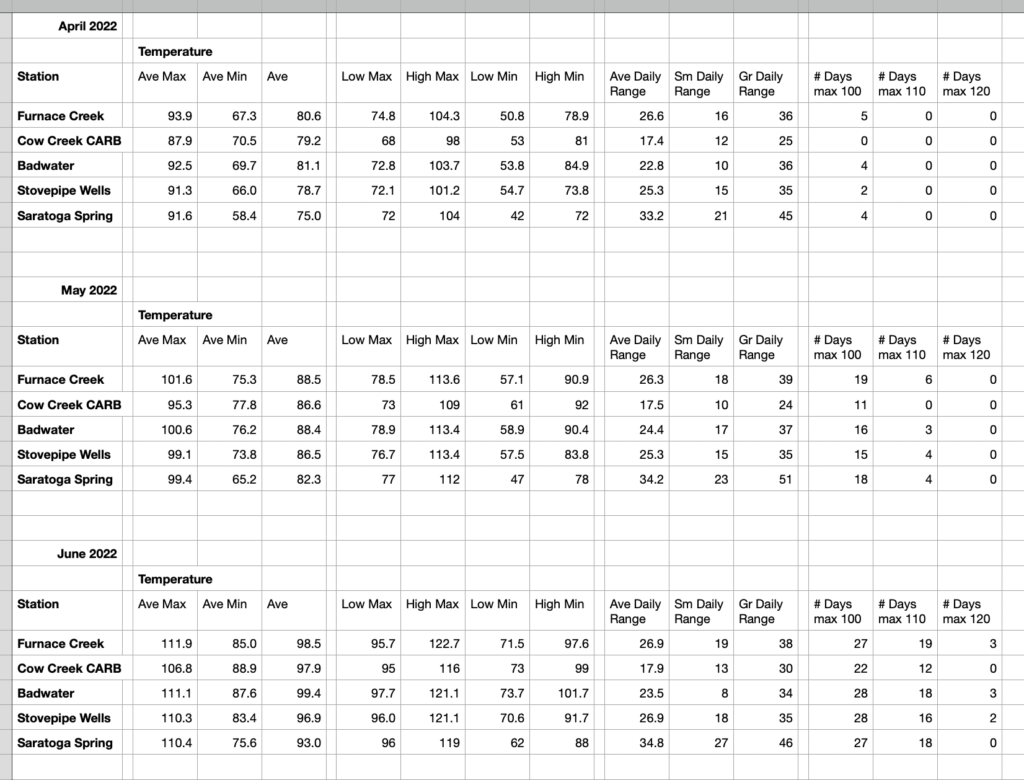
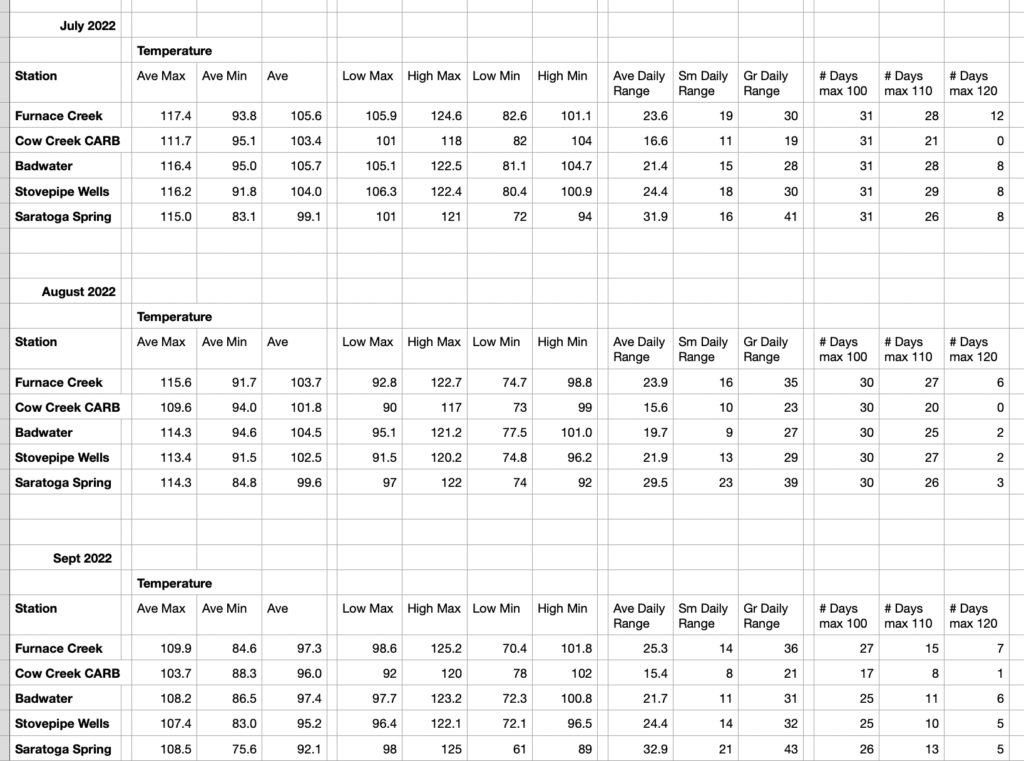
Temperature Data by Month (below) for low-elevation Death Valley Stations
Temperature Data by Station (below) for low-elevation Death Valley Stations, April to September 2022
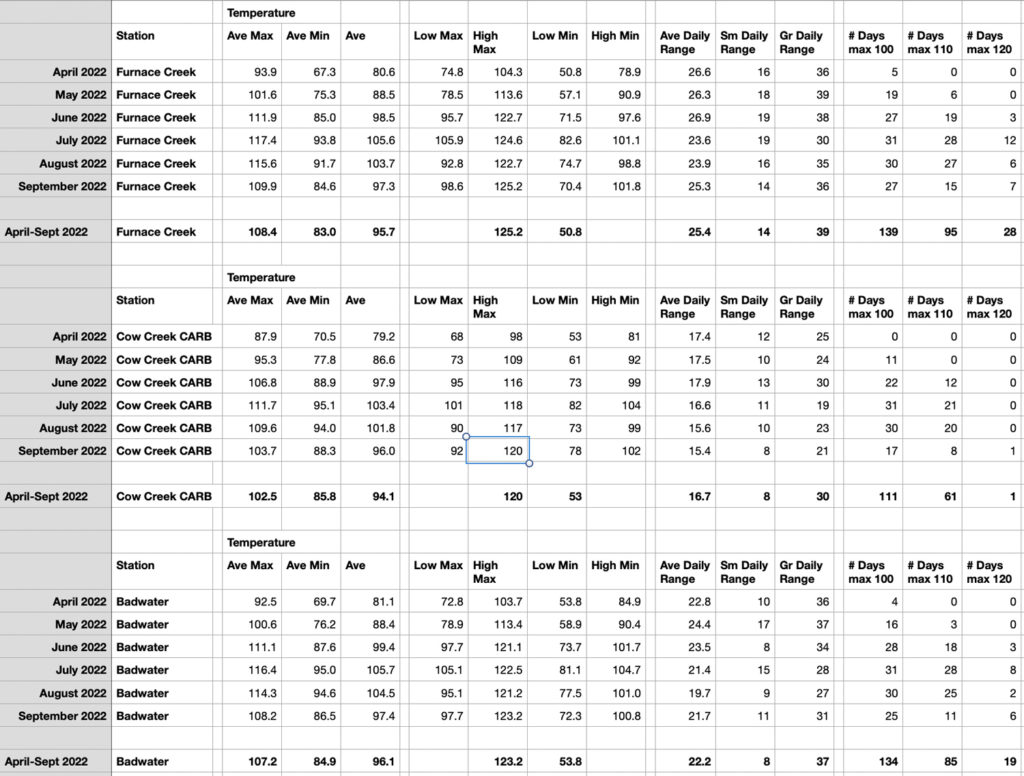
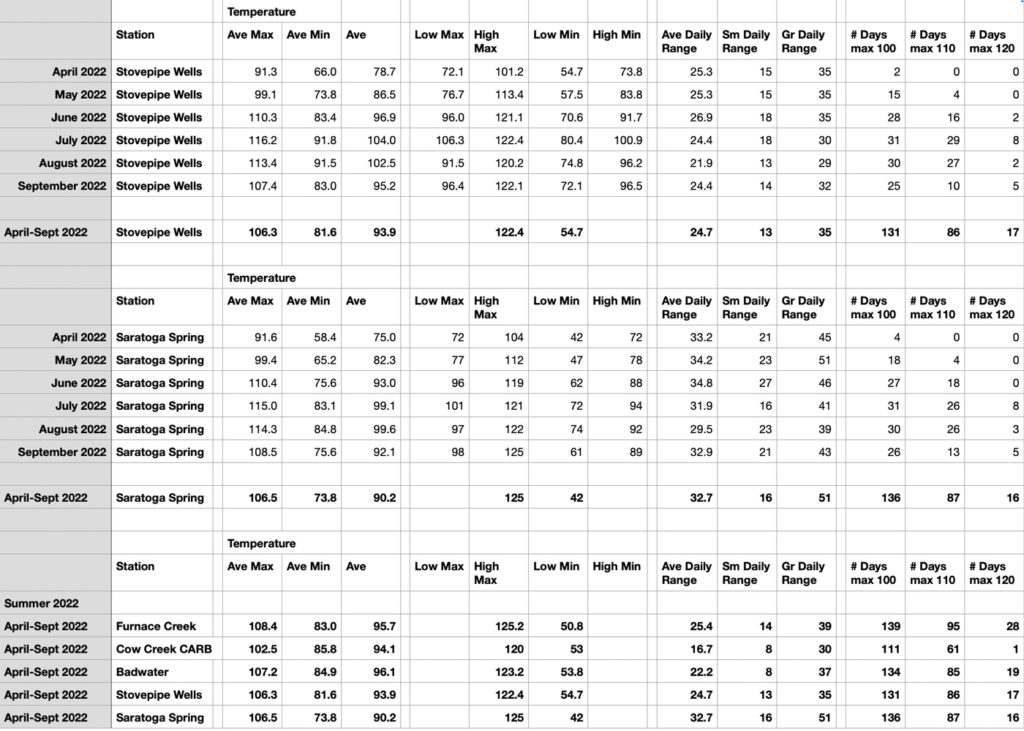
Note that the last batch of averages above covers the 6-month period from April to September.
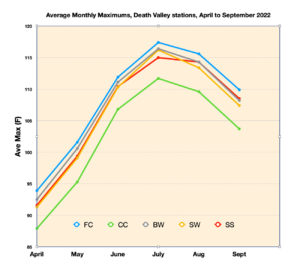
The chart above shows that the average maximums at all stations month-to-month generally stay “in lockstep.” The warmest station each month on average maximum was the Death Valley/Furnace Creek station (FC), in blue. Coolest was the Cow Creek CARB station, in green.
Why do the average maximums (and daily maximums!) behave very similarly month-to-month, with respect to station-to-station differences, in the warm half of the year? It is because the lower atmosphere is well-mixed during (practically) every afternoon. Each station manages to reach its “upper limit” temperature due to the excellent vertical mixing throughout the basin on (practically) every summer afternoon. The maximum temperature values attained are governed, controlled, and limited by the temperature of the free air that is thousands of feet (let’s say approximately 4000 to 14,000 feet on most summer days) above each station. Because of the excellent mixing here on practically all summer afternoons, and because horizontal temperature gradients aloft are usually very weak region-wide, differences in maximum temperature between stations are primarily due to the difference in elevation between the stations. Lower elevation stations are hotter due to compression, with average maximums changing approximately 4.5 degrees F per 1000 feet (or 2.5 deg C/1000 ft, or 8.2 deg C/1000 meters). This relationship works quite well when comparing maximums among all adequately-and-similarly-exposed weather stations in Death Valley and surrounding desert areas.
Thus, if everything else is equal (primarily the surrounding terrain, ground cover, exposure, ventilation, aspect, instrumentation, sensor sensitivity, and the way that the maximum temperatures are determined), a station in Death Valley that is about 220 feet lower in elevation than a different Death Valley station would average 1.0 degrees F warmer on maximums in summer. A station that is 440 feet lower would average 2.0 degrees F warmer, etc.
When I did my temperature research back in the 1980s, I didn’t have to worry about differences in instrumentation. All stations were the same, with the white wooden CRS (cotton-region shelters) and the liquid-in-glass max/min thermometers. That is not the case now, as there are numerous different types of automatic electronic stations.
As we will discuss in this blog, weather station instrumentation, exposure and siting (among other things) can come into play to cause some subtle and not-so-subtle perturbations (or biases) in maximum temperature measurements. Thus, the so-called “upper limit” temperature at a surface weather station, while generally governed by the temperature of the air aloft each summer afternoon, can find itself pulled upward or downward a bit due to local influences and instrumentation biases. Weather stations are usually sited accordingly to minimize the magnitude of any local influences which might cause a bias one way or the other.
Average maximums (F) from April to September (combined), compared to those at Furnace Creek:
Cow Creek/CARB 5.9 degrees lower
Badwater 1.2 degrees lower
Stovepipe Wells 2.1 degrees lower
Saratoga Spring 1.9 degrees lower
Let’s cut right to the chase and compare the 2022 maximum temperatures at Furnace Creek and Badwater. Keep in mind that the instrumentation and method of determining the temperature and the daily extremes is essentially identical at both stations, but that Badwater enjoys better exposure and better ventilation.
The average maximum temperature (incorporating daily maximum reports to the nearest tenth of a degree F) for the 6-month period from April to September, 2022, was 1.2 degrees F warmer at FC versus BW (108.4F versus 107.2F). Here are the differences by month:
Apr 1.4, May 1.0, Jun 0.8, Jul 1.0, Aug 1.3, Sep 1.7, with FC higher than BW each month
The station at Badwater is a little lower in elevation than the Furnace Creek station (by 25 to 50 feet), and would be expected to be very slightly hotter on maximums just based on the elevation difference (less than a half degree F).
My hunch is that the average maximum temperature differences are a little tighter in late spring and early summer because afternoon wind is a bit more active on average (at least compared to late summer, i.e. August and September). Breezier conditions during the warmest part of the afternoon helps to mitigate, or lessen, any local influences and/or instrumentation effects on temperature and temperature measurement. Most importantly, perhaps, the Young radiation shields in use on the Campbell Scientific stations at both FC and BW cause spuriously high temperature measurements in direct sunshine when winds are very light. This is probably the primary reason why FC maximums averaged hotter than BW maximums in the summer of 2022, so it is prudent to become familiar with the temperature “errors” by the Young sensors in the Young radiation shields during direct sunshine! You didn’t forget to click on that link on “Young radiation shields” above, did you? That pretty much spells out the problem right there in black and white!
The numbers below are from the Young web site:
Radiation Error:
1080 W/m2 intensity
0.4°C (0.7°F) RMS @ 3 m/s (6.7 mph)
0.7°C (1.3°F) RMS @ 2 m/s (4.5 mph)
1.5°C (2.7°F) RMS @ 1 m/s (2.2 mph)
Temperature errors of 2 to 3 degrees F are to be expected if the wind is near calm, according to the web site for the radiation shield company! And, since we are discussing the fallibilities of the Young radiation shields, here is the first part of their “installation” instructions from the web site linked above:
———————-
INTRODUCTION
The Multi-Plate Radiation Shield protects temperature and relative humidity sensors from error-producing solar radiation and precipitation. This shield relies on a combination of plate geometry, material and natural ventilation to provide effective shielding.
INSTALLATION
The Multi-Plate Radiation Shield is designed to be mounted on a relatively flat open area. For best performance, the shield should be placed in a location with the following characteristics:
- – Good air circulation around shield.
- – Away from large masses (asphalt, masts, solar panels)especially metal items.
- – Away from building exhaust vents, electrical machinery and motors.
- – Away from standing water, water fountains and sprinklers.
And we are back to my commentary here…let’s examine whether or not the Badwater and Furnace Creek stations are “placed in a location” with the characteristics listed:
Flat area: YES for both FC and BW, except for the steep slopes just east of BW
Open area: SOMEWHAT OPEN for both, as FC has the buildings, bushes and trees in close vicinity, and BW has the steep slopes just to the east
Good air circulation around shield: SOMEWHAT POOR circulation for FC due to the nearby clutter of buildings, vegetation, and solar panels, etc; and GOOD for BW
Away from large masses and metal items: The FC sensor is a stone’s throw from the Visitor’s Center and the parking lot to the east. A small solar panel is inches away from the FC radiation shield, and a metal connector brace supports the radiation shield. At BW, the metal supports and solar panels are also quite close to the Young shield, and the paved road and parking lot for Badwater are quite close.
Away from building exhaust vents, etc.: The FC station is just north of a couple of “units” which appear to be for air conditioning at the visitors center. These would never emit hot air, would they?!
—–
The bottom line here is that there are some issues which should raise eyebrows with regard to the Furnace Creek station especially. The shield manufacturer advises that the nearby “stuff” should be avoided for best performance, but that is not the case at Furnace Creek. Thus, the weather station and the temperature measurements are compromised. Maximum temperatures wind up a little higher at the official Death Valley station on many summer afternoons today compared to what would have been measured in decades prior, when the instrumentation was better exposed. This is not an uncommon problem for long-term cooperative weather stations. Stations which last a long time tend to be in areas where there is increasing development and decreasing exposure conditions around the weather station. Where there is little or no development and persistently favorable exposure, weather stations tend to not last as long as observers move or die and towns fade away.
Back to the data — again, the FC station averaged 1.2 degrees F warmer than BW on daily maximums from April to September. This is opposite of findings by Hunt et al. In the summers of 1959 and 1960, a temporary thermometer (CRS) shelter was established at Badwater to compare readings against those at Greenland Ranch (el. -168 ft) and Cow Creek (-152 ft).
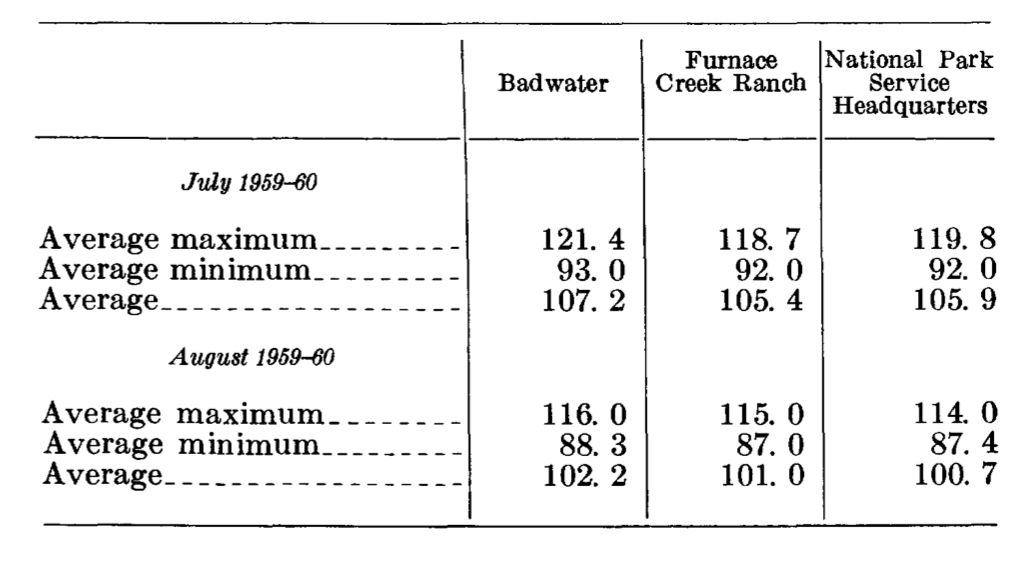
For the Julys and Augusts of 1959 and 1960, daily maximums at Badwater averaged about two degrees F warmer than GR and CC. That the Badwater station would be a little hotter on maximums than the Furnace Creek area stations was not surprising. Unofficial summer afternoon temperature comparisons between the two (by myself and anecdotal reports from park rangers and visitors) typically show that Badwater is hotter. The elevation difference is almost negligible. Badwater (the salt flat part) is about 80 feet lower than Furnace Creek, so would be only 0.4 degrees F warmer due to compression. The terrain differences, or terrain influences, likely account for the remaining difference in average maximums (in the 1959-1960 study). The two Furnace Creek-area stations (GR and CC) had excellent exposure on relatively flat terrain without any significant slopes in the vicinity. In contrast, the Badwater locale is somewhat wind-sheltered and it “sees” the nearby slopes of the Black Mountains. These west-facing slopes are ideally oriented to receiving direct solar radiation during the mid-and-late afternoon, and re-directing some of that heat back towards the basin bottom. The affect might be compared to hanging out on the south side of a brick wall in the midday winter sun (in the northern hemisphere). It will be warmer there compared to nearby open areas since the brick wall has been warmed by the sun, and might have helped to slow the wind, too.
One wild-card factor during much of Greenland Ranch’s record was the influence of the irrigation and cultivation at the ranch. The thermometer shelter was somewhat close to the acreage used for growing alfalfa and other crops (and the golf course, too), and thus cooling due to evaporative effects in this oasis environment was (and still is) a possibility. Farming and widespread irrigation on the 40-acre ranch was prevalent during the first few decades of the Greenland Ranch record (1911 to about 1940?), with diminishing farming and irrigation by the mid-1900s. By 1959 and 1960, with the GR instruments on the east side of Highway 190, it is probable that any cooling effect from the irrigation at the ranch on summer maximum temperature measurement was minimal.
So, in 2022, Badwater averaged a full degree F cooler than Furnace Creek on warm-season maximums; and 60 years prior, Badwater was a couple of degrees F hotter than Furnace Creek. The change to warmer summer maximums at Furnace Creek (comparatively) in the later data set MIGHT be due (to some extent) to less irrigation and less cultivation and grass-growing at this oasis area compared to 60 years ago. And, it is very possible that Badwater’s current sensor, maybe two feet higher above the ground surface compared to the one at Furnace Creek, is an important factor as higher-mounted sensors result in slightly cooler maximums on sunny summer afternoons. However, I suspect that the exposure and ventilation differences between the two stations, and associated problematic radiation shield and temperature tendencies during light winds which artificially boost maximums at Furnace Creek, are probably most important. The Badwater station is typically quite a bit breezier than the Furnace Creek station site on summer afternoons.
Furnace Creek is not really hotter than Badwater now, but perhaps it is a little closer than it was in 1959 and 1960. An “oasis” settlement such as Furnace Creek has a myriad of local (relatively) hot and cool spots. How much cooler would FC maximums be if the official weather station were placed in the middle of one of the fairways on the nearby golf course?!
Let’s compare the maximums at the Death Valley stations on the days when Furnace Creek had its highest maximum each month:
April 9th FC 104.3, BW 103.7, CC 98, SW 101.2, SS 104
5 p.m. PDT obs: FC 102F SW3G5/BW 102F W2G9/CC 98F WSW 17/SW 100F G17
May 19th FC 113.6, BW 113.4, CC 109, SW 111.5, SS 112
5 p.m. PDT obs: FC 110F S4G8/BW 113F W8G24/CC 107F S20/SW 111F G18
June 10th FC 122.7, BW 119.6, CC 115, SW 119.6, SS 118
5 p.m. PDT obs: FC 119F S4G8/BW 118F W9G24/CC 115F S20/SW 119F G22
July 16th FC 124.6, BW 122.5, CC 118, SW 120.9, SS 120
5 p.m. PDT obs: FC 120F SSE3G6/BW 121F WNW3G9/CC 117F wind msg/SW 120F G15
Aug 31st FC 122.7, BW 121.2, CC 117, SW 119.7, SS 122
5 p.m. PDT obs: FC 120F SSE3G6/BW 121F G6/CC 117F wind msg/SW 119F G17
Sept 6th FC 125.2, BW 123.2, CC 120, SW 122.1, SS 123
5 p.m. PDT obs: FC 124F WNW2G4/BW 123F Calm?/CC 119F wind msg/SW 122F G11
I provided the 5 p.m. PDT (4 p.m. PST) temperature and wind observations for the dates above. The hottest time of the day tends to be mid-to-late afternoon at these Death Valley stations, probably between 4 and 5 p.m. PDT (or 3 and 4 p.m. PST) at Furnace Creek and between 5 and 6 p.m. PDT (or 4 and 5 p.m. PST) at BW, CC, and SW. Death Valley does tend to have rather late maximums!
Note the wind speeds on the hot days above. (CC wind does not provide gust info and was out of operation in the late summer, BW wind was sporadic or unreliable or out of service in the late summer, and SW (i.e., Stovepipe Wells, not southwest!) wind is gust information only and no average speed. I would estimate that average speeds are about 60-70 percent of the gust value at SW when the gusts are 15 mph and greater, and closer to 50 percent of the gust value when those gusts are 10 mph and weaker. The Furnace Creek station is by far the least windiest, with average speeds of less than 5 mph at 5 p.m. on these dates. The wind at Badwater tends to be quite quirky in both speed and direction, and generally stronger than at FC. Both SW and CC are much breezier than the FC station.
The Furnace Creek station was generally some 1 to 3 degrees F hotter on maximums on these dates than BW and SW, and 5-7 degrees F hotter than CC. Based on the data here and on my occasional perusals of the detailed hourly data on the hottest summer days, I maintain that the Furnace Creek station maximums are artificially enhanced (i.e., unnaturally boosted) by at least a couple of degrees F on these afternoons with light wind speeds through the station. Intra-hourly temperature ranges at FC increase and maximum temperature spikes are greater (comparatively) when wind goes near calm…and the spikes create the spuriously high maximums comparatively. You know the story — poorer exposure, decreased ventilation, the problematic side-effects of the un-aspirated Young radiation shield, etc.
Dates of the hottest temperatures for the summer:
FC 125.2 on September 6
BW 123.2F on September 6
CC 120F on September 6
SW 122.4F on July 12 (FC was 123.0F on this date)
SS 125F on September 1 (FC was 124.4F on this date)
Furnace Creek’s maximum of 125.2F on September 6 appears to be only the second time in the Greenland Ranch/Death Valley climate record (1911 to 2022) when the hottest day of the summer was during September. The maximum of 124.6F for July 2022 at DV/FC will be rounded off to 125F, so the record books will show monthly highs of 125F at FC/DV for both July and September. In 1948, according to the Western Region Climate Center tables for Greenland Ranch and Death Valley, the highest monthly maximums of 121F were in August (on the 30th) and September (on the 1st). June and July of 1948 both had highs of 120F.
Summer Months data
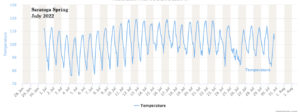
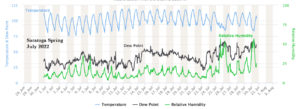
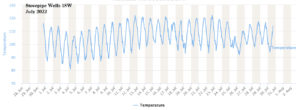
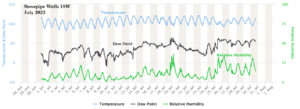
Summer 2022 was fairly typical in Death Valley. One rainstorm near Furnace Creek on August 5th was exceptional. Below are some charts showing the daily march of temperature (and dew point and relative humidity, too) for Death Valley stations for July and August and the first week of September.
July 2022 charts for Death Valley stations
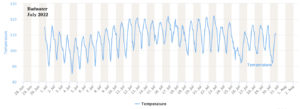
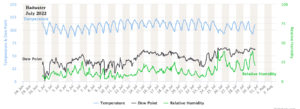
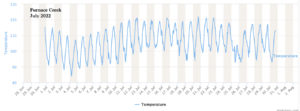
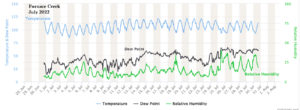
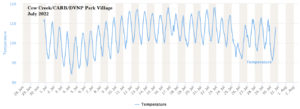
August 2022 charts for Badwater and Furnace Creek/Death Valley, and September 1-8 charts for Death Valley stations
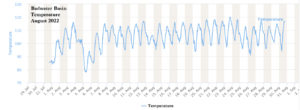
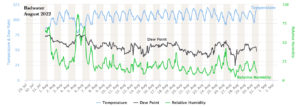
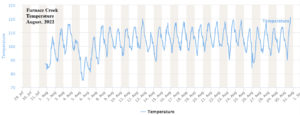
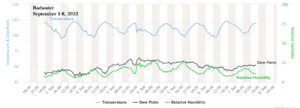
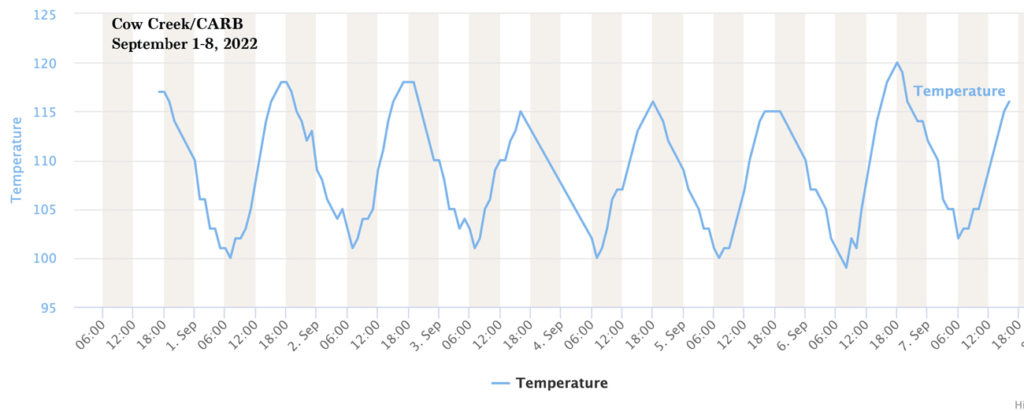
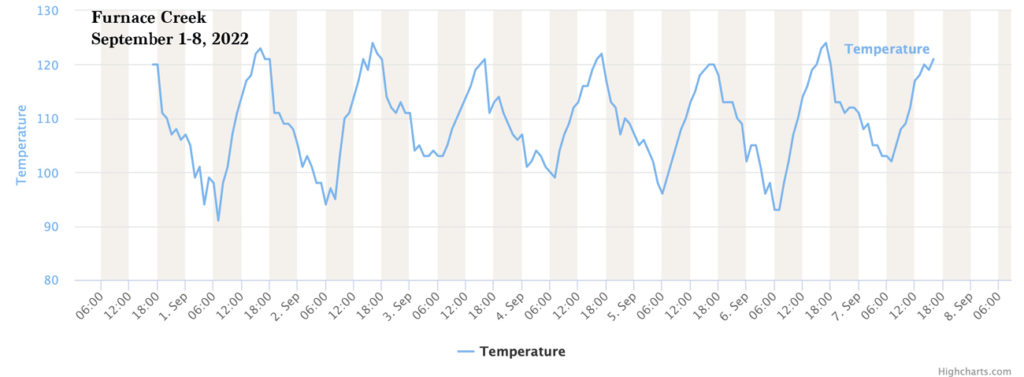
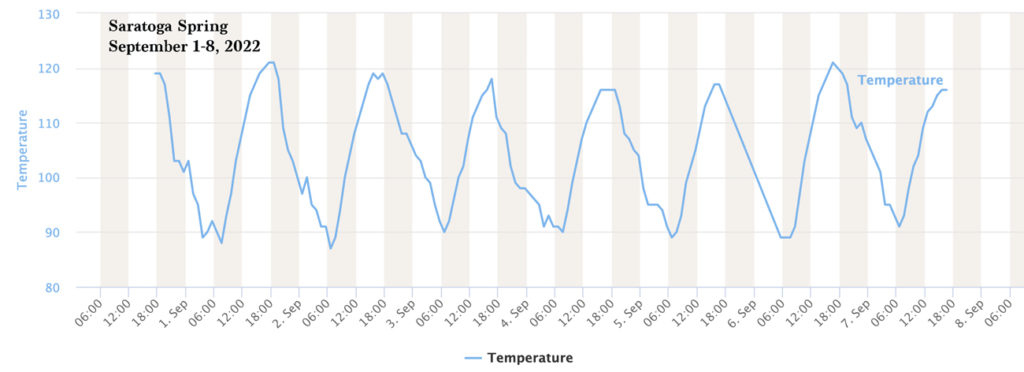
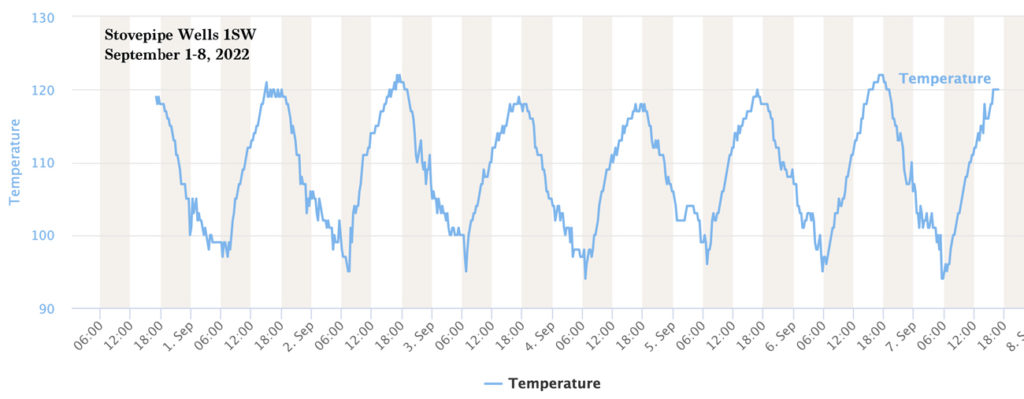
FC maximums versus the other DV stations
Let’s narrow down our summer averages to the JJA 2022 period. Below are avemax/avemin/ave and average daily range for our five stations for JJA 2022:
FC 115.0/90.2/102.6, ave daily range 24.8 degrees
CC 109.4/92.7/101.0, ave daily range 16.7 degrees
BW 113.9/92.4/103.2, ave daily range 21.5 degrees
SW 113.3/88.9/101.1, ave daily range 24.4 degrees
SS 113.2/81.2/97.2, ave daily range 32.0 degrees
The difference of 0.6 degrees F in average maximum between the very well-exposed stations of Badwater and Stovepipe Wells 1SW is partly due to elevation (BW is 300 feet lower and would be expectedly be about 1.5 degrees warmer due to compression). So, why is BW only 0.6 degrees warmer than SW? Does not that nearby east-facing mountain face help to make Badwater a little extra hot? Well, maybe not as much as was thought. The atmosphere is quite good at keeping the low-levels mixed and keeping local hot spots from getting significantly hotter than adjacent areas on summer afternoons in deserts, and even at Badwater. I would have anticipated than BW would have averaged 1.5 to 2.0 degrees F hotter than SW on maximums. So, it may well be that the BW maximums are more conservative comparably because its radiation shield is a few feet higher off of the ground than the SW shield. The SW shield is aspirated and the BW shield is not, so that would definitely promote hotter maximums at Badwater. But since ventilation is so good at both stations, and since summer winds are fairly active on most summer afternoons at both stations, the “aspirated shield” issue is apparently a very minimal factor.
Saratoga Spring averaged about the same as Stovepipe Wells for JJA, 113.2F to 113.3F. SS is only 120 feet higher than SW, so it should be about a half degree F cooler on maximums. I would attribute the slight unexpected warmth at SS to its un-aspirated shield, which probably results in slightly higher maximums on afternoons with weak winds. Remember, SW is the “gold standard” station with the aspirated shields and excellent exposure. Having said that, it just may be that the SS location, more than 60 miles distant, is just (slightly) a naturally hotter area compared to the SW area. We will never know unless someone decides to stick a USCRN station at Saratoga Spring. Am I nitpicking here over relatively small differences in temperature? Probably. There are possible reasons why SS could be a slightly hotter place (naturally) than SW, and vice-versa. Might SS be a little cooler as it is closer to the source regions of subtropical moisture and might have a little more cloudiness? Or might SW be slightly cooler on average maximum because it tends to get shaded more often by afternoon convection and debris clouds that drift off of the Panamint Range? I don’t know.
Let’s compare Stovepipe Wells with the Cow Creek CARB station. SW averaged 3.9 degrees F warmer on average maximums. SW is 330 feet lower, so would expectedly be about 1.5 degrees F warmer than CC. But, what about that extra 2.4 degrees? Both stations are very well-exposed. But CC is a little better exposed (along a low ridge), it is windier than SW, and its shield is WAY up high on a pole, maybe 30-35 feet above the ground. That adds up to very conservative maximums for CC. Maximums here average close to about 2.5-3.0 degrees F LOWER than one would expect based on its elevation; i.e., 2.5-3.0 degrees F LOWER than would a conventional station that is not as quite well-exposed (e.g., out on the flats and not along an exposed ridge), with a sensor five feet above the ground, and at the same elevation in the basin.
Here is a bit of a summary on how I would characterize summer maximum-temperature records at each station, given the station characteristics and biases. I compare maximums to what I would consider a near-ideal temperature-measuring station (i.e., like the USCRN station at Stovepipe Wells 1SW):
Stovepipe Wells 1SW/SW: this USCRN station is the gold standard with regard to exposure, ventilation, reliability, accuracy and data quality. Temperature data provided by this station are generally never problematic and are trustworthy.
Furnace Creek/DV: summer maximums average about 1.5 to 2.0 degrees F too high here due to the ventilation and instrumentation issues. On the calmer afternoons, which are common on the hottest days of the summer, maximums may “spike” close to 3.0 degrees F above maximums which would be measured at a much better-exposed locale in or near Furnace Creek. This Stormbruiser entry goes into detail on the max temperature woes at the official Death Valley station.
Badwater/BW: summer maximums at the BW station appear to be more conservative than what we might measure at a USCRN station in the same spot. I would estimate that the BW high temperatures average close to 1.0 degrees F on the cool side in summer because the radiation shield and sensor are a few feet higher off of the ground compared to a conventional cooperative station. Someday I will get out to Badwater to see just how high off of the ground the sensor is!
Cow Creek/CC: summer maximums here average about 2.0 to 3.0 degrees F cooler comparatively since the sensor and shield are mounted well above the ground and because the station site is extremely well-exposed. If a USCRN station were sitting right next to this CC CARB station, I suspect that measured maximums would average close to 2.0 degrees F warmer than the maximums which are registered up on the mast.
Saratoga Spring/SS: summer maximums here average perhaps 1.0 degrees F higher compared to what a USCRN station would likely register because the RAWS sensors are in an unaspirated shield. And, RAWS station shields are notoriously problematic based on my years of comparisons! Of the five stations that we are comparing here, I have least confidence in my analysis and explanation of Saratoga Spring maximums.
More numbers. Here are the daily maximums for May, June, July, August and September in 2022 at Furnace Creek, Cow Creek (CARB), Badwater, Stovepipe Wells 1SW, and Saratoga Spring. Below that, I was nice enough to provide graphs of the daily maximums for June, July, and August.
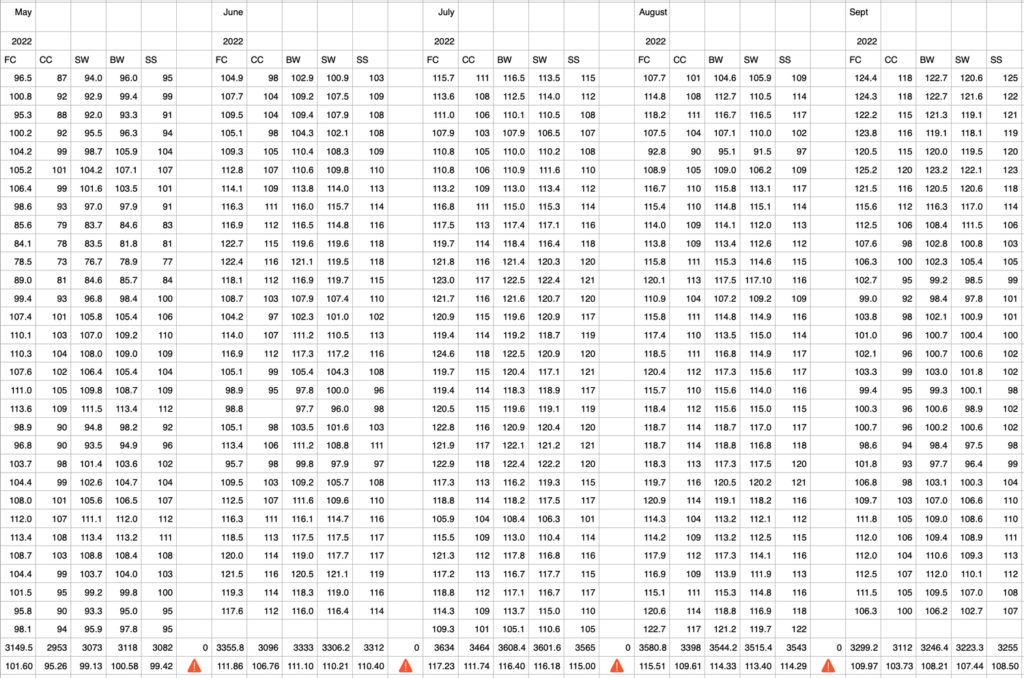
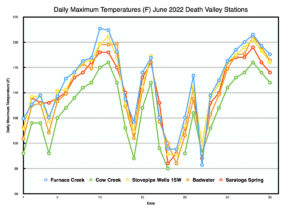
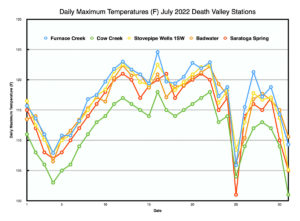
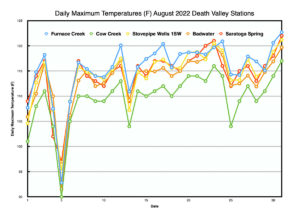
Note on charts above: y-axis values aren’t exactly the same for each month.
As you might expect, the Death Valley/Furnace Creek station was the warmest of the five for the large majority of days in JJA 2022. The Cow Creek/CARB station had the coolest maximums for a very high percentage of days.
The main takeaway from the graphs is that maximum temperatures at the Death Valley stations in summer behave in the strongly “lockstep” fashion that was apparent when comparing the average maximums by month. One does not see the maximum temperature at any of the stations kind of “doing its own thing.” When it is cooler in the basin, all stations cool at similar amounts. When it warms, all stations warm a similar amount. This is because the lower troposphere is very well-mixed on typical summer afternoons. Stations at similar elevations in the basin tend to have very similar maximum temperatures. Small-to-moderate deviations from this “lockstep” behavior in summer maximums might occur if there is a prominent difference in daytime weather (thick overcast versus clear conditions, rainy versus dry, etc.), but such instances are rather rare.
Of course, I have found that this same “lockstep” behavior is also the case, by and large, on the hottest days in the entire Death Valley region and the Eastern Mojave Desert. Elevation is the main control on high temperatures at regional stations. Average maximums decrease approximately 4.5 degrees F/1000 feet.
MINIMUM TEMPERATURES
Let’s change gears and look at the average minimums.
Here again are the averages for JJA 2022:
avemax/avemin/ave and average daily range for our five stations for JJA 2022:
FC 115.0/90.2/102.6, ave daily range 24.8 degrees
CC 109.4/92.7/101.0, ave daily range 16.7 degrees
BW 113.9/92.4/103.2, ave daily range 21.5 degrees
SW 113.3/88.9/101.1, ave daily range 24.4 degrees
SS 113.2/81.2/97.2, ave daily range 32.0 degrees
The warmest average minimums were at the Cow Creek/CARB station, with Badwater close behind. Elevation is not as dominating a factor in determining (or influencing) minimum temperatures in the basin in summer as compared to maximums. Though Cow Creek is the highest-elevation station among our five, it showed the warmest minimums. And, we must hearken back to the way these CARB stations report. CARB stations report a temperature once per hour, at the top of each hour (and daily max and min temps are derived from these hourlies), and the hourly value provided is the HIGHEST temperature measured during the previous hour! (Does the station sample temperature every minute or so? I don’t know…but that seems like a reasonable guess.) Thus, chances are quite high that on many mornings the REAL lowest temperature of air wafting through the Cow Creek radiation shield is a degree F or so lower than the lowest hourly temperature report provided. If the wind is persistent and moderate-to-strong in strength during the overnight and morning hours (not unusual in summer!), then it is quite possible that the REAL minimum at Cow Creek/CARB is indeed the same as the lowest hourly temperature provided. The very well-exposed nature of this station, along a ridge and about 650 feet above the basin bottom, combined with the high placement of the shield and sensor on the mast, means that nighttime surface-based inversions are minimized or entirely absent. This promotes a temperature trend with minimal variability hour-to-hour and intra-hourly. In other words, the lowest hourly temperature at Cow Creek/CARB, which becomes the daily minimum for the station, is probably very, very close to the real minimum for the day for the air at sensor level. I will make a wild estimate and say that we can probably subtract 0.5F to 1.0F from the average minimums for Cow Creek CARB to compensate for its quirky reporting system. If the sensor were at the conventional level of 5-6 feet above the ground, and if one-minute readings were utilized, then I suspect that minimums here would average about 1 to 2 degrees F lower comparably in summer.
That was a lot of blather just to consider the goofy reporting method and consequences of the CARB station, but it is important if one is closely scrutinizing and explaining these temperature differences. The CC station averaged 92.7F for JJA to the 92.4F for BW, but if we incorporate my little adjustment mentioned in the previous paragraph, then CC comes down to perhaps 92.0F and is slightly cooler on average minimums than BW. BW is about 650 feet lower in elevation, so in a well-mixed lower troposphere compression alone would cause BW to be three degrees F warmer than CC. Our summer 2022 average minimums are similar because Badwater is apt to have occasional surface inversion formation at night while the Cow Creek locale is not (or any inversions are much less pronounced). A night that is windy at both locales will give a lower minimum at CC. A clear night that goes calm towards sunrise will give a lower minimum at BW. This is expounded upon in the next paragraph.
At CC, the wind is typically active all or much of the night, the air near the surface remains well-mixed all night, surface radiation inversions are usually absent, overnight temperatures decrease quite slowly, and minimum temperatures are relatively quite warm to hot. At Badwater and at other locales close to the lowest elevations of the basin, it is not unusual for active winds to keep the low levels well-mixed well into the evening and night during the summer months. This, of course, disallows shallow radiation inversion formation and it allows nighttime temperatures to remain hot well into the night. Sometimes the temperature at Badwater is still near 110F around midnight following an afternoon well into the 120s. If the nighttime wind is active at both CC and BW, one would expect BW to be about 3 degrees warmer due to compression. However, it is not unusual for the wind to die down quite a bit around dawn and sunrise. A change to weak wind at CC towards sunrise will not cause much of a temperature drop there (assuming the typical clear skies and dry airmass) as it sits a little above much of the surrounding terrain and above areas where air might pool and cool. In contrast, a change from breezy conditions to weak winds at Badwater (and at other areas on or near the basin bottom areas) will typically result in a temperature drop of 5-15 degrees F or thereabouts. This is because a nighttime surface radiation inversion easily forms in the basin-bottom areas. (The inversions can also conceivably form near or after sunrise if the wind dies out, provided the area is still shaded from the sun by terrain after sunrise.) The strength of any surface inversion will depend on several factors. But, for now, just know minimums at BW and CC average quite closely in summer because occasional inversion activity at BW compensates for the elevation difference between the two stations. Since Badwater is such a breezy place on summer nights and even into the mornings, the morning surface inversions aren’t particularly strong or prevalent.
Much closer to Cow Creek is the Death Valley/Furnace Creek station. Average minimums here for JJA 2022 were a couple of degrees F cooler than at BW and CC. This station is about 600 feet lower than Cow Creek, but the nighttime surface inversion activity permits slightly lower average minimums. It seems that nighttime winds at FC are not quite as persistent compared to BW, allowing slightly stronger surface inversions, and/or allowing more mornings with inversions compared to BW.
Up the road a bit at Stovepipe Wells, average minimums for JJA 2022 were 1.3 degrees F cooler than at DV/FC. The elevation difference of nearly 300 feet between the two might best explain the difference in average minimum temperatures (SW is at +80′ and DV/FC is at -194′. I would have guessed that SW might be a little warmer on average on minimums in summer than FC, as SW is on the gently sloping ground of an alluvial fan, at least 80 feet above Highway 190, not too far to the west. The terrain would seem to favor surface inversions more-so at FC versus SW. Perhaps SW is somewhat protected by Tucki Mountain to its south, and the typical southerly winds through Death Valley at night in summer are a tad less active at SW around sunrise compared to FC.
One other wild card at FC is the golf course and other irrigated areas. Air above moist surfaces cools a LOT more at night compared barren and dry surfaces in Death Valley. It is possible that some locally cooled air due to evaporative effects manages to drift northward through the FC station area to cause minimums to be lower than they would otherwise be. Despite all of these influences and possible influences, average minimums at SW and FC are quite similar.
In the southern end of Death Valley, at Saratoga Spring, average minimums are a full nine degrees F cooler than at FC, 81.2F versus 90.2F! Is the RAWS station messed up? Are campers throwing dry ice around the SS sensors? No and no. The Saratoga Spring station is in a spot which is very prone to moderate-to-strong nighttime surface radiation inversions. Once the nighttime breeze lets up at SS, a surface inversion easily forms as the station is pretty much at the bottom of the adjacent terrain, between the springs along nearby slopes and the Amargosa River. Temperature differences of 10-20 degrees F would be typical at night between breezy conditions and calm conditions here. (Again, assuming the typical conditions of clear skies and dry air. Inversion strength will be less in more-humid weather.) Also coming into play at SS is the nearby moist area (the springs, ponds, and moist vegetation) which gives the near-surface air an extra “chill” due to evaporative effects. Though the surface below the SS station is bare, there is no doubt that the chilled air above the nearby moist areas can easily spill, or drift, through the station area to help bring down those minimum temperatures.
So, to summarize, low-elevation Death Valley minimums are affected largely by local terrain influences and resulting nighttime surface radiation inversion formation. In summer, nighttime winds tend to be quite active, but then tend to weaken close to sunrise. The letup in wind allows at least some weak surface inversion formation in and near basin-bottom locales. The adjacent slopes and alluvial fans, some 200-800 feet above the lower terrain, generally remain well-mixed through the night and stay free of any significant nighttime surface inversions. These locales can easily be 5-15 degrees F warmer on minimums than the nearby locales near the basin bottom. Basin-bottom locations with significant moisture (springs, ponds, cultivated fields, grassy golf courses) can be another 10 or more degrees cooler due to evaporative cooling. The dry near-surface desert atmosphere is very sensitive to the nature of the ground surface! When wind and mixing abate, significant differences in temperature can be found at night between the dry locales and moist locales, even over very short distances.
I might add a little blurb here as to WHY the surface radiation inversions form at night in the low spots. You have probably heard of the term “cold air drainage” to account for the pockets of cold air in some favored locales in the low-terrain areas. Heavier cold air drifts off of the higher terrain and sinks (or drains) into the low spots to form the local area of colder air, right?! NOPE. If you want to get me a little out of sorts, then call it “cold air drainage.” If air is “draining” to a lower elevation, then it must warm due to compression, right? How does that help to cool lower areas? Now, there might be cases of cold air draining or sinking through a canyon or valley area towards areas of lower elevation…which could bring colder conditions to lower terrain. But if this colder air is flowing, or is draining, then it is moving. This is an “advection” type of situation. The nighttime inversions in Death Valley and in other desert basins in the region are generally associated with light or calm wind. There is no import of cold air from somewhere else to create a surface inversion at night. The desert basin-bottoms (and any wind-protected canyon-bottoms or locales where cold and heavy air is not apt to slip downslope or mix out) see the formation of nighttime surface radiation inversions (I had better start using NSRI for that) when winds die down (on clear nights with dry air!) because the low-level mixing has ceased and the cooled air is unable to mix out! The pooled and cooled air near the surface is relatively heavy and dense, it resists being mixed out, and it cools further as infrared radiation is lost to the cold sky. The better a valley or basin can hold its cold air, the stronger its nighttime inversion can become. Of course, if the wind above the inversion top increases enough, then warm air eventually mixes down and some or all of the cool air near the surface can mix out. The longer the wind stays calm or near calm, the deeper and stronger the NSRI can become, and the lower the minimum temperature can go. The inversion strength will depend in large part on the nature of the terrain. If the cold air that develops along the ground isn’t slipping away, then the cold air stays put and builds. Basin bottoms that are shaped more like “bowls” versus V-shaped valleys and canyons seem to be better suited for strong NSRIs. This is in part because the bottom of a “bowl” likely sees more cold sky (and more radiation loss) as compared to a locale with nearby steep slopes.
I inadvertently omitted a rather important part of the equation in the previous paragraph. These surface-based inversions form because the ground surface radiates heat energy to the sky (once the sun has set) and the ground surface eventually cools to a temperature lower than the air that it is contact with. The usually very dry and shallow surface-based air will tend to cool quickly as the ground cools quickly, unless the wind is active and is effectively mixing any cooled air out and about with the free air above. Our nighttime desert inversions can’t develop if it is too breezy. The ground surface of most low-elevation Death Valley areas is barren soil or rocks. After a full summer day of baking in the sun, these surfaces tend to retain heat and to cool very slowly through the night. Death Valley and most low-elevation areas of the Mojave Desert are akin to a giant urban heat island. Moist, vegetated areas which cool a LOT more at night comparably are quite sparse in Death Valley and in densely developed urban areas. Both places have a tough time cooling down quickly after sunset in summer.
I provide the average daily range data above, and as you can see there is quite a “range” in values among these five stations. Areas with the greatest daily ranges are those where nighttime surface inversion formation tends to be most likely and strongest, such as at Saratoga Spring, which sported an average daily temperature range of 32.7 degrees for the six months from April to September. Nearby springs and moist vegetation (and the resulting evaporative cooling) at Saratoga Spring may also be important in promoting cooler minimums and thus larger daily ranges. Areas along the ridges and slopes which find themselves above nighttime radiation inversions for the most part have much smaller average daily ranges. The Cow Creek CARB station fits into this category, with an average daily range of only 16.7 degrees for the same six months. During all of July, the greatest daily range at Cow Creek CARB was a paltry 19 degrees.

Leave a Reply
You must be logged in to post a comment.