DAILY DATA/MAX AND MIN TEMPS AND 24-HOUR PRECIP (midnight to midnight)
Westlake Village/Hidden Canyon station from 1999 to 2012:
Westlake Village/Northgate station from 2013 to present (thru 2022):
Below: Monthly data BY MONTH for Westlake Village, beginning in 2000. (Top row JFMAMJ, Bottom row JASOND)
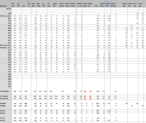
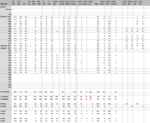

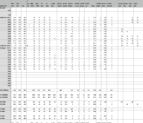
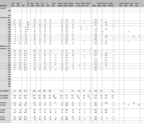

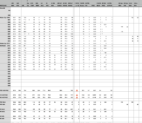
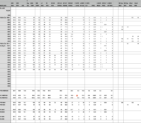
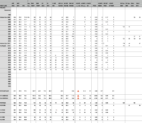
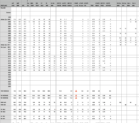


The link below is for the same monthly data, by month, PDF format
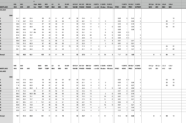
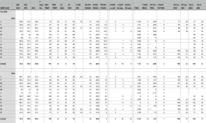
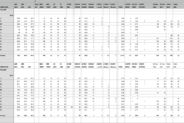
The same monthly summary data, BY YEAR, for Westlake Village, beginning in 2000. Top row, annual data for 2000 to 2011. Bottom row is for 2012 to 2023. And below that is the same stuff in PDF format.



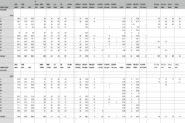
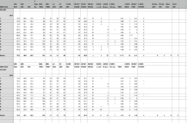
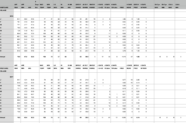
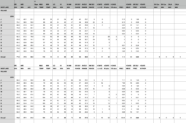


This one is a summary of monthly averages for both WLV stations combined, 2000 to 2022. Keep in mind that the more-recent Northgate station is in a colder locale with regard to minimums, and a somewhat warmer spot with regard to maximums (due to differences in terrain and exposure).
AVERAGE VALUES
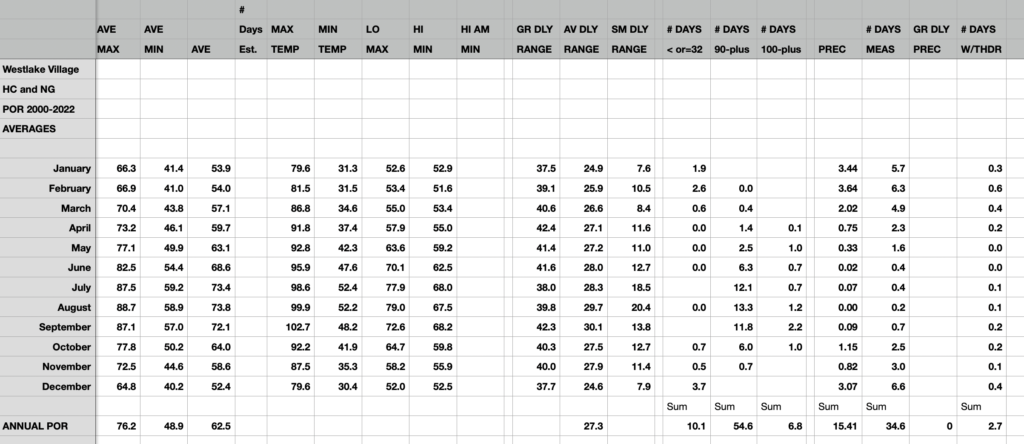
In the chart above, keep in mind that these are the AVERAGES for all of the monthly amounts. So, AVE MAX for JAN (66.3) is the average of all of the monthly average maximums for Januarys since 2000. MAX TEMP for FEB (81.5) is the average of all of the monthly maximums for all Februarys since 2000. # DAYS 90-plus for JUL (12.1) is the average of the number of days with maximums of 90F or higher for Julys since 2000. At the bottom of that column, the 54.6 is the sum of the monthly averages for number of days with 90-plus maximums. (Thus, Westlake Village averages about 55 days per year which reach 90F or higher.) Average annual rainfall has been 15.41″ from 2000 to Feb 2023.
HIGHEST VALUES

The above chart shows the highest values in our monthly lists. Thus, “74.0” for JAN is the highest of all of the average maximums for JAN at WLV since 2000. Highest Precipitation amount for JAN is 11.62″. The “60” for LO MAX means that the value was “60F” for the January with the highest “lowest maximum”. In other words, all Januarys had at least one maximum as low as 60F. It would be unusual for a particular JAN to have all daily maximums greater than 60F.
LOWEST VALUES
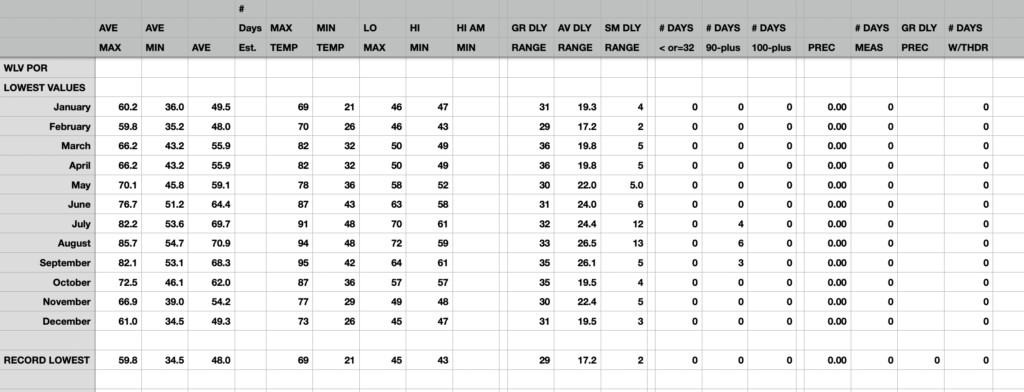
The above chart provides the lowest values in our monthly lists. All months have had at least one instance with zero rain.
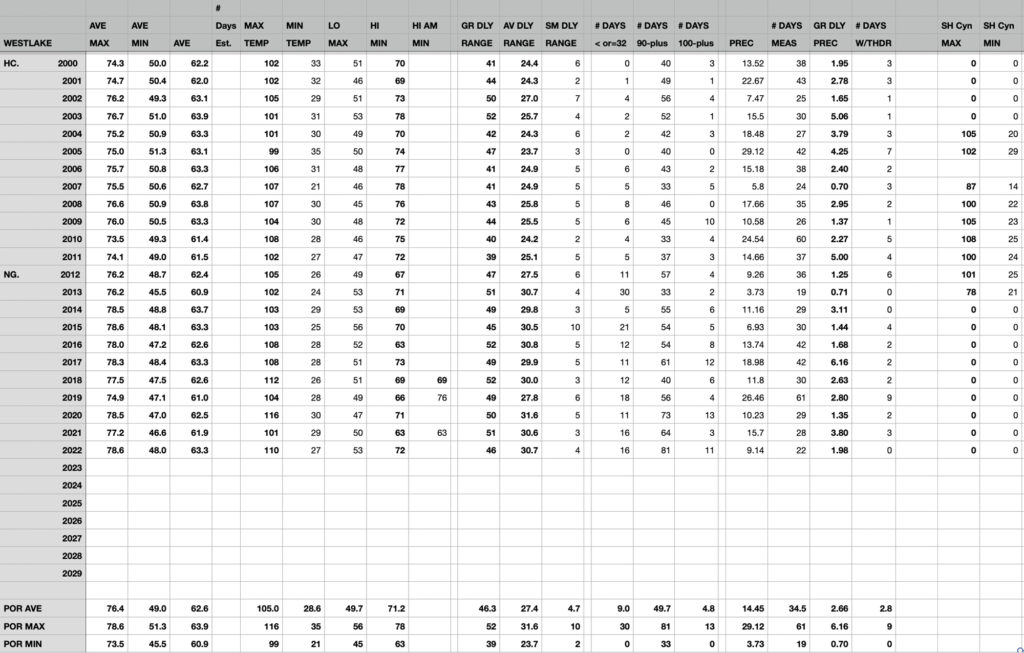
The table above shows annual data for the two Westlake Village stations (Hidden Canyon and Northgate), 2000 to 2022.
The data from 2000 to early 2012 are from my station in Hidden Canyon (in Westlake Village). This station was at the top of Via Colinas, north of Thousand Oaks Blvd., and between Westlake Blvd. and Lindero Canyon Blvd. (This was in Ventura County at an elevation of about 1000 feet, just north of the L.A./Ventura County line.) Temperatures were from a max-min (sixes) thermometer in the shade of a carport, and the 8-inch standard raingage was on an upstairs porch. The exposure for both the thermometer and raingage was reasonably adequate, but maybe falling a bit short of “good” on both. The temperature data for this Westlake Village station was relatively conservative, with no direct sunshine causing maximums that were too high.
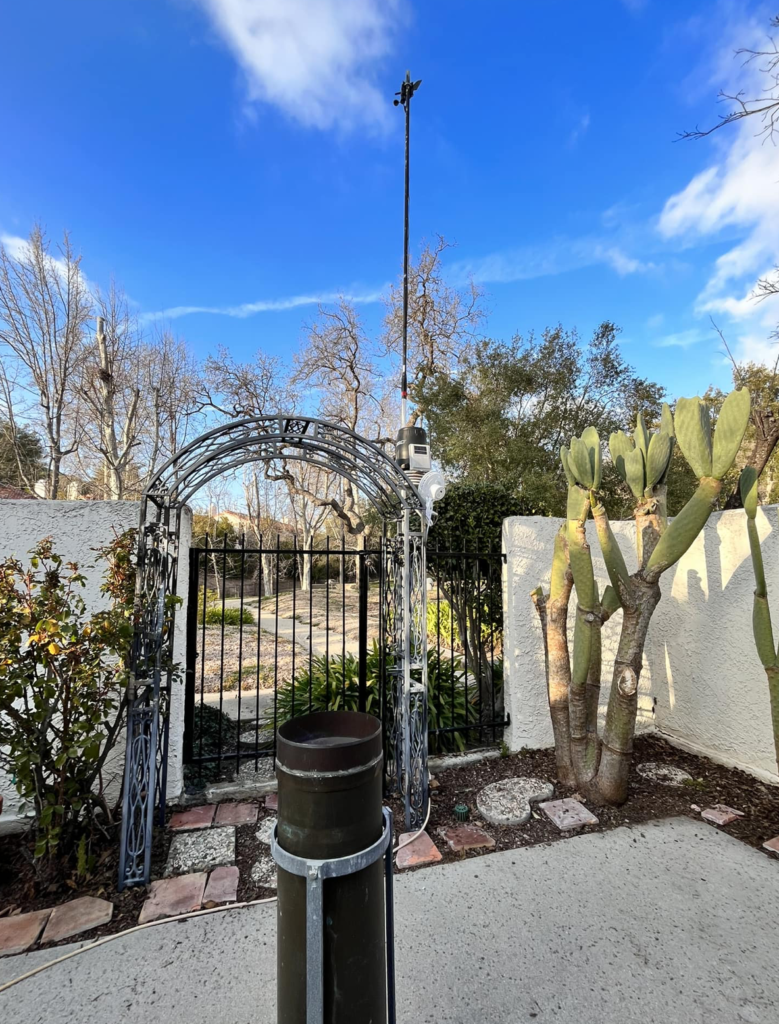
Data from about the summer of 2012 to 2023 for Westlake Village is from my (current as of 2023) weather station at the Northgate condo complex, near Hillcrest and Westlake Blvd., elevation near 990 feet. This Northgate station is a mile west of the previous site, and has larger daily ranges compared to the previous site. Minimums are lower comparably (the Northgate station is in a frost hollow along a creek), and maximum temperatures on sunny afternoons are less conservative (a couple of degrees on the high side?) primarily March to October due to somewhat inadequate ventilation (as the station is rather close to the condo and to walls around the porch area). A grassy courtyard area is immediately on the north side of this station (see pic at top).
WLV Northgate station data on WU
WLV Northgate station data on findu

Leave a Reply
You must be logged in to post a comment.