A high-end heat event occurred in the Mojave Desert and Death Valley regions during the middle of July, 2023. The highest temperatures recorded at most of the long-term stations came quite close to all-time record high values, with a handful of stations tying or breaking their maximum temperature on record. The official Death Valley station at Furnace Creek hit 128F on the 16th, which was two degrees shy of the 130F reports from 2020 and 2021. Farther south in Death Valley at Saratoga Spring, the RAWS station there hit an all-time high of 129F.
This entry has been made as a place to find all or most of the weather and climate data and maps that I saved durin the event. And, towards the end, is a little summary with some charts.
There are 14 separate web pages on Stormbruiser where one can find the weather maps from July 9 to 22, 2023. Links to daily web entries with maps, soundings and charts:
July 9, 2023 July 10, 2023 July 11, 2023 July 12, 2023
July 13, 2023 July 14, 2023 July 15, 2023 July 16, 2023
July 17, 2023 July 18, 2023 July 19, 2023 July 20, 2023
Hourly weather data at Death Valley Stations July 9-16 below:
Hourly Weather Data at Death Valley Stations July 14-21 below:
Climate summaries for Death Valley area stations for July 2023 below…
Station List
Death Valley/Furnace Creek USWB coop (-194′), Barstow coop (2220′), Trona coop (1695′),
Las Vegas WFO (2275′), Stovepipe Wells 1SW USCRN (80′), Saratoga Spring RAWS (198′),
Death Valley NP/Cow Creek CARB (410′), Tonopah coop (6010′), Desert NWR coop (2914′),
Laughlin coop (605′), Mina coop (4580′), Overton coop (1280′), Searchlight coop (3540′),
Silverpeak coop (4274′), Valley of Fire SP coop (2000′), Las Vegas AP/LAS (2175′),
North Las Vegas AP/VGT (2188′), Desert Rock AP/DRA (3230′), Daggett AP/DAG (1919′),
Needles AP (888′), Bishop AP (4110′), Tonopah AP (5399′), Eureka Valley (2975′)
and the CEMP stations:
Amargosa Valley (2424′), Beatty (3311′), Goldfield (5590′), Indian Springs (3156′),
Las Vegas (2025′), Mesquite (1772′), Overton (1260′), Pahrump (2639′), Sarcobatus Flats (4014′),
Tecopa/Shoshone (1337′), Tonopah (6180′)
This is a good place to refer you to my write-up on the 2021 heat event in July, when most stations tied or set new all-time maximum temperature records. There is a lengthy section on station exposures. Know that the maximum temperatures at some CEMP stations are little bit too high on some, or many, summer afternoons by perhaps 1 to 3 degrees F or thereabouts. This is because the CEMP stations are generally over natural, mostly bare ground and near pavement and sidewalks. And, more importantly, most CEMP stations are in towns with nearby buildings, walls and sometimes vehicles. These objects tend to diminish the ventilation through the station and promote higher maximums since the ground surface gets so hot. The sitings of these CEMP stations are fine for their purpose, and the temperature data are great for each particular locale. But a climatologist might cringe a little when looking at the pictures of the stations (available on the CEMP web page under advanced/station info after selecting the station) due to the proximity of some stuff! Thus, comparing summer maximums at CEMP stations to those at well-exposed stations, such as at airports and (hopefully) cooperative/NWS stations might not always be playing fair.
After the long listing of monthly data is my summary, with a bunch of nifty charts.
Some charts below!
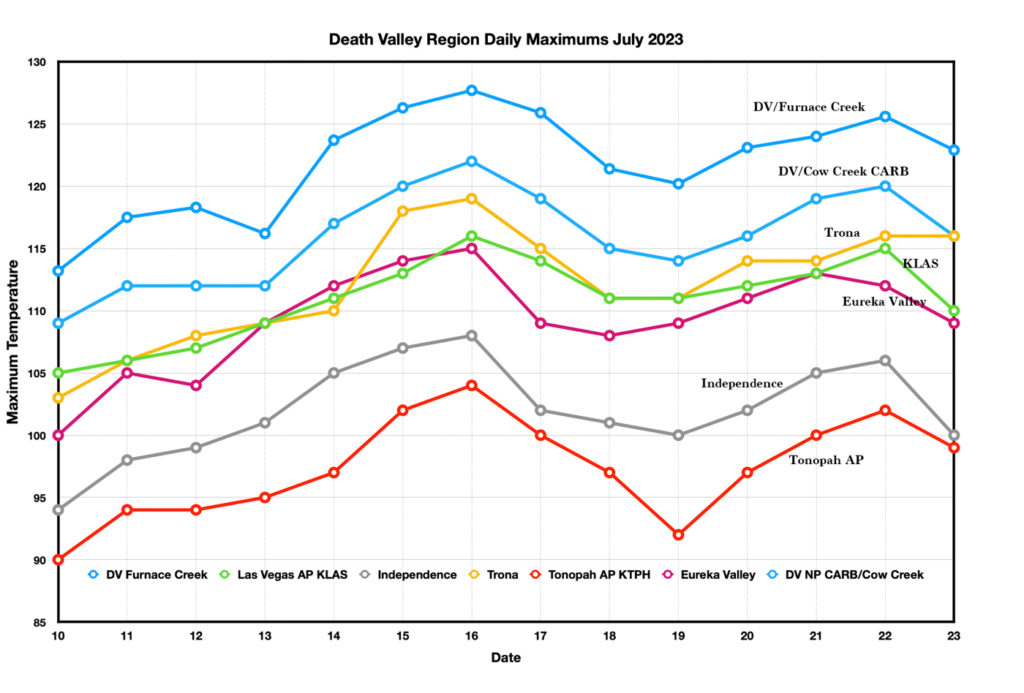
The chart above shows daily maximums for the period from July 10 to July 23. There were two peaks to this mid-summer heat wave: on July 16 and on July 22. The Death Valley/Furnace Creek station (the NWS/NPS official coop station for Death Valley) reached 127.7F on the 16th and 125.6F on the 22nd. The hottest temperature in Death Valley for July 2023 was 129F on the 16th at Saratoga Spring. This is a RAWS station, and my studies have shown that temperature measurement at some, or most, RAWS stations often goes a degree or two (F) too high when the radiation shield is in bright sunshine and when the wind is on the light side. So, was it really 129F in the southern part of Death Valley, in and around Saratoga Spring on July 16th? The best answer is “maybe,” but I suspect that a station with a better radiation shield than those used for RAWS stations would probably not have reached quite as high as 129F. The Badwater HADS station, which is very similar to the official Campbell Scientific station at Furnace Creek, hit 128.5F on the 16th. The Stovepipe Wells 1 SW (USCRN) station had 127.6F. Except for the Saratoga Spring station, which set an all-time maximum temperature record with its 129F, the maximums of about 127.5F to 128.5F are a degree or two (F) lower than the all-time maximums set in July, 2021.
Note how the maximums run generally “in lockstep” with each other except for a couple instances. For example, the max temp at the Trona coop station did not decrease from the 22nd to the 23rd while the other stations showed a cooling trend. A quick check of the CARB station in Trona (a different station from the coop station) shows that the max temp fell from 114F on the 22nd to 108F on the 23rd. The 116F at the Trona cooperative station on the 22nd is valid, and the 116F on the 23rd is very likely not valid. All other stations in the region showed a cool down of at least 2-3 degrees (F) from the 22nd to the 23rd. The high temp at (relatively close) China Lake decreased from 113F to 109F. My guess is that observer error reared its ugly head at Trona on the 23rd or 24th (observation time is at 9 a.m. at Trona). An observation might have been missed, or the digital readout was not reset. The 22nd and 23rd were a Saturday and Sunday, when observers are more likely to be unavailable to do the observations, especially at stations at work locations. The instruments at Trona are at Searles Valley Minerals.
Sorry for the brief digression into data quality issues, but bad reports are not particularly uncommon. The researcher of hot desert temperatures needs to be on the lookout for these.
I somewhat randomly chose the six stations (plus Death Valley/Furnace Creek, elev. -194′) for the chart above. There are two NWS/ASOS airport stations, a RAWS station, a MAP station, a California Air Resources Board (CARB) station, and two NWS cooperative stations (DV/Furnace Creek and Trona):
Las Vegas AP 2175′ 99 miles ESE of Furnace Creek
Tonopah AP 5399′ 111 miles north of Furnace Creek
Trona, CA 1695′ 56 miles SE of Furnace Creek
Eureka Valley (RAWS) 2975′ 71 miles NW of Furnace Creek
Independence (MAP) 3924′ 77 miles WNW
Death Valley NP/Cow Creek CARB 410′ 3.2 miles NNE
The main message is that these adequately-exposed weather stations show close consistency in change in maximum temperature day-to-day during hot periods in summer. If I had included the other 30 stations in this study on the graph then it would be no different: the maximums move in (general!) lockstep in accordance with the changes of the temperature of the air mass above the region, as illustrated in the chart below.
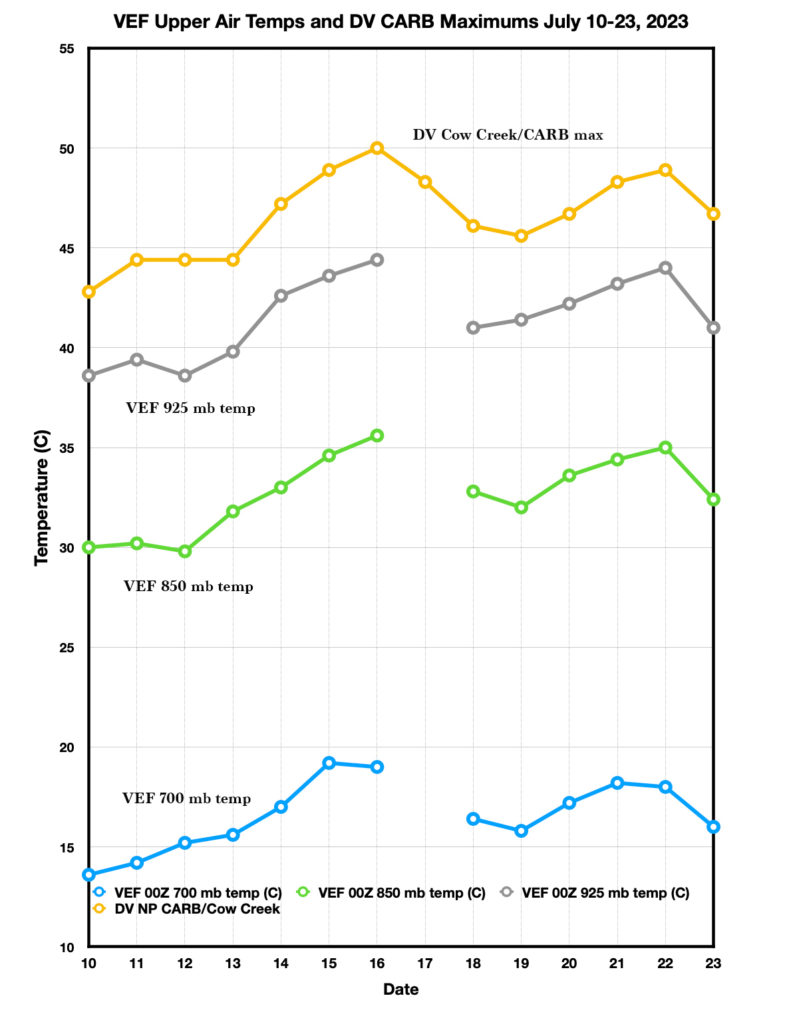
The chart above is for July 10 to 23, 2023, and includes the daily high temperature at the Death Valley-Cow Creek/CARB station and the temperatures from the 00Z upper air soundings at Las Vegas (VEF) at the 700, 850, and 925 mb levels. Temperatures are in Celsius. The 00Z soundings are very close to the hottest time of the day in summer, and the upper air temperature plots pertain to the date of the afternoon on which they were measured. In other words, a 00Z 11 Jul sounding was taken around 5 p.m. PDT on July 10th at Las Vegas, and the data from this sounding are plotted for July 10. The sounding data for the afternoon of July 17th at VEF/Las Vegas are not available.
Death Valley NP-Cow Creek/CARB is a very well-exposed station on a tall pole on a slope (at 410′ elevation) above the NPS Cow Creek settlement, 3.2 miles NNE of Furnace Creek. Its high temperature data are better suited for this chart (in my opinion!) than the other Death Valley stations since its daytime temperatures are not influenced as much by local wind and exposure affects.
The temperature plots above show the expected very-close, or very similar, changes day-to-day at the different levels. This is due to the excellent mixing region-wide from the surface to well above the 700-millibar level during the afternoons during summer heat events. And, even though the Death Valley station is about 100 miles from Las Vegas (the locale of these upper-air observations), the correlation in temperature between the two is very good. This is because regional heat events in summer are associated with rather large, sprawling and homogenous upper-level anticyclones. There is generally little change in airmass temperature horizontally over large areas between roughly the 850 and 650-millibar levels. Given the homogeneity, the temperature at the 700-millibar level above Death Valley is likely within a degree or so (C) of that above Las Vegas on such afternoons, and thus each area (the Death Valley area and the Las Vegas area) is “working off of” the same airmass. The high degree of mixing and homogeneity result in the highly correlated and predictable maximum temperatures day-to-day and station-to-station in the region. Each station reaches its “upper-limit” temperature on each afternoon. Each station in the region is roughly the same number of degrees above its long-term average daily maximum for July as the surrounding stations.
The difference in temperature between DV-Cow Creek/CARB maximum and the associated 700 mb temperature off of the 00Z sounding at Las Vegas for the 13 days from July 10 to 23, 2023, ranged from 28.8 degrees (C units) to 31.0 degrees (C units). The median value of the differences was 29.8 degrees (C). The 700 mb temperature at Las Vegas during this heat event was as high as 19.2C. This was measured around 5 p.m. PDT on the 15th, when DV-Cow Creek/CARB had a maximum of 120F/48.9C. The 16th was the hottest day of the month at Death Valley, when DV-Cow Creek had 122F/50.0C and the 700 mb temperature at Las Vegas was 19.2C. Thus, if 30 degrees Celsius is added to the 700 mb temperature off of the Las Vegas sounding, then the result is likely to be within a degree C (or within two degrees F) of the observed maximum at the DV-Cow Creek/CARB station. Keep in mind that this “rule” is good during the high-sun months during typical hotter-than-normal patterns courtesy of an upper-level high pressure anticyclone, when daytime mixing is excellent and when any moisture intrusions have not caused any significant cooling in the region. The lower-elevation stations in Death Valley (Furnace Creek and Stovepipe Wells 1SW) are typically 4-7 degrees F hotter on maximums in July than the DV-Cow Creek/CARB station, due by-and-large to elevation and exposure differences. The all-time record highest maximums at the long-established cooperative station at Furnace Creek of 128F to 130F are associated with 700 mb temperatures of 19C to 20C on the Las Vegas and Desert Rock soundings. See these two tables below for upper-air data data during the hottest summer events since 1988.
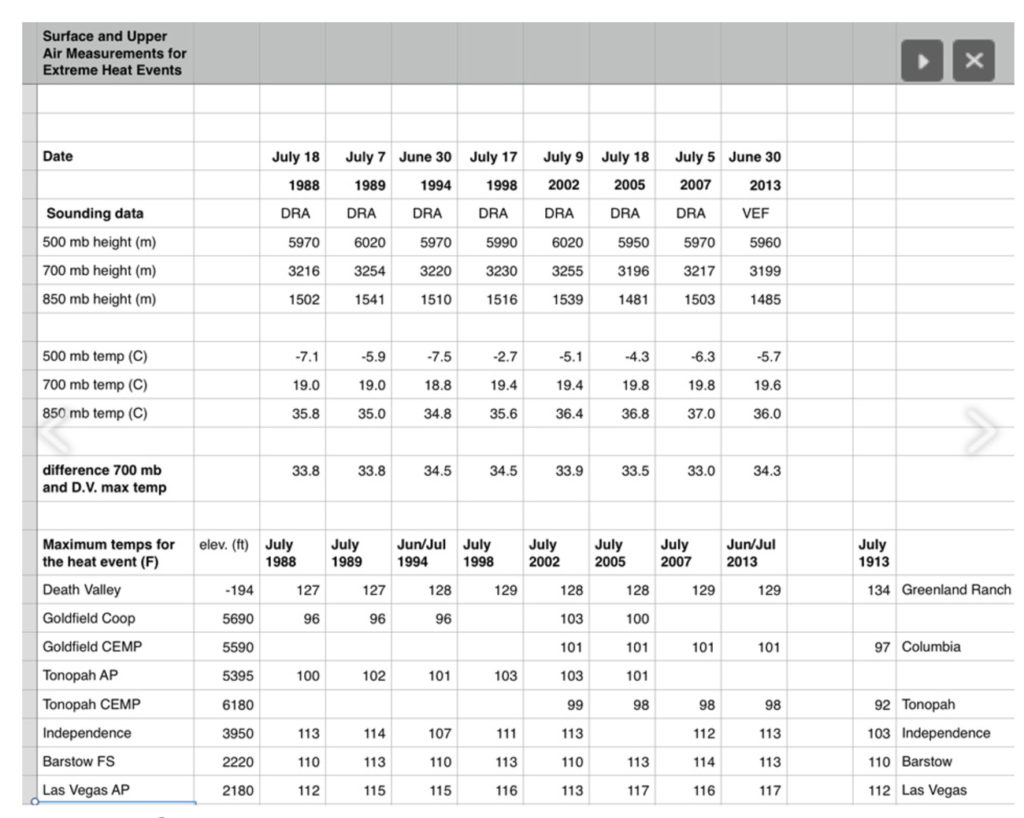
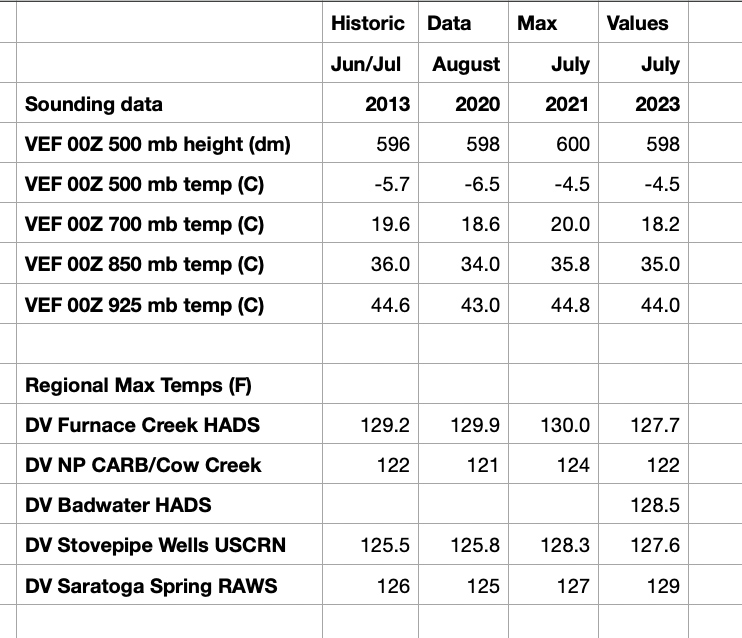
Let’s throw my working spreadsheet in here. It includes the list of about 35 stations compiled, each station’s elevation and daily maximums from July 10 to 23. Also included are upper air temperatures from the daily 00Z soundings at Las Vegas, some comparison numbers from heat events in 2013, 2020, and 2021, and average maximums for the heat event and the entire month.
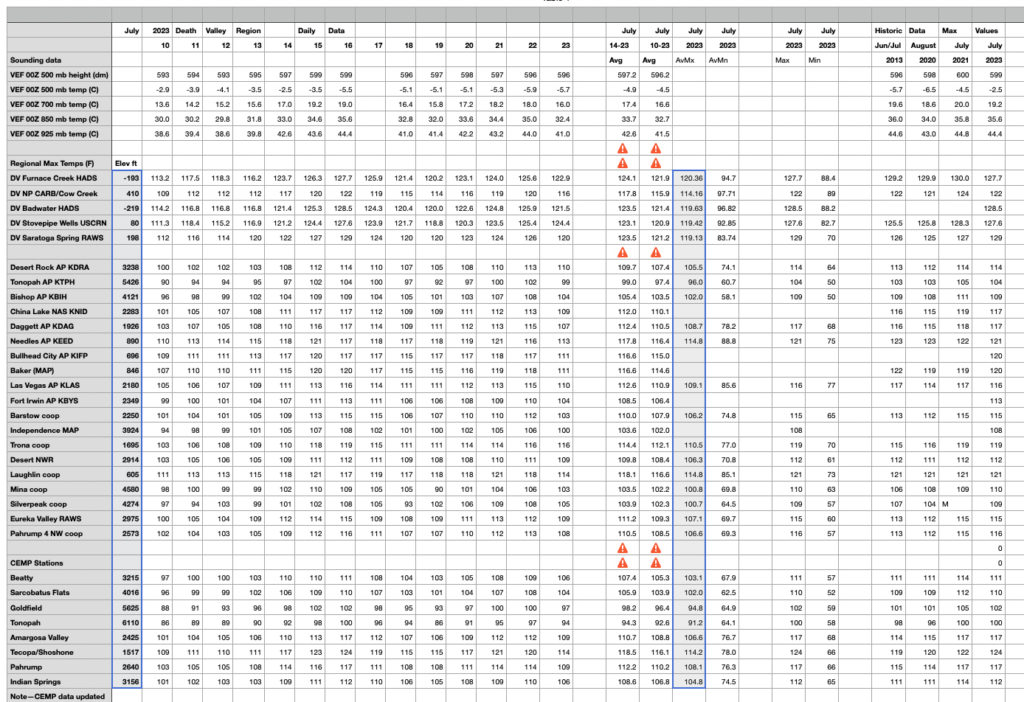
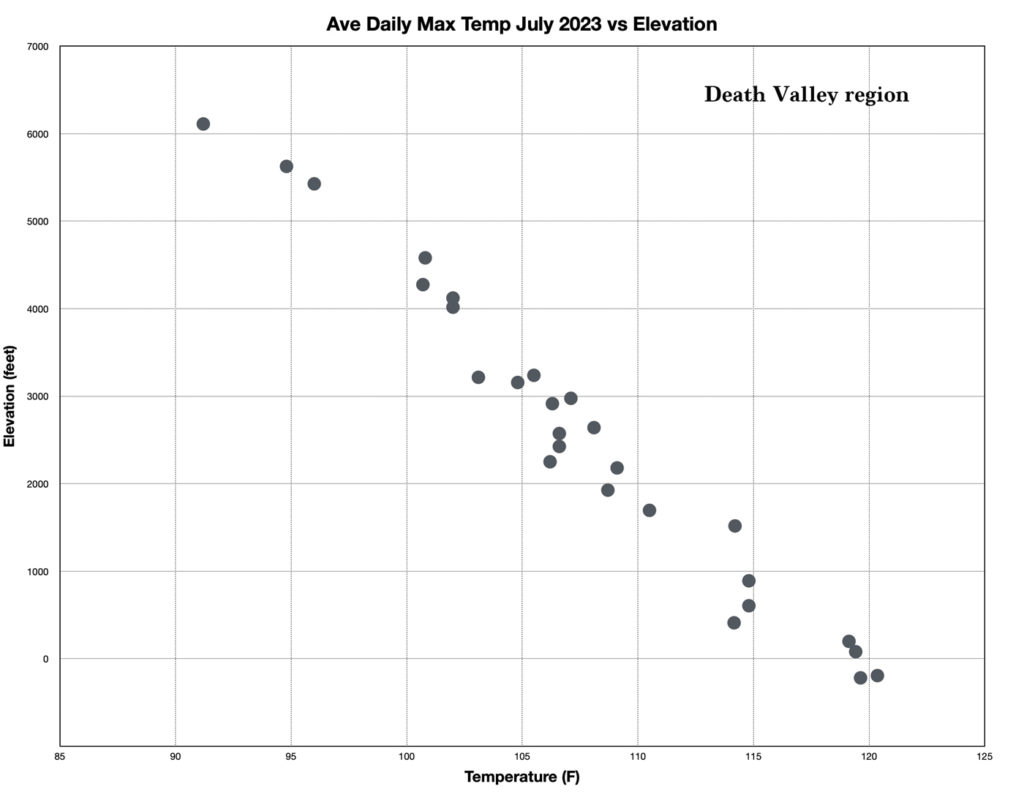
The first two charts below are scattergram plots of elevation versus average daily maximum temperature for the entire month of July 2023 in the region. I incorporated 27 stations here with an average for the entire month. Most stations are within about 100 miles of Furnace Creek, but a handful are a little farther than that. Furthest to the north are Mina and Tonopah, furthest to the southeast are Needles, Laughlin, and Bullhead City, and furthest to the south are Barstow and Daggett. I don’t consider Mina and the Needles area to be in the Death Valley region, but these are good stations which effectively represent the elevations that they are at.
The first chart below shows only the data plots. The second chart includes a “linear trend line” that the spreadsheet software provides. The slope of the line is -4.4 degrees F/1000 feet, which is pretty much exactly what one will find for the region for every summer month. Maximums cool by about 4.4 degrees F with every 1000-foot gain in elevation.
text
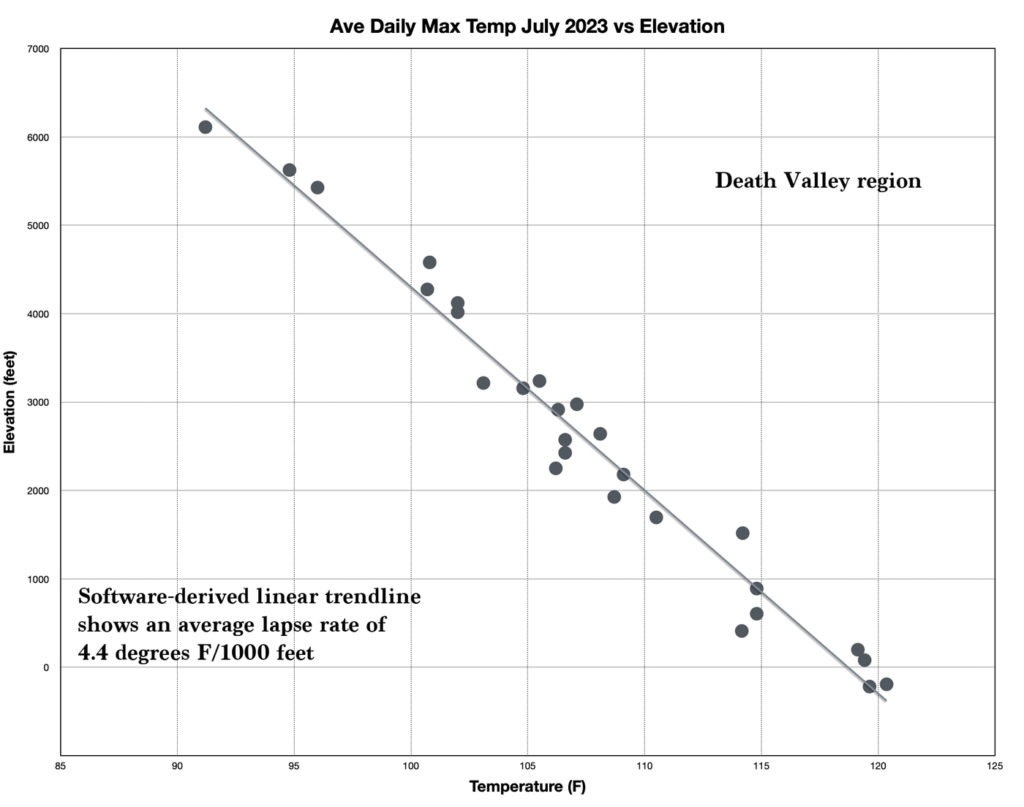
On the bottom chart (above), you will find that most stations plot within a couple of degrees (F) of the trend line. Stations more than a couple of degrees to the left of the trend line are those with particularly, or abnormally, good exposure. The DV-Cow Creek/CARB station (elevation 410′, ave daily max of 114.2F) is one of these. Its sensor is about 10 meters above the ground on a hilltop or slope, several hundred feet above the bottom of the basin. Also a few degrees to the cool side of the line is Barstow, with about 106F at 2200 feet. Barstow is quite a bit closer to cool marine air which occasionally sneaks into the western Mojave Desert when there is moderate-to-strong onshore flow. I suspect that Barstow maximums average a little cooler in summer than other places closer to Furnace Creek and at the same elevation (2200 feet) due to the proximity to Cajon Pass and other passes around the San Gabriel Mountains. (I do not know the ground cover beneath the Barstow instruments. If there is plenty of oft-watered grass around the station, then that would be important in contributing to Barstow’s comparatively cooler maximums in the region.)
The station farthest to the right of the trend line, or warmer than expected, is the CEMP station at Tecopa (about 1500′ and 114F). This is one of those CEMP stations in a town where exposure and ventilation through the station might not be quite as good as they should be. But photos of the station show a fairly decent exposure. The instruments are in a bare-ground parking lot, though, which may heat up a bit more than the natural ground cover nearby. And…were vehicles parked near the station during these July afternoons?? It might just take one vehicle parked near the station for an hour or two mid-afternoon to help bump the maximum up an extra degree or two!
In Death Valley, the Furnace Creek station (with 120.4F) averaged about 0.6F higher than the Badwater station on maximums. This average maximum of 120.4F is less than a degree cooler than the highest average daily maximum for any month at Death Valley. The record is 121.3F in July 2009. And if you are thinking that July 1917, with an average daily maximum of 121.9F was hotter, then please look at the chart of daily maximums in the region for July 1917 on this page! Maximums during the last week or so at Greenland Ranch did not decline as did the maximums at all of the closest surrounding stations, so the average for July 1917 can not be trusted.
Let’s look at similar scattergram charts. The next few are for the hottest 10-day period from July 14 to 23:
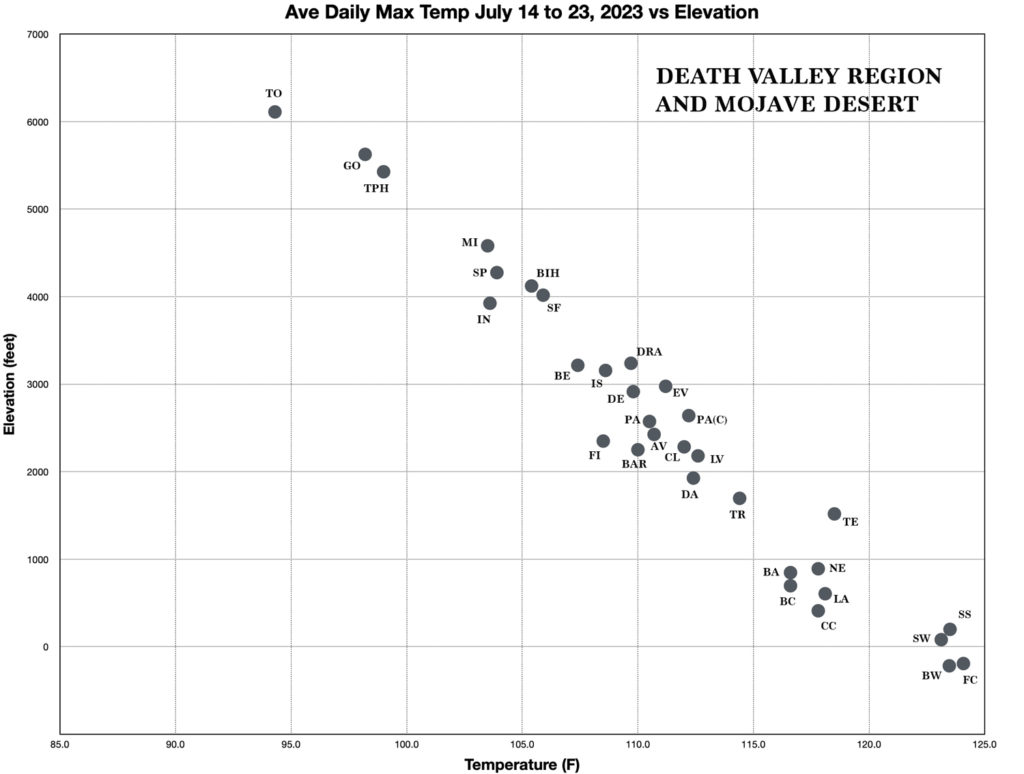
The average daily maximum temperature for the ten-day stretch from July 14 to 23 was about 123 to 124F at the lowest-elevation Death Valley stations. This is among the hottest 10-day periods for maximum temperatures on record for the region. Coolest was the CEMP station in Tonopah, about 100 miles north of Furnace Creek at 6110 feet elevation. Its average daily maximum for the ten days was 94.3F. I added a 2 or 3-letter identifier on the chart above to help you out some on figuring out which plot belongs to which station. “CC” is for the Death Valley CARB station at Cow Creek. “BA” is Baker, CA. The spreadsheet with the raw data above includes the list of stations incorporated, with their elevations, so you should have no trouble figuring out each ID code with a little effort!
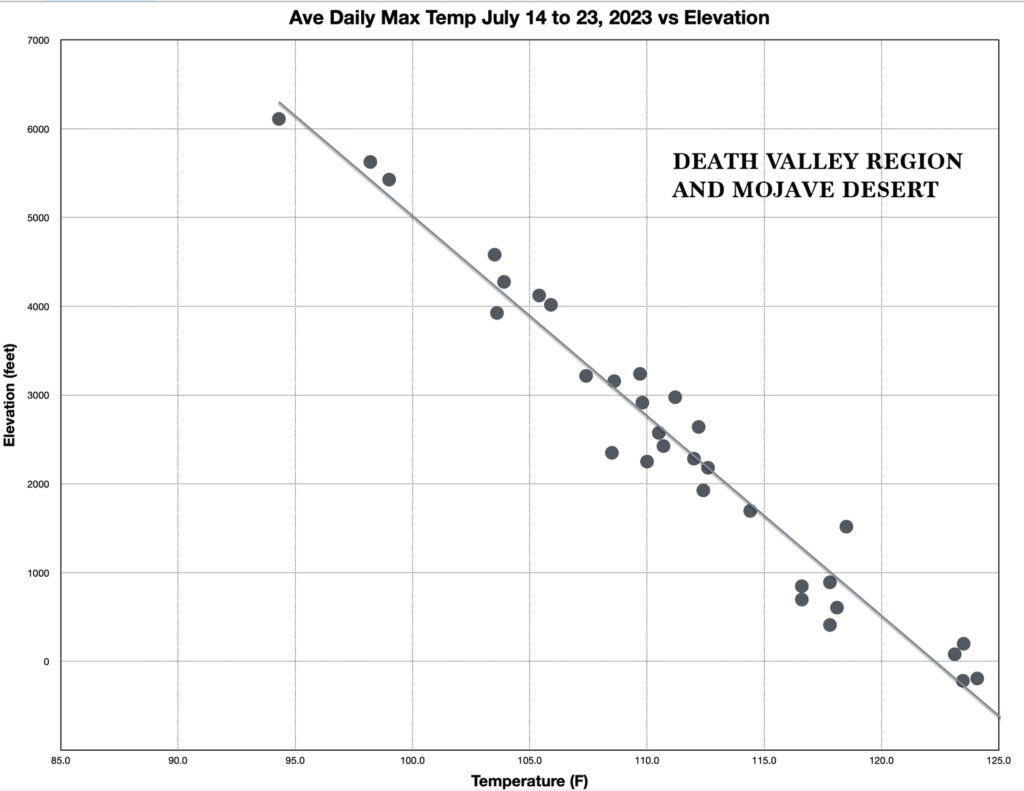
The chart above is the same, except I have omitted the station name IDs and I added a trend line. My spreadsheet software provided this trend line option, and it nicely shows the familiar 4.4 deg F decrease in maximum temperature per 1000-foot elevation gain.
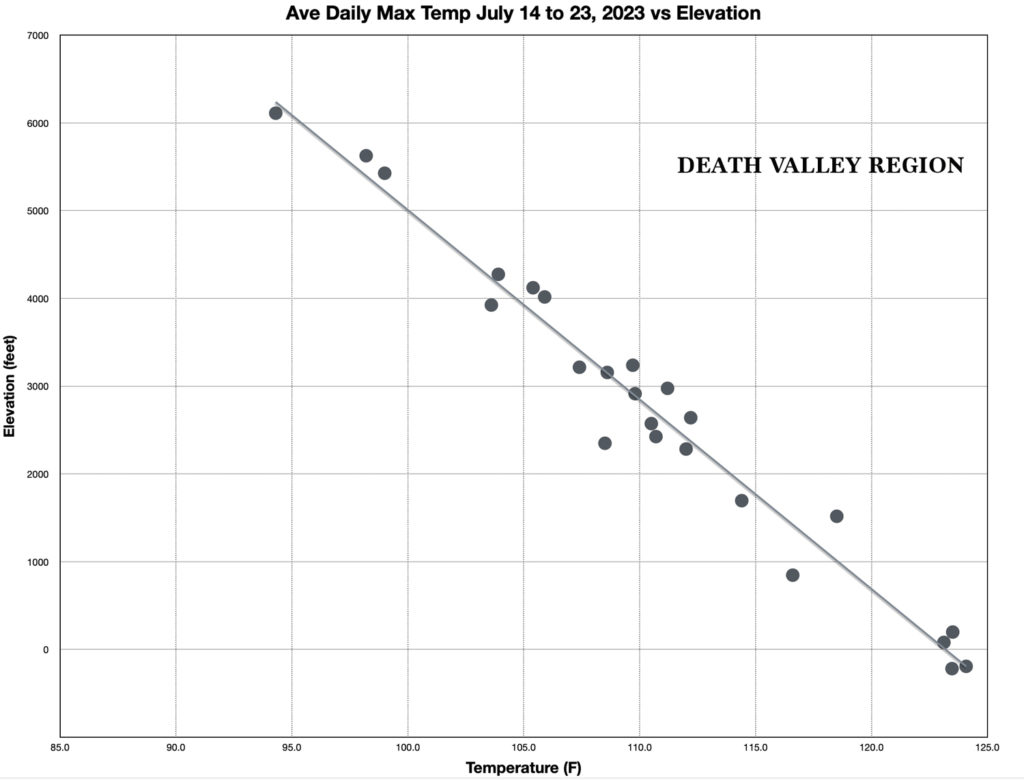
And again we have the same scattergram with a trend line, but I have omitted a handful of stations which are perhaps a bit too far from Furnace Creek to be considered part of the “Death Valley Region.” So, gone are Mina, Las Vegas, Barstow and Daggett and the low-elevation stations along the Colorado River (south of Las Vegas). I decided to keep Tonopah, since it is the highest elevation station. By omitting these more-distant stations, the trend line crosses more closely through the low-elevation Death Valley station plots. The station farthest from the trend line is Fort Irwin/Bicycle Lake. It plots about four degrees to the cool side. I think its maximums were taken only from hourly observations, so the max temp for the day is cheated by a degree or two.
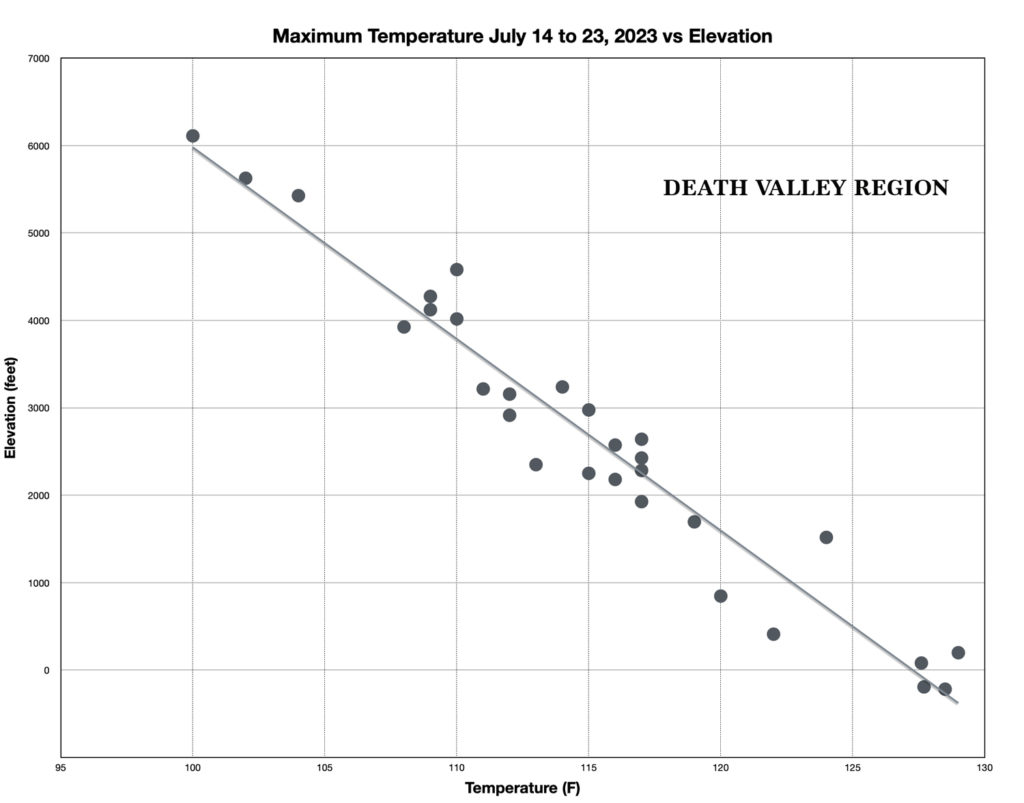
This is the final scattergram, and it compares elevation to the highest temperature recorded for this heat event of July, 2023. I omitted the distant stations near the Lower Colorado River (where it was about 120 to 121F). For this one I included Mina, Las Vegas, Barstow and Daggett. All but a few stations plot to within a couple of degrees (F) from the computer-generated trend line. And, those that plot a few degrees to the right of the trend line likely suffer from somewhat inadequate exposure (Mina at 110F and Tecopa at 124F), and those a few degrees to the left of the trend line are likely exceptionally well-exposed and/or have the temperature sensors well above the regulation height of about 5-6 feet above the ground (e.g., DV Cow Creek/CARB at 122F, Baker at 120F, Fort Irwin at 113F). An authentic temperature of 100F at Tonopah, above 6000 feet, is quite remarkable.

Leave a Reply
You must be logged in to post a comment.