
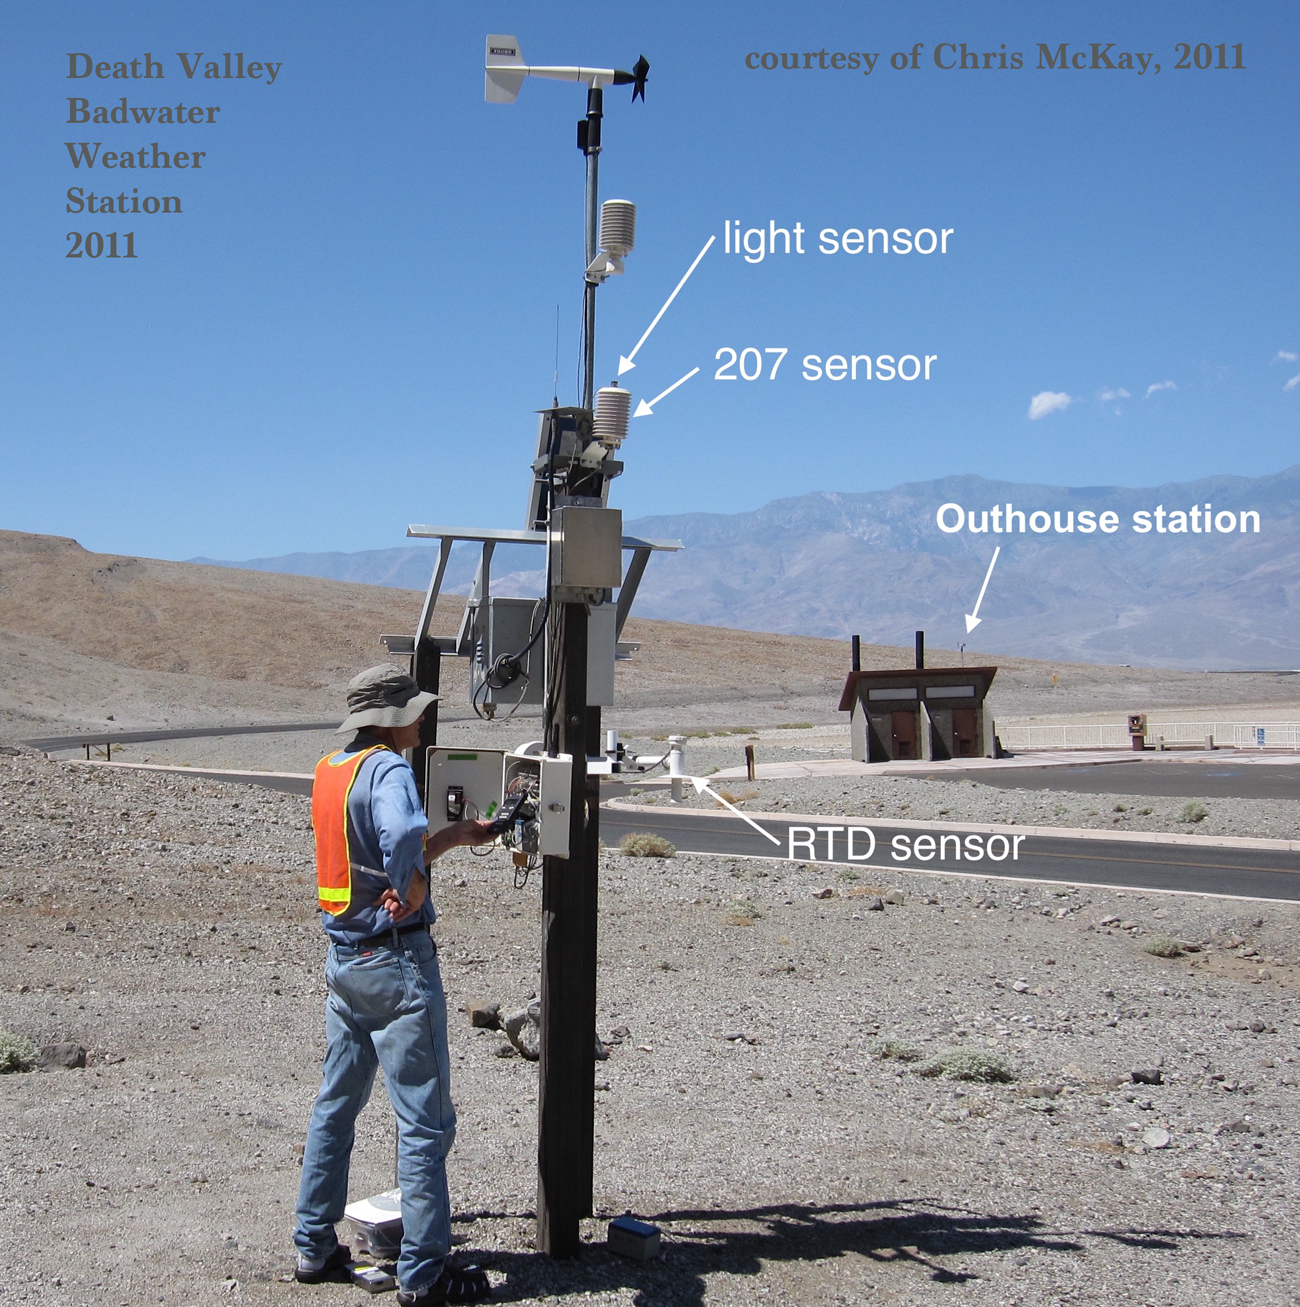
I received an e-mail recently from NASA scientist Chris McKay (pictured above on September 19, 2011). McKay found my web site, and shared that he operated and maintained the weather station at Badwater for more than 20 years. He made me aware of his recent peer-reviewed article
which includes this link to data from 1998 to 2019 for Badwater!
McKay corrected Table 1 from the article when Balázs Veszely pointed out a discrepancy. The updated table is provided below:

NASA and McKay “closed” the Badwater station on December 17, 2019. The National Park Service (NPS) and National Weather Service (NWS) installed a new station at the same site with Campbell Scientific instrumentation in late summer 2021. (The NASA instrumentation was taken out, and the same posts were incorporated by NWS/NPS.). There is a gap in the data from Badwater for 2020 and the first half of 2021.
NPS Press Release on Badwater weather station
The background of the Badwater weather station has been somewhat of a mystery to me for a long time, but no longer! I have not dug into the data yet, but it will be fun to compare Badwater summer maximums with those at Furnace Creek, Cow Creek/CARB, Stovepipe Wells and Saratoga Spring.
McKay provided the following on the Badwater station in his e-mail:
—————–
Circa 1995 I was working in the Mojave and Death Valley on cyanobacteria that grow under the translucent stones
(eg. Smith, H.D., Baqué, M., Duncan, A.G., Lloyd, C.R., McKay, C.P. and Billi, D., 2014. Comparative analysis of cyanobacteria inhabiting rocks with different light transmittance in the Mojave Desert: a Mars terrestrial analogue. International Journal of Astrobiology, 13(3), pp.271-277.)
and in salt crusts. This took us to Johnson Canyon in DVNP which is rich in endolithic algae and to the green layer just below the salt surface in the flats at Badwater. I noticed that there was a weather station at Badwater and the data was being relayed in real time to the park visitors center. Wandering over to look at the station I noticed that the temperature sensor was just a semi-conductor sensor in a TO-18 metal casing just sitting loose on the station without even passive much less active shielding.
I had experience putting in met stations in the Antarctic, the Arctic, and deserts as part of our astrobiology work and I knew this was not right. I talked to the Chief Interpreter who told me that the station was put in by S. Cal. Edison as part of a deal to allow them to put a repeater on Rogers Peak. I contacted the guy at Edison and they were more than happy for me to take over the station. In 1998 I put in a Campbell data logger with an aspirated platinum resistance thermometer. I was anticipating that the Badwater site would be hotter than the Furnace Creek site. I was also anticipating that increasing global temperatures would result in even hotter maximums in DV in just the next few years. As it turned out neither of these was correct.
As you know the NWS put in an official Badwater Station. I pulled mine out in 2019 and turned the site and mounting posts over to NWS. Just recently I got around to publishing our data:
McKay, C.P. 2024 Meteorological data from Badwater, Death Valley National Park 1998 to 2019. Geoscience Data Journal. https://doi.org/10.1002/gdj3.264
Two results may be of interest to you.
1) the difference between the actively aspirated and passively aspirated air temperature sensors (Figure 2). The passively aspirated sensor reads only about 0.5C warmer at 50C – a smaller difference than I had expected.
2) The unexpected result shown in Table 1 that the peak temperature during a given heat wave occurs a day or two earlier at Badwater than the peak temperature at Furnace Creek. Of course, n=4 only.
Over the months since I finished the paperwork on this I started to ponder and realize that the strange thing about the data was what did not happen – like the dog in the night in Sherlock Holmes. DV maximums did not get hotter for 22 years. The temperature maximum in 1998 was 129F (the first of this) and until 2020 it was still 129, now its 130. That is a 1F increase in 25 years. If asked in 1998 I would have predicted a much larger rise. The mean annual temp at DV is going up, and so are the means of the summer months but the maximum not so much.
Additional images below
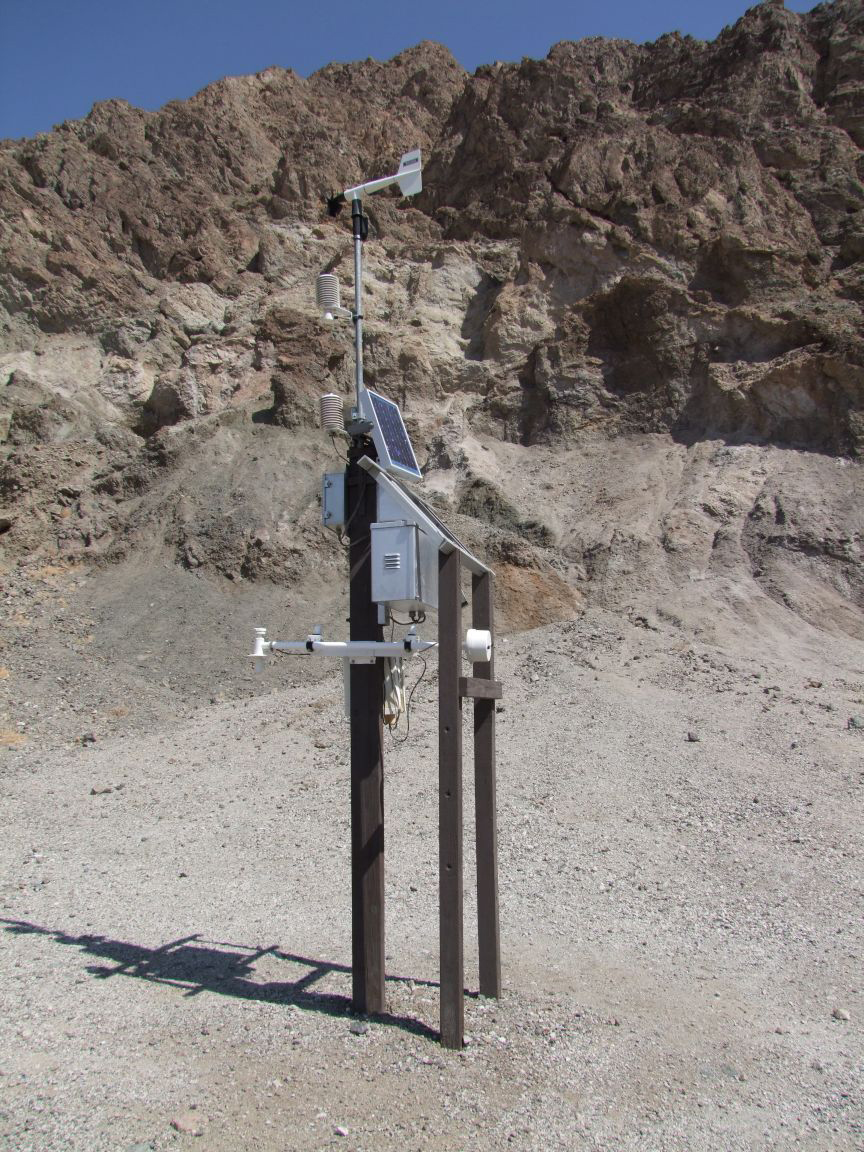
Above: photo of Badwater station/August 27, 2009/courtesy of Chris McKay
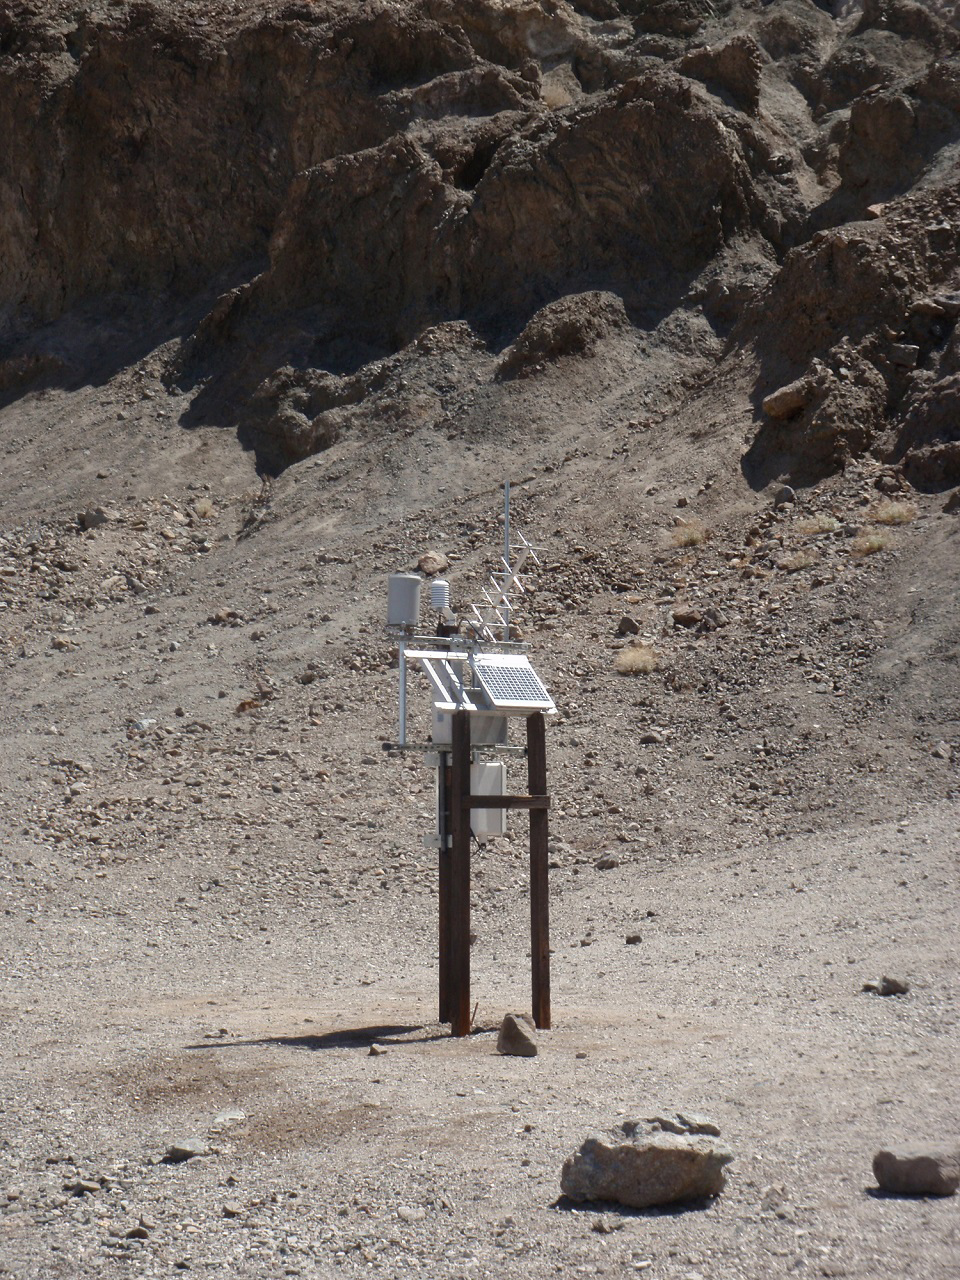
Above: photo of Badwater weather station circa 2021 from NPS/NWS press release
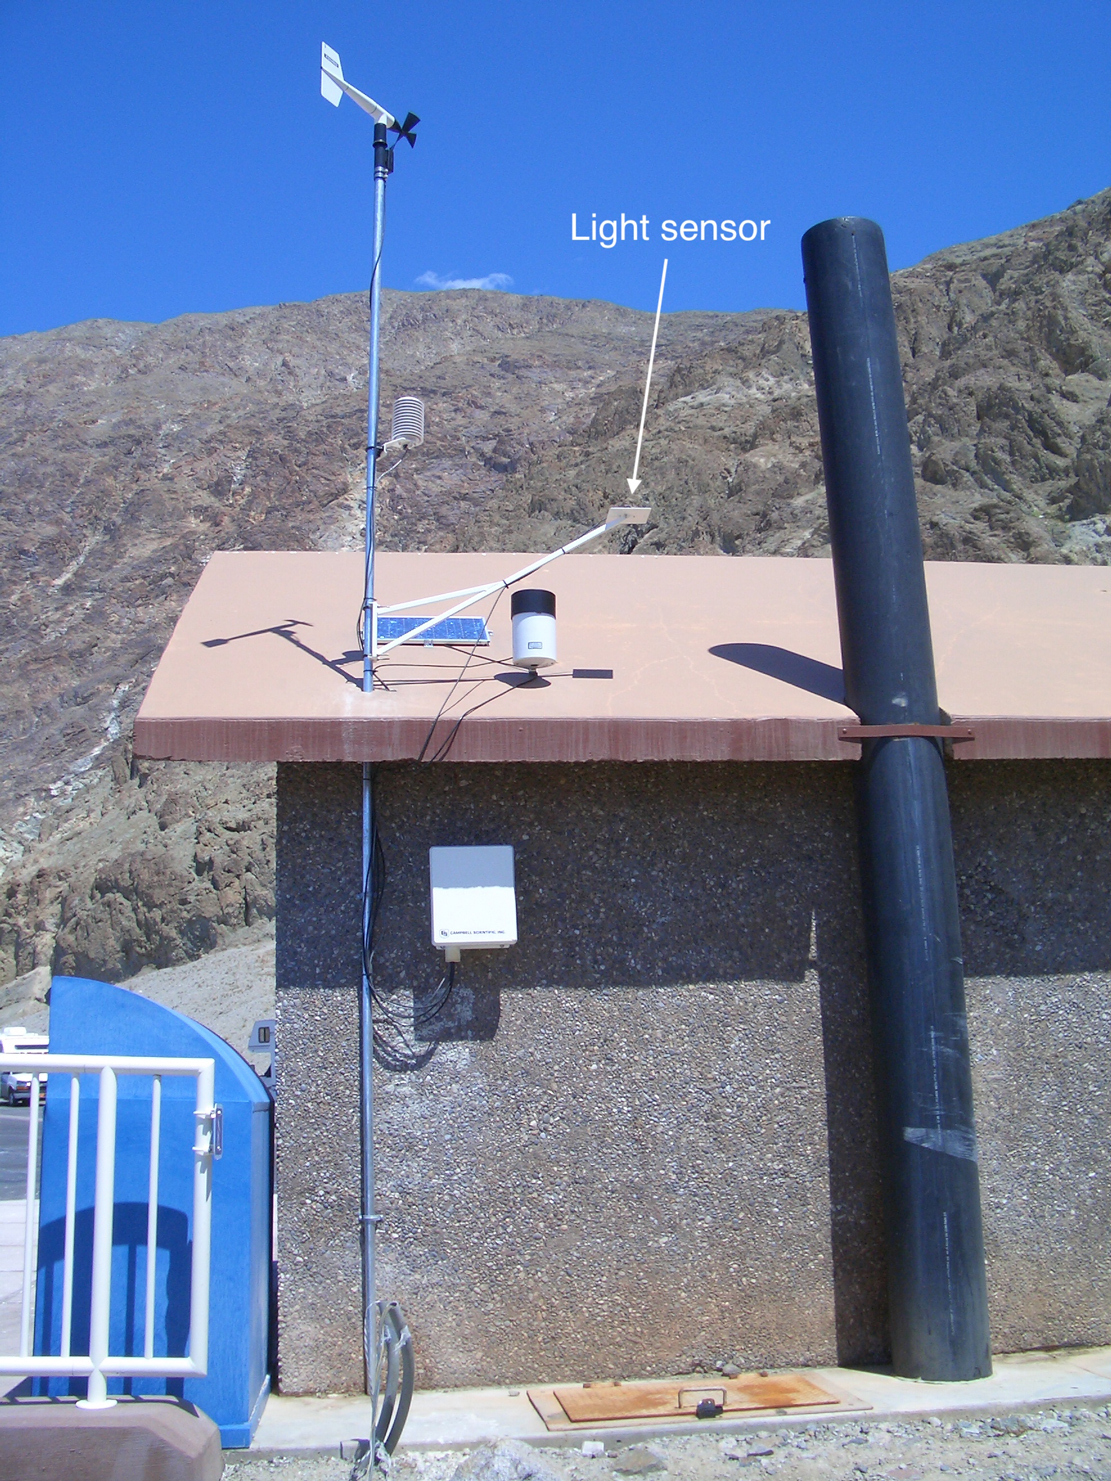
Outhouse station above, from April 29, 2005/photo courtesy of Chris Mckay
The Badwater radiation shield for temperature measurement was aspirated while NASA operated the station, but that was switched to non-aspirated when the NWS/NPS installed the new instrumentation. Apparently they were aiming to replicate the (non-aspirated) instrumentation at the official DV/Furnace Creek station. This information applies to the station closer to the slopes and just east of the highway, and not the “outhouse” station.
Leave a Reply
You must be logged in to post a comment.