
I find myself often digging into old climatological publications for Death Valley weather and climate records. This entry is designed to help stick much of the old and new Death Valley/Furnace Creek area average and extreme climate data into one place. (Or maybe more than one place, depending on how unwieldy this page gets!).
Let’s start with the official 30-year “normals” as averaged out and tabulated by our good friends at NOAA. We will work backwards in time, eventually to the really early (pre-1950) averages in the Department of Agriculture Bulletins, before 30-year normals were invented!
To reiterate, this entry is for the Greenland Ranch (1911-1961) and Death Valley (1961-present) climate stations at Furnace Creek in Death Valley, California. The elevations of the stations here have been from about -168 to -194 feet. I will share screen grabs from sources online and provide iPhone pics from the older publications. Also provided are the data for Cow Creek. For a somewhat comprehensive background on the official USWB and NWS/NPS Furnace Creek-area stations, visit this web entry on Stormbruiser.
Web sites providing the averages and normals include NOAA and the Western Region Climate Center
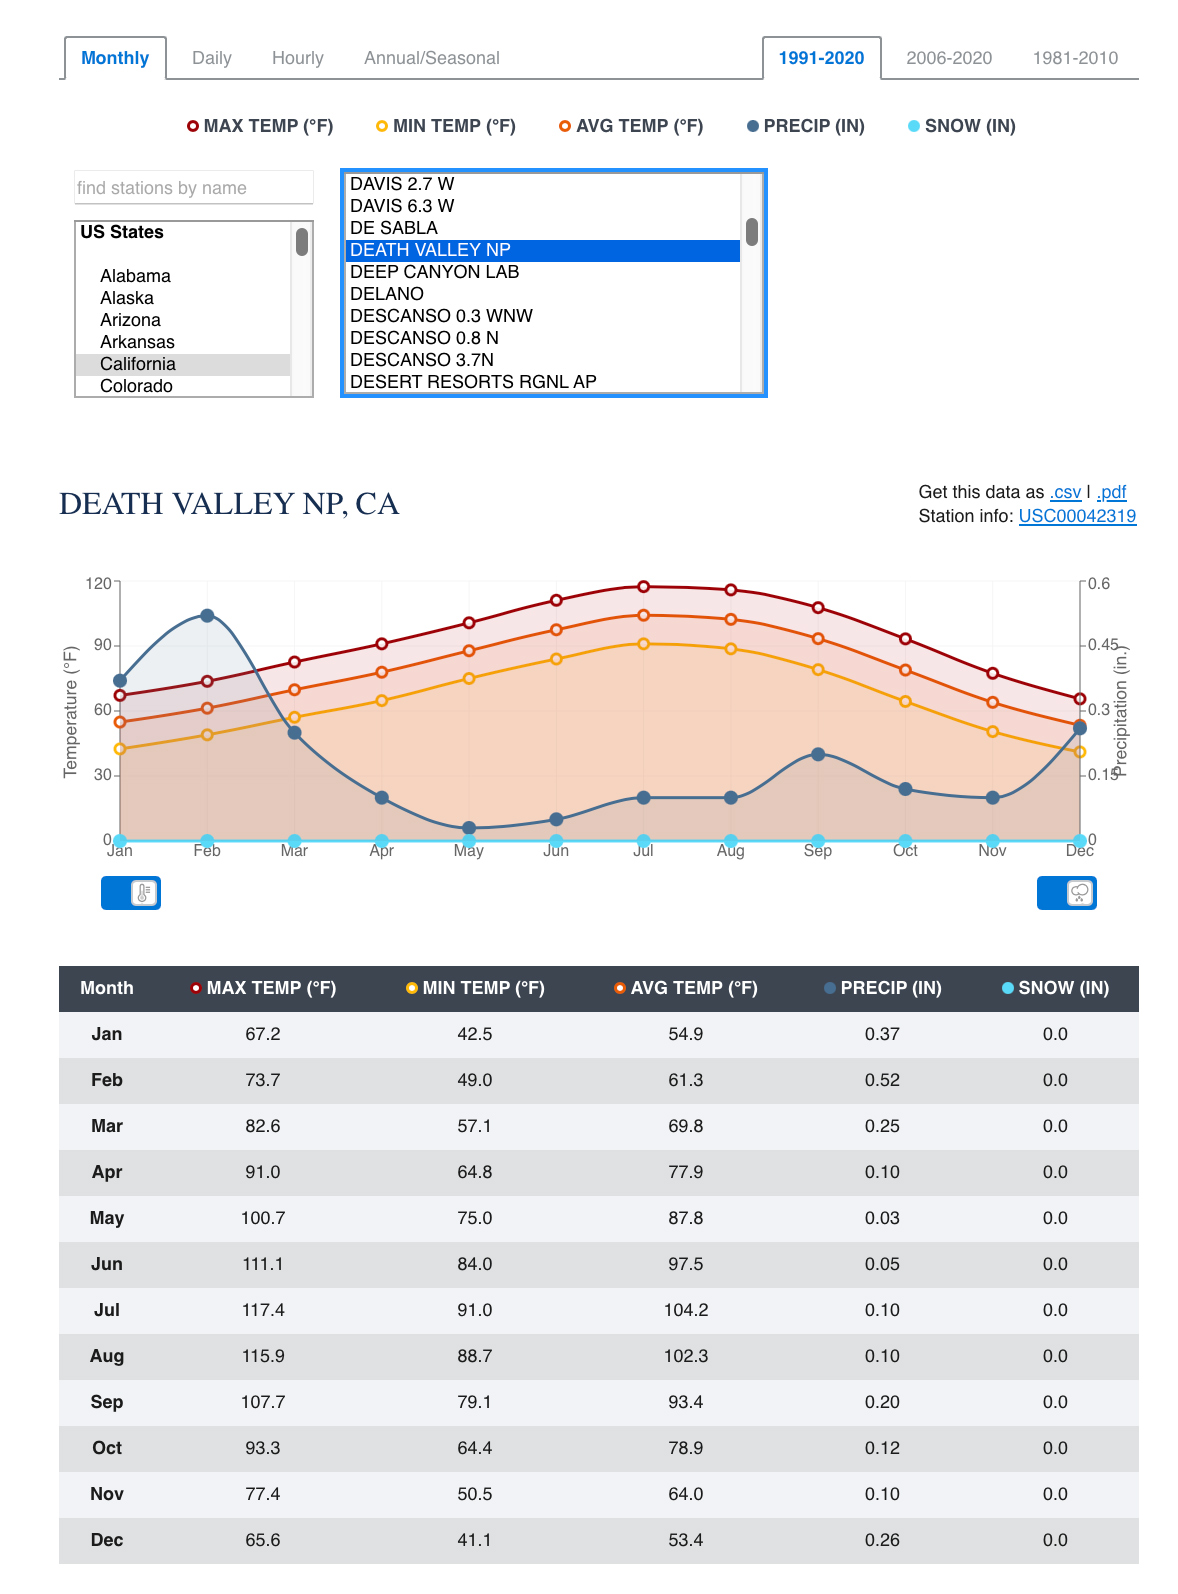
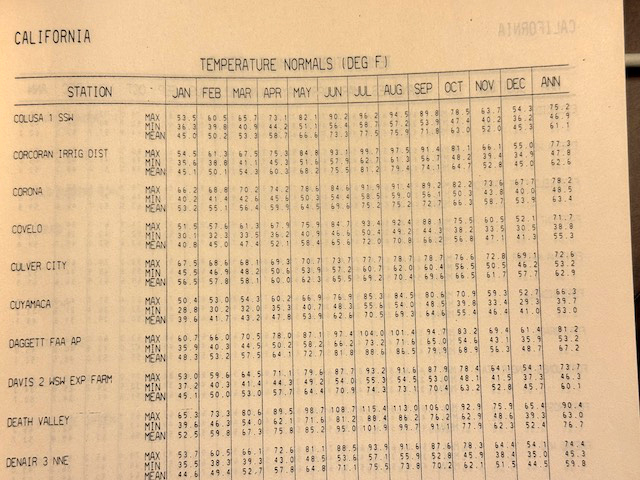
1991 to 2020/30-Year Normals/Death Valley
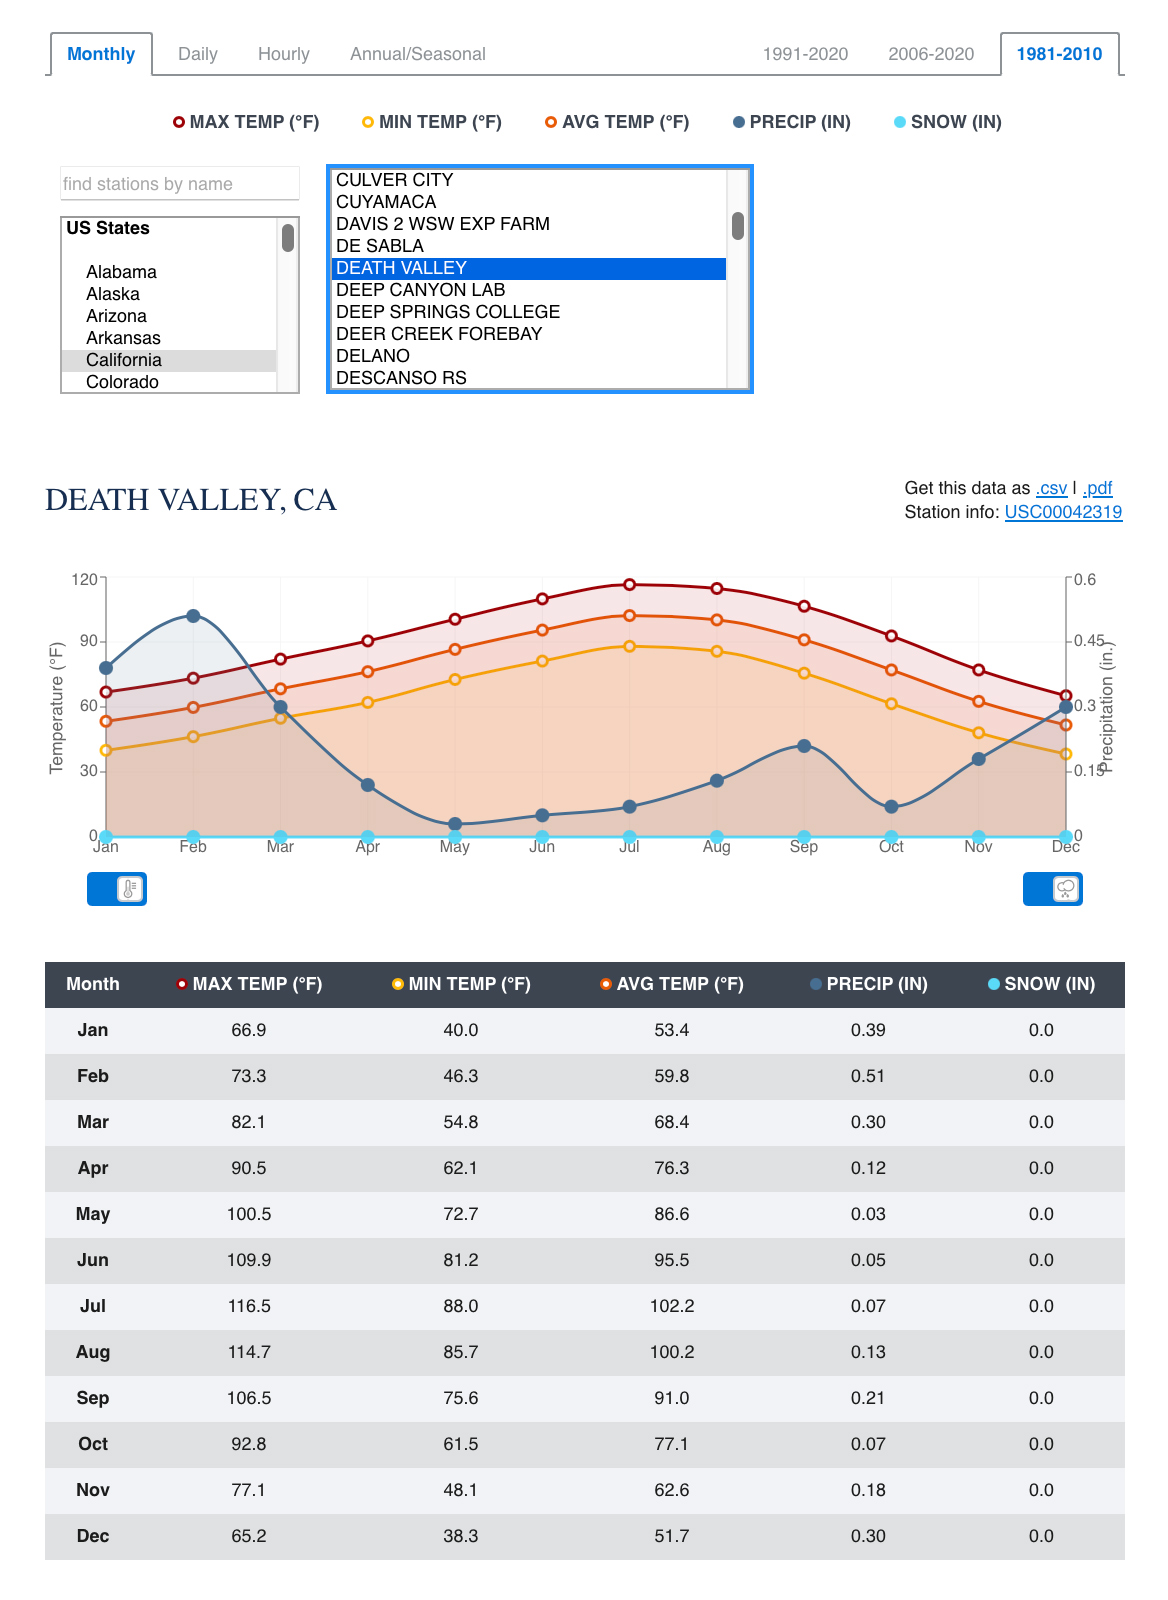
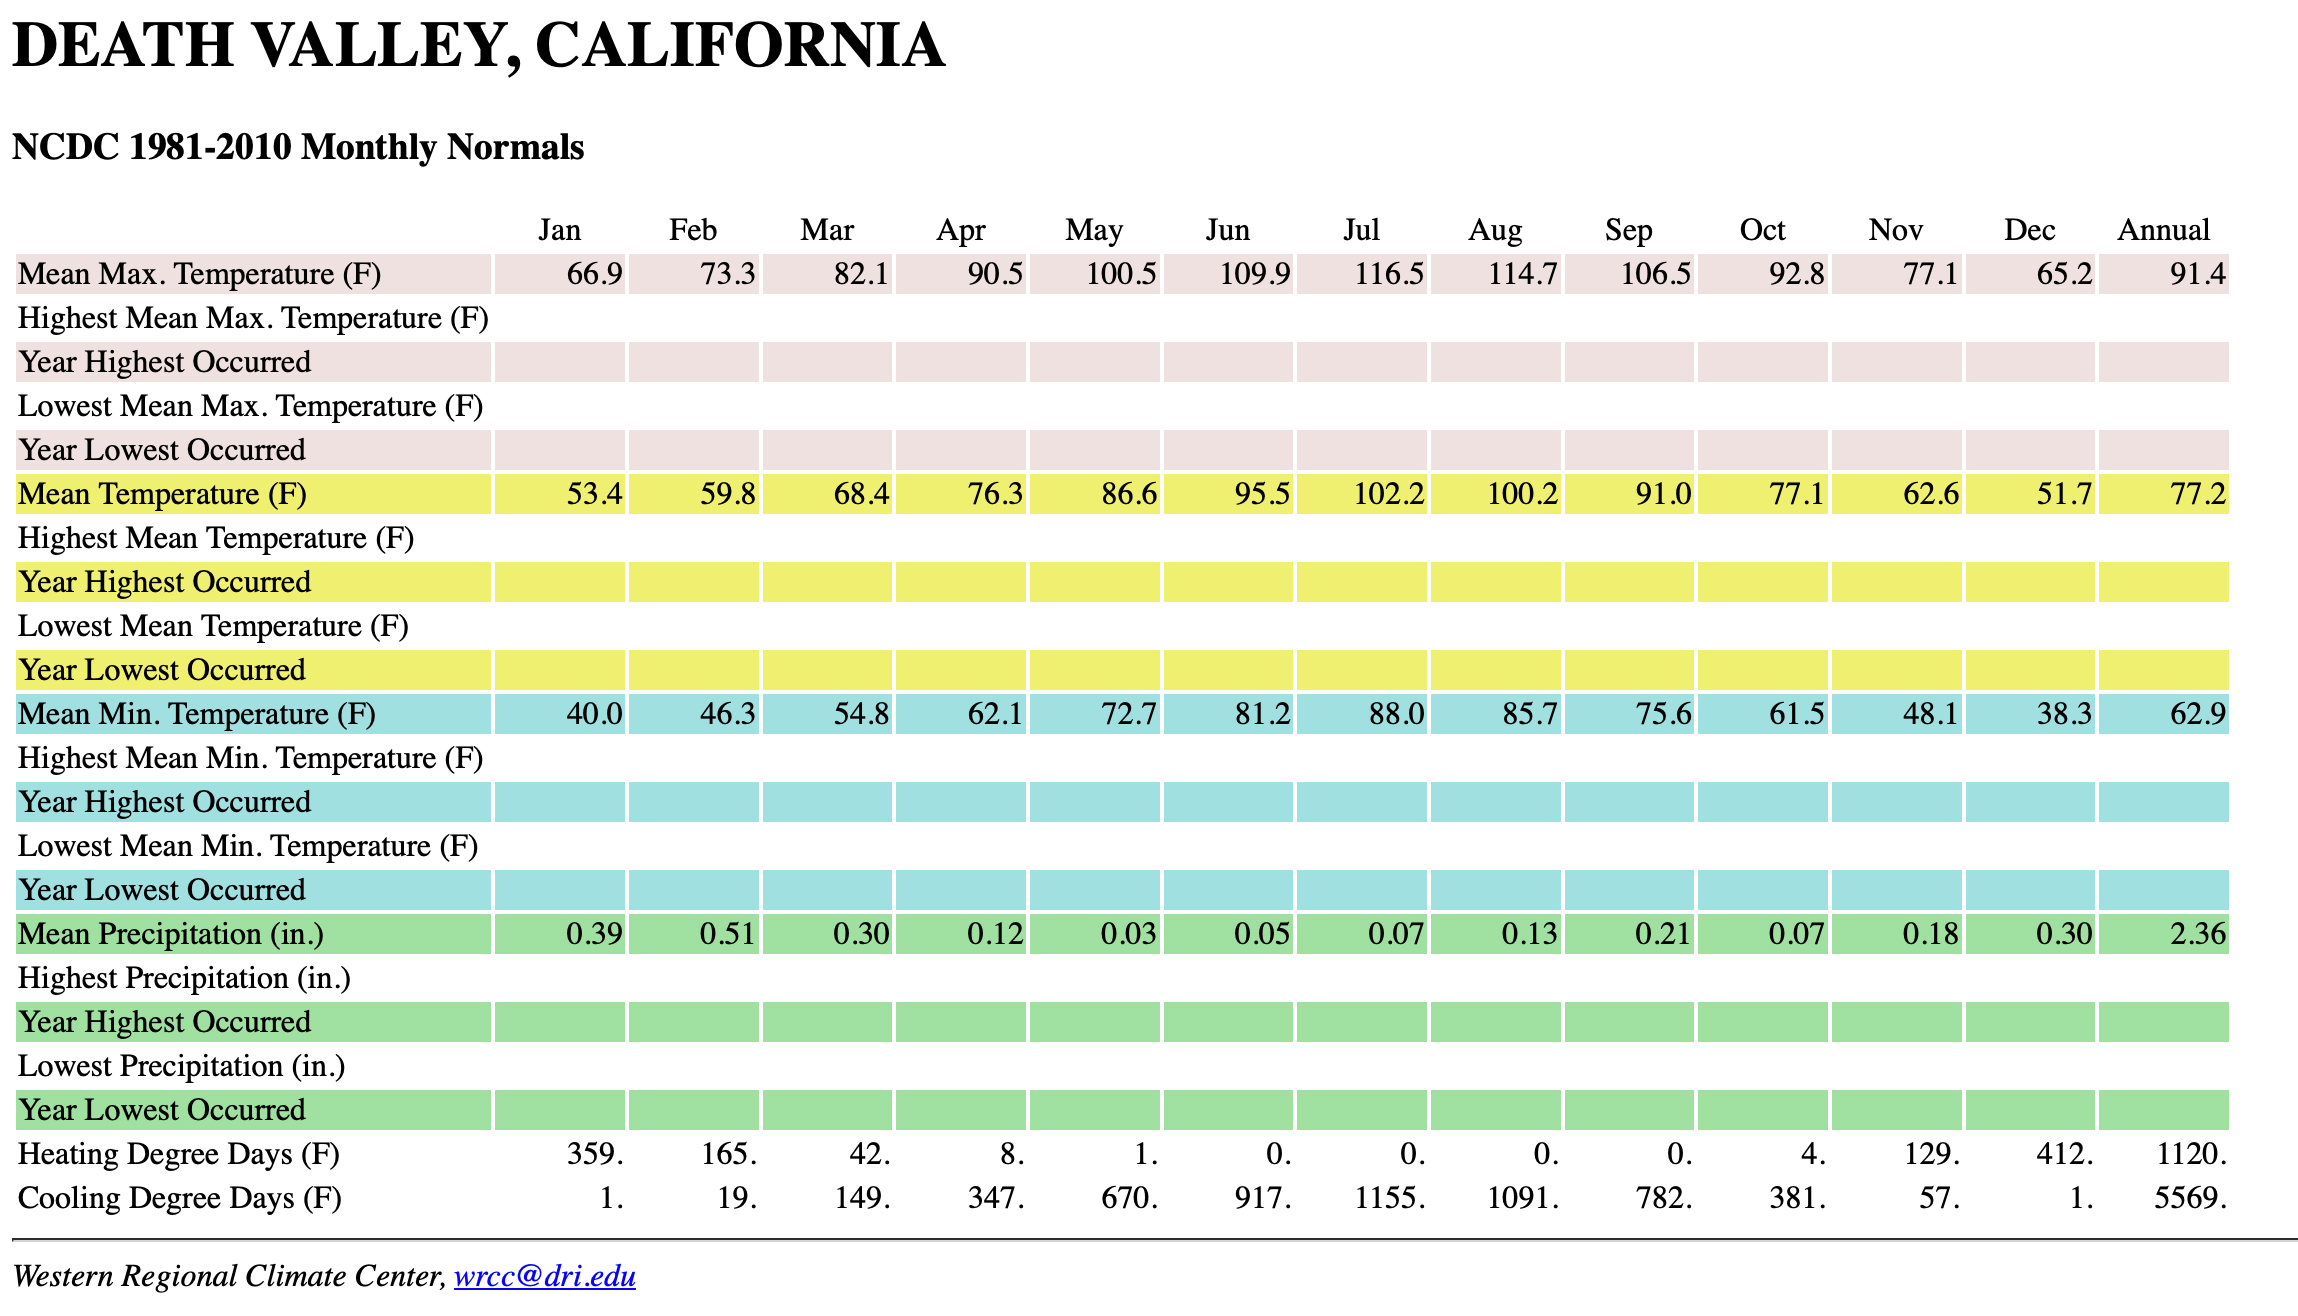
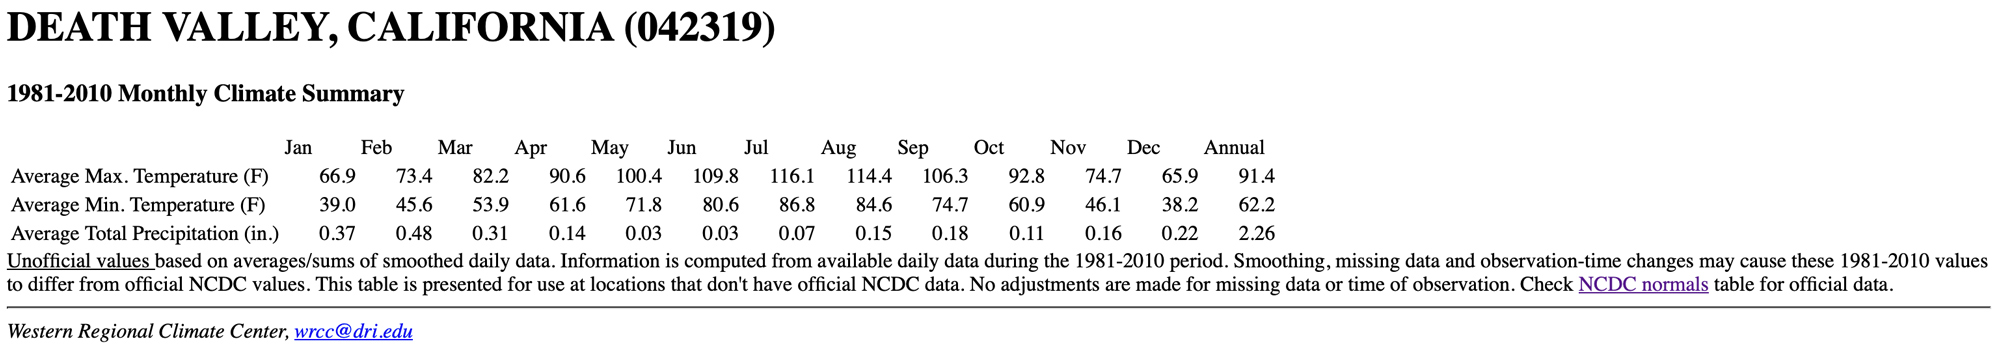
1981 to 2010/30-year Normals/Death Valley
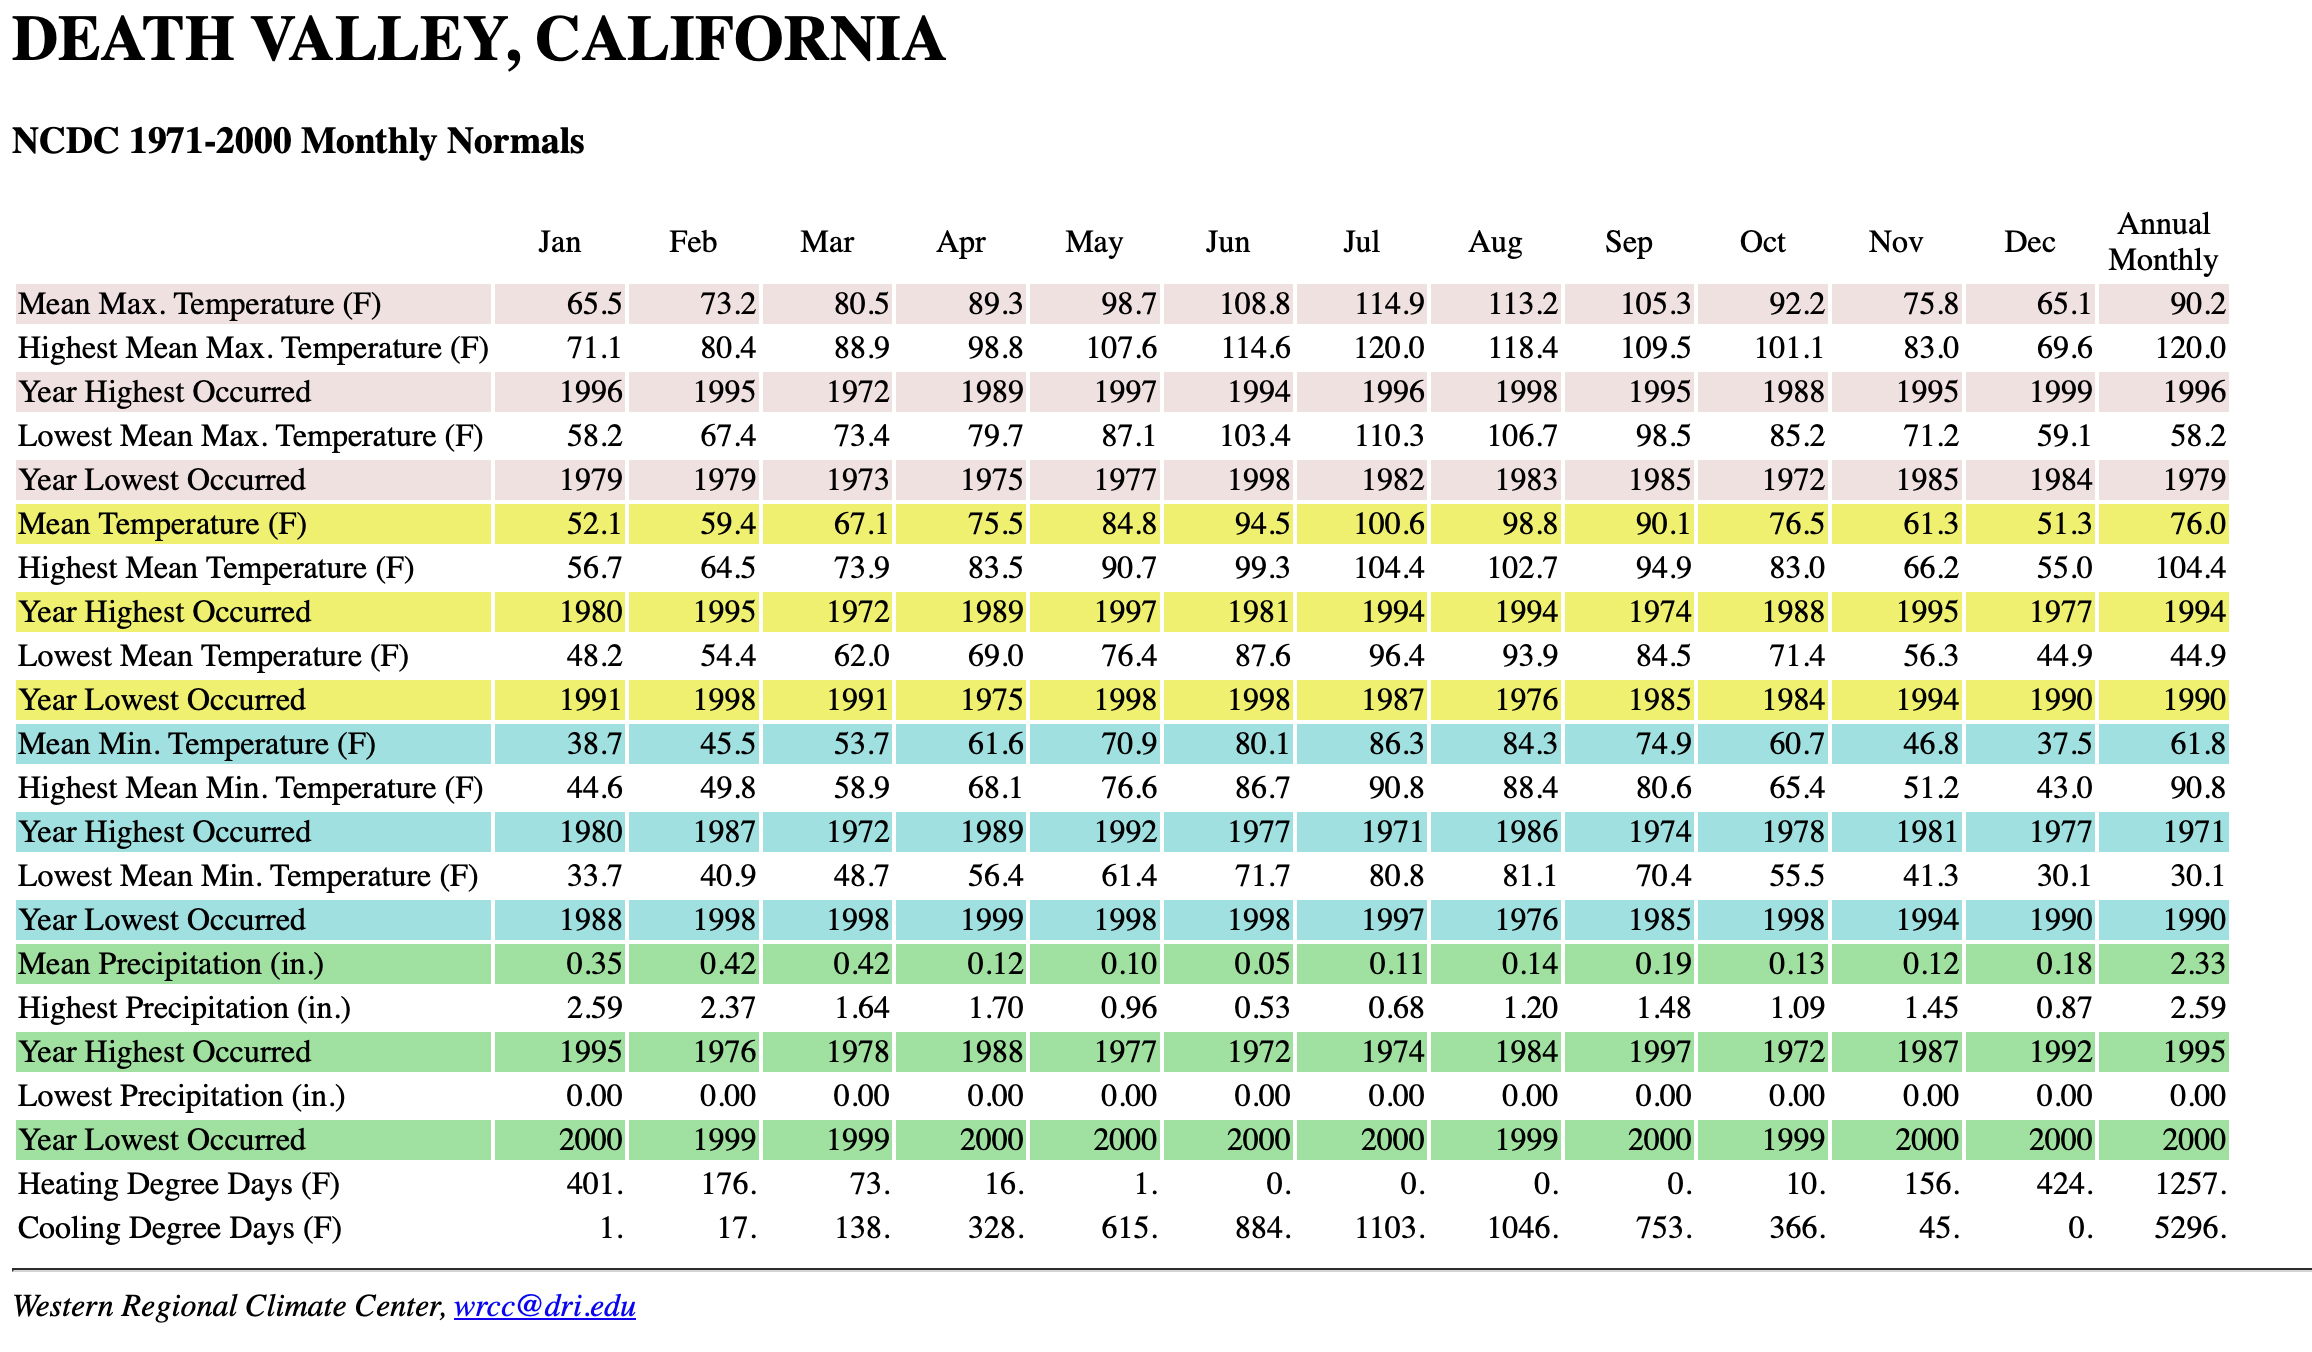
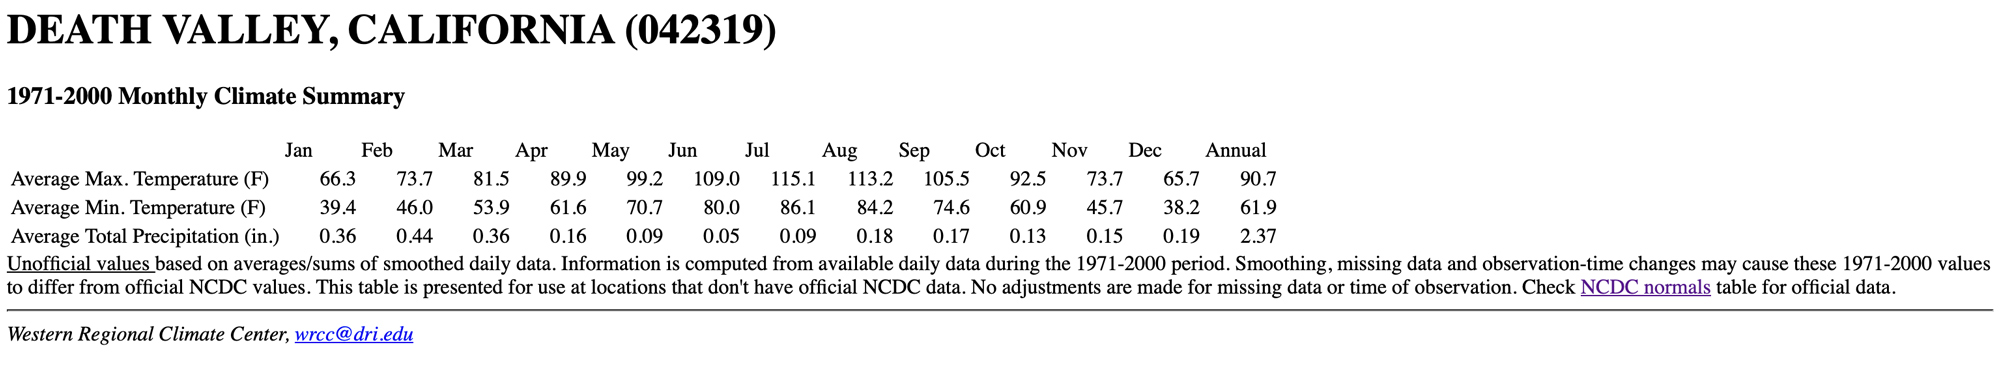
1971 to 2000/30-year Normals/Death Valley
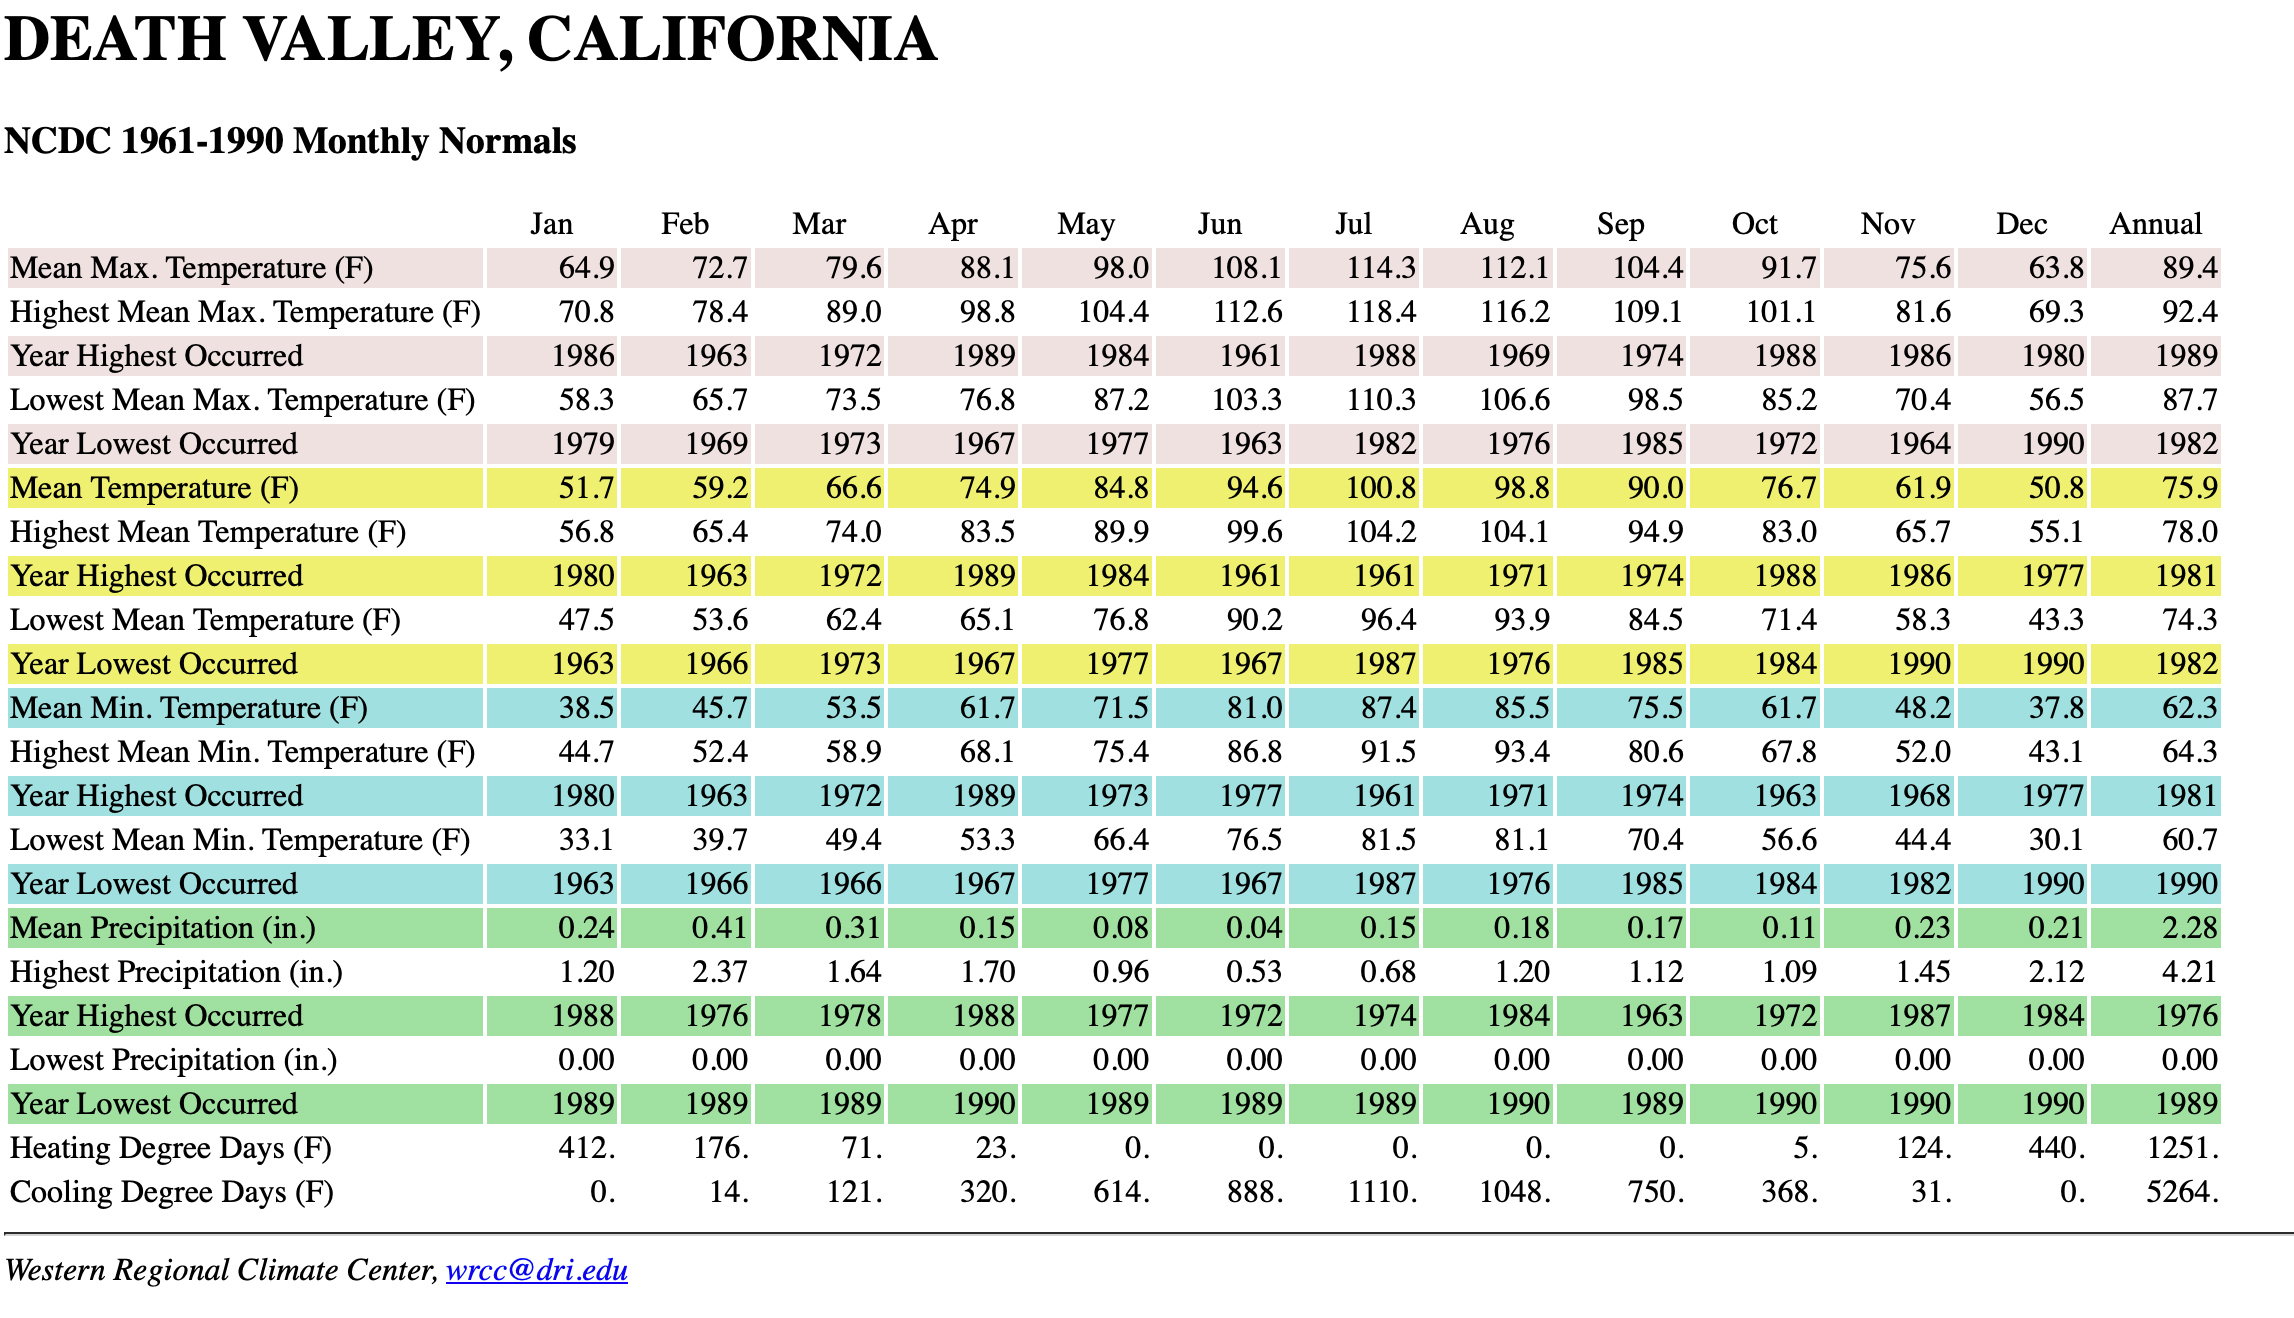
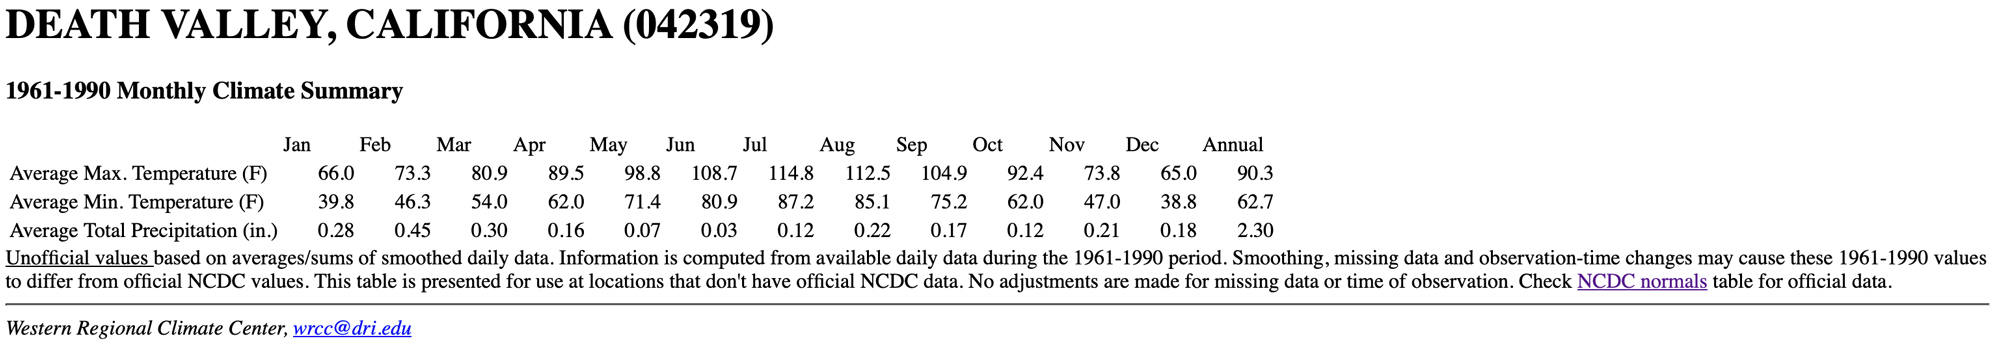
1961 to 1990/30-year Normals/Death Valley
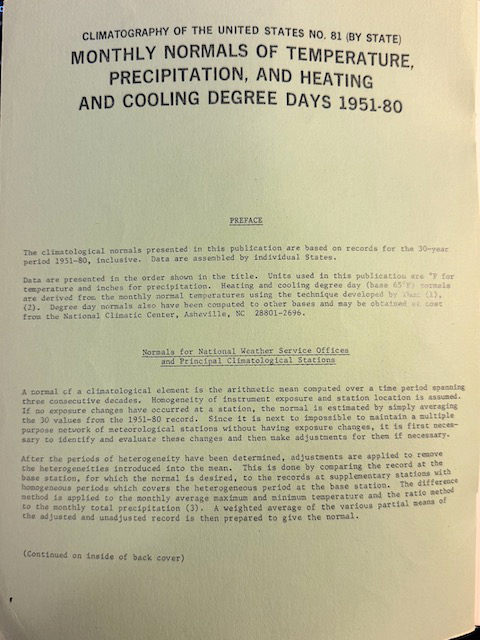
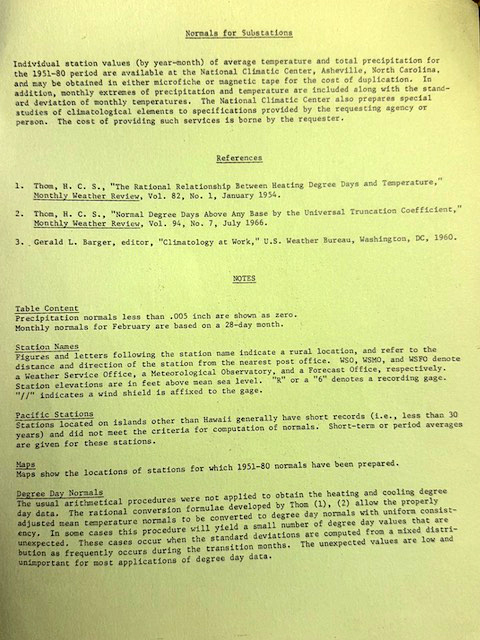
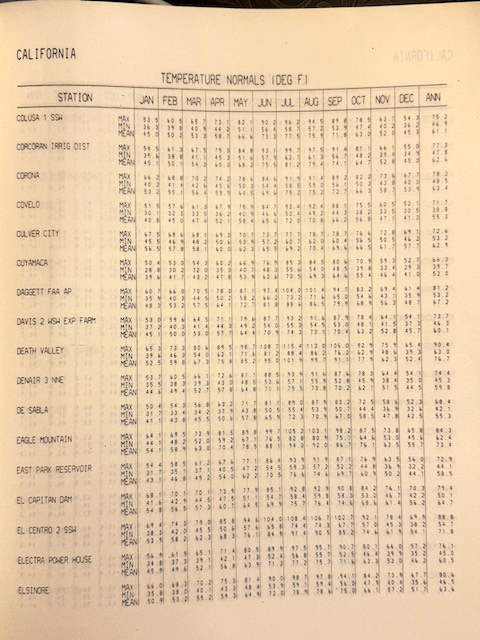
1951 to 1980/30-year Normals/Death Valley and Greenland Ranch
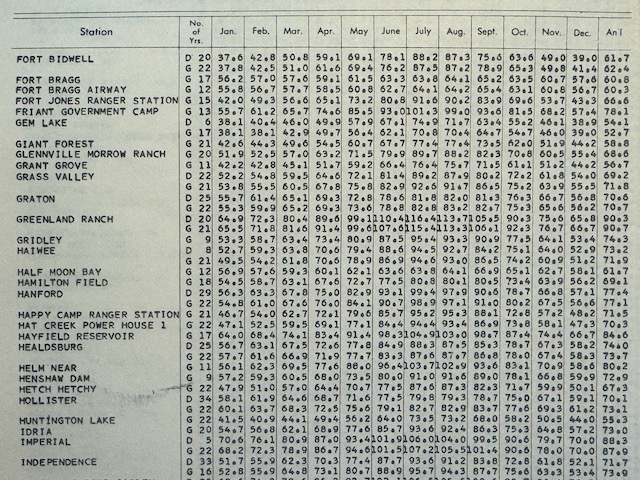
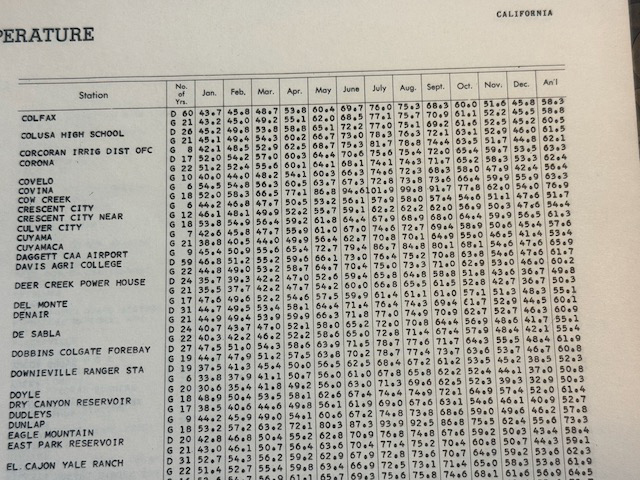
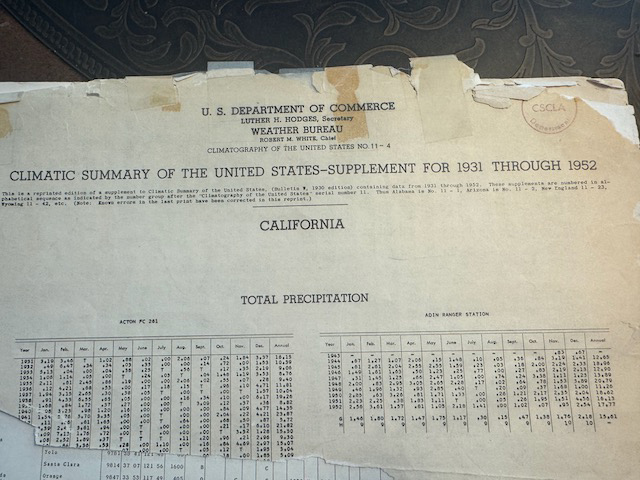
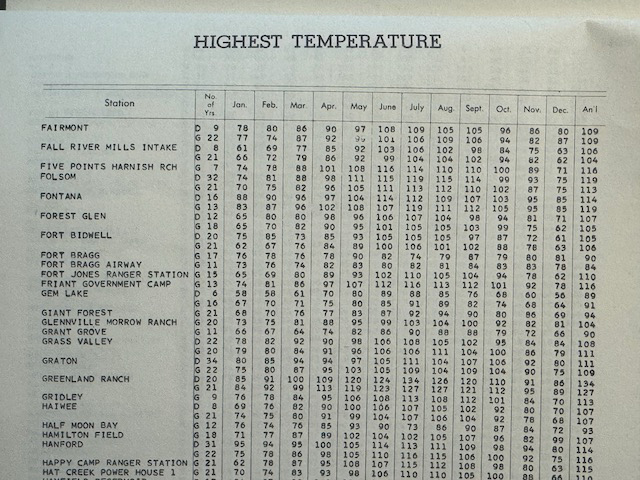
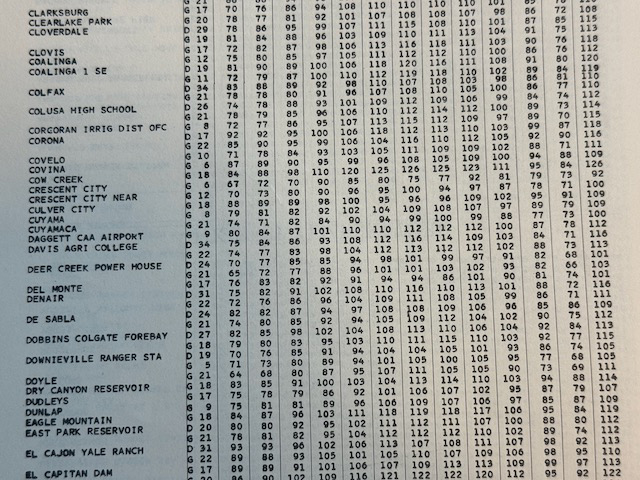
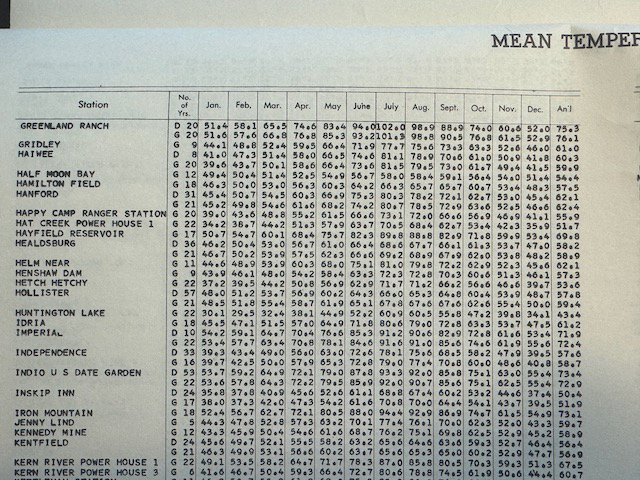
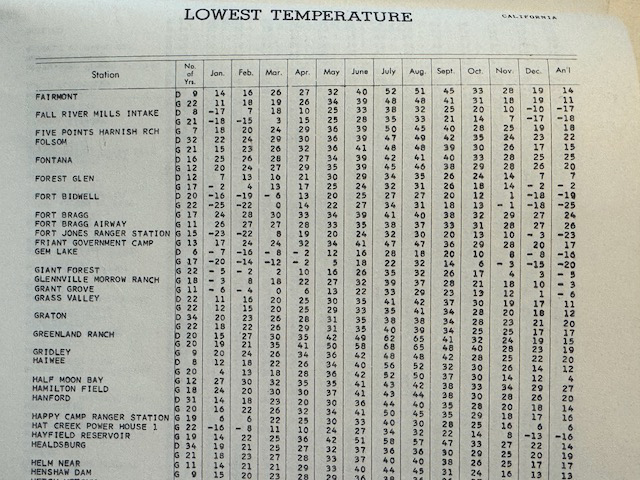
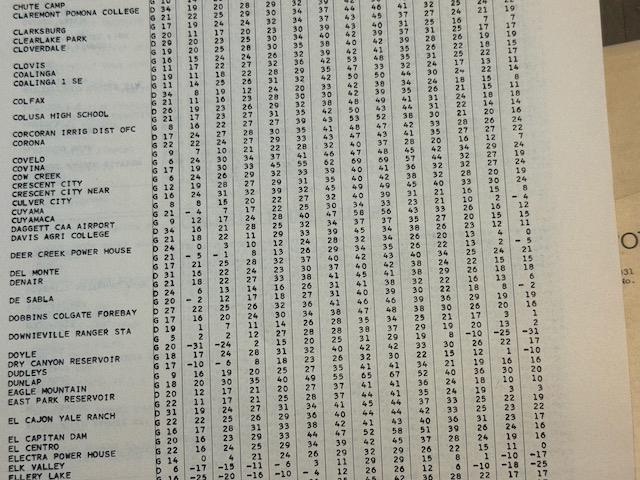
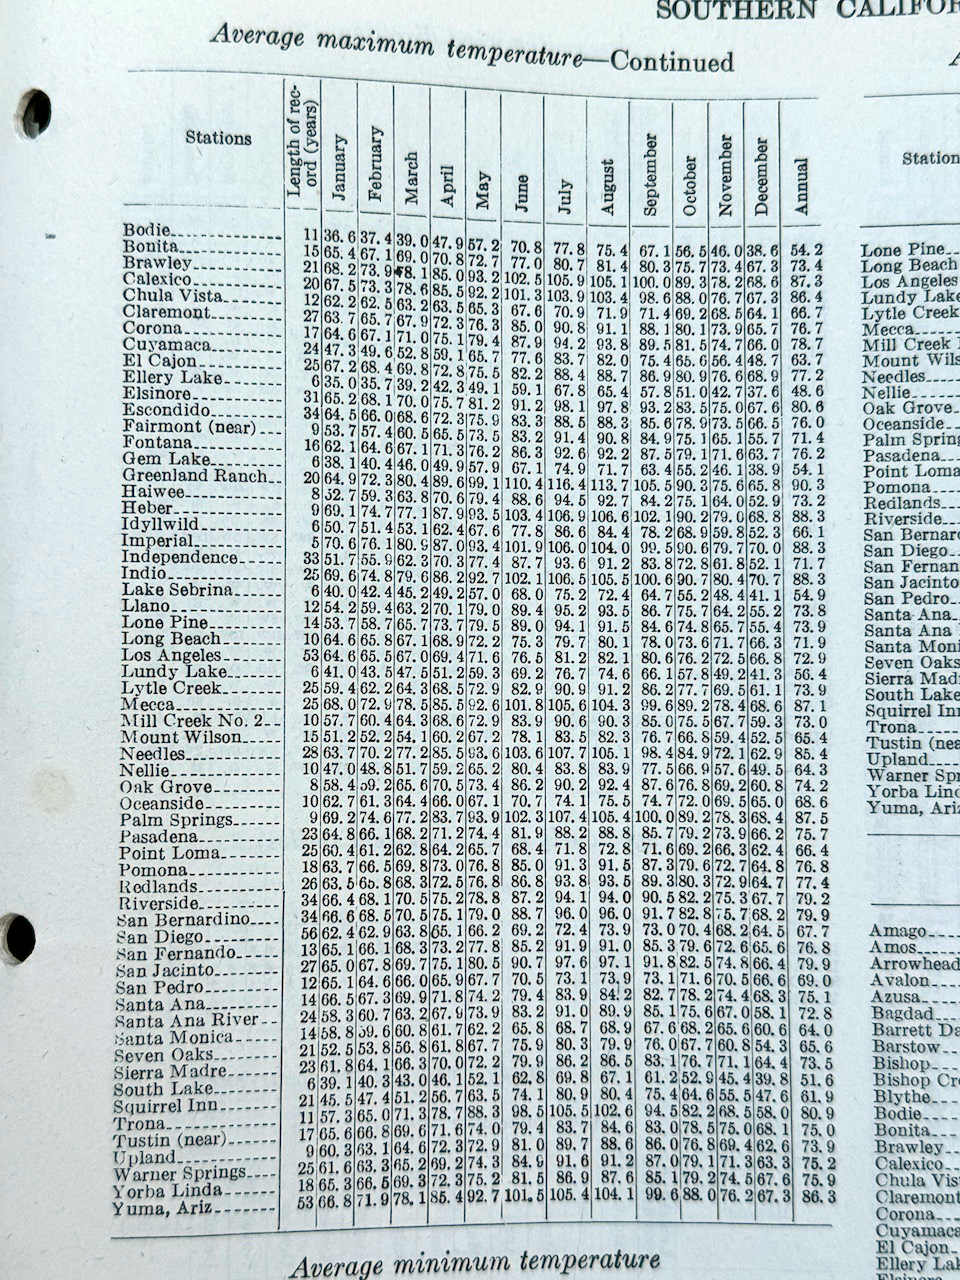
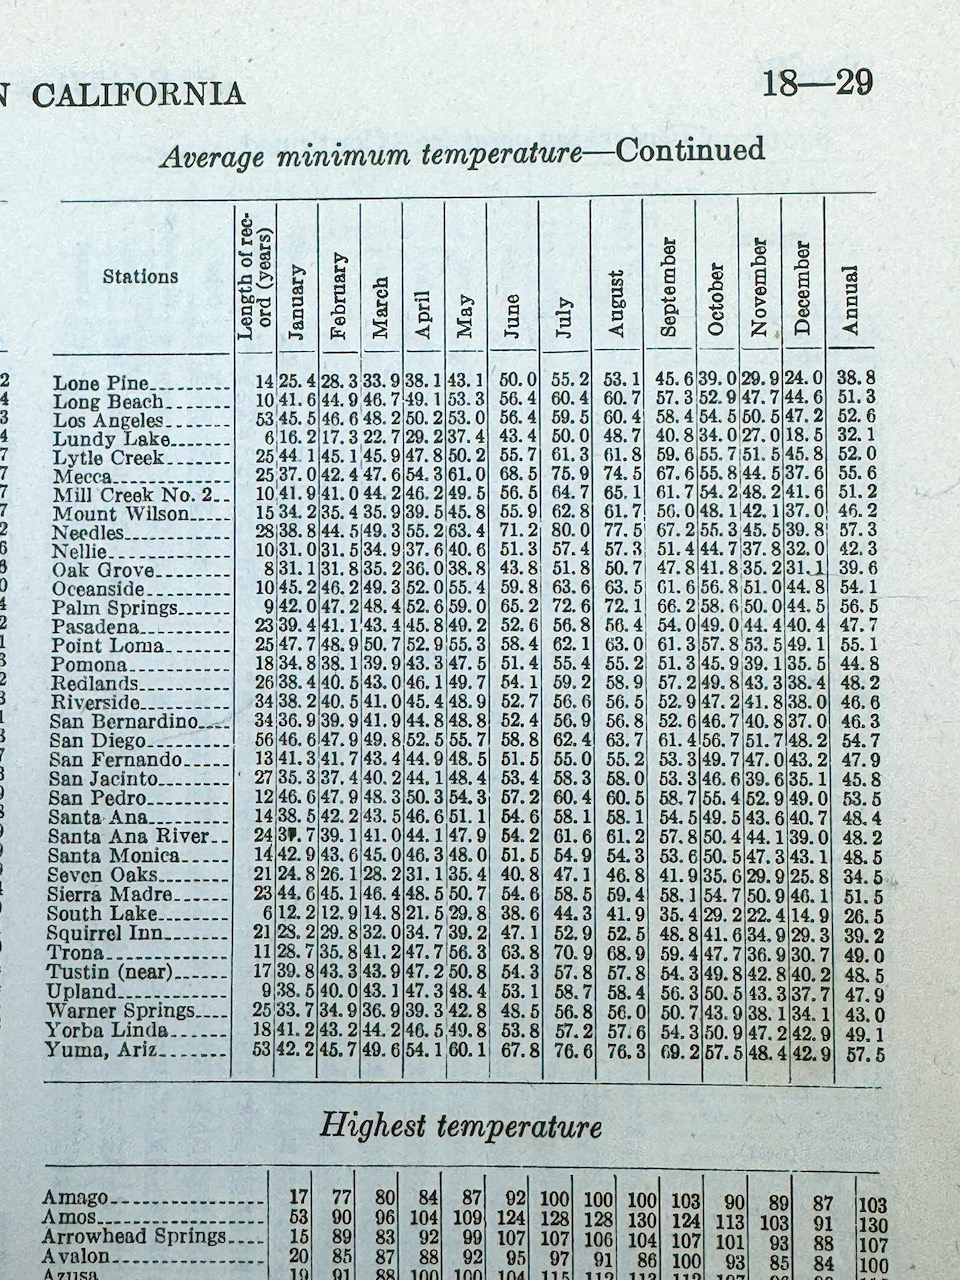
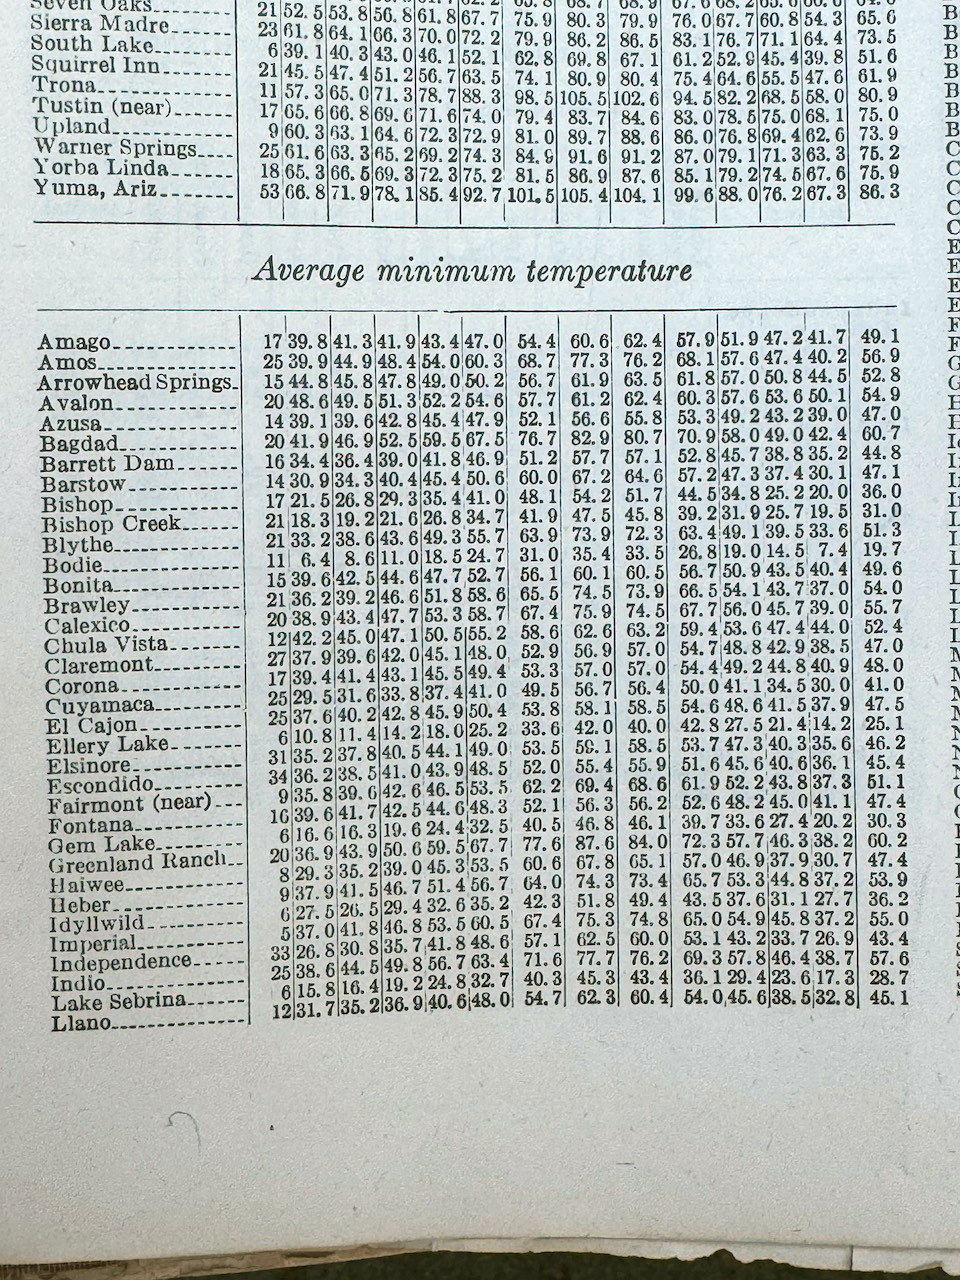
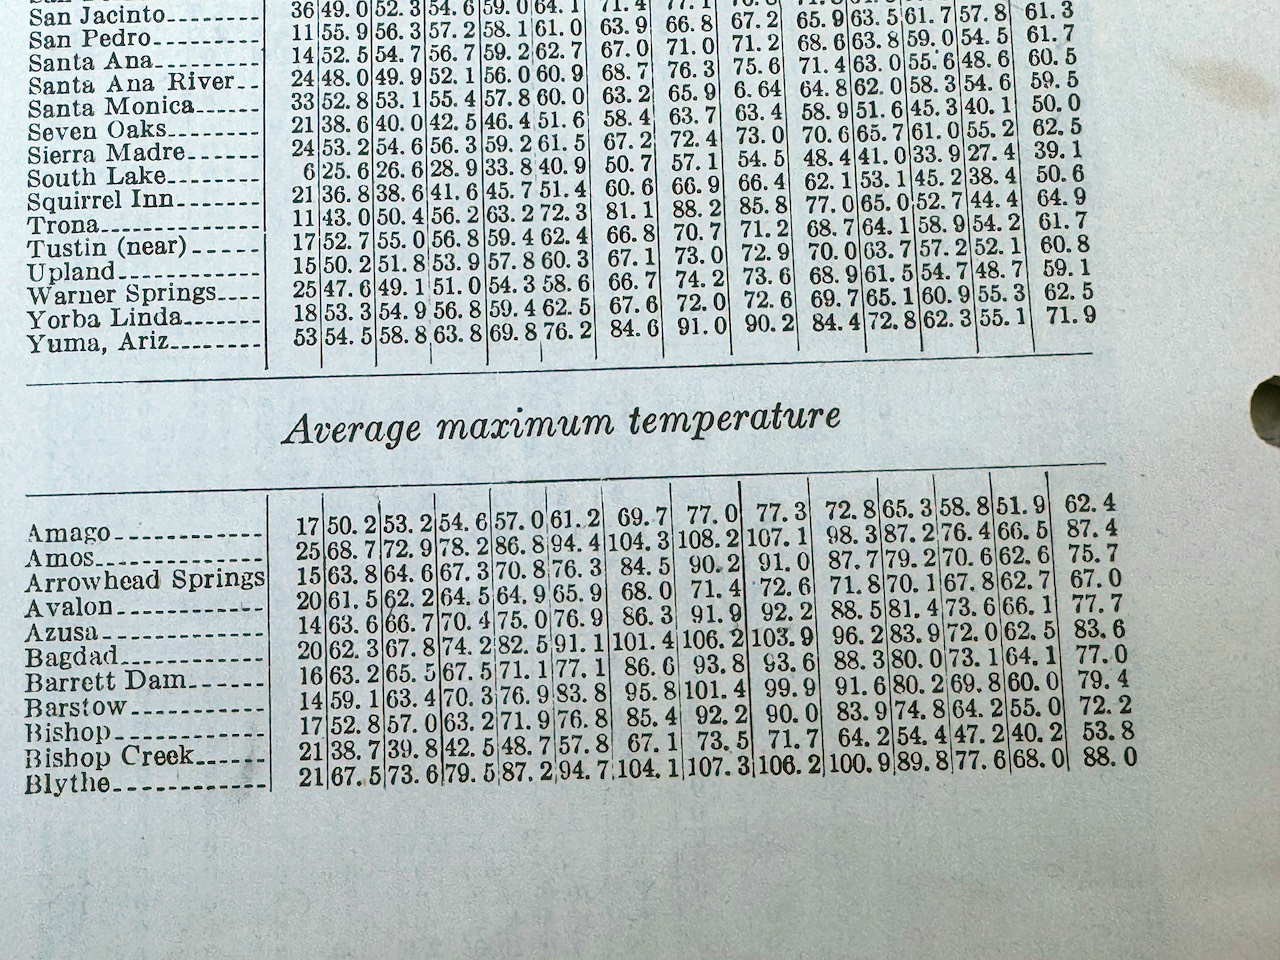
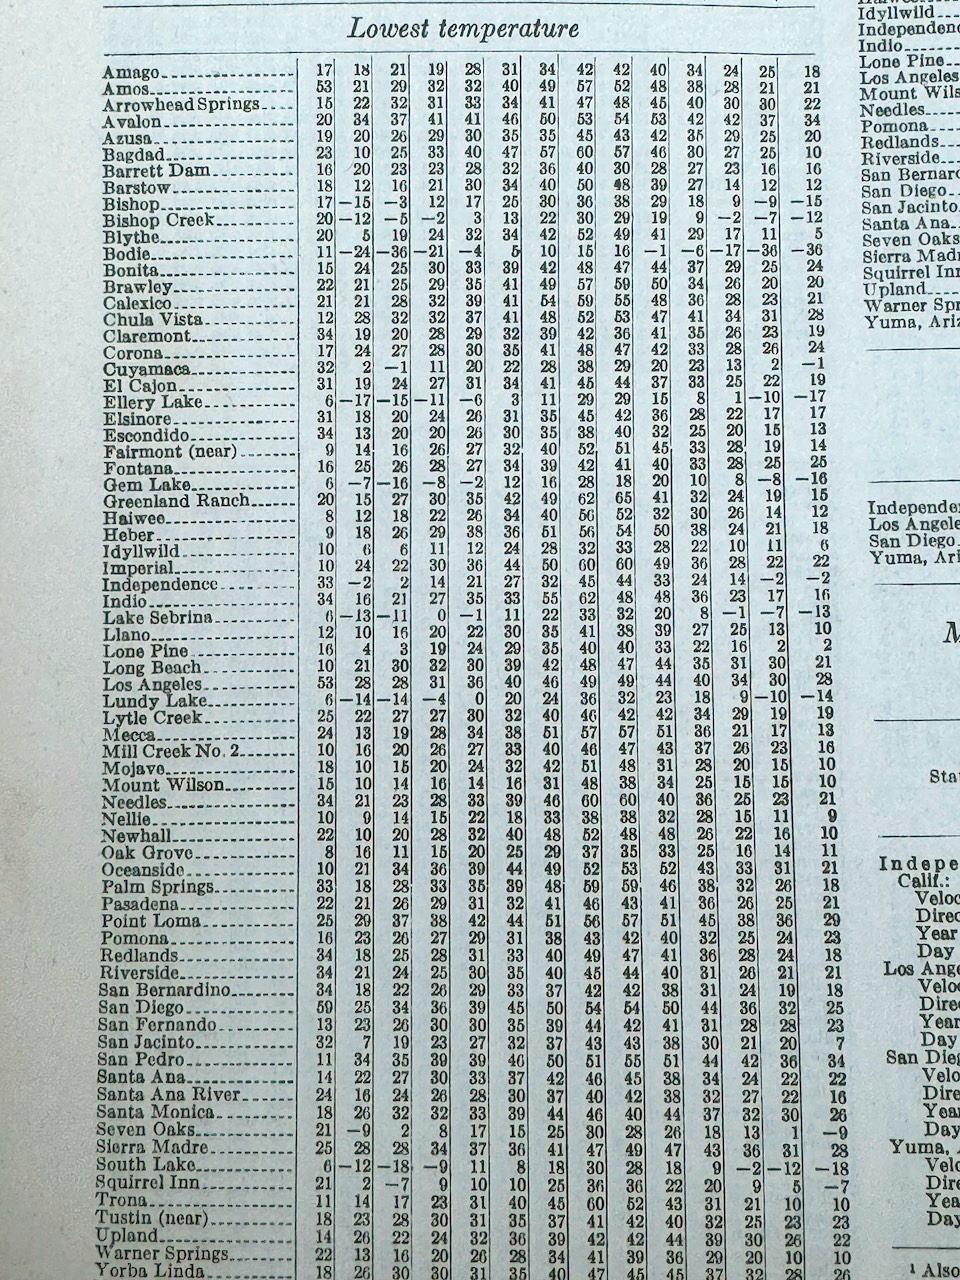
1931-1952/and POR to 1930/averages and extremes/Greenland Ranch and Cow Creek
This publication incorporates data from 1931 through 1952 (in the rows marked “G”) and data prior to 1931 (in the rows marked “D”). Included are the pages which contain Greenland Ranch, which opened in June 1911; and Cow Creek, which opened in 1934.
Average Maximum tables above
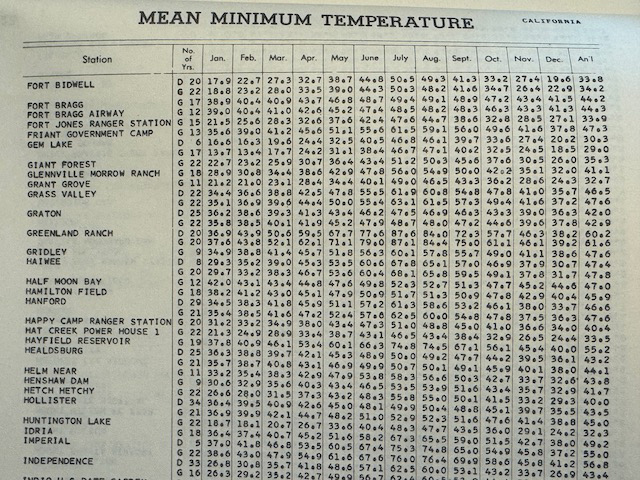
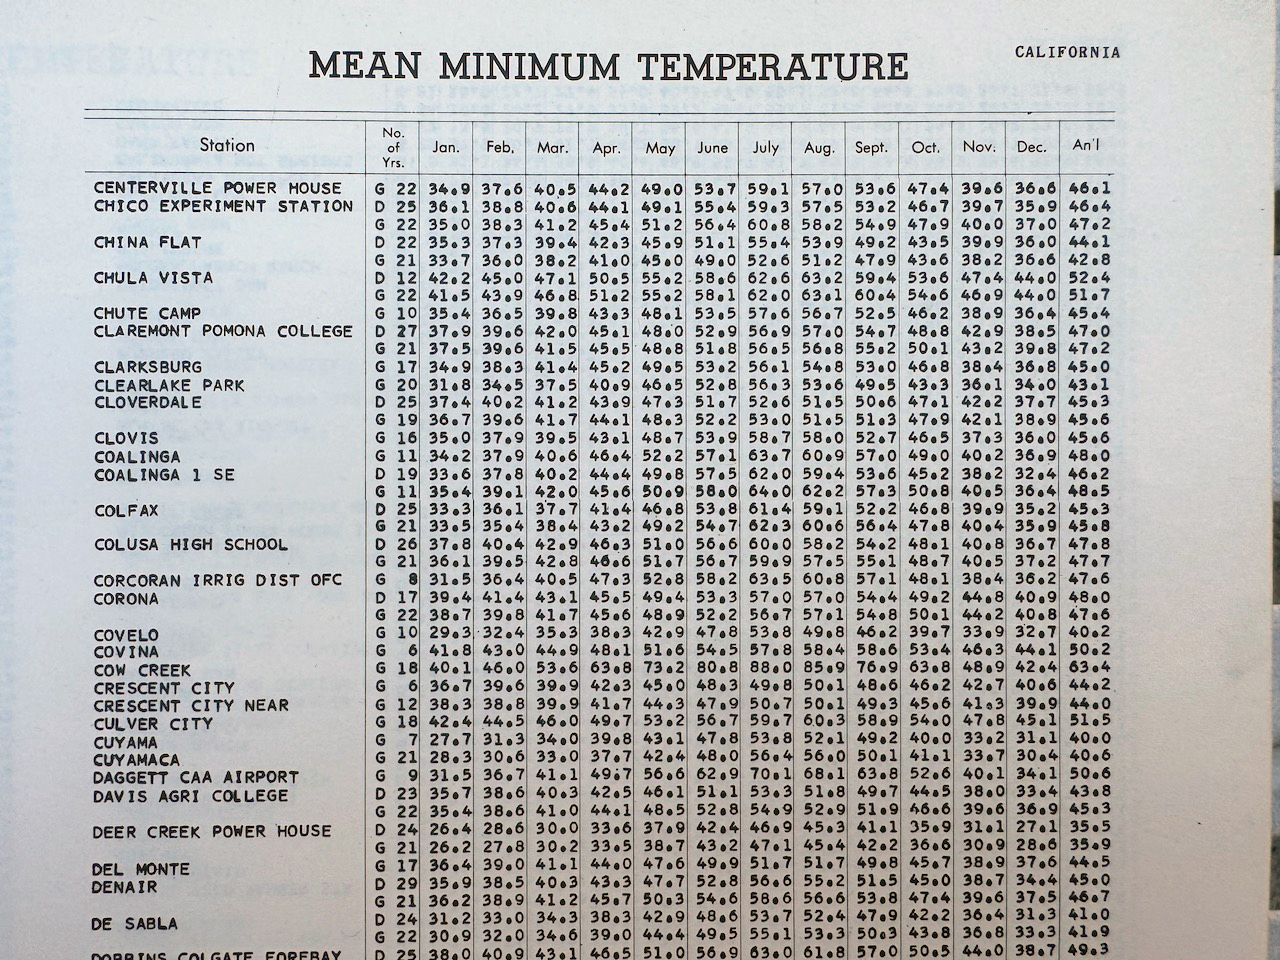
Average Minimum tables above
Mean monthly and monthly extreme temperatures above (1934-1961)
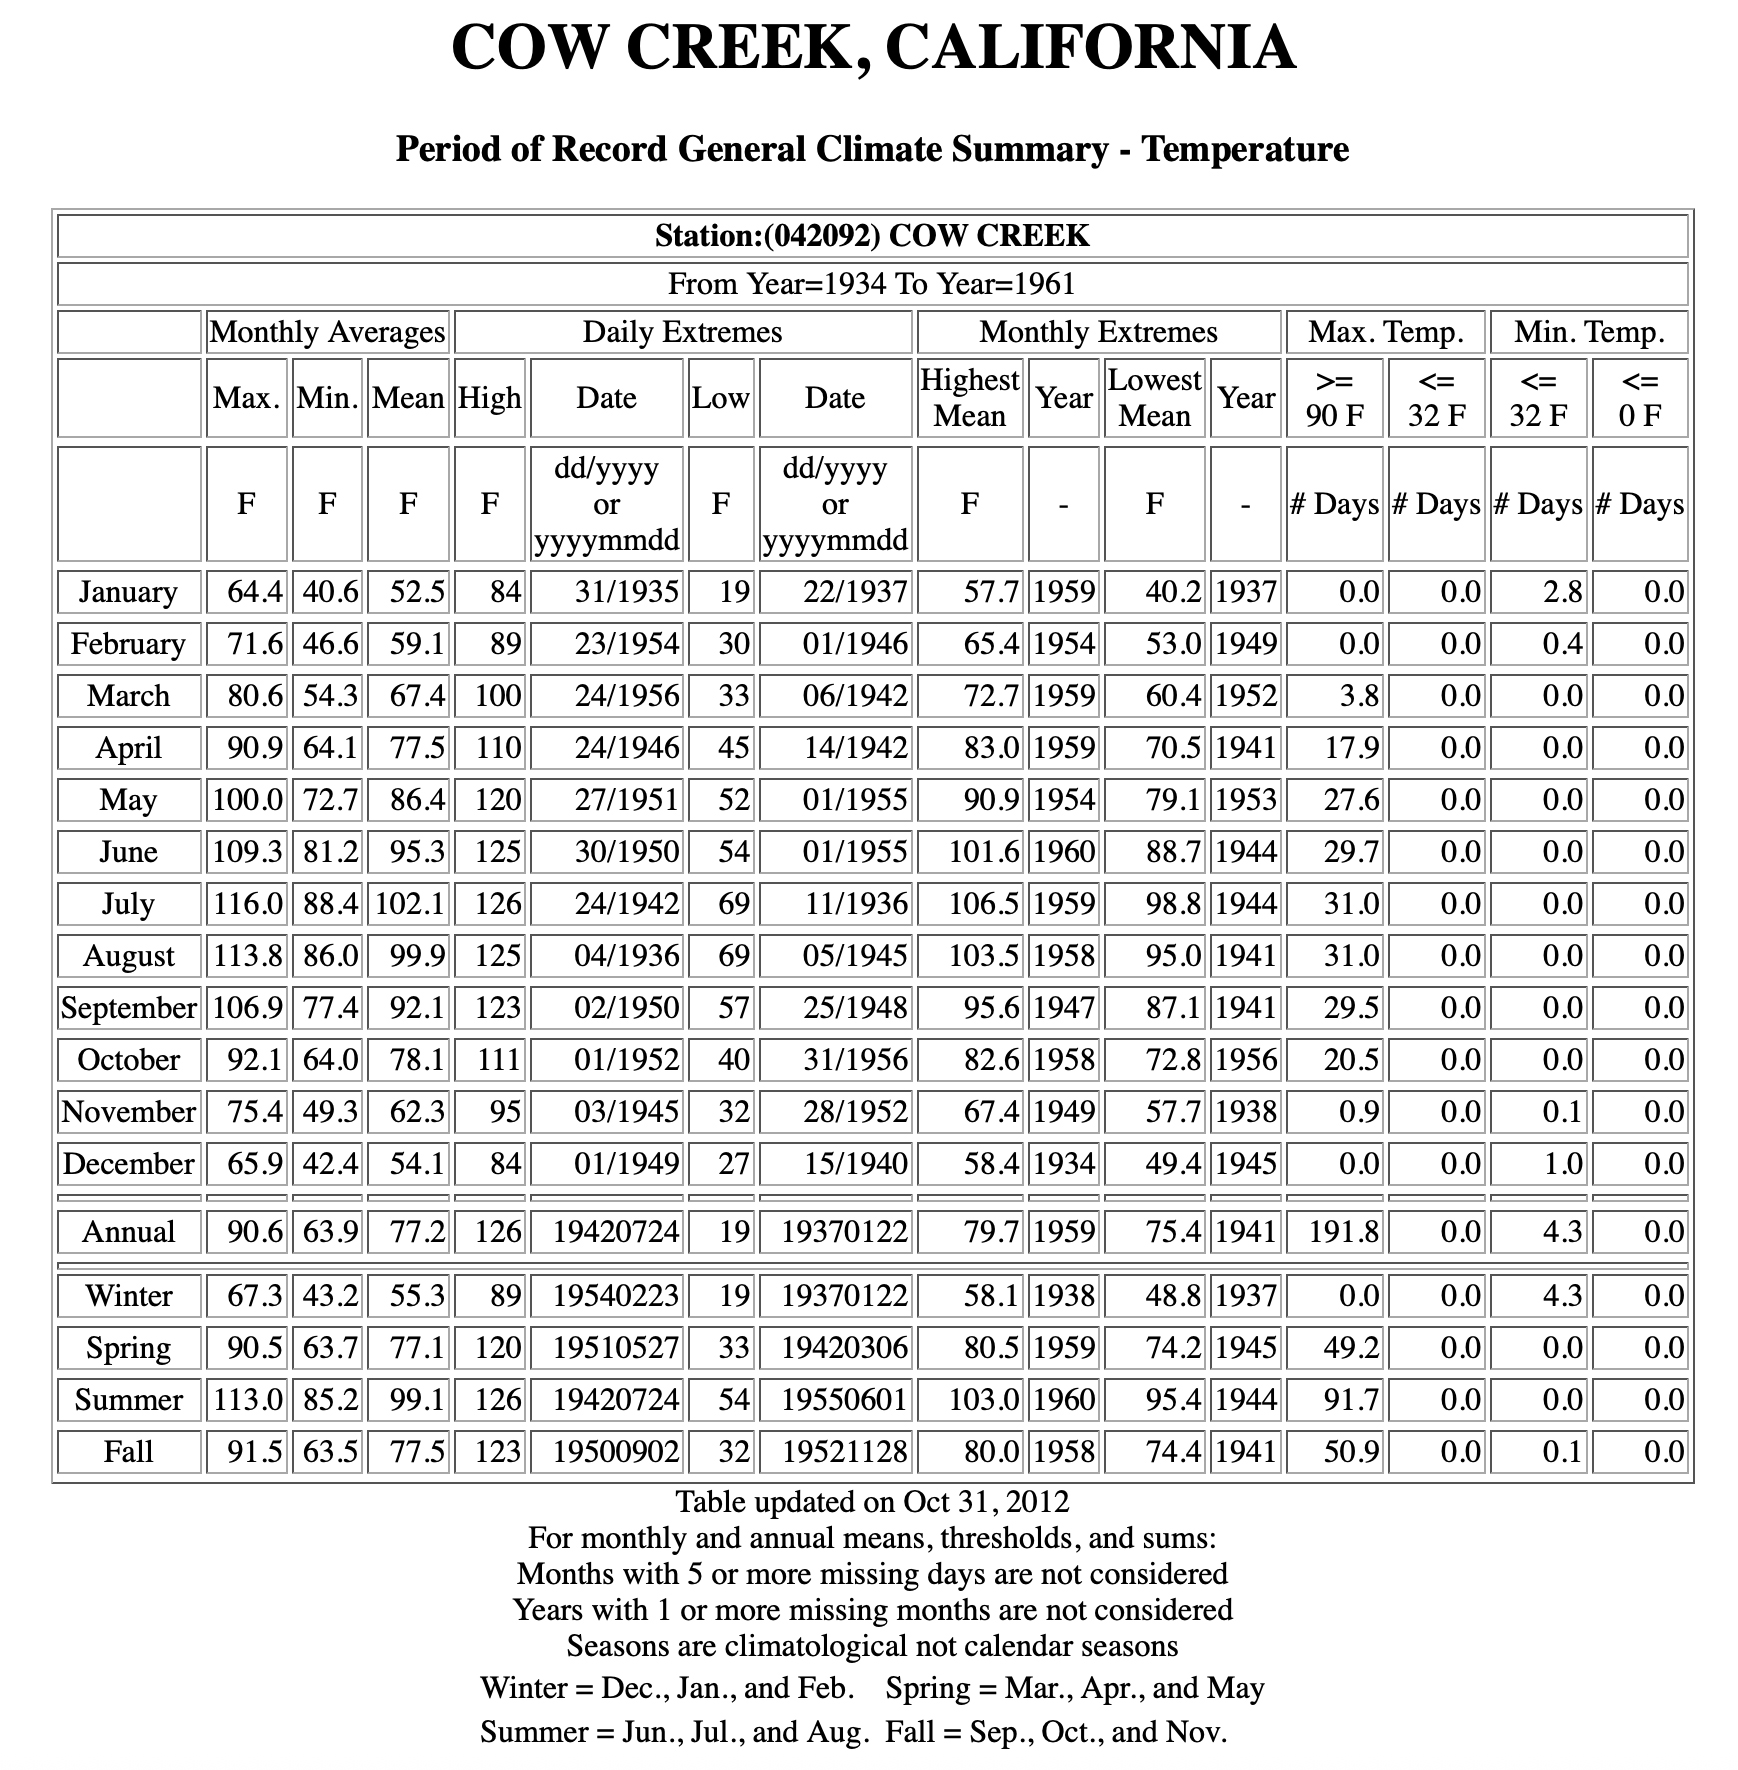
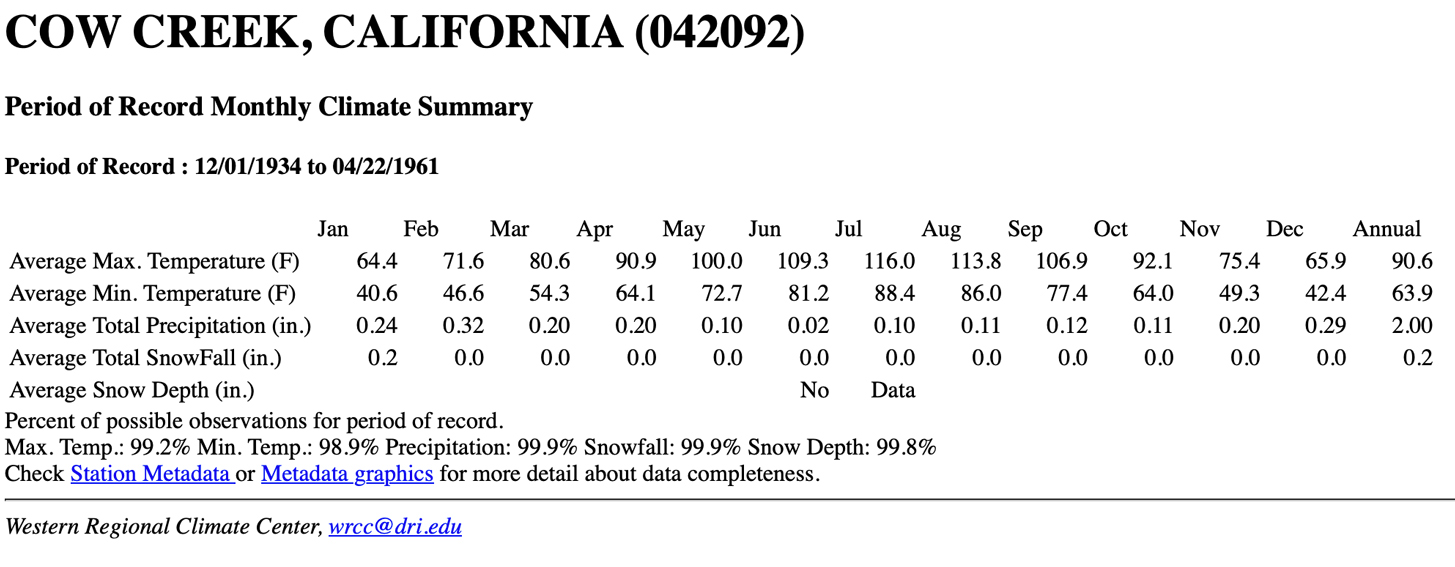
Cow Creek data above, from WRCC
Averages and Extremes thru 1930/Greenland Ranch
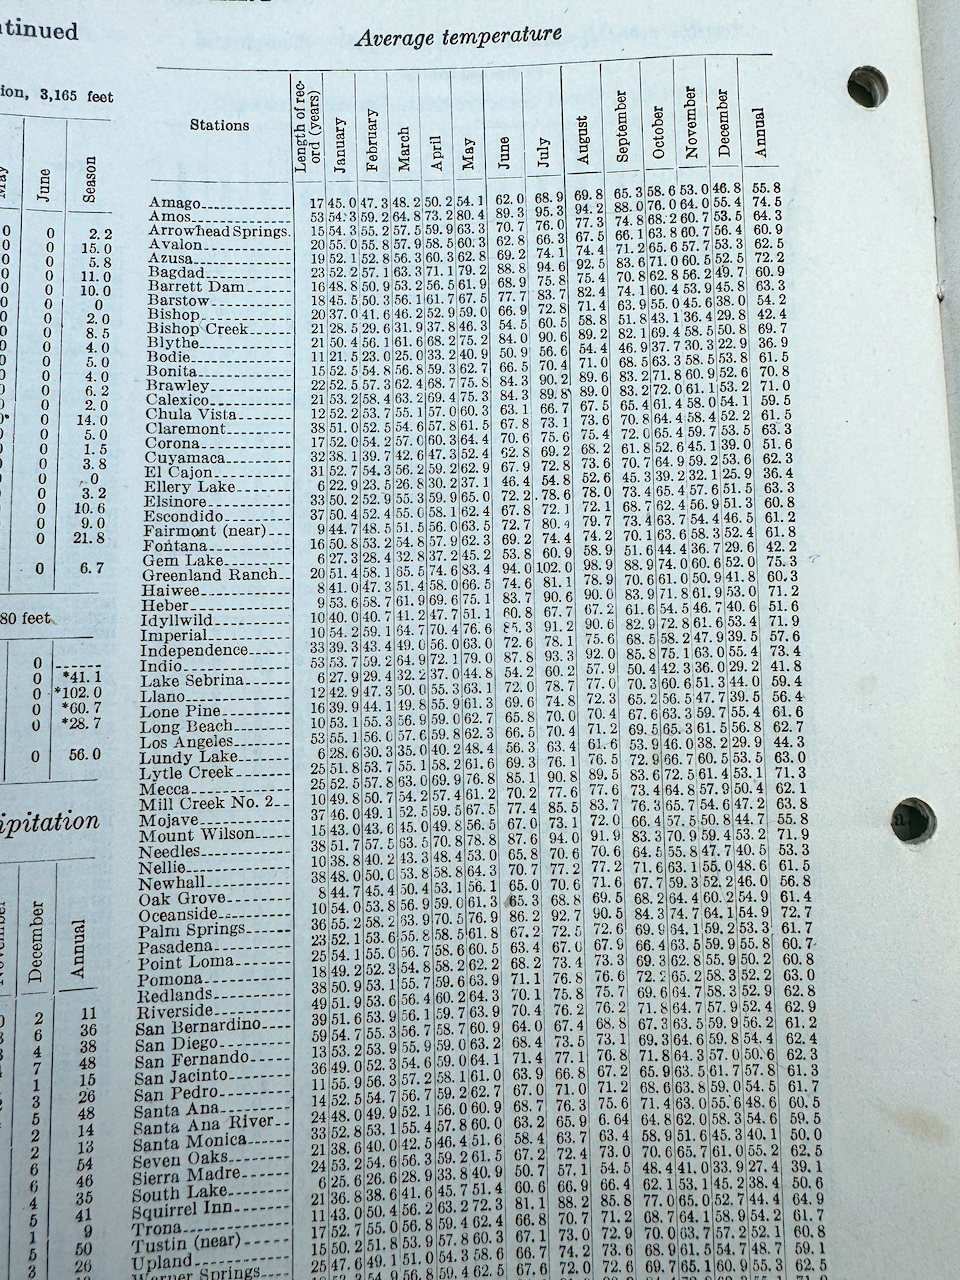
Average Data above
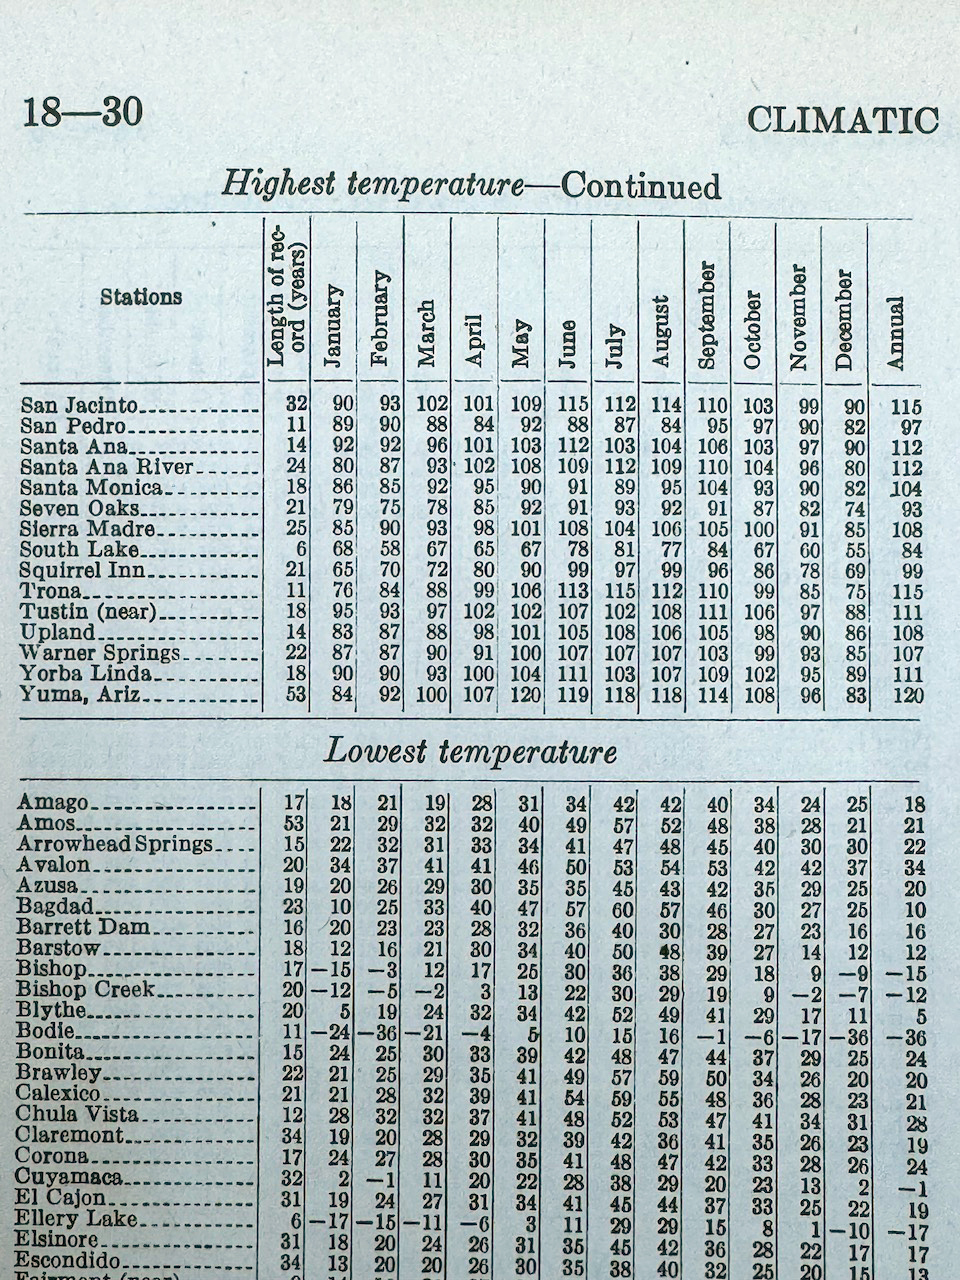
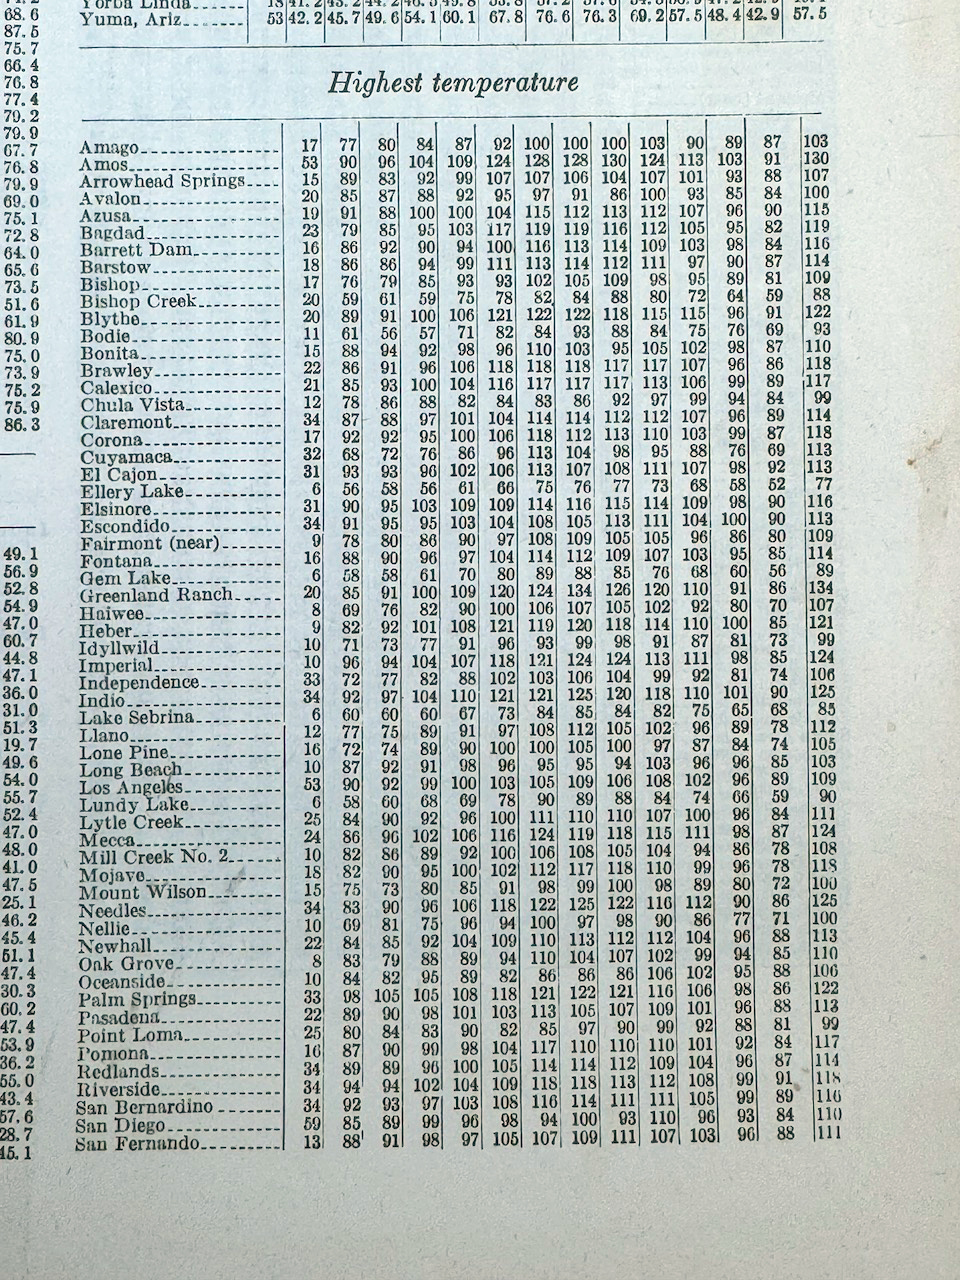
Extreme data above
Leave a Reply
You must be logged in to post a comment.