
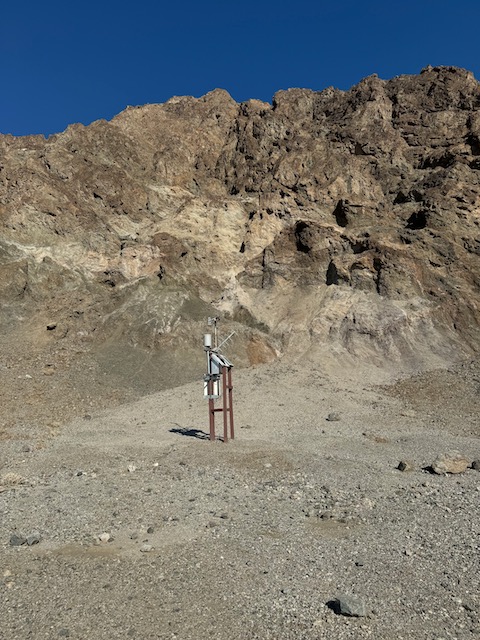
Photo above: The Badwater weather instrumentation in July, 2024. This is where McKay’s NASA station at Badwater was located from 1998 to 2019. The NWS and NPS set up a Campbell Scientific station, same type as that used at Furnace Creek, in the summer of 2021. See the links just below for more info. The exposure here is excellent, with a very steep and barren slope just to the east. View to the east.
Chris McKay of NASA has made available the weather data (updated every 30 minutes) from the automatic station that he established at Badwater in Death Valley in 1998. McKay kept the station going in fine fashion into the summer of 2019. (The NPS/NWS used the same station support post just east of the roadway to resume temperature and humidity measurement in late summer 2021, with the same type of Campbell Scientific temperature instrumentation that is in place at the official Death Valley station in Furnace Creek.) The world now has access to 20 years of high-quality temperature data at what might be the hottest summer spot on the planet. I will be digging into the Badwater data in future posts here, primarily to see how the numbers compare to the other stations in Death Valley and to try to explain the differences.
I transferred the June, July and August data for Badwater from 1998 to 2019 into spreadsheet software. (The summer data for 2019 are very limited and I did not incorporate any of the 2019 data into the averages and extremes.) These were saved as PDF files for viewing here. Below are the individual pdf files, by month, with 48 observations for each date. The link right here
provides the station documentation. (There is a second nearby McKay/NASA station at Badwater, up on top of the outhouse. I have not looked at McKay’s data from the outhouse yet, as of September 2025). I would suggest looking through the documentation notes (linked above) before checking out these data files.
(Note: for at least parts of 2001, 2005 and 2010 the calibrated average RAW RTD temperatures are in a different column compared to the other years. The headers for such columns are accurate.)
Here are the main things to know:
McKay collected two sets of temperature data at the primary Badwater station. The “RTD” temperature data were from a high-tech sensor in an aspirated shield that was 1.5 meters (about 5 feet) above the ground. The “207” sensors, for temperature and humidity, were in a passive (i.e., non-aspirated) radiation shield 3.0 meters (about 10 feet) above the ground. Spoiler Alert: even though the 207 sensors were twice as high above the ground, its midday temperature measurements in summer were typically a degree or two (F) hotter than those off of the RTD. This is because the RTD shield was aspirated and the 207 shield was not.
McKay found that the RTD temperature values required a small calibration, so you will see that the Badwater data files provide a “raw” and a “calibrated” average RTD temperature (in Celsius) for each 30-minute report. The 30-minute averages are based on thirty one-minute measurements. The files also provide the maximum temperature readings (and time of day) during each 30-minute timeframe. The maximum temperature values for the RTD instrumentation, which is considered to give the most-reliable and trustworthy measurements, were NOT calibrated. For a calibrated maximum temperature, McKay suggests determining the difference between the raw and calibrated values for the same timeframe, and adding that amount to the associated “maximum” temperature. Fortunately, this calibration adjustment is fairly small. At temperatures near 50C/122F, the error is around 0.15C, or about 0.25F. Given that temperature measurement in the bright sunshine of a Death Valley afternoon typically results in (at least somewhat) inflated readings in radiation shields, I would not sweat adding the 0.15C calibration adjustment for such high temperatures off of the RTD.
The monthly spreadsheet tables below include additional columns that I have added. The first four (following the McKay data) are temperatures converted from C to F for the RTD average and maximum and for the 207 maximum and average (in that order). The minimum temperature for each 30-minute timeframe is not in the Badwater files. For the daily minimum temperature I had to use the lowest of the 48 calibrated 30-minute average RTD values for the day. On most summer days, the lowest of these average values is likely just a degree or so (F) higher than the actual daily minimum. (It is entirely possible that some days might have had REAL minimums that were 2-3 degrees F lower than the lowest of these 30-minute average values, but we will never know.) Three of my additional columns show differences between the RTD and 207 maximums, and differences between the average and maximum for each sensor. Any spurious values in these columns might indicate a data problem or a significant intra-hourly weather change.
McKay’s tables include barometric pressure measurements. These are in whole millibar pressure units (yes, I am old school), and the values are not adjusted to sea level for this below sea level station (-74 meters/-243 feet). Thus, the raw pressure measurements shown are about 8 millibars higher than a corresponding SLP (sea level pressure) reading would be. The pressure data quit around 2014.
The first link below is a compilation of the monthly data for Badwater for JJA. I will chat in more detail about the findings in this data set in another Stormbruiser entry.
And you are in luck — here are the 21-year average and extreme temperature data for JJA for McKay’s Badwater station, 1998 to 2018, RTD sensor only:
AvMx/AvMn/Ave High Max/Low Min Low Max/High Min GDR/SDR mins 100+/max 120+
June 112.1/85.6/98.8 128.0/58.9 81.7/104.2 39/13 0.3/4.7
July 117.6/93.3/105.4 128.1/76.9 96.5/105.9 38/9 4.0/11.6
Aug 115.0/90.9/102.9 124.6/72.1 95.6/105.9 37/8 1.1/4.5
Remember, the actual average and extreme daily minimums are likely about one degree F lower, as all of the daily minimum temperature data from this Badwater station are based on 30-minute average temperature values (and not on the lowest one-minute measurements). The first three values are the average daily maximum and average daily minimum, and the average of these two values. Next two values are the highest one-minute maximum and lowest 30-minute minimum, followed by the lowest maximum and the highest minimum for the 21 year timeframe. GDR and SDR stand for greatest daily temperature range and smallest daily temperature range. The final two values are average number of days with a minimum of 100F or greater, and average number of days with a maximum of 120F or greater.
Note that the hottest RTD temperature above is 128.1F. McKay’s paper indicates that the highest measurement for the 21 summers was 53.89C/129.0F on July 5, 2007. But on that date the data files show a max of 53.4C/128.1F for the RTD sensor and a 53.89C/129.0F for the 207 sensor. McKay may have inadvertently switched the two for his write-up.
1998
1999
2000
Aug 30 and 31 of 2000 are missing most hourly data.
2001
2002
2003
2004
2005
2006
2007
2008
2009
2010
2011
2012
2013
2014
2015
2016
2017
2018
2019
Very limited data for the summer of 2019
Leave a Reply
You must be logged in to post a comment.