
This write-up was uploaded to my web site on October 9, 2025 (and was updated on November 14, 2025, in the Stovepipe Wells section).
A professional article is in the works (by myself, Dr. Roy Spencer and Dr. John Christy) which discredits the maximum temperature reports from Greenland Ranch in Death Valley in July, 1913. (And here is that article!) This includes the famous 134F temperature observation of July 10, 1913. Currently the 134F report is officially recognized as the record highest temperature for the United States and the world. See this link and this link to the World Meteorological Organization (WMO) web site for additional information.
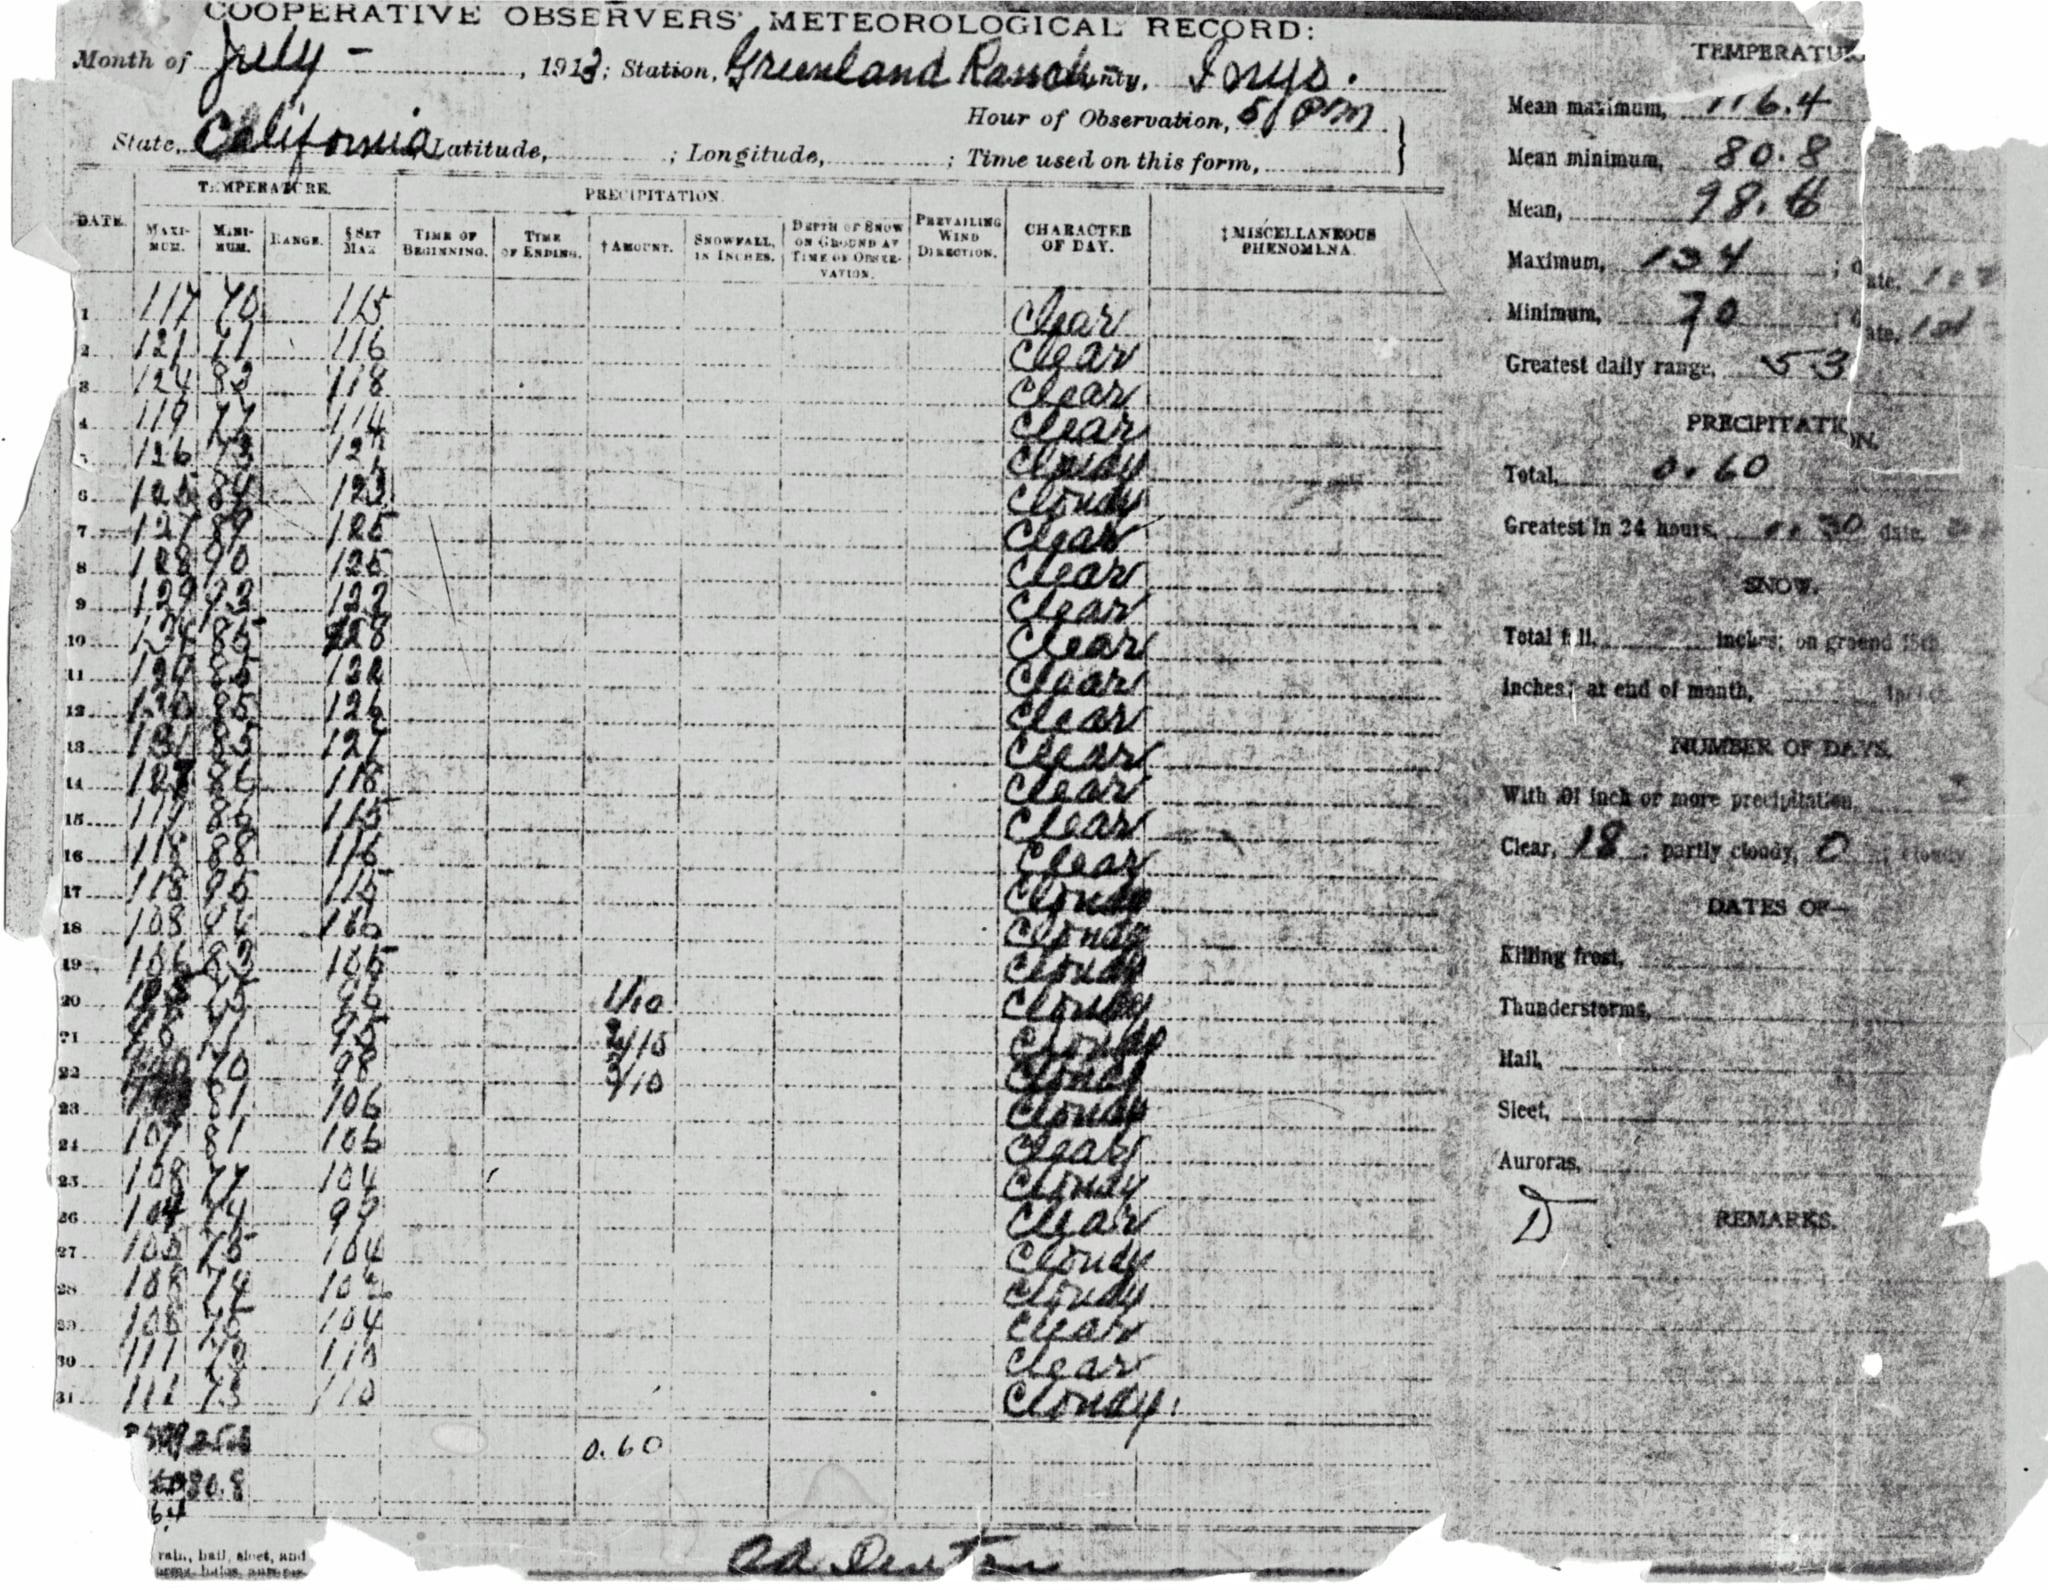
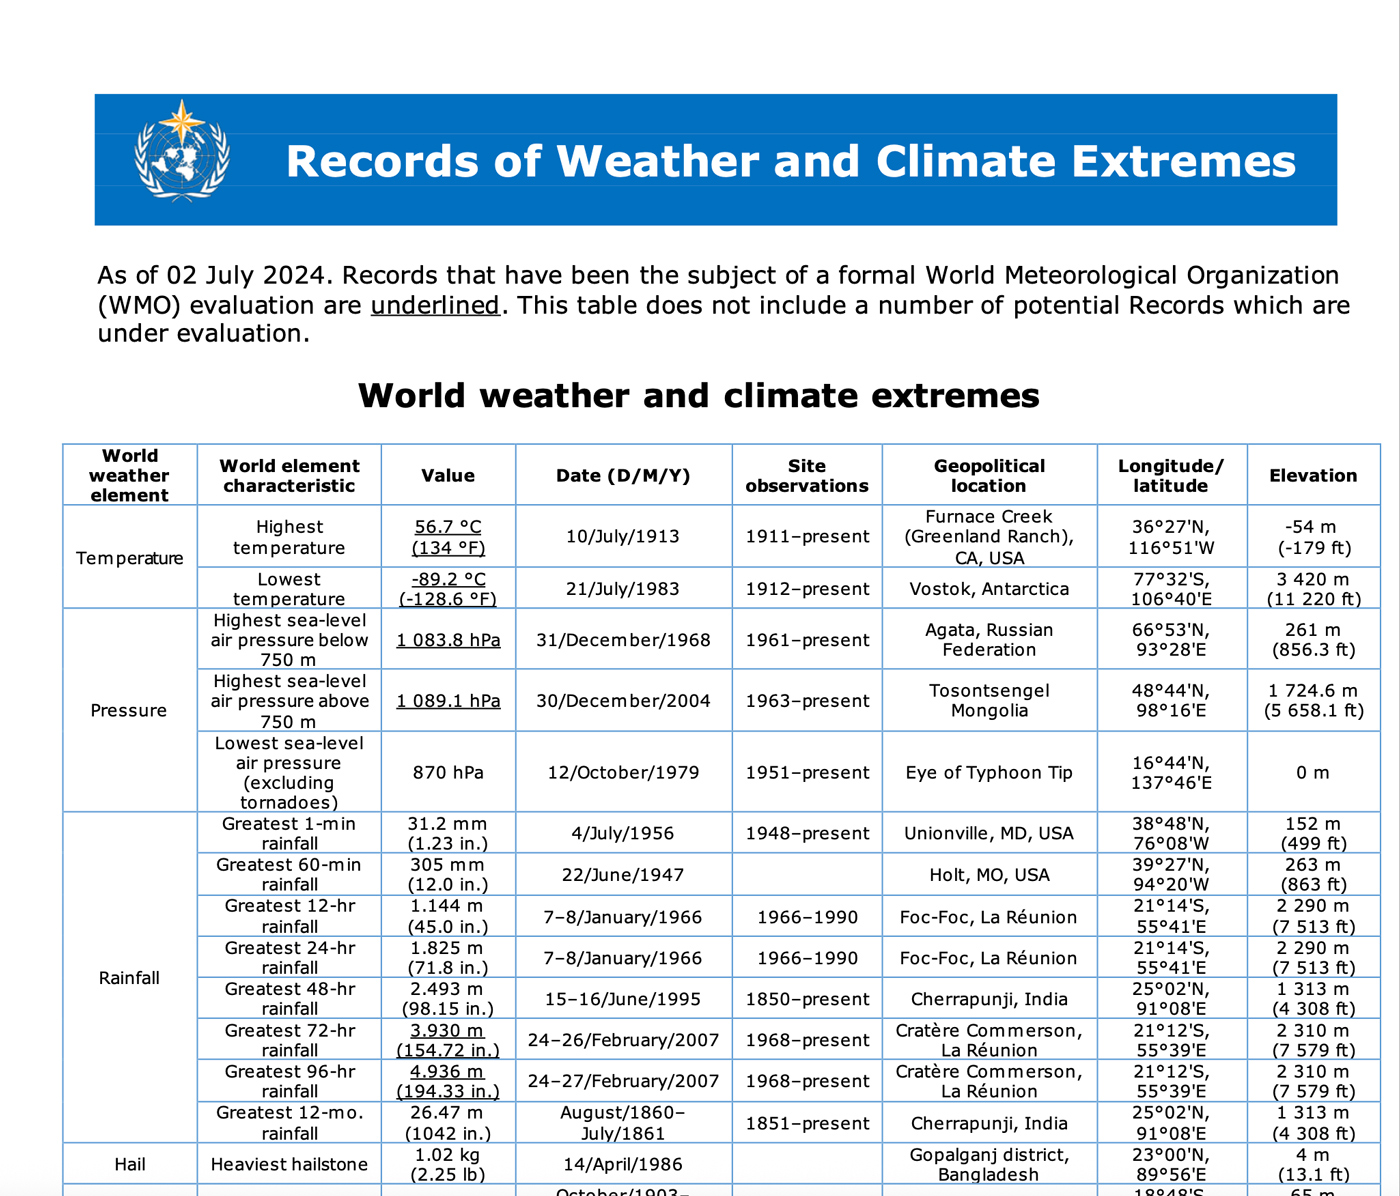
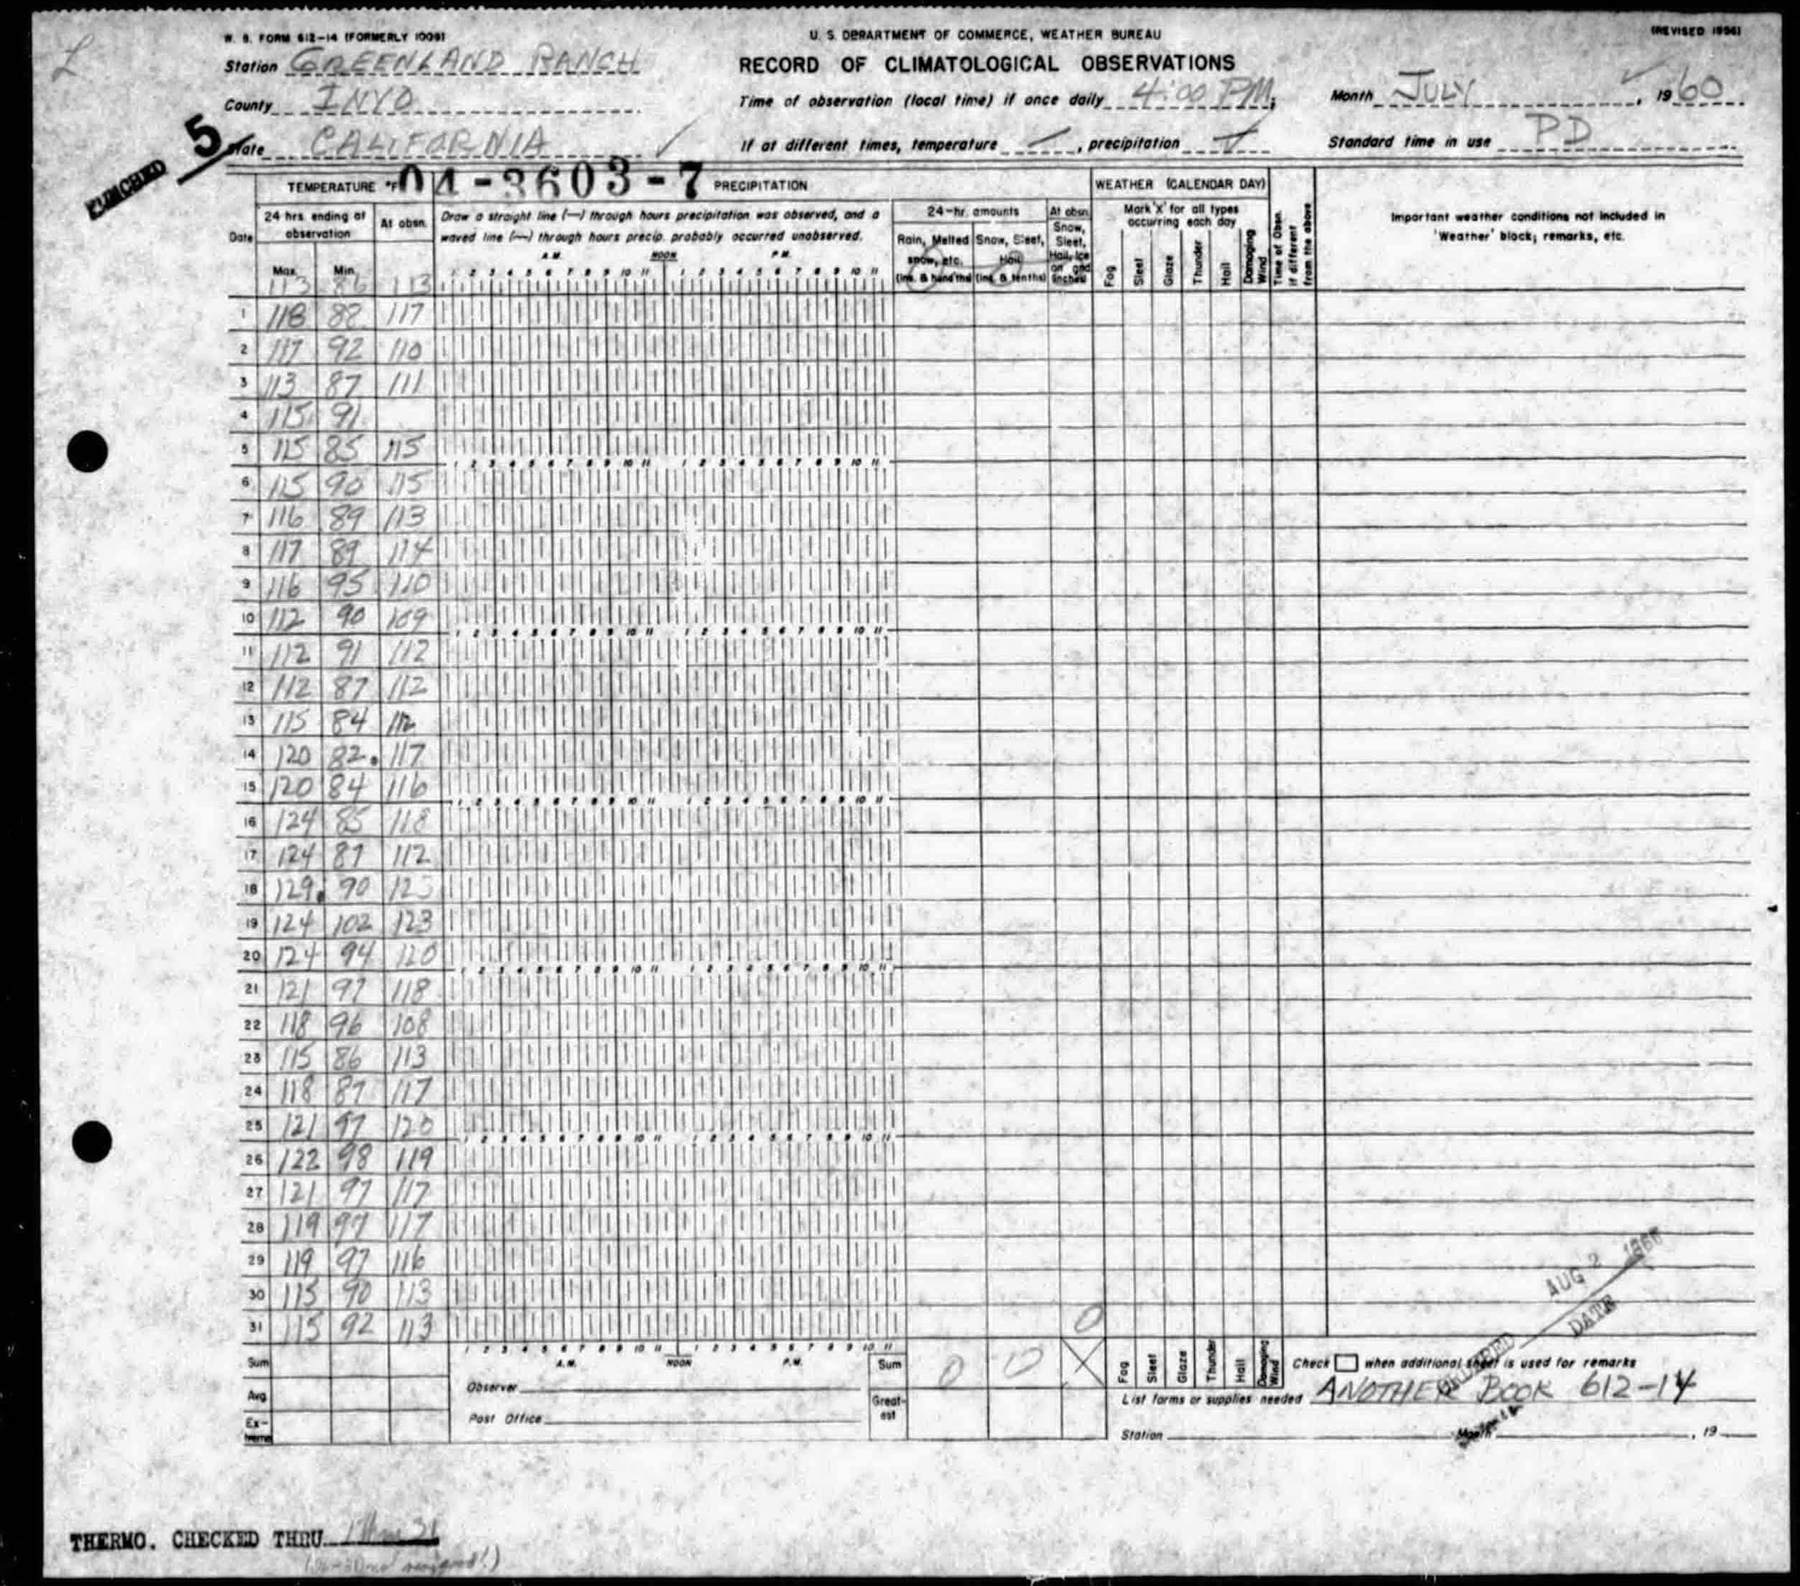
Above, on the left, is the carbon copy of the original climate form from Greenland Ranch for July, 1913. To its right is a screenshot (as of July 2025) of the WMO’s web site which shows the 134F maximum temperature as the record highest for the world (as of the summer of 2025).
Since I expect Death Valley’s 134F to be relegated to the world history trash bin (right next to Libya’s 136F), I figured that now might be a good time to look at other really hot temperatures reports in Death Valley (and maybe at other hot places in the Desert Southwest), and to shed light onto the most-likely candidates for the forthcoming, new and updated world-record hottest temperature.
If Death Valley’s 134F is officially declared invalid (and takes the other dubious July 1913 maximums with it), and if one is looking to determine which temperature record might be next in line, a good place to start would be the Weather Underground articles by weather historian Christopher Burt. Burt and I collaborated in 2016 to show how Death Valley’s temperature record in July, 1913, appeared to be very problematic, with many maximums (including the 134F) running some 8-10 degrees F warmer than one would expect based on the maximums at the closest surrounding stations during the same timeframe (alternate link to article, with original images and figures). Burt investigated previous worldwide temperature measurements of about 54C/129F and higher in his article of July 22, 2016. About 20 instances of temperature reports of 130F and greater are listed, and Burt found that there was inadequate evidence to support any of these. He concluded that the most reliable hottest temperature measurement for the planet is 129F, attained on five occasions at Death Valley stations, and also at Mitribah, Kuwait, in July of 2016.
The National Park Service/National Weather Service (NPS/NWS) station at Furnace Creek in Death Valley (named “Death Valley”) finally hit 130F in both 2020 and 2021, a few years after Burt’s write-ups for WU.
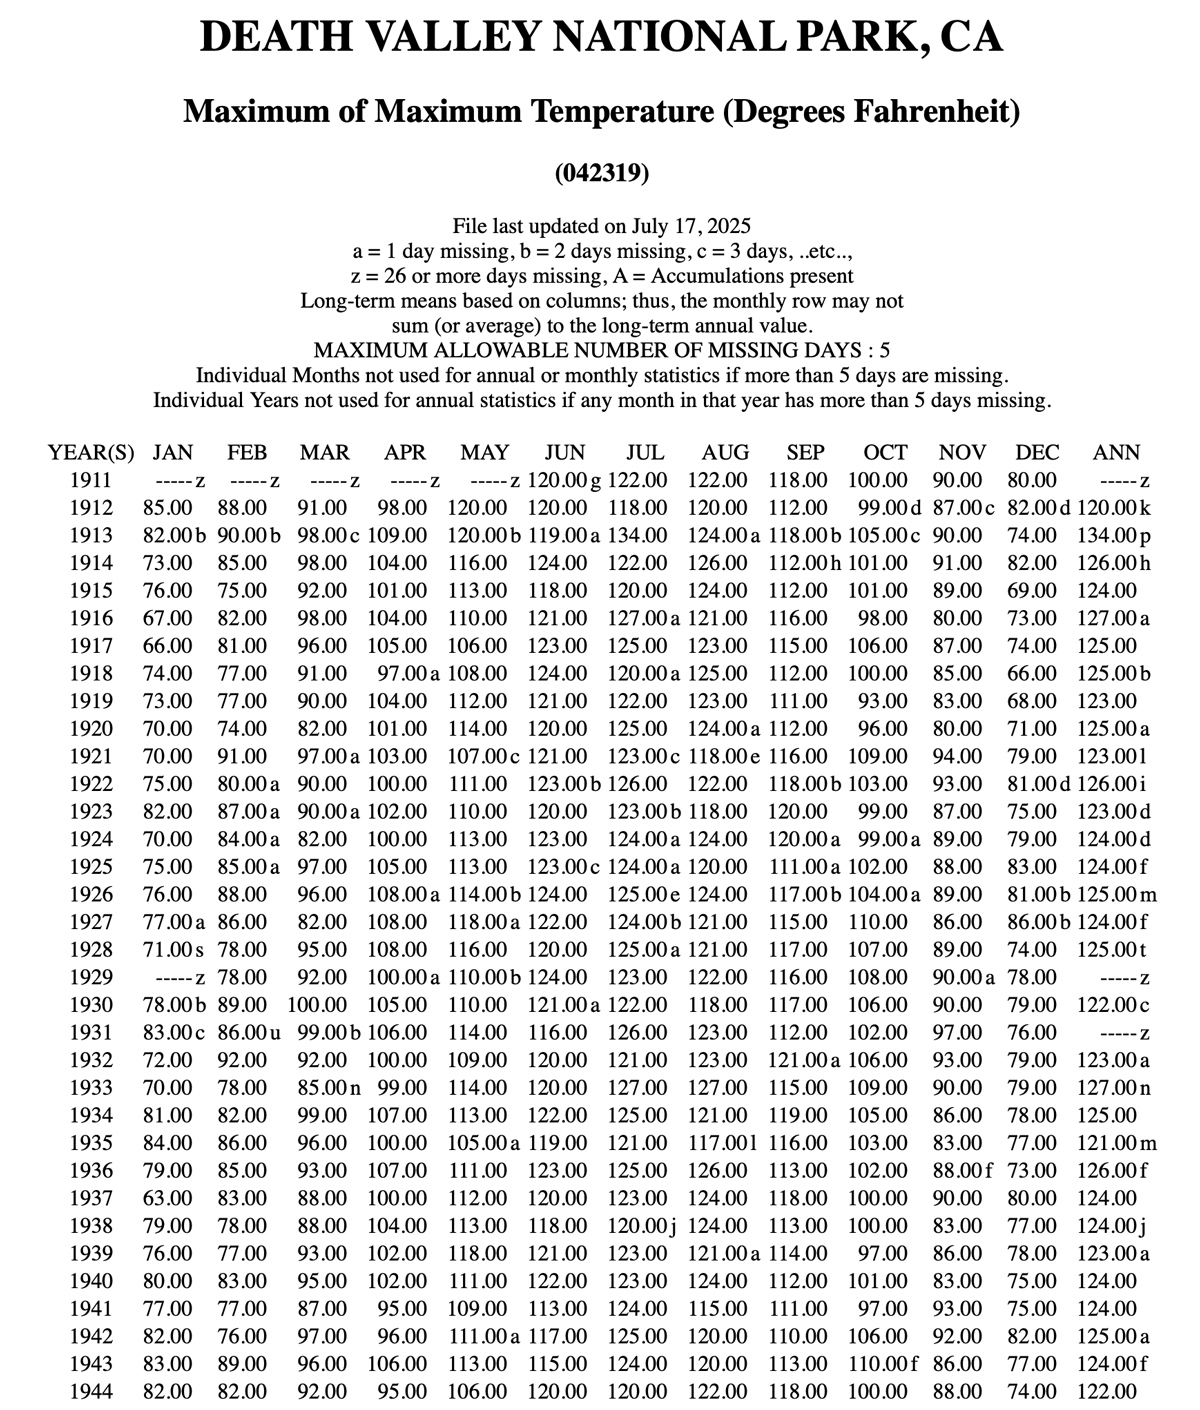
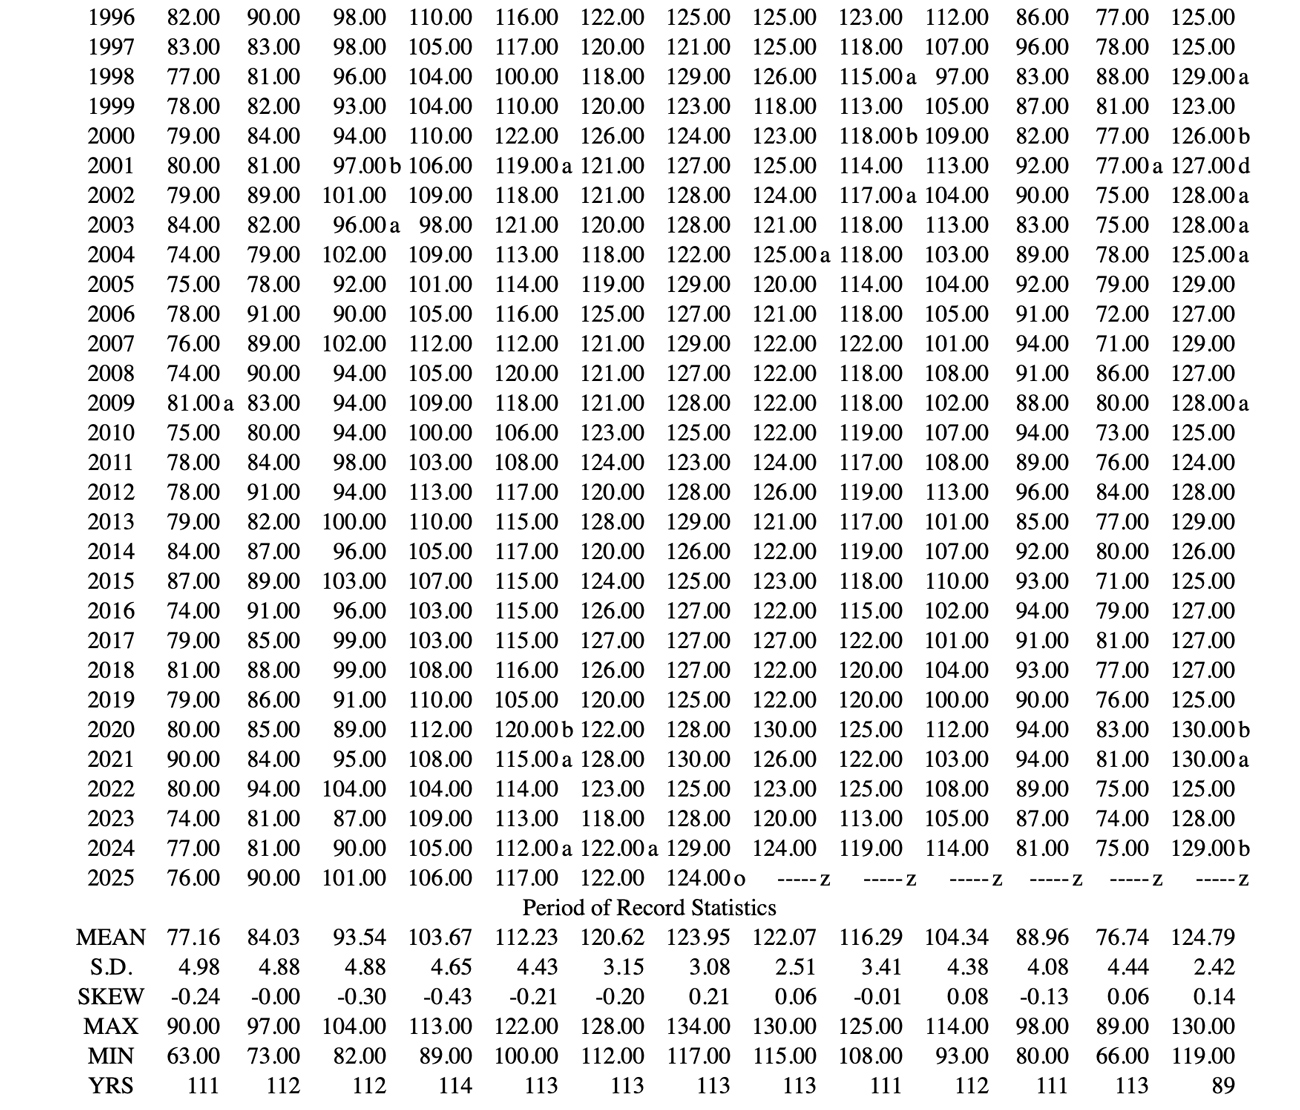
Official, standardized, long-term temperature measurements in Death Valley began at Greenland Ranch in June, 1911. One hundred and fifteen years of record are in the books. The Death Valley page on the Western Region Climate Center web site provides the monthly and annual maximums at Greenland Ranch (1911-1961) and Death Valley (1961-present). Below are screenshots of these data.
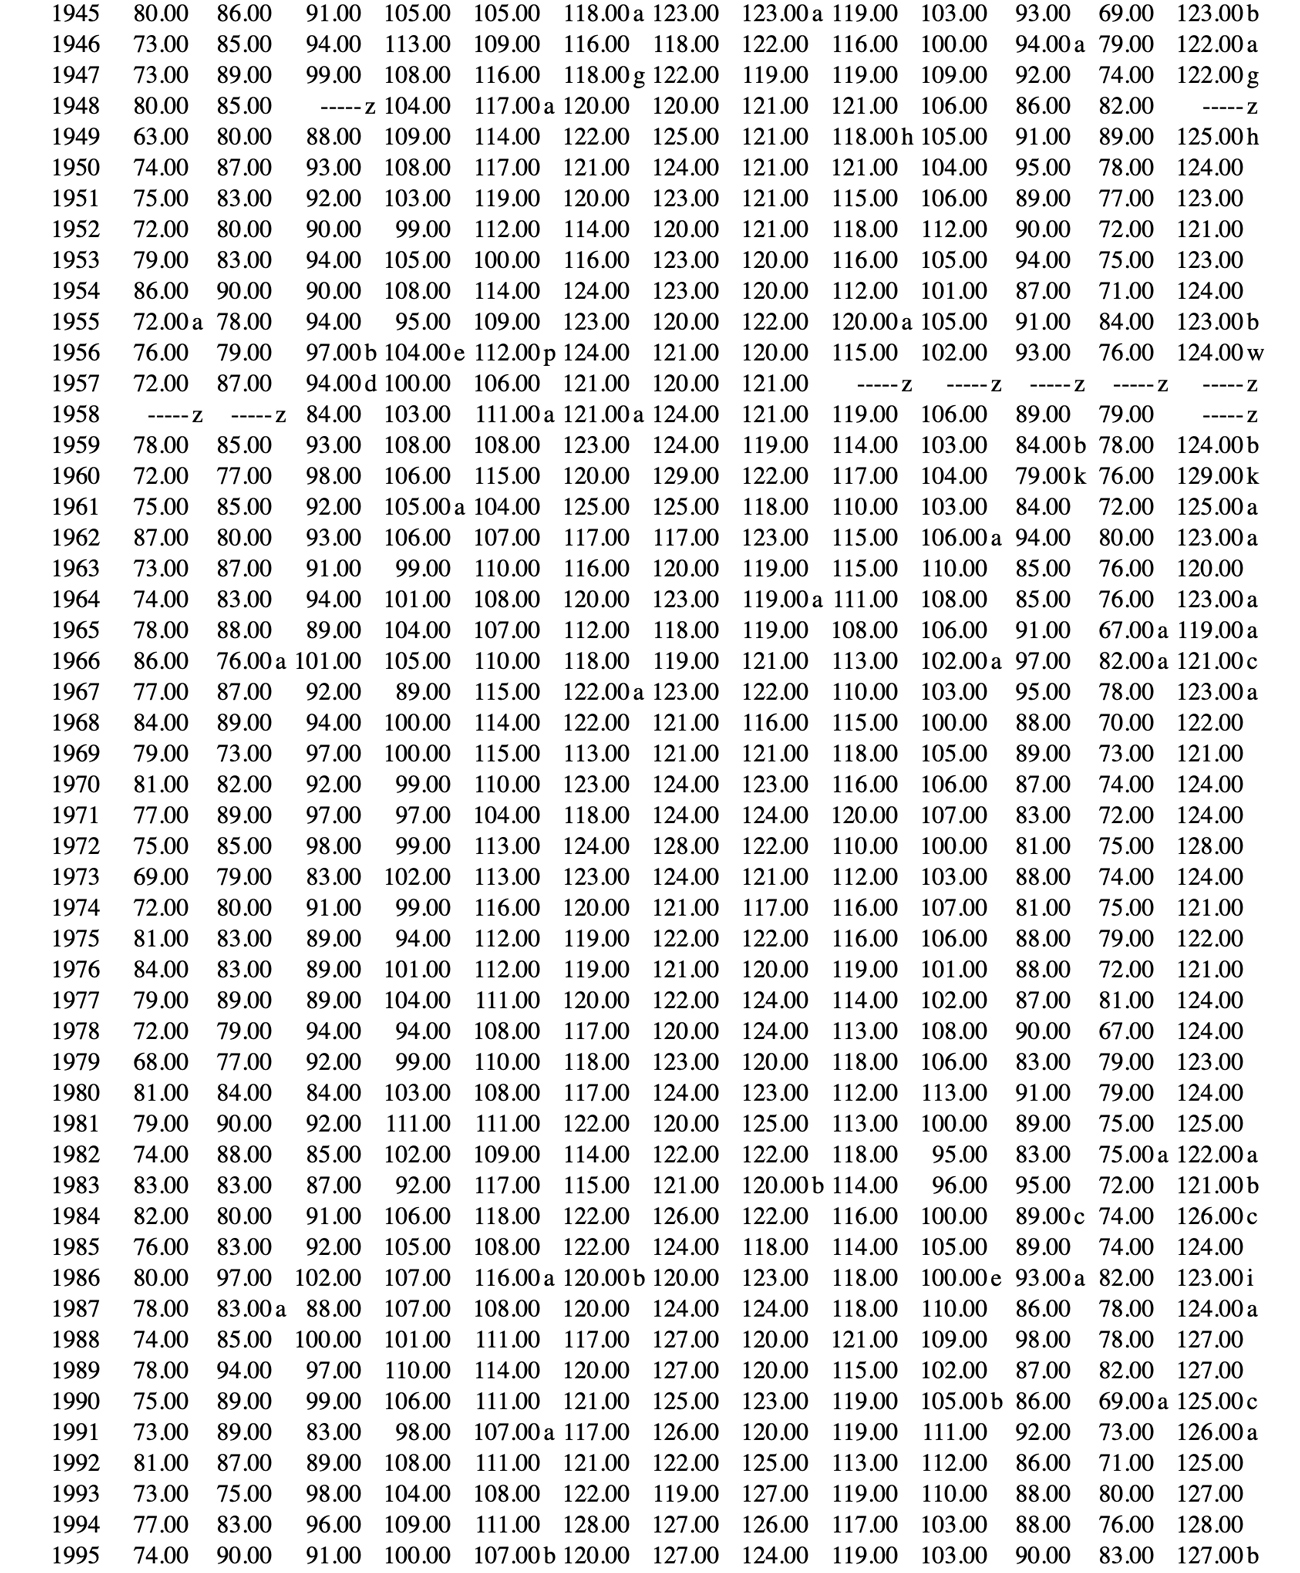
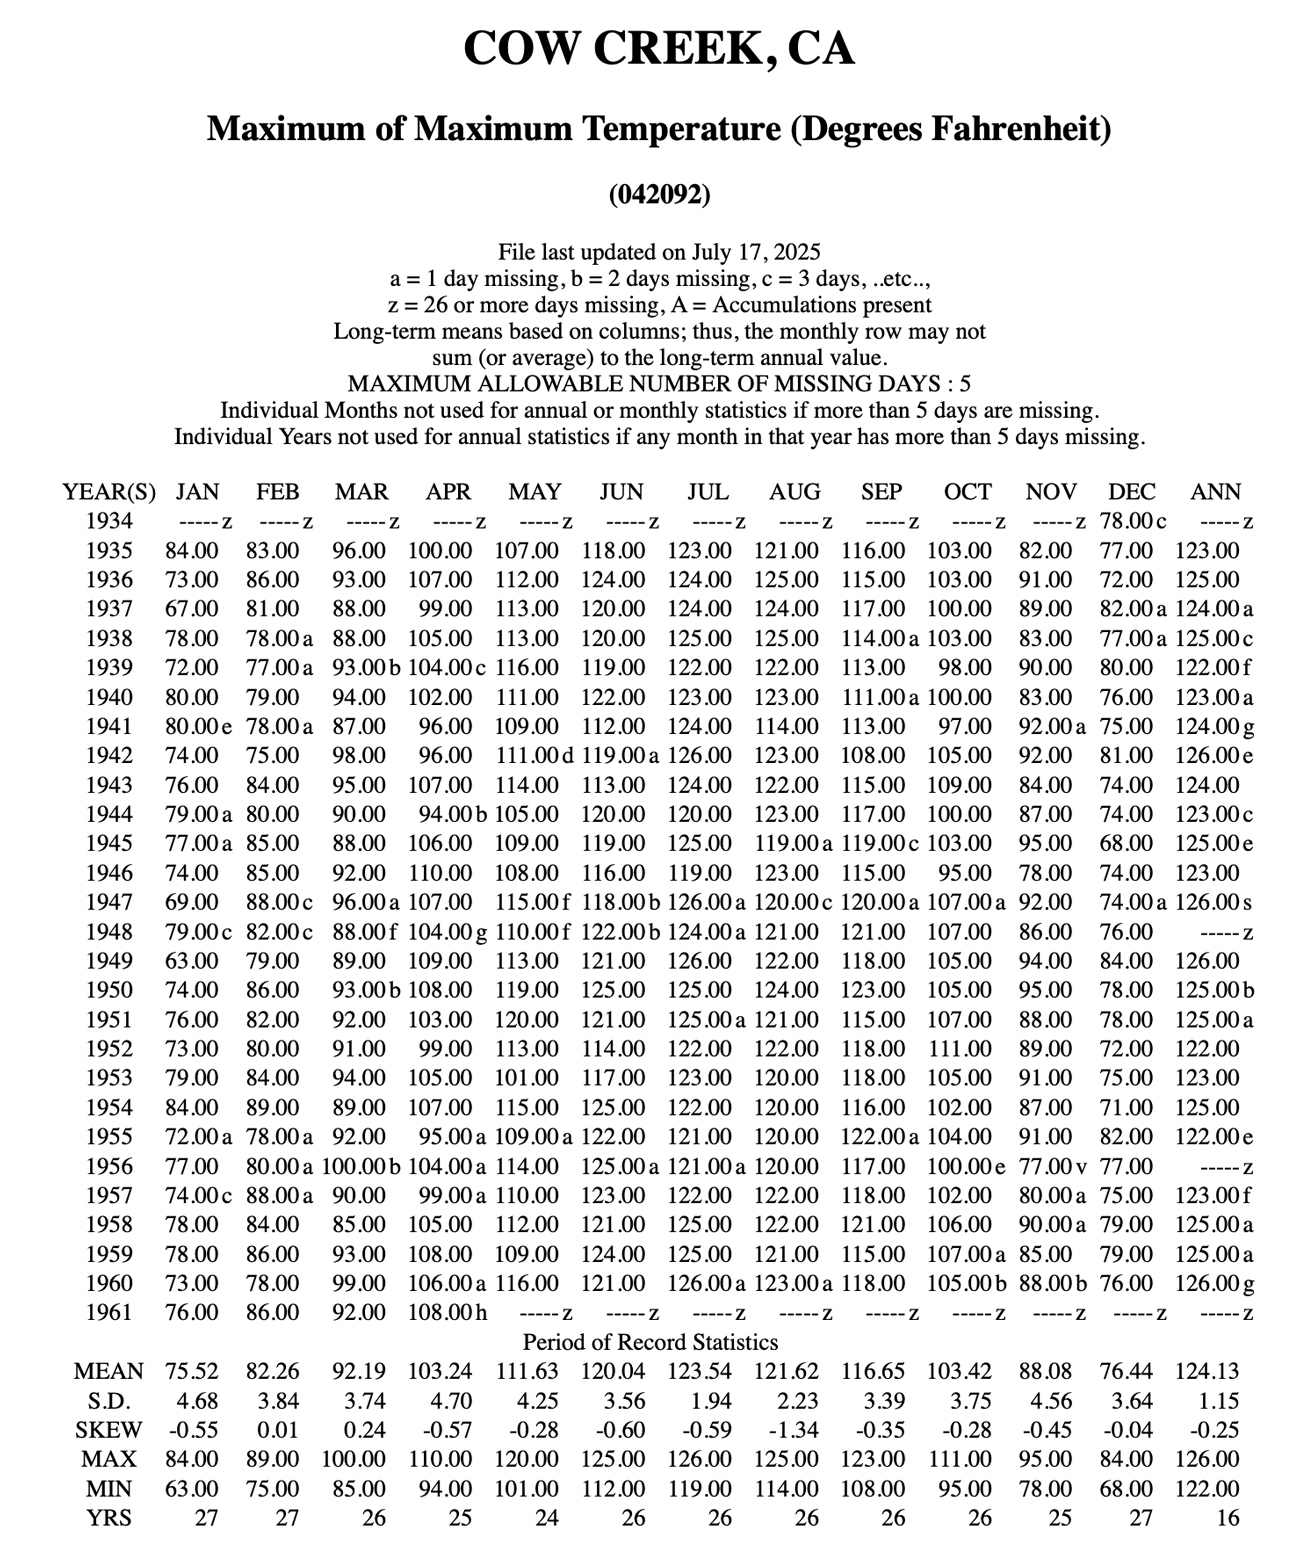
And while we are here at the WRCC site, let’s cut and paste the same monthly and annual maximums at Cow Creek. Cow Creek was the NPS weather station in Death Valley from 1934 to 1961. It was about three miles north of Furnace Creek and about 25 feet higher in elevation (-152 feet).
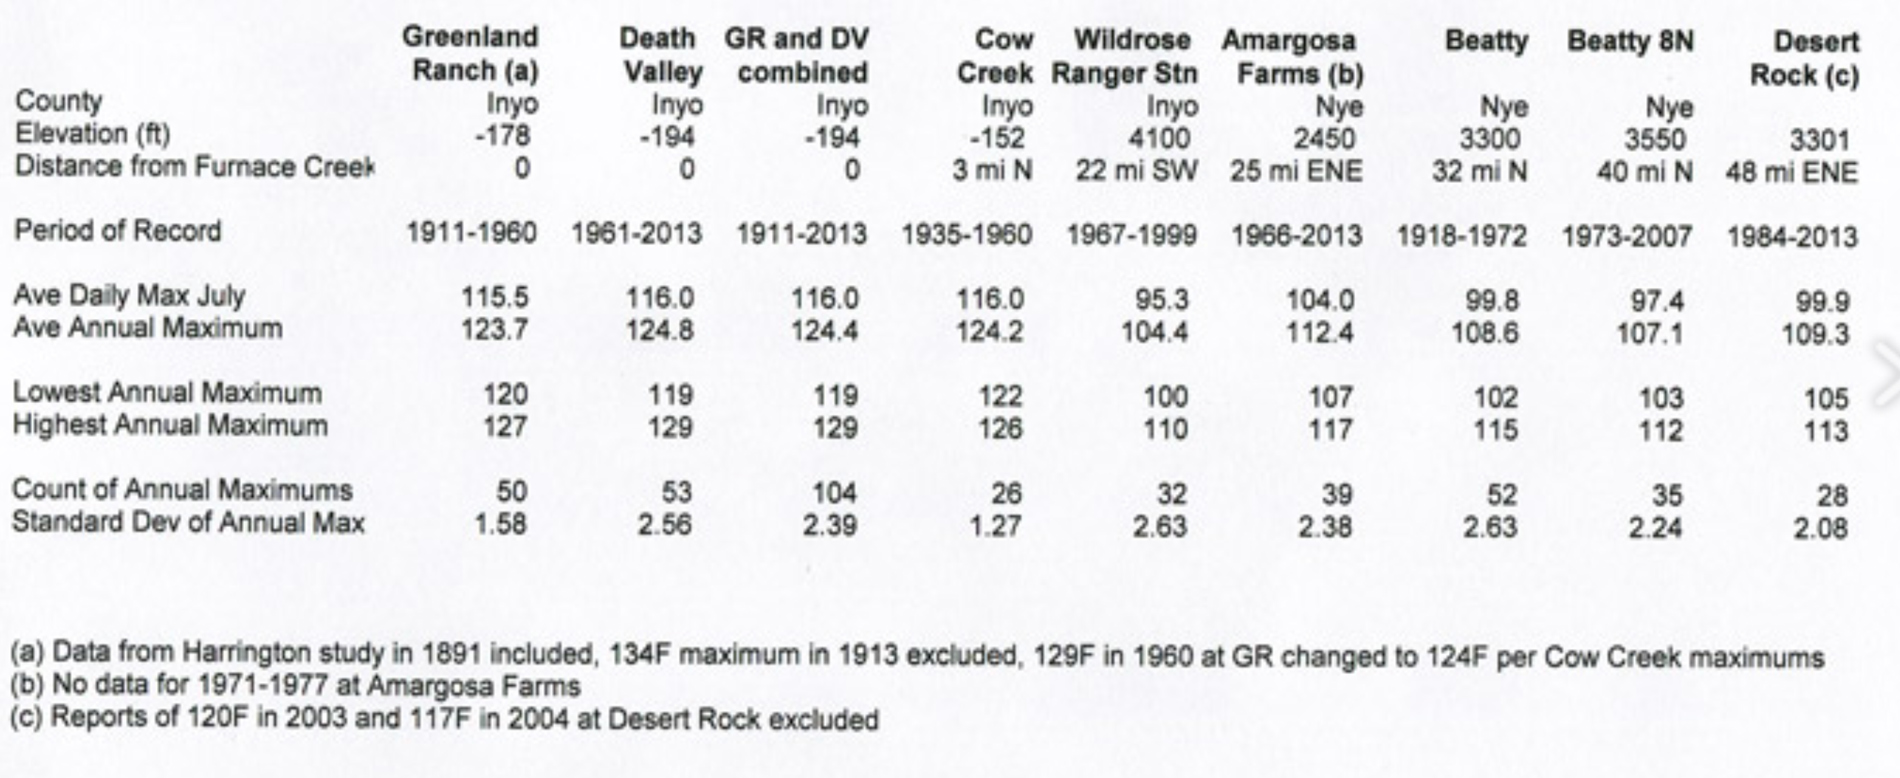
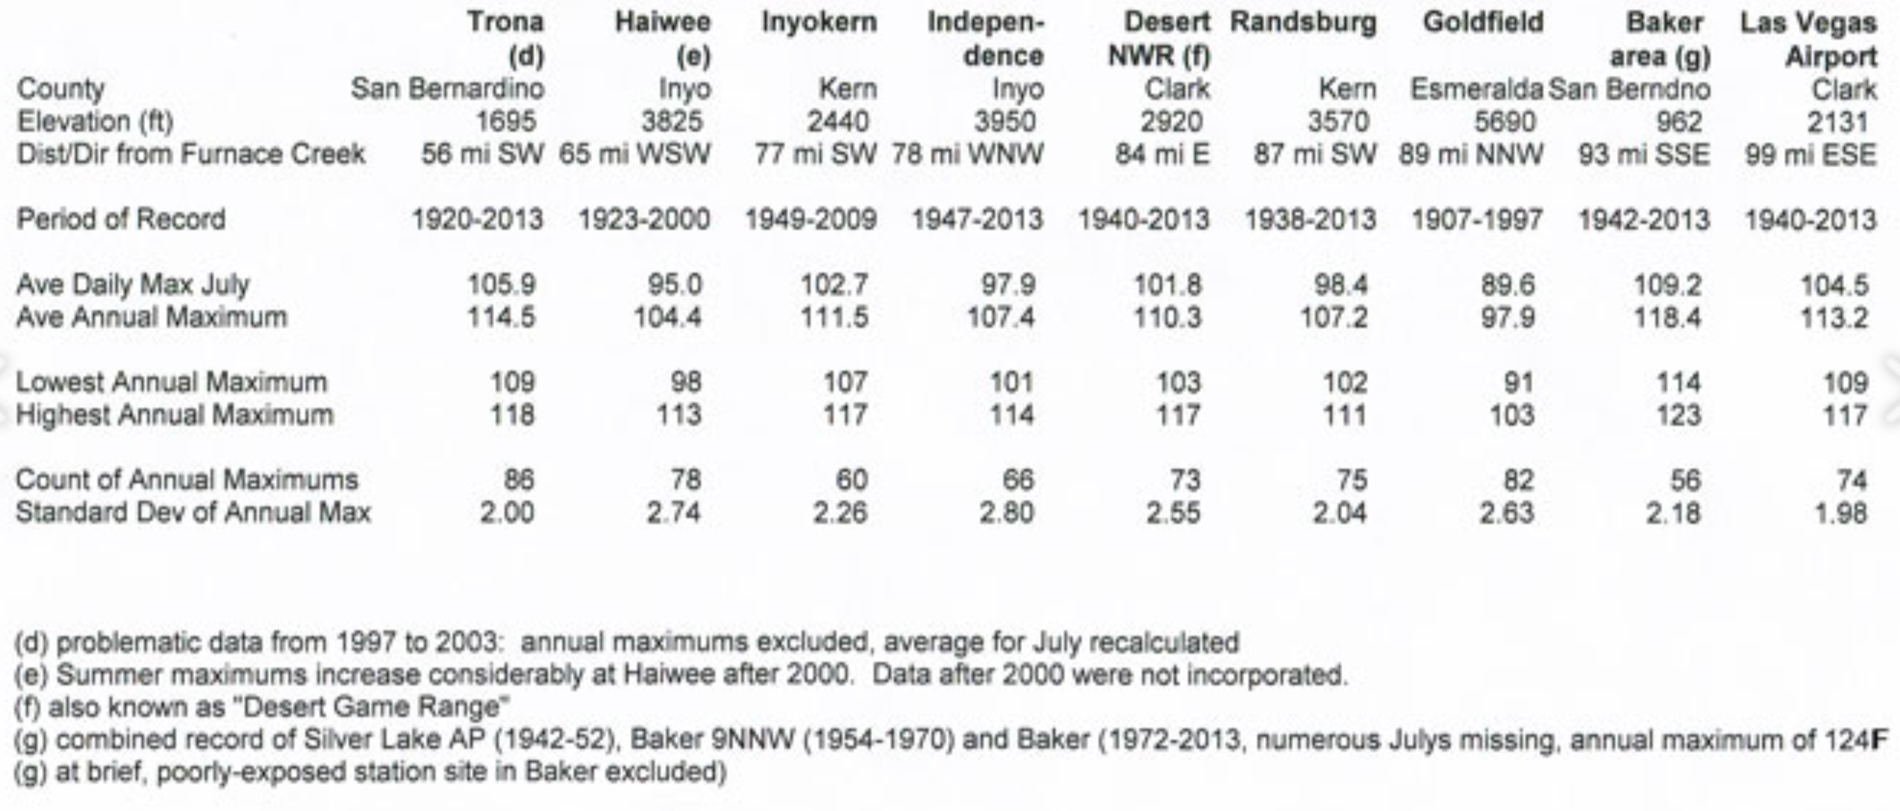
The stations in and near Furnace Creek have averaged near 116F through the decades for average daily maximum temperature for July. For comparison, this is about 6-7 degrees F hotter (for July) than the next-hottest/long-term climate stations in the Desert Southwest. Death Valley is the only area of the United States which routinely reaches and exceeds 120F during the summer months.
Other low-elevation areas (near or below about 1500 feet above sea level) of the Desert Southwest with weather stations which occasionally reach 120F and higher and which have average daily July maximums not too far from 110F are listed below:
—along the Gila River in Arizona downstream of Phoenix (to the Colorado River)
—the Coachella Valley area (Palm Springs to Thermal and Borrego and Ocotillo Wells)
—the Imperial Valley and Salton basin (Mecca to Imperial, Brawley, El Centro and Calexico)
—the Lower Colorado River Valley from about Mesquite, NV, to Yuma, AZ (including Laughlin, Bullhead City, Needles and Blythe)
—desert basin areas in and around Bristol Lake (near Amboy, CA) and Soda and Silver lakes (near Baker, CA)
—and areas north of Baker to the southern Death Valley region along the Amargosa River, downstream of Shoshone and Tecopa.
Low basins in the Death Valley region which also likely have authentic temperatures of 120F or higher on occasion (but do not have standard weather stations) are the Panamint Valley and Saline Valley. These basins bottom out at around 1100 feet. I should probably stipulate that by “occasionally” I am thinking that these areas might have a handful of 120-degree days every decade, and that summers which do not reach 120F are not unusual.
On the very hottest summer days of record, authentic ambient temperatures may be close to about 123F to 125F in some of the hottest (non-DV) areas listed above. Some towns and stations in and near these low-elevation areas are not terribly higher in elevation compared to Furnace Creek (for instance, the areas below sea level around the Salton Sea and Imperial Valley). But for a variety of reasons (involving topography, meteorology, and proximity to bodies of water and irrigated farmland) their highest summer maximums are unable to match those in Death Valley.
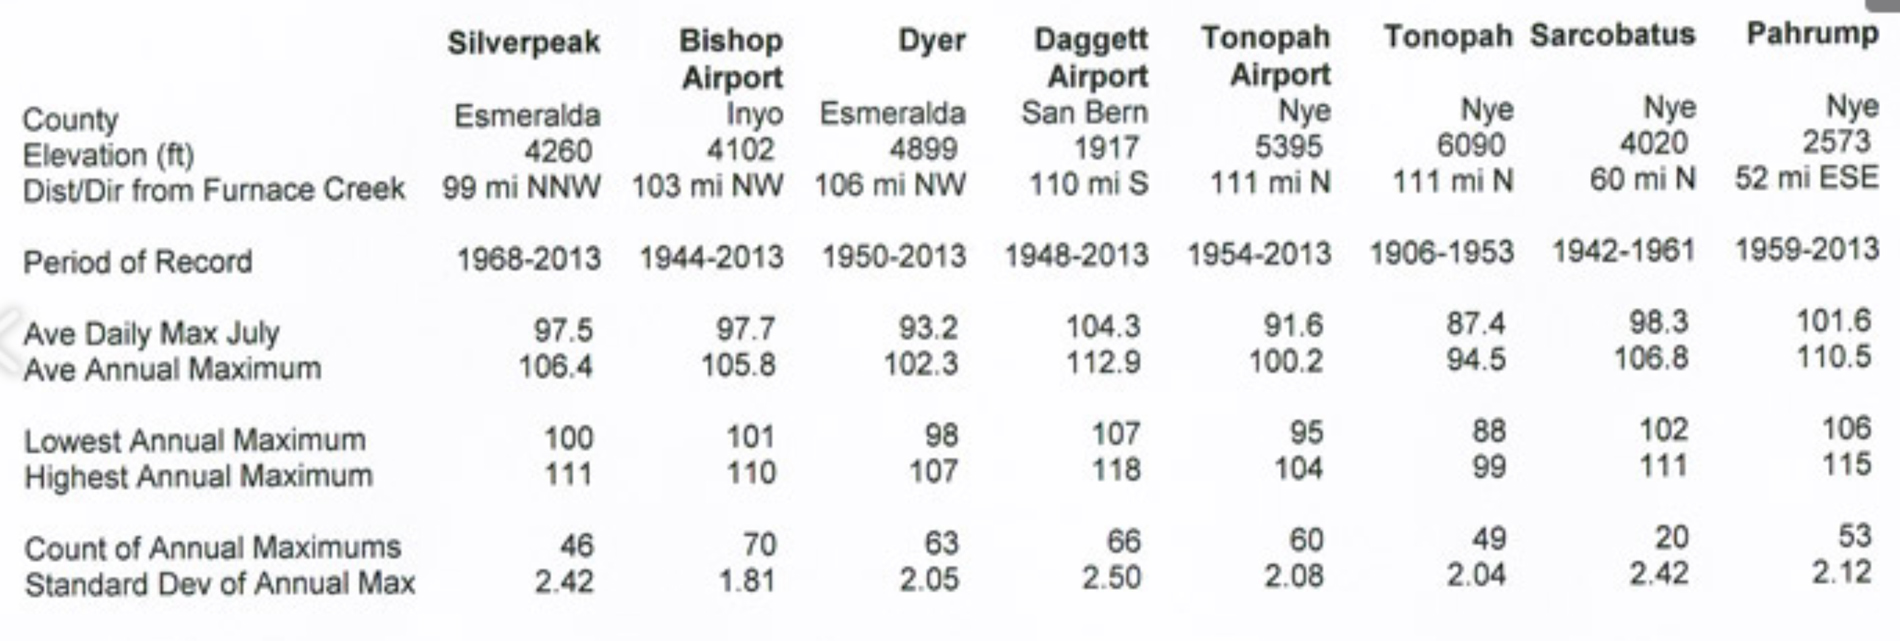
The tables below provide some average July daily maximums and extreme high temperature data for long-term stations in the Death Valley region. The low-elevation stations are hottest due to excellent mixing in the lower troposphere, combined with compressional effects. (On typical sunny summer afternoons, temperature increases about 4.5 to 5.0 degrees (F) for every 1000-foot decrease in elevation.) These tables include data only through 2013, before Death Valley recorded a (semi-) legitimate 130F maximum. (Most of the low-elevation areas listed above are not in the Death Valley region, so you won’t find stations such as Needles and Palm Springs in these tables. Average July daily maximum for these two towns is about 110F.)
Death Valley is easily above the rest of the pack when it comes to having the hottest temperatures in the United States. Let’s look its hottest maximum temperature reports. I have written a bunch on these, so you can expect links to pages on Stormbruiser which go into some detail. And, I will be listing both the reliable reports AND the unreliable reports, whether they have been officially discredited or not! A theme from this web entry is that it is important to be at least a little skeptical of all really-high temperature reports.
Prior to the establishment of the official USWB climate station at Greenland Ranch (aka Furnace Creek Ranch) in Death Valley in June, 1911, there were various measurements and reports of temperatures into the 120s and 130s (F) in Death Valley. I summarize these near the beginning of this entry on my web site. Look for the “Some Early Temperature Measurements in Death Valley” section. There were, seemingly, authentic measurements higher than 130F by individuals with reliable thermometers. There were also reports of 130F-plus at the Greenland Ranch ranch house, made in the shade and beneath the veranda. Poor exposure of the thermometers no doubt helped to boost those readings which were near and above 130F. Broadly speaking, only official measurements from standard instruments, in approved shelters, with adequate exposure, would ever be considered for record-setting status.
HIGHEST GREENLAND RANCH MAXIMUM TEMPERATURES
For a history of the weather station locations at Greenland Ranch and some background on its observer from 1913 to 1920, Oscar Denton, see Part 6 of my research on the Death Valley temperature records.
An official but temporary weather station was established by the USWB at Harmony, about a mile north of the current NPS DV Visitors Center at Furnace Creek, from May to September in 1891. The highest temperature recorded was 122F, on five dates.
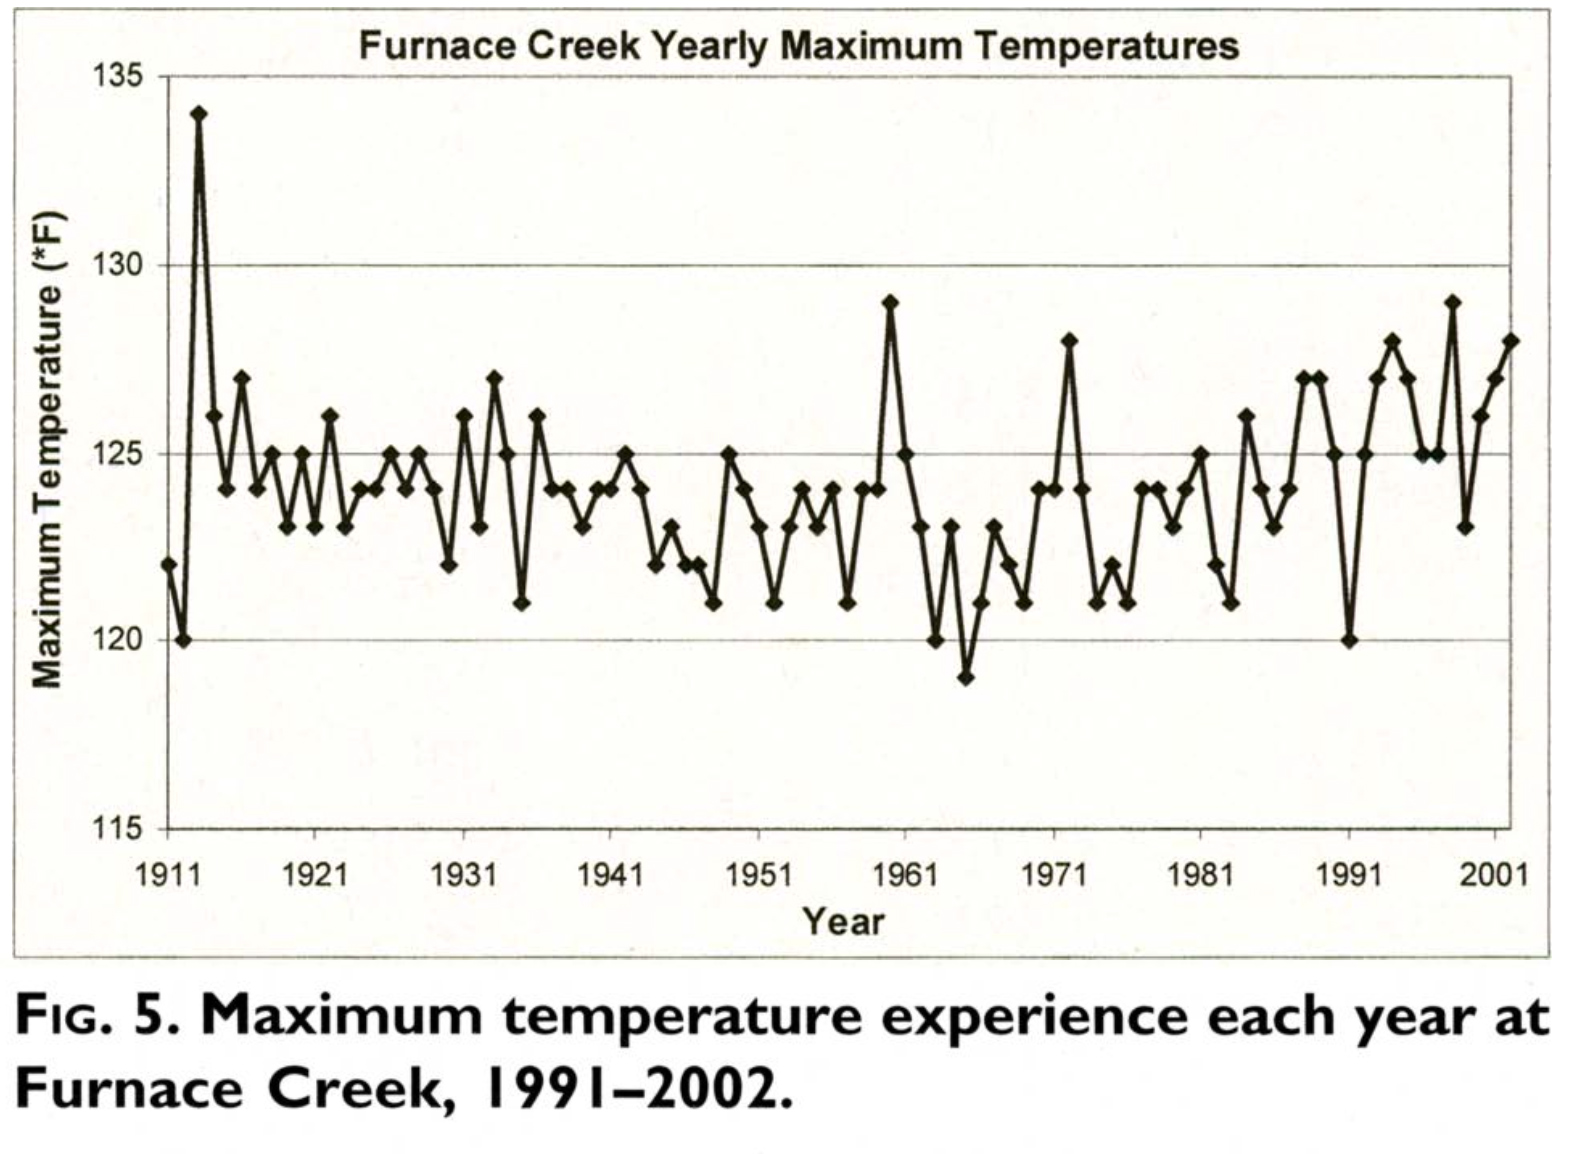
The Greenland Ranch weather station was established in June, 1911, by the USWB (with the help of Fred Corkill of the Pacific Coast Borax Company). Fifty summers of temperature records are available from Greenland Ranch, through 1960. There were about five different sitings of the instruments at Greenland Ranch, with varying distances from the cooling influences of the alfalfa field, the irrigated date groves and other cropland, and later on the golf course. Annual maximums at Greenland Ranch and at Death Valley from 1911 to 2002 were graphed (shown below) by Roof and Callagan.
Annual maximums at the official Death Valley station from 2002 to 2024 have ranged from 124F to 130F. Below are two similar charts which I made a while back. These show annual maximums at Greenland Ranch and Death Valley through 2013, with a 7-year running mean in the second chart. Note how annual maximums have jumped up fairly significantly since about 1980.
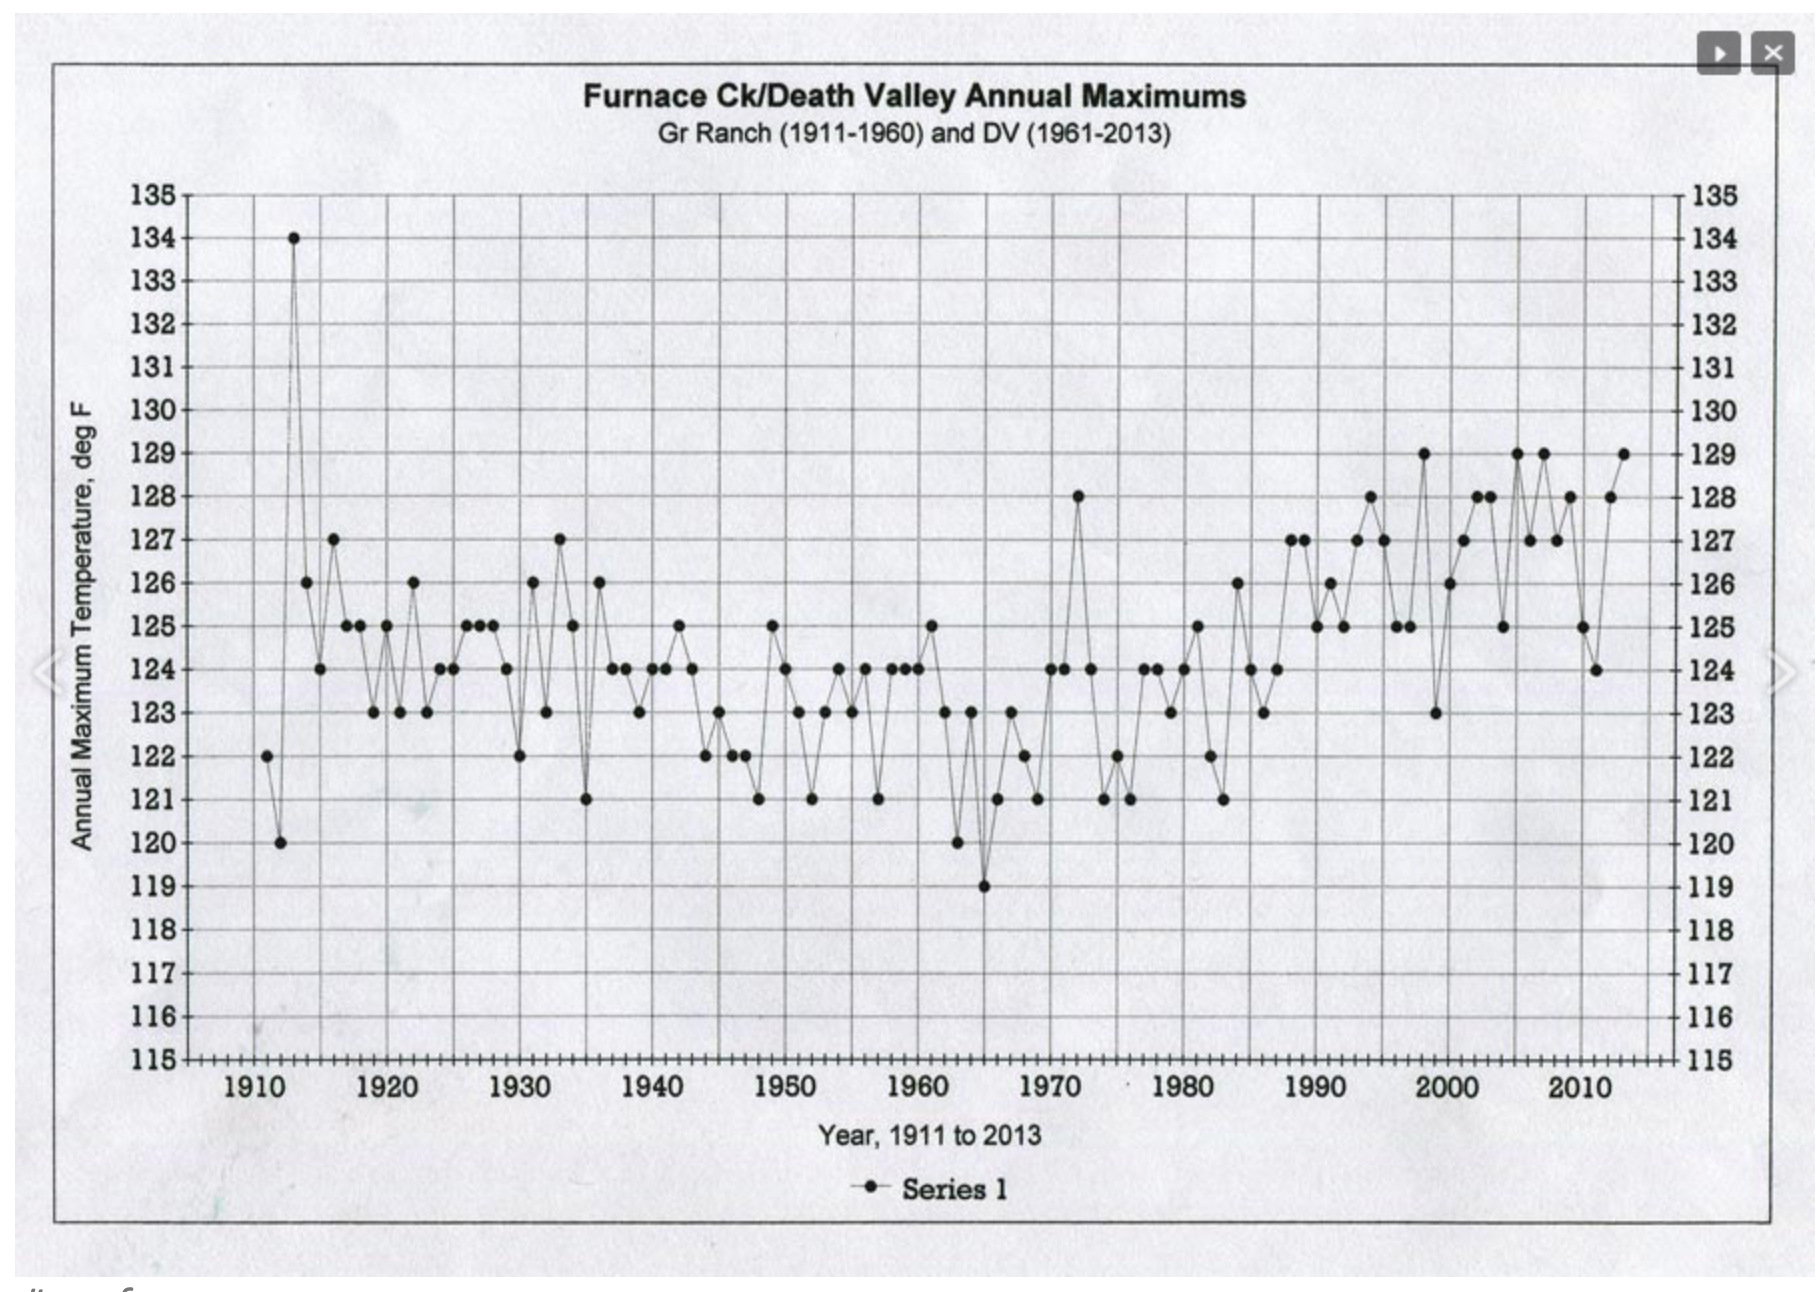
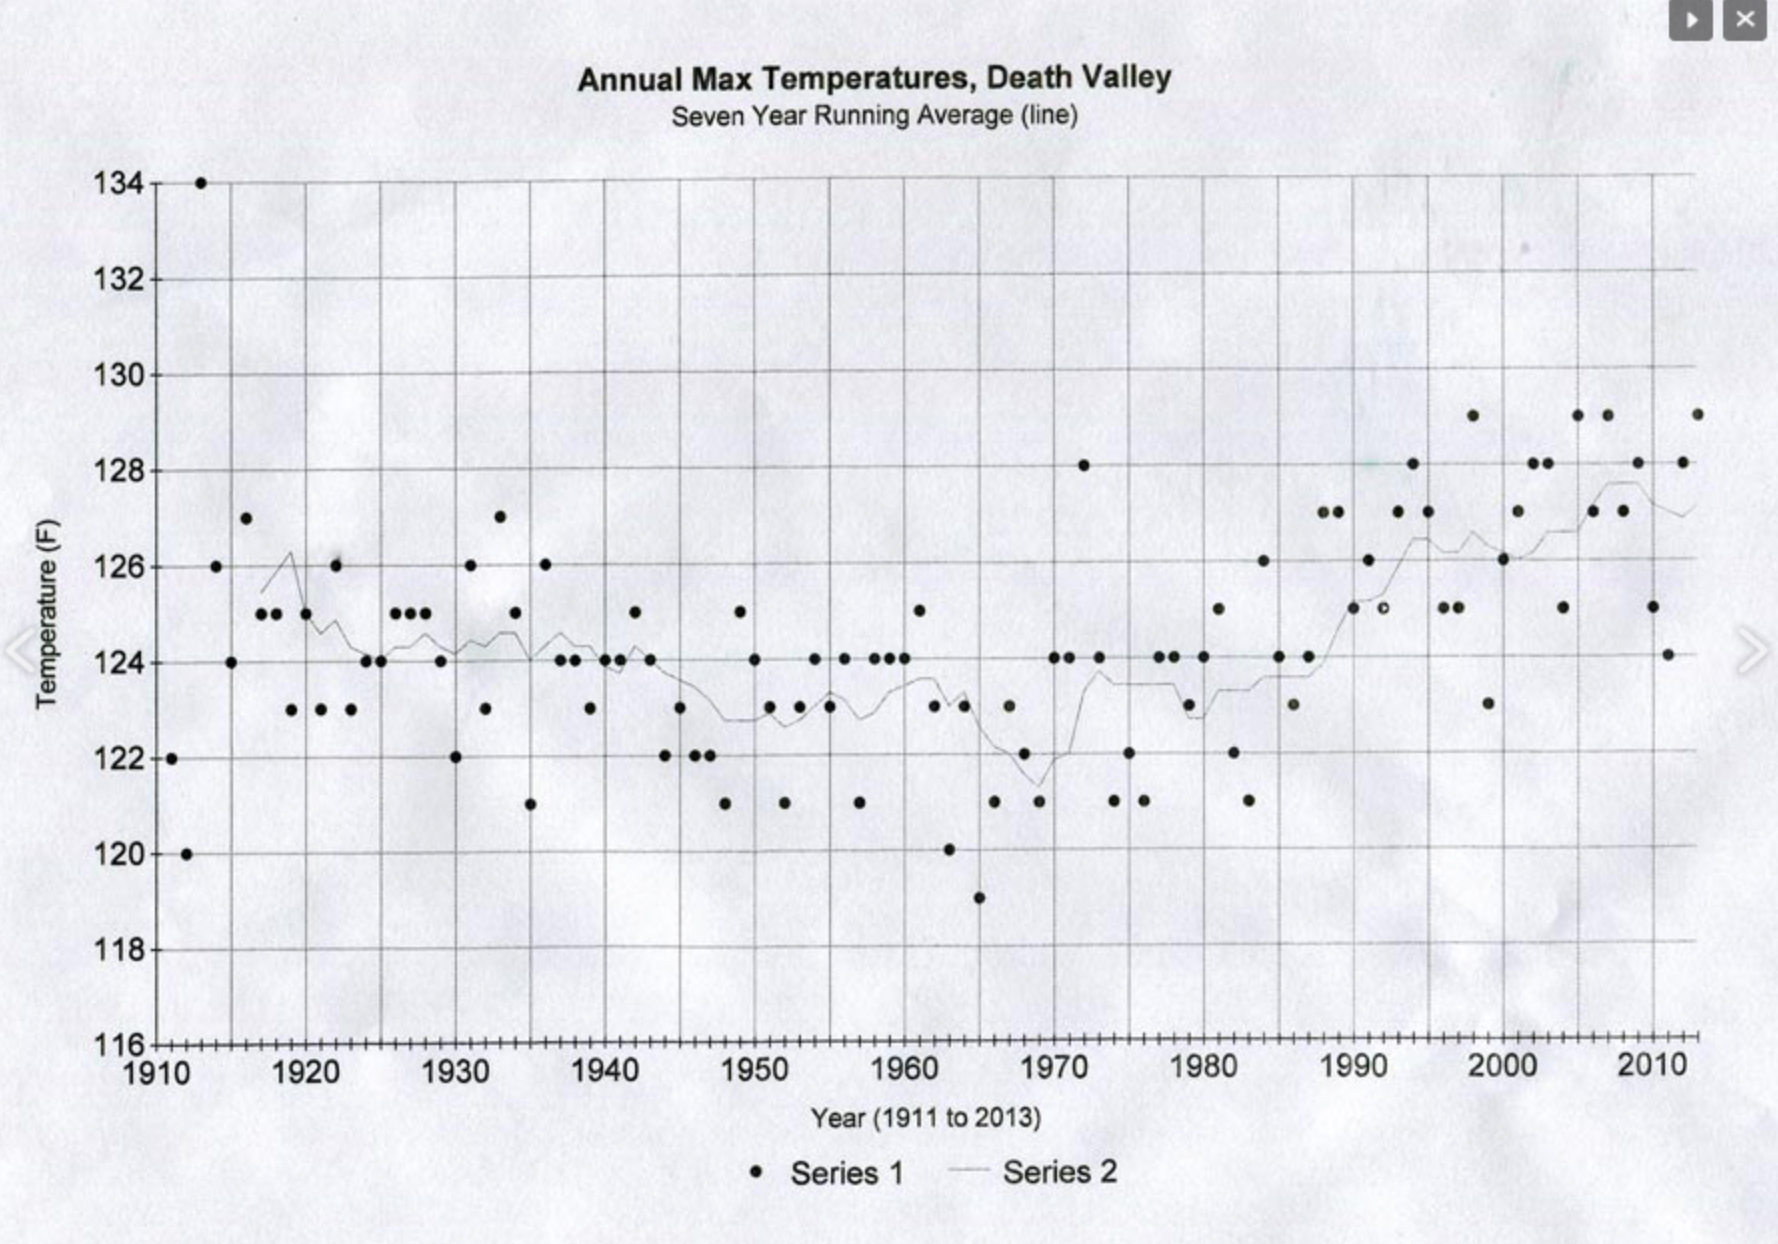
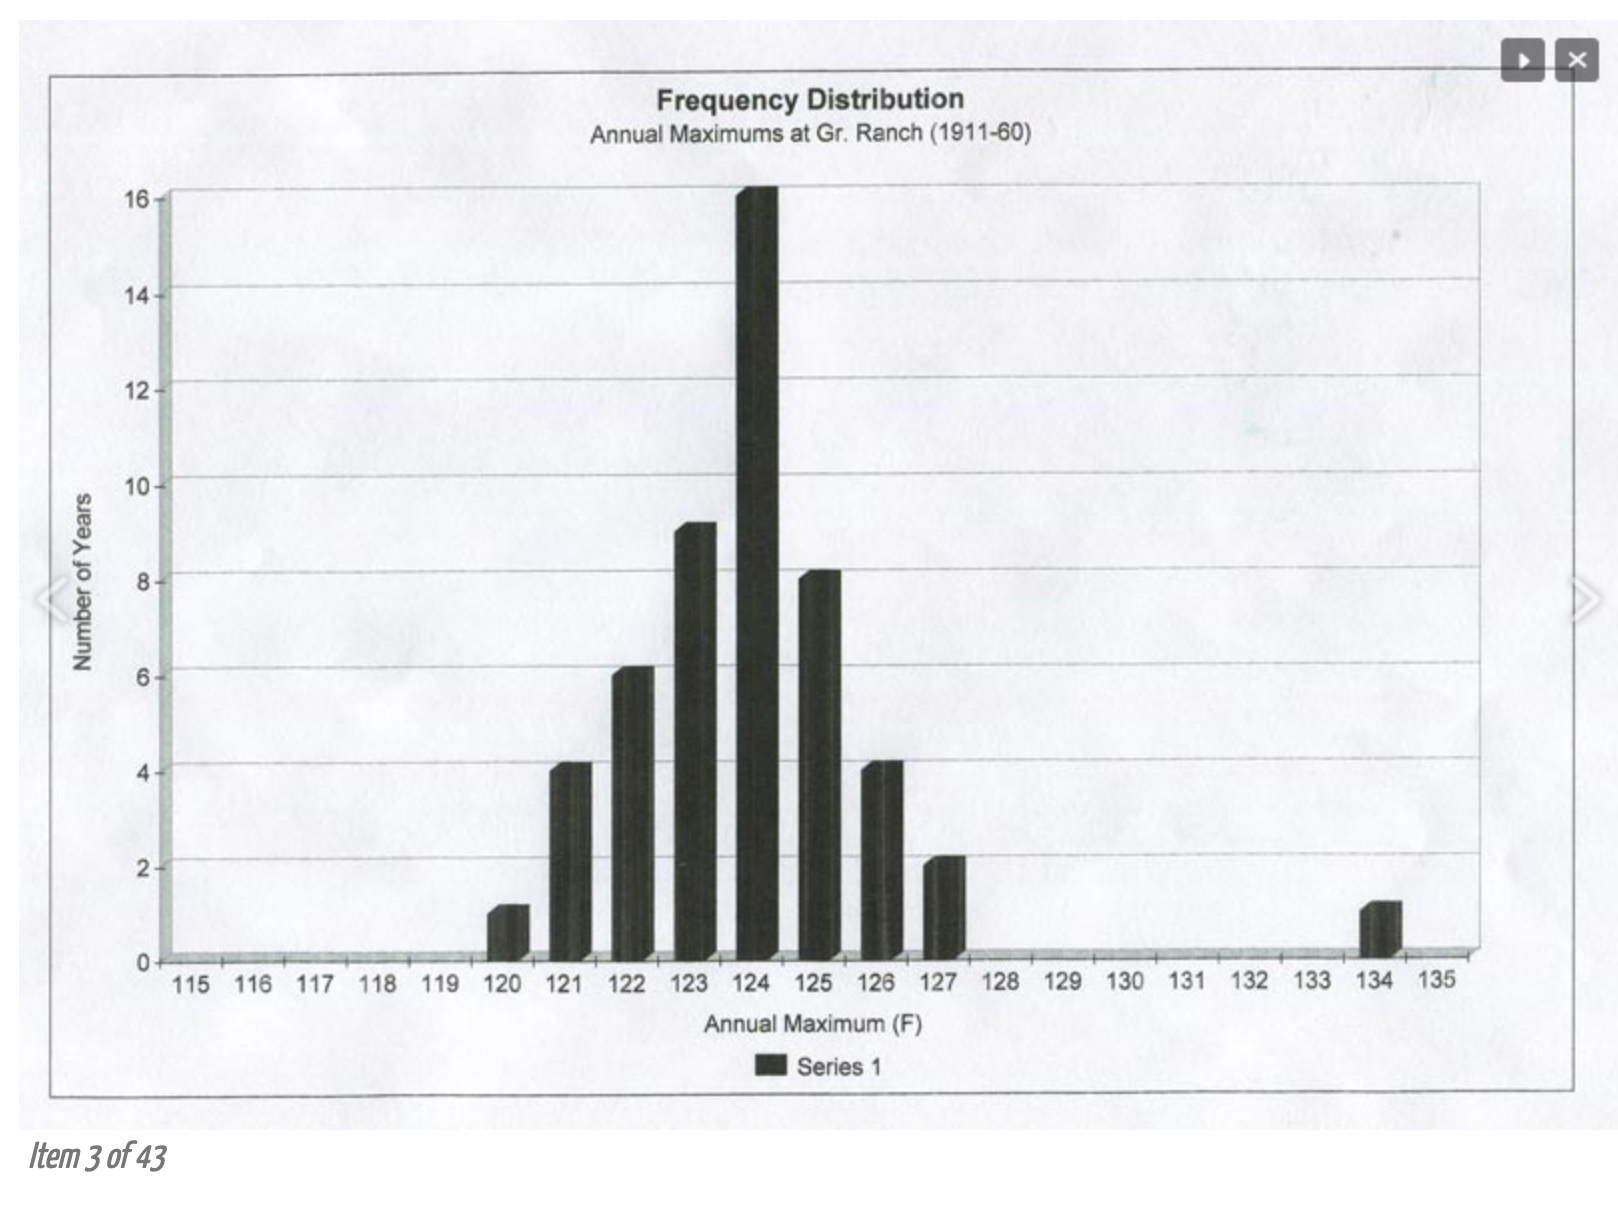
The frequency distribution chart on the right incorporates only annual maximums from Greenland Ranch, 1911 to 1960. The maximum of 134F in 1913 was included, primarily just to show how spurious the value is. There was a reported maximum of 129F at Greenland Ranch in July, 1960. This record is included in the WRCC tables for Greenland Ranch and Death Valley (provided near the top of this entry). My charts above do not show this 129F maximum because it is not valid. More on this below.
THE MAXIMUMS OF JULY 1913 at GREENLAND RANCH
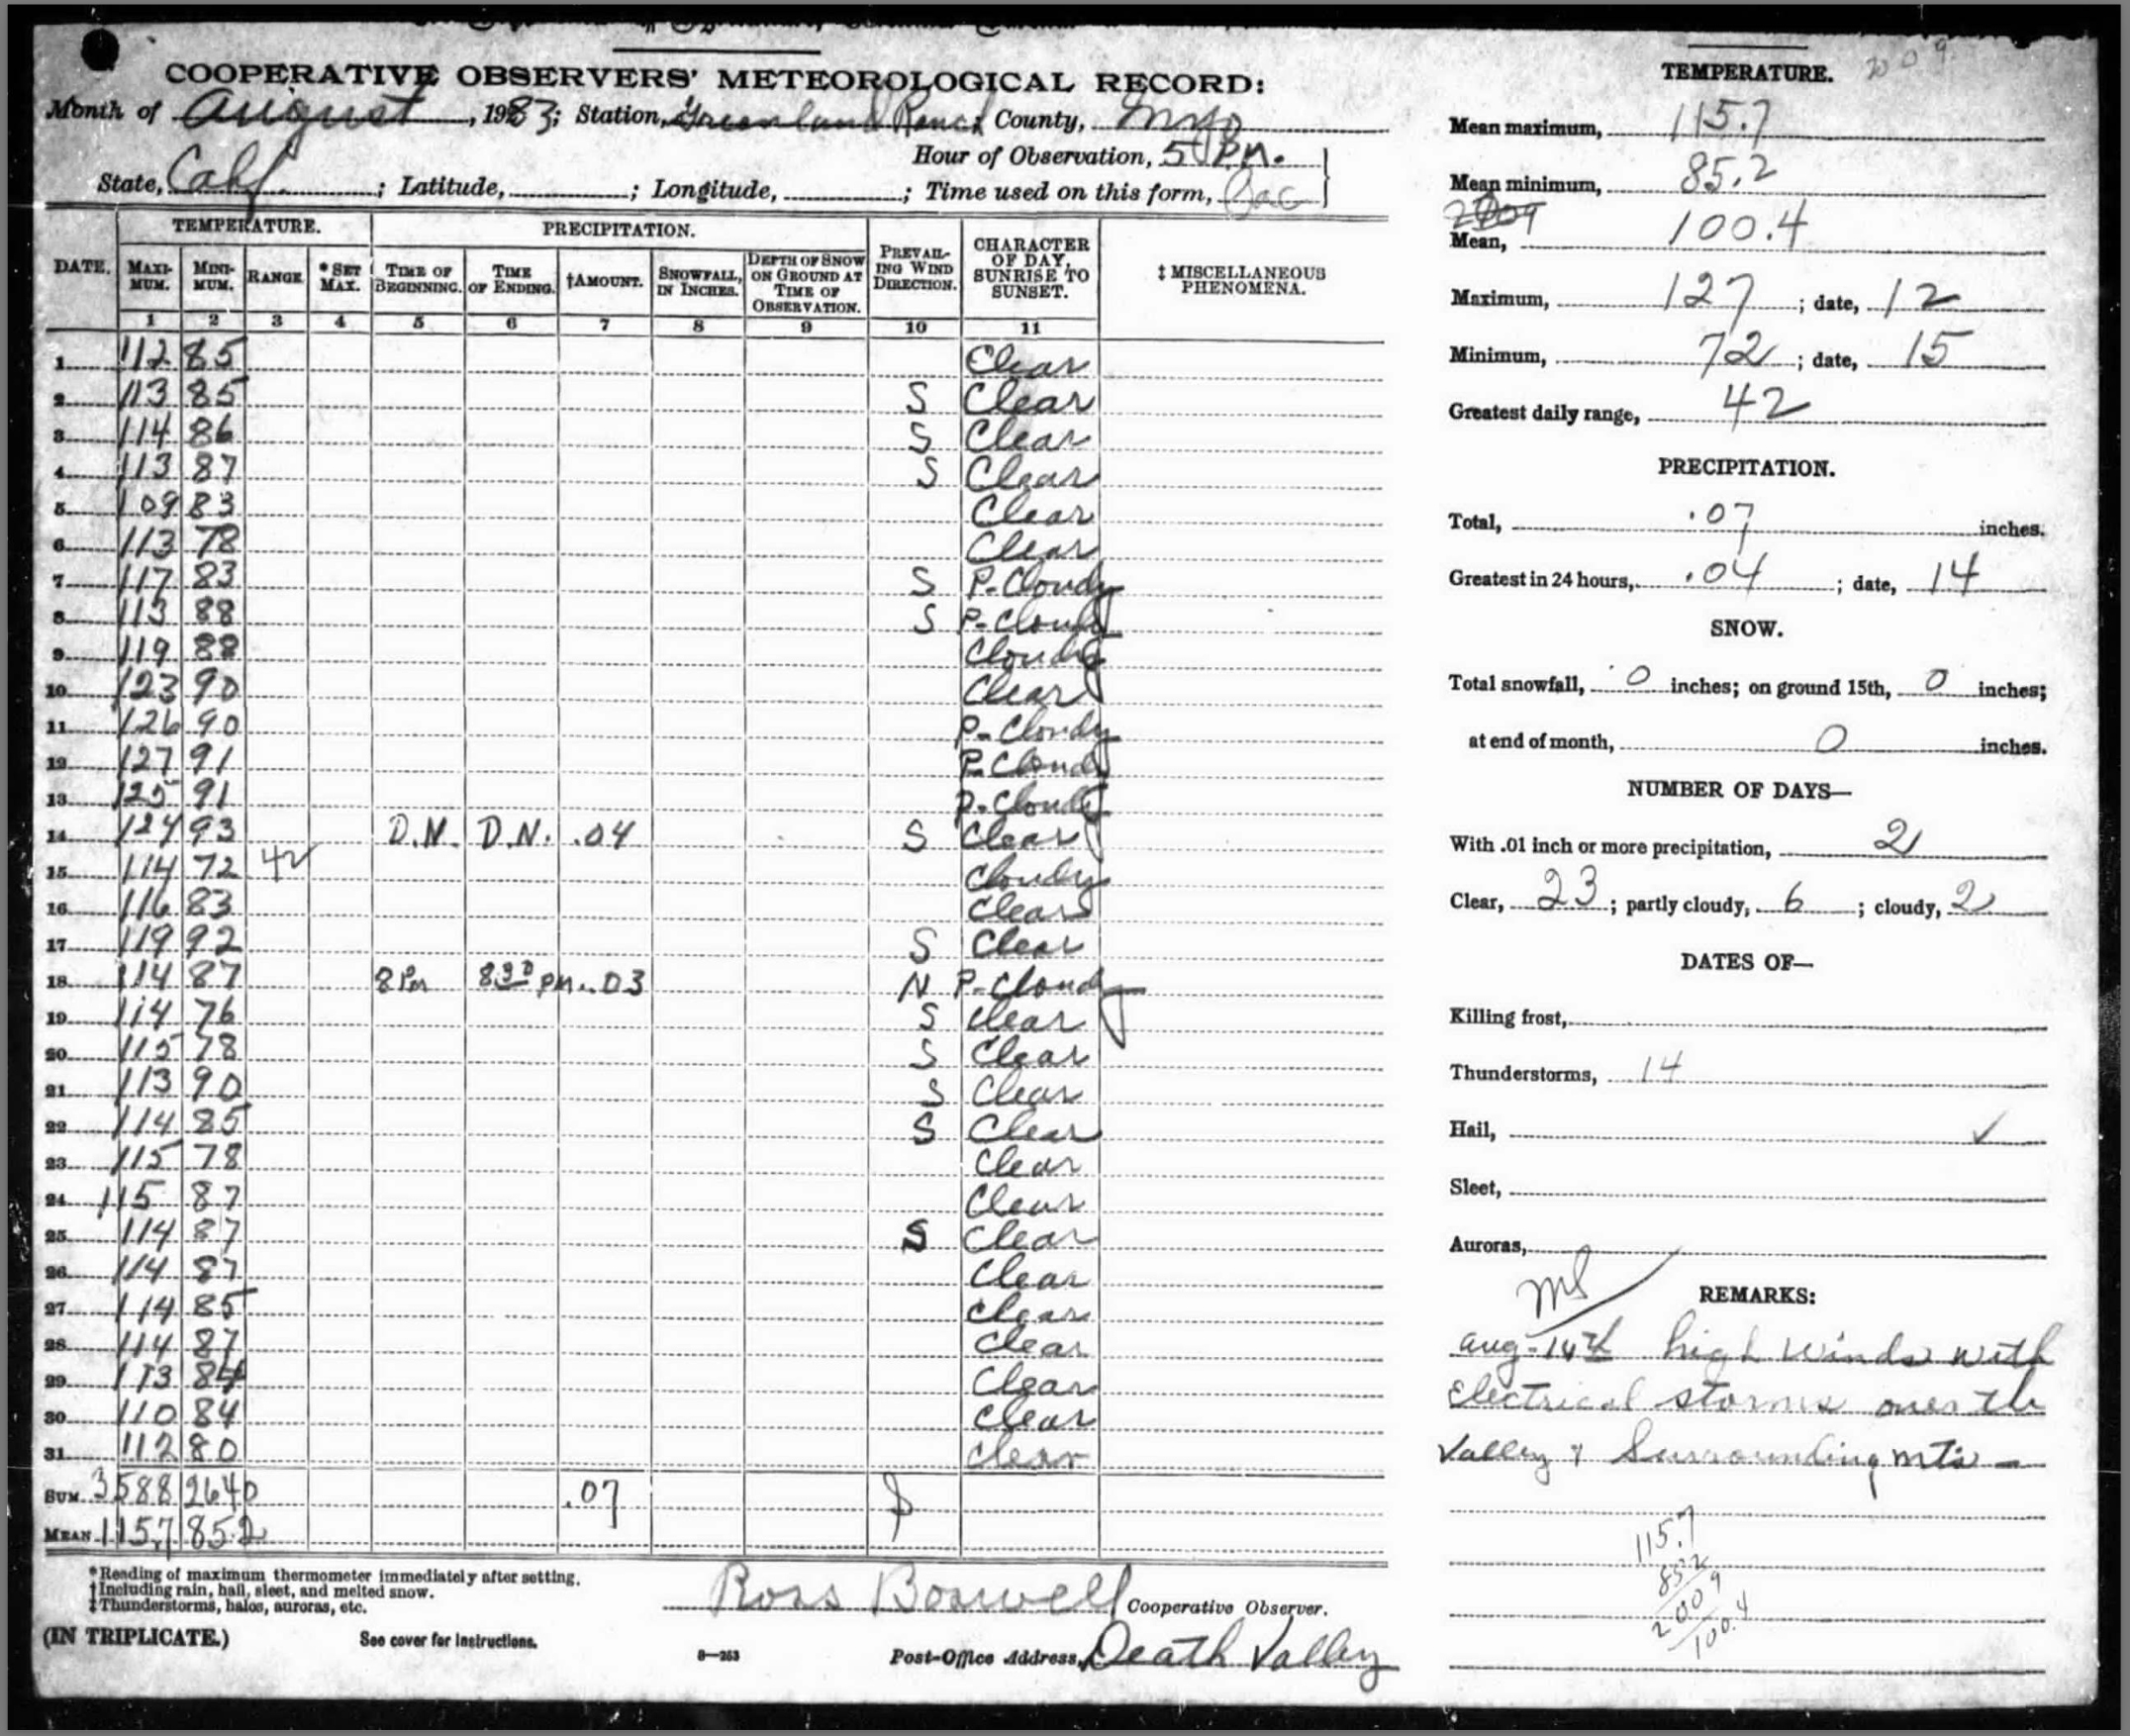
The highest recorded maximum temperatures from the Greenland Ranch station were made by Oscar Denton in July 1913. Here is a cropped and blown-up look at Oscar’s entries from July 1 to 18, 1913, from the carbon copy form which was located in old ranch files by DV historian David Woodruff.
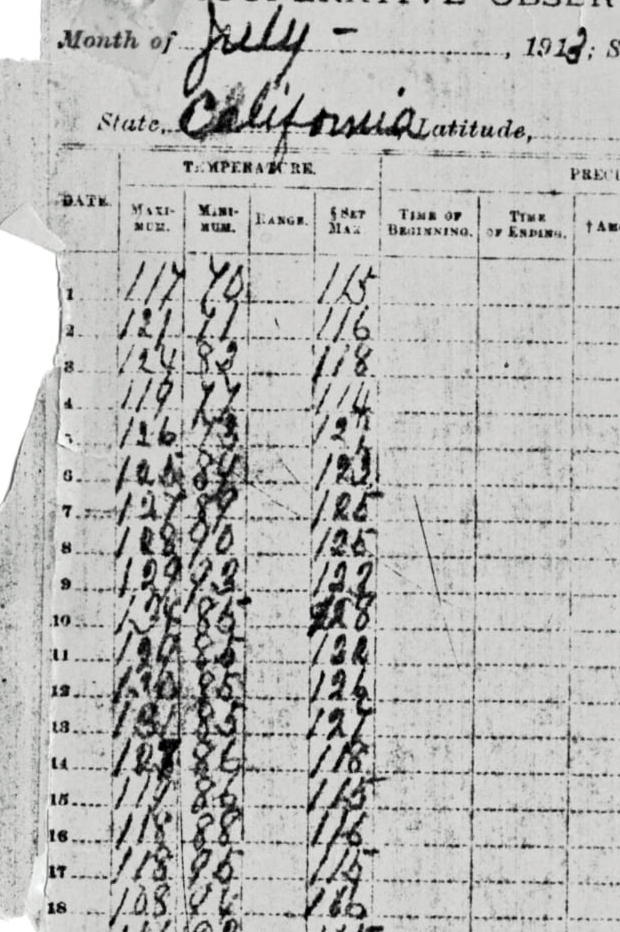
All of the maximums from the 5th to the 14th were 125F or higher. The 5-day period from the 9th to the 13th shows high temperatures of 129F, 134F, 129F, 130F, and 131F (with four consecutive minimums of 85F from the 10th to the 13th). A maximum of (maybe) 123F on the 14th is over-written with a 127F because the set-max temperature on the previous day was 127F. (Perhaps Corkill, who received the monthly climate forms from Denton, is responsible for the 127F overwrite. I am assuming that this is a carbon copy, and assuming that the USWB would have only received the original top form. The max of 108F on the 18th was not over-written, despite the set-max of 115F on the 17th.)
My research through the decades, beginning with my Masters Thesis (in 1987), argues that all or most of these Greenland Ranch maximums during the first half of July, 1913, are not authentic. For a detailed discussion on these suspect maximums, check about halfway down this entry for the July 1913 section on Stormbruiser.
The reason why these Greenland Ranch maximums are not valid is because the regional weather reports for the first half of July, 1913, indicate that the air mass was not hot enough to support such hot temperatures in Death Valley and at Greenland Ranch. The chart below shows the daily maximum temperature departures from the corresponding long-term averages for Greenland Ranch and for the closest surrounding desert stations in July 1913.
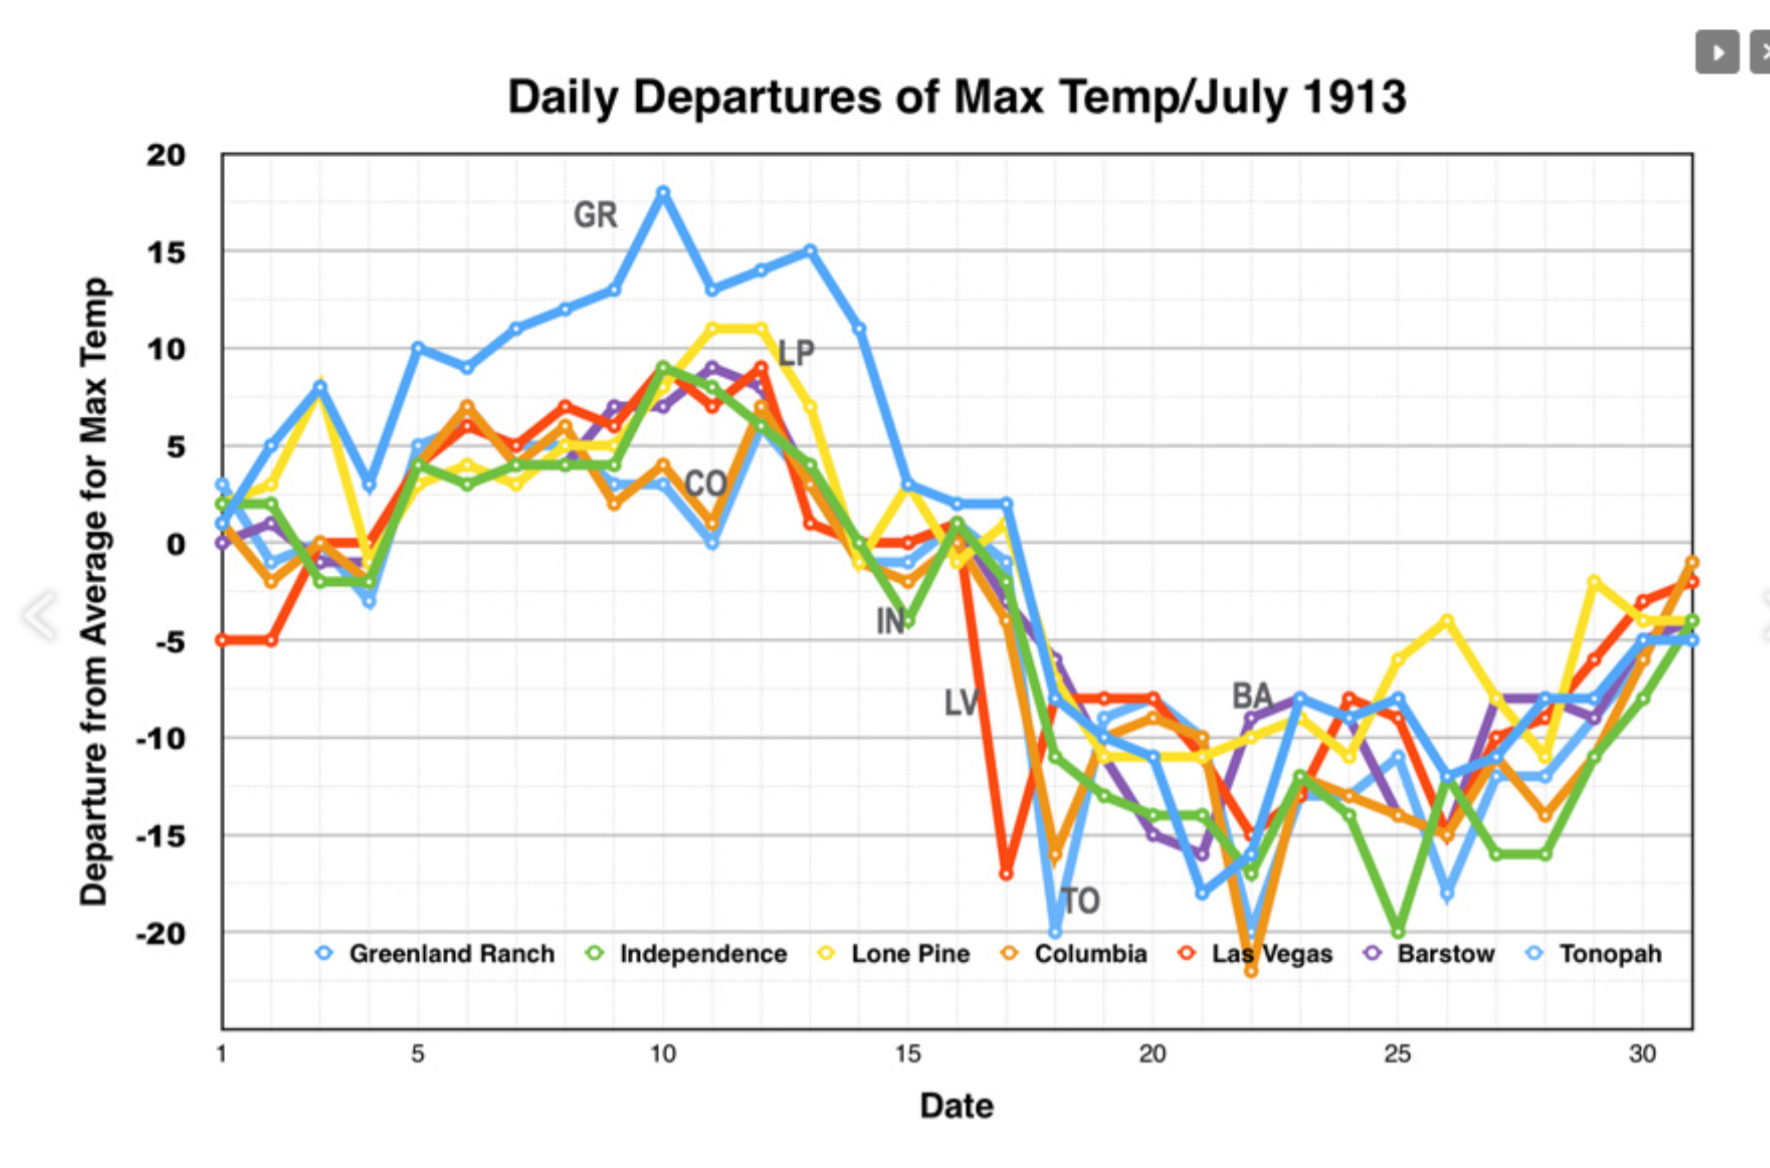
In contrast to the surrounding stations, which generally cluster around a similar departure value day-to-day, the Greenland Ranch departures run a consistent 5-to-10 degrees F higher comparably from about July 5th to July 13th, 1913. The air mass covering the region was never hot enough to support maximums near or above 130F in Death Valley during the first two weeks of July, 1913.
The last half of July, 1913, was quite a bit cooler than average in the region. This was due in part to an active monsoon weather pattern. The Greenland Ranch maximums appear to be reasonable after mid-month, but the record from the first half of the month should be invalidated. If Denton had been taking the observations properly, it is likely that the hottest temperature at the USWB Greenland Ranch station for July, 1913, would have been close to 125F. The NWS and WMO and the Climate Extremes committees have yet to thoroughly investigate the bogus July 1913 maximums from Greenland Ranch (as of July 2025). A professional paper is in the works by myself and Dr. Roy Spencer and Dr. John Christy to help get the ball rolling on invalidating the 134F record. A new journal paper by Reinhold Steinacker (pdf version) does a great job of demonstrating just how unrealistic the July 1913 maximums are. Much like my findings, Steinacker shows that maximums at the closest surrounding stations were not hot enough to support maximums near or above 130F in Death Valley.
OTHER ANNUAL MAXIMUMS at GREENLAND RANCH
Outside of 1913, the highest annual maximum temperature report from Greenland Ranch is the 129F on July 18, 1960. The climate form showing this report is below.
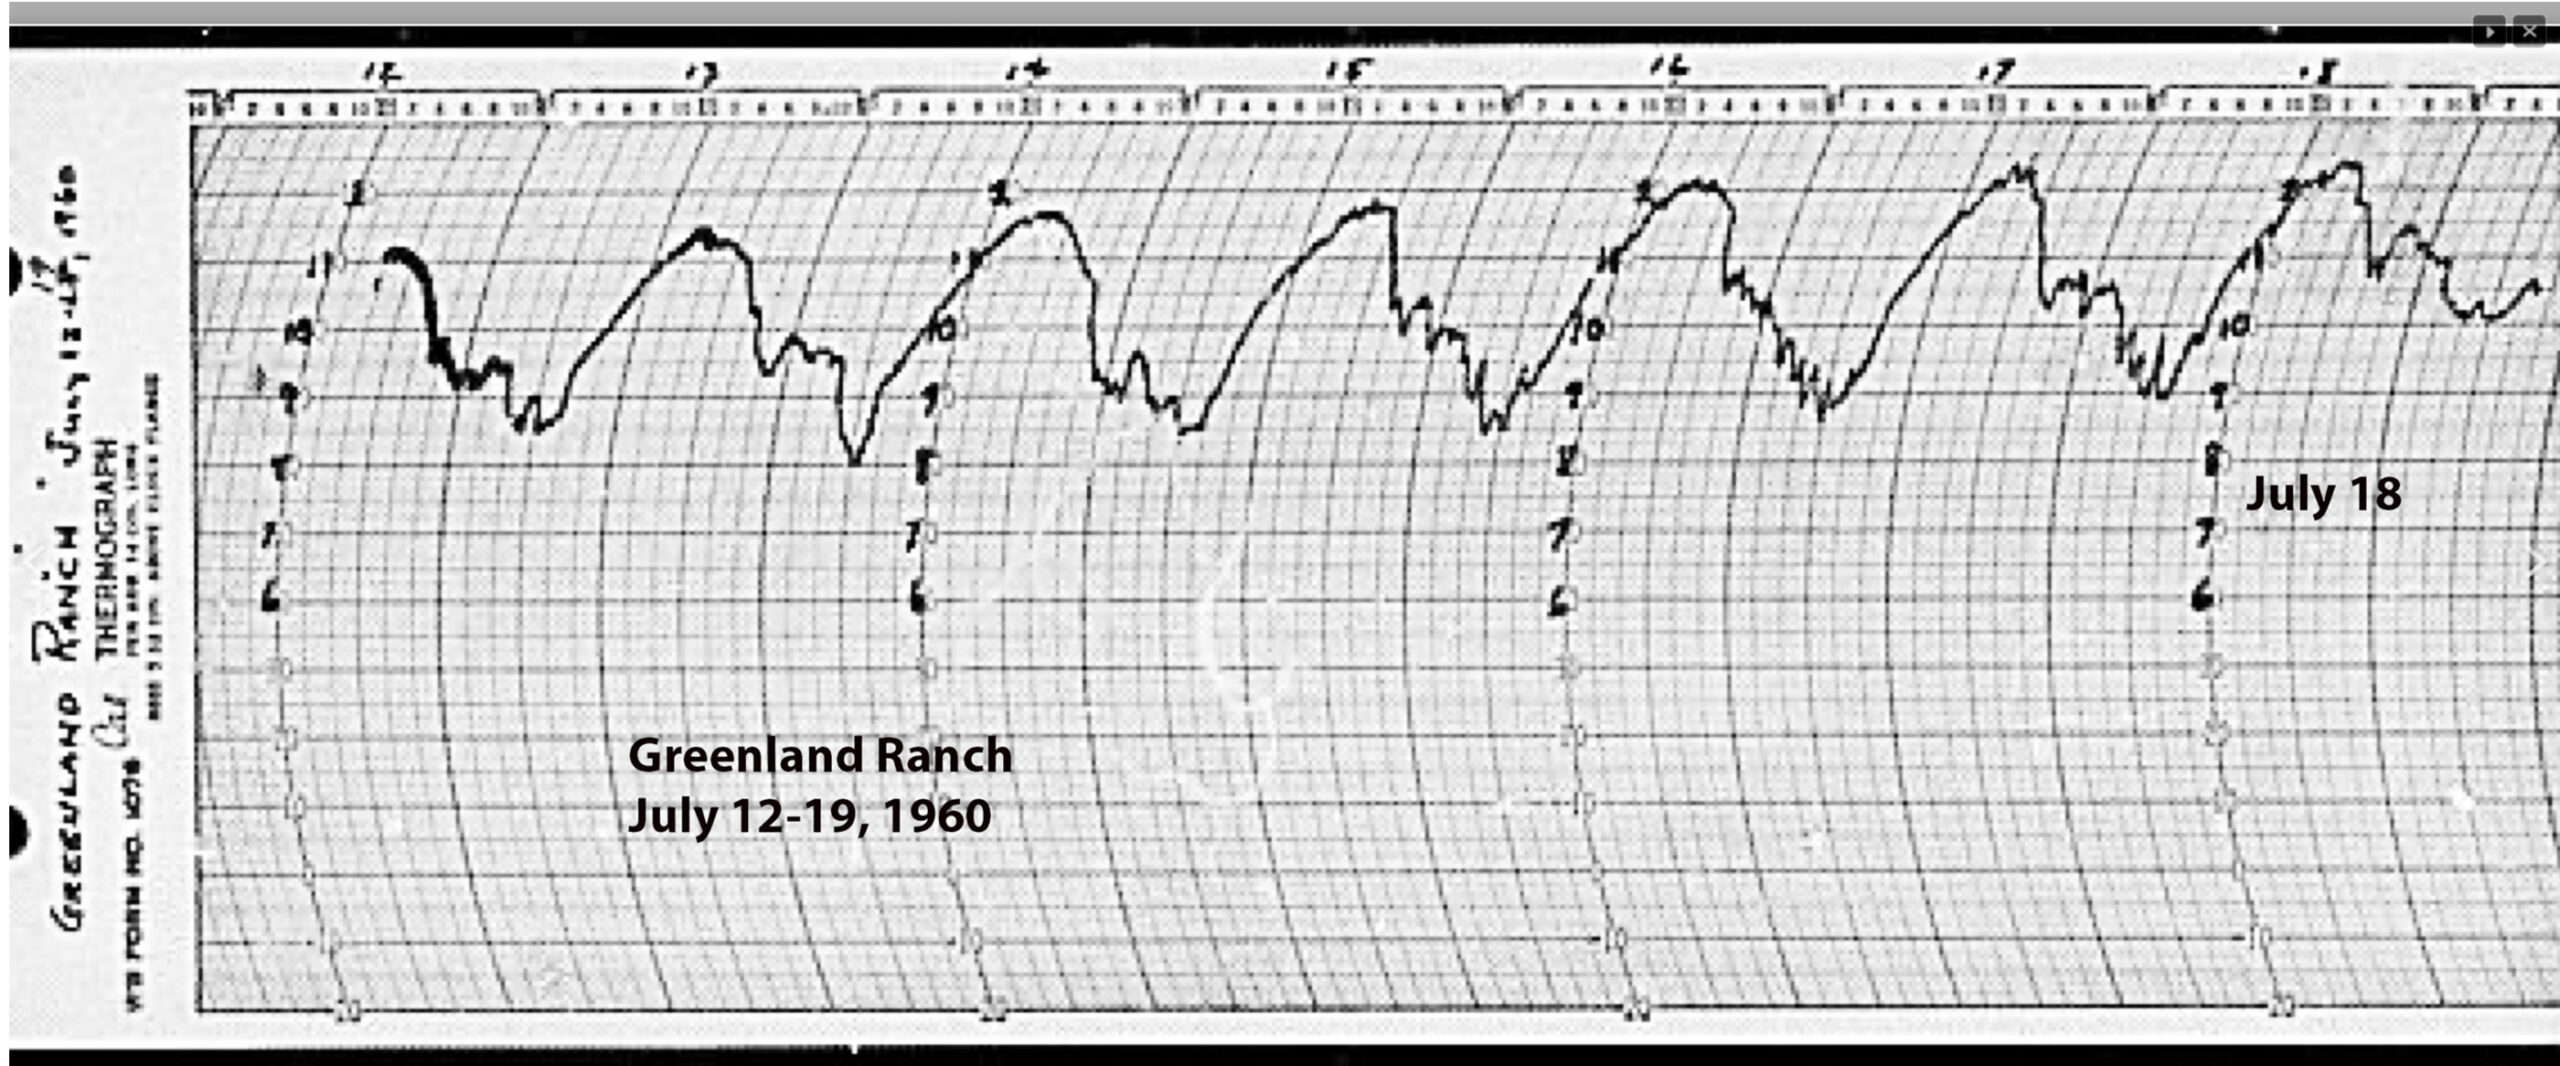
This report of 129F is not correct. The thermograph chart (below) from Greenland Ranch for July 12-19, 1960, shows a high temperature of 124F on July 18th. The temperature trace is about as high on the 18th as it was on the 17th, when the observer entered a high of 124F. The daily maximums at nearby Cow Creek also show that the 129F maximum for the 18th is suspect. For more details, scroll down to the bottom of this entry. It is likely that the Greenland Ranch observer was just not careful enough when taking the readings on July 18th, and a max temp of 124F on the thermometer wound up as 129F on the form. There have been no official steps to correct the 129F observation on July 18, 1960, as of October, 2025.
Next on the list of highest Greenland Ranch maximums (outside of 1913 and 1960) is 127F. This temperature was recorded on July 23, 1916; on July 26 and 27, 1933; and on August 12, 1933. Oscar Denton signed the form for July 1916, but the handwritten entries on the form were not made by Denton. It is possible that his supervisor re-entered the observations on a second form that was ultimately mailed to the USWB. Ross Boswell was the Greenland Ranch observer during the very hot months of July and August, 1933. The climate forms for these 127F reports are provided below.
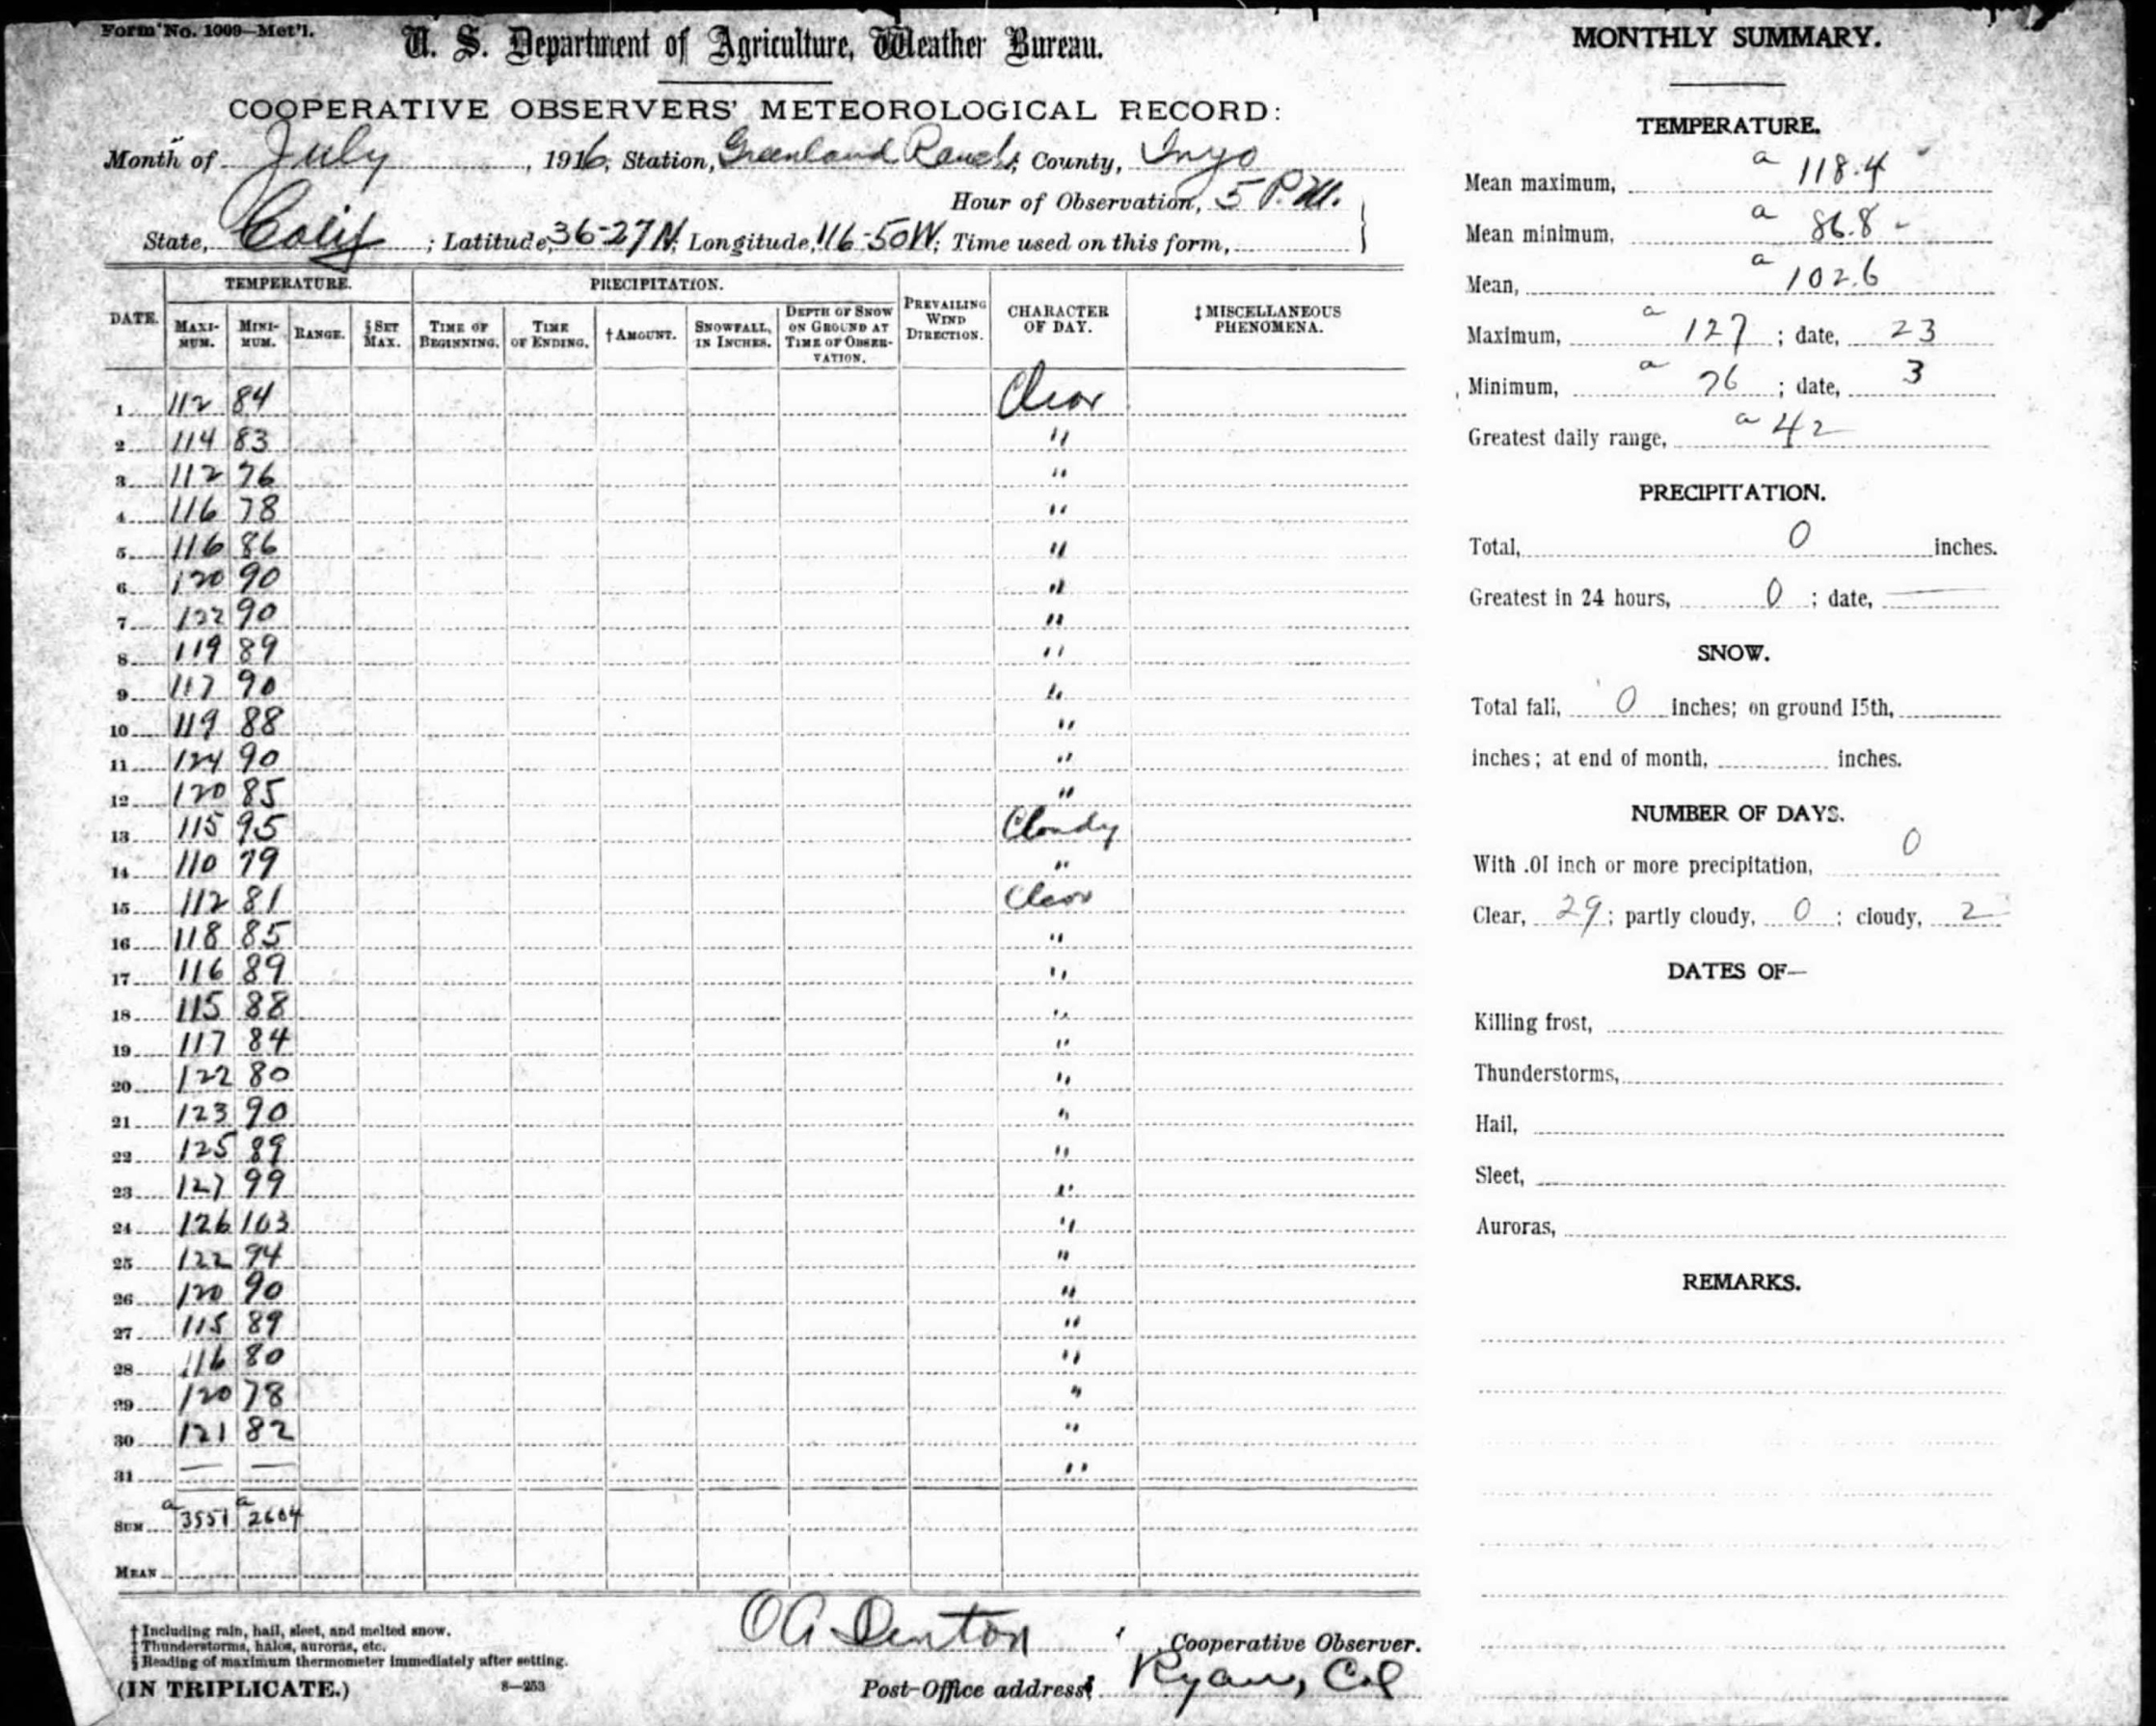
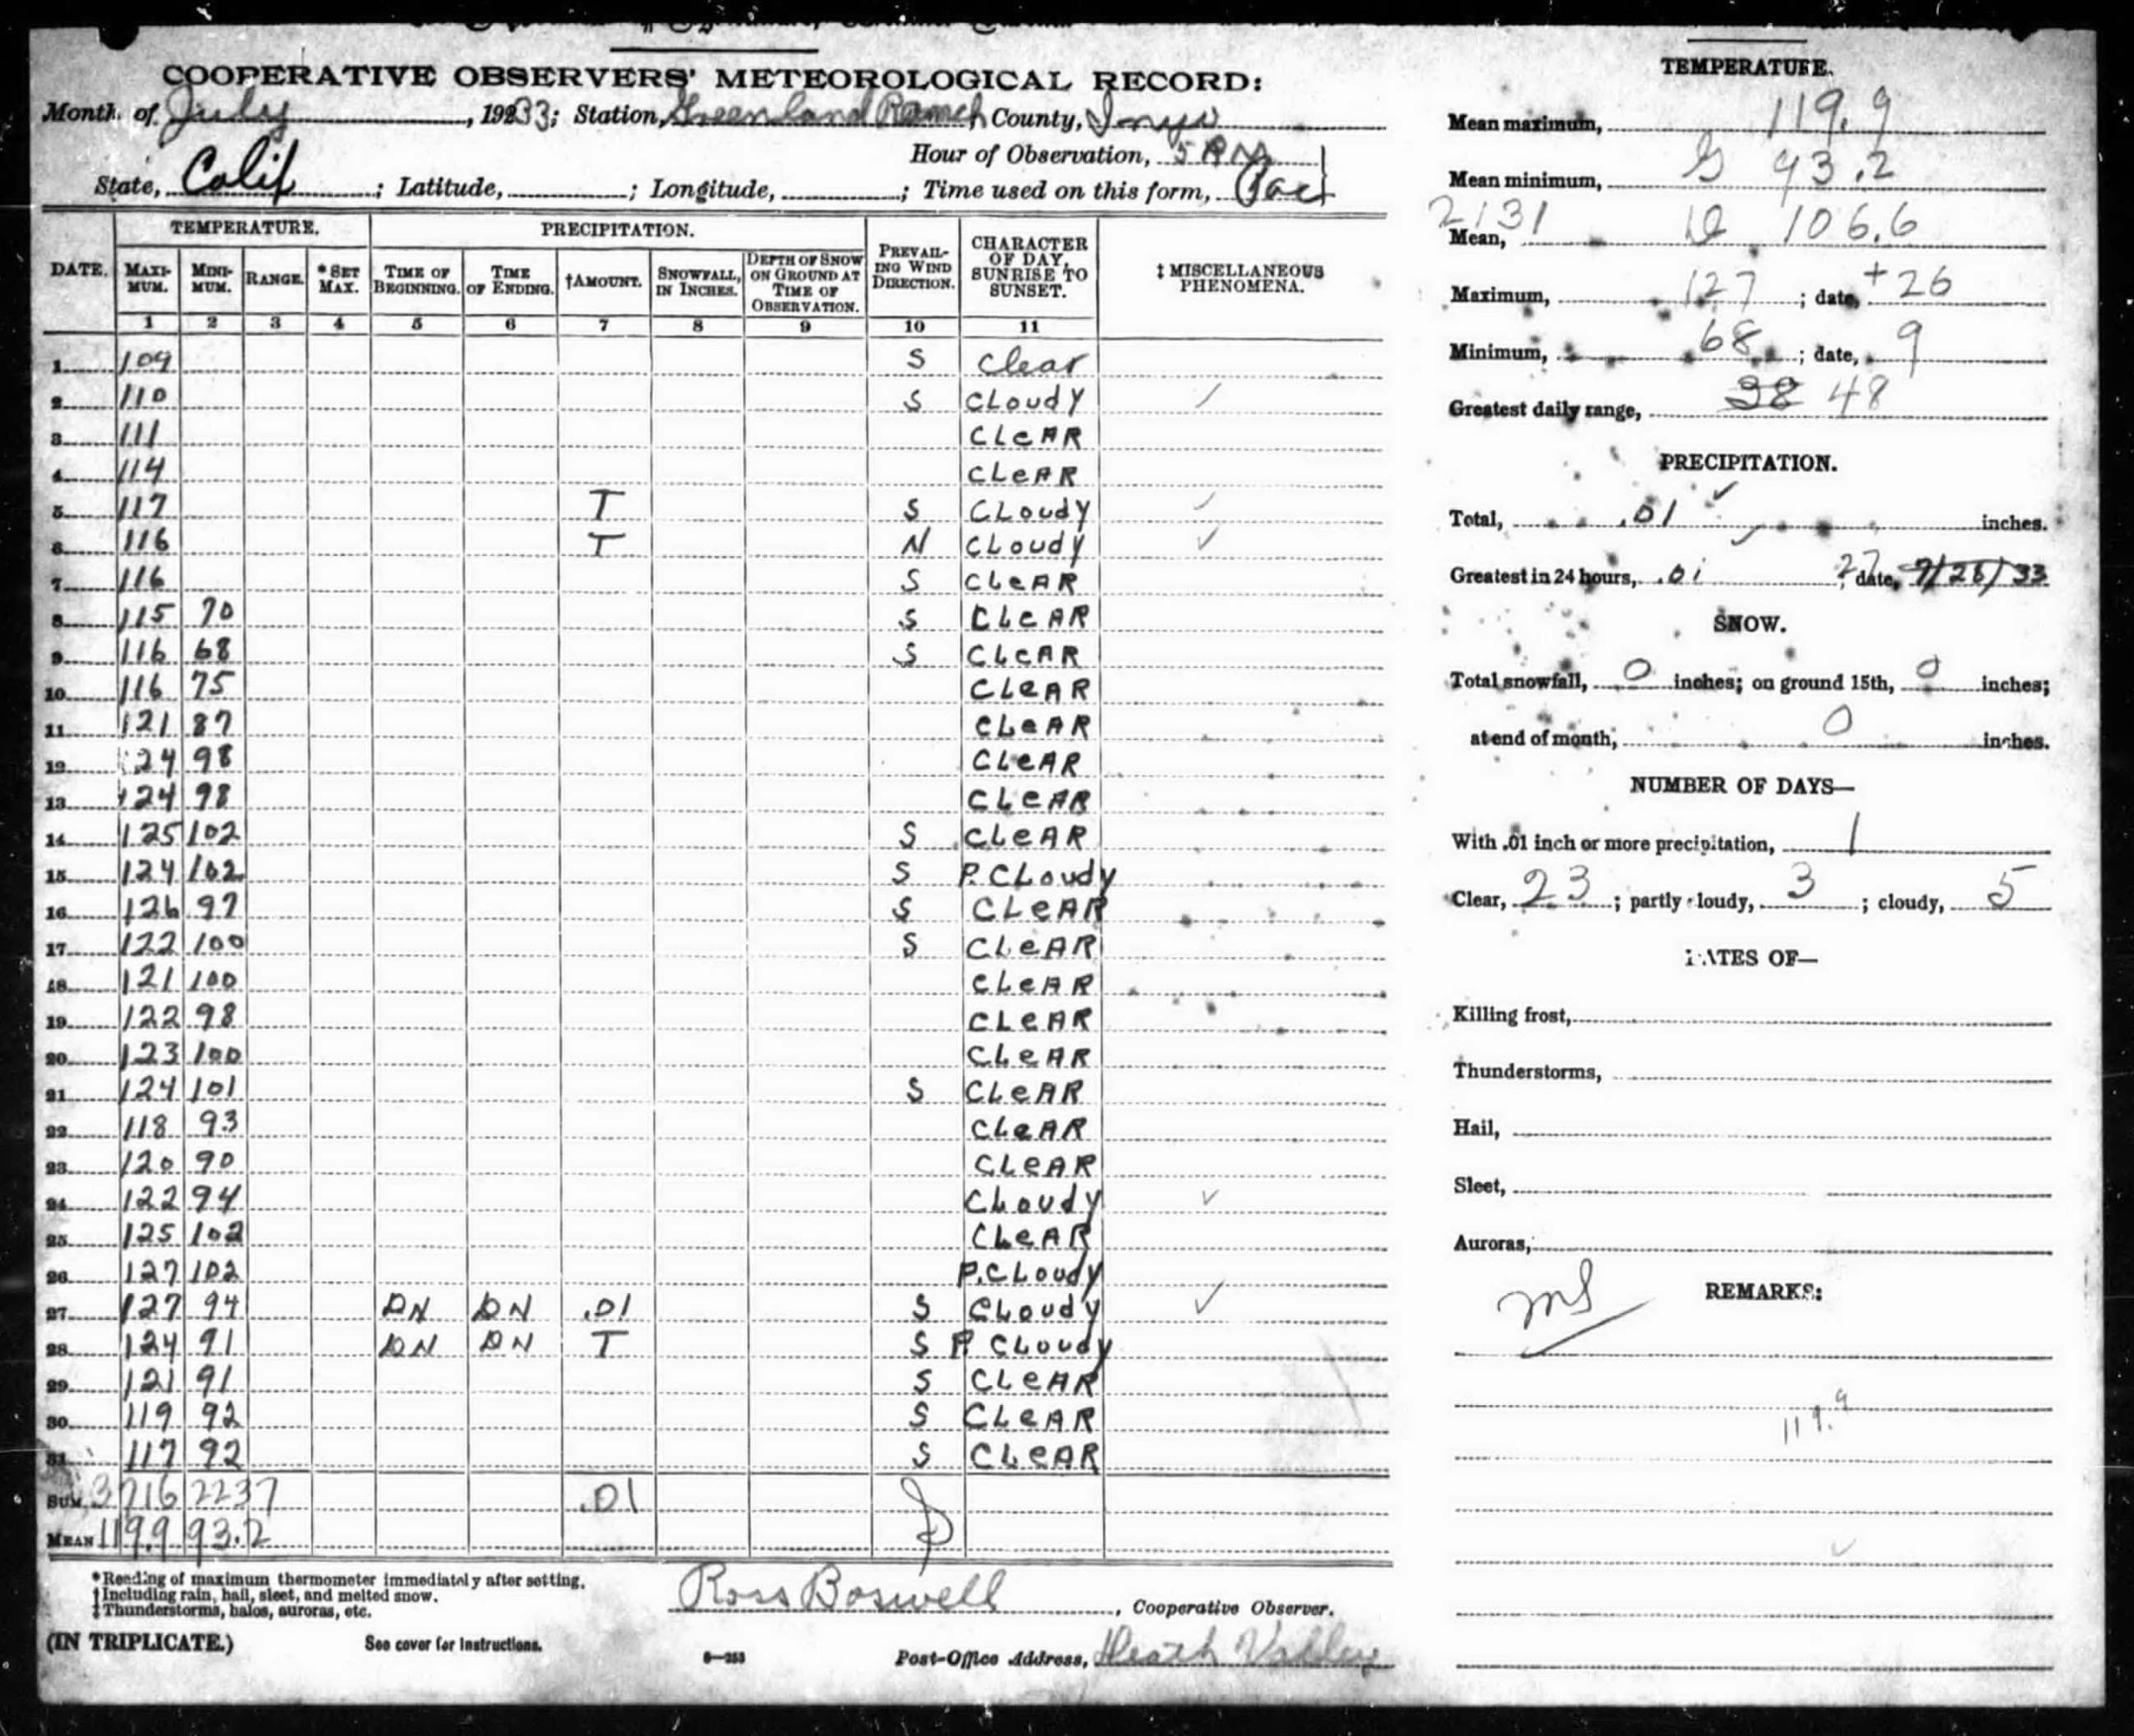
A relatively quick-and-dirty look at these 127F reports shows no obvious problems. The 127F in 1916 came when Denton was observer, and was probably from the undocumented “barren ground” shelter location. (It is thought that Denton moved the instruments from the moist location along the alfalfa field to a bare ground location which would have given higher maximums comparatively, perhaps as early as late summer of 1913.) The readings of 127F by Boswell in 1933 would have been made from the documented bare-ground location that was about 310 feet NNE of the original site. (The original site was right next to the alfalfa field.) The move to this station site, to the east of the ranch house and farther from the alfalfa field, was in 1929.
For the fifty years of record at Greenland Ranch, I maintain that the highest reliable temperatures are the 127F maximums made in 1916 and 1933. Since the climate record from 1913 to 1920 as provided by Denton is problematic, since there was an undocumented and presumably unapproved shelter move by Denton sometime during this period, and because Denton (allegedly and inappropriately) boosted maximum temperatures in 1913, one might want to stick an asterisk next to the 127F report in 1916. Such an asterisk stands for “caution!”
Maximums of 126F at Greenland Ranch were observed on one additional day in each of the months (noted above) with the 127F maximums; and also in August 1914; July 1922; July 1931; and July 1936. There were no reliable maximums above 125F at Greenland from 1937 to 1960. Contrast this with the recent run of hotter annual maximums at Death Valley, where only two annual maximums have been below 125F since 1988. I have written on the station exposure and instrumentation issues at the current Death Valley site (here and here, for starters), if you are interested in going down those rabbit holes.
Thus, only 6 summers out of 50 at Greenland Ranch had reliable maximums as high as 126F to 127F. Keep in mind that the ranch was (and is) a cool locale compared to its environs. It is probable that the evaporative effects from the ranch’s irrigated areas consistently caused summer maximum temperatures from its shelter to be at least a degree (F) or two COOLER compared to nearby areas not affected by the evaporative cooling. My temperature measurements on drives past the Furnace Creek oasis area show the local cooling (as seen about halfway into the linked video).
HIGHEST COW CREEK MAXIMUM TEMPERATURES
Death Valley National Monument was formed in 1933, and the National Park Service and USWB established an official climate station near the Park Service’s headquarters at Cow Creek in late 1934. This station was about three miles north of Furnace Creek and Greenland Ranch, at an elevation of 152 feet below sea level. This Cow Creek weather station had Park Service personnel as observers, and it closed in March 1961 when the new “Death Valley” station at Furnace Creek opened. The instruments were above bare ground. If there was any cooling effect on temperature at Cow Creek due to evaporation or transpiration, then it was likely negligible.
Reliable annual maximums at Cow Creek for its 26 summers of operation ranged from 122F to 126F. All of its days with 126F were in the Julys of 1942, 1947, 1949 and 1960. The hottest string of days at Cow Creek was July 17 to 20 in 1960, when those four consecutive dates all reached 126F (and it was 125F on the 16th). The station at Greenland Ranch had maximums of 124F on each day from the 16th to the 20th in July, 1960 (if the 129F on the 18th is bumped down to 124F). Cow Creek maximums generally averaged a degree or two F higher than those at Greenland Ranch during its period of record. This was due to the irrigated fields near the Greenland Ranch shelter which caused local cooling there due to evaporative effects.
It is unfortunate that Cow Creek was not operating during the very hot summers of 1931 and 1933. It is quite possible that an authentic maximum of 128F or 129F would have been recorded in 1933 at Cow Creek.
There was one recorded maximum at Cow Creek from 1934 to 1961 that was higher than 126F. On July 18, 1949, the observer entered “128” for the maximum temperature, and this report made its way into the July 1949 issue of Climatological Data. Here is the associated Cow Creek climate form:
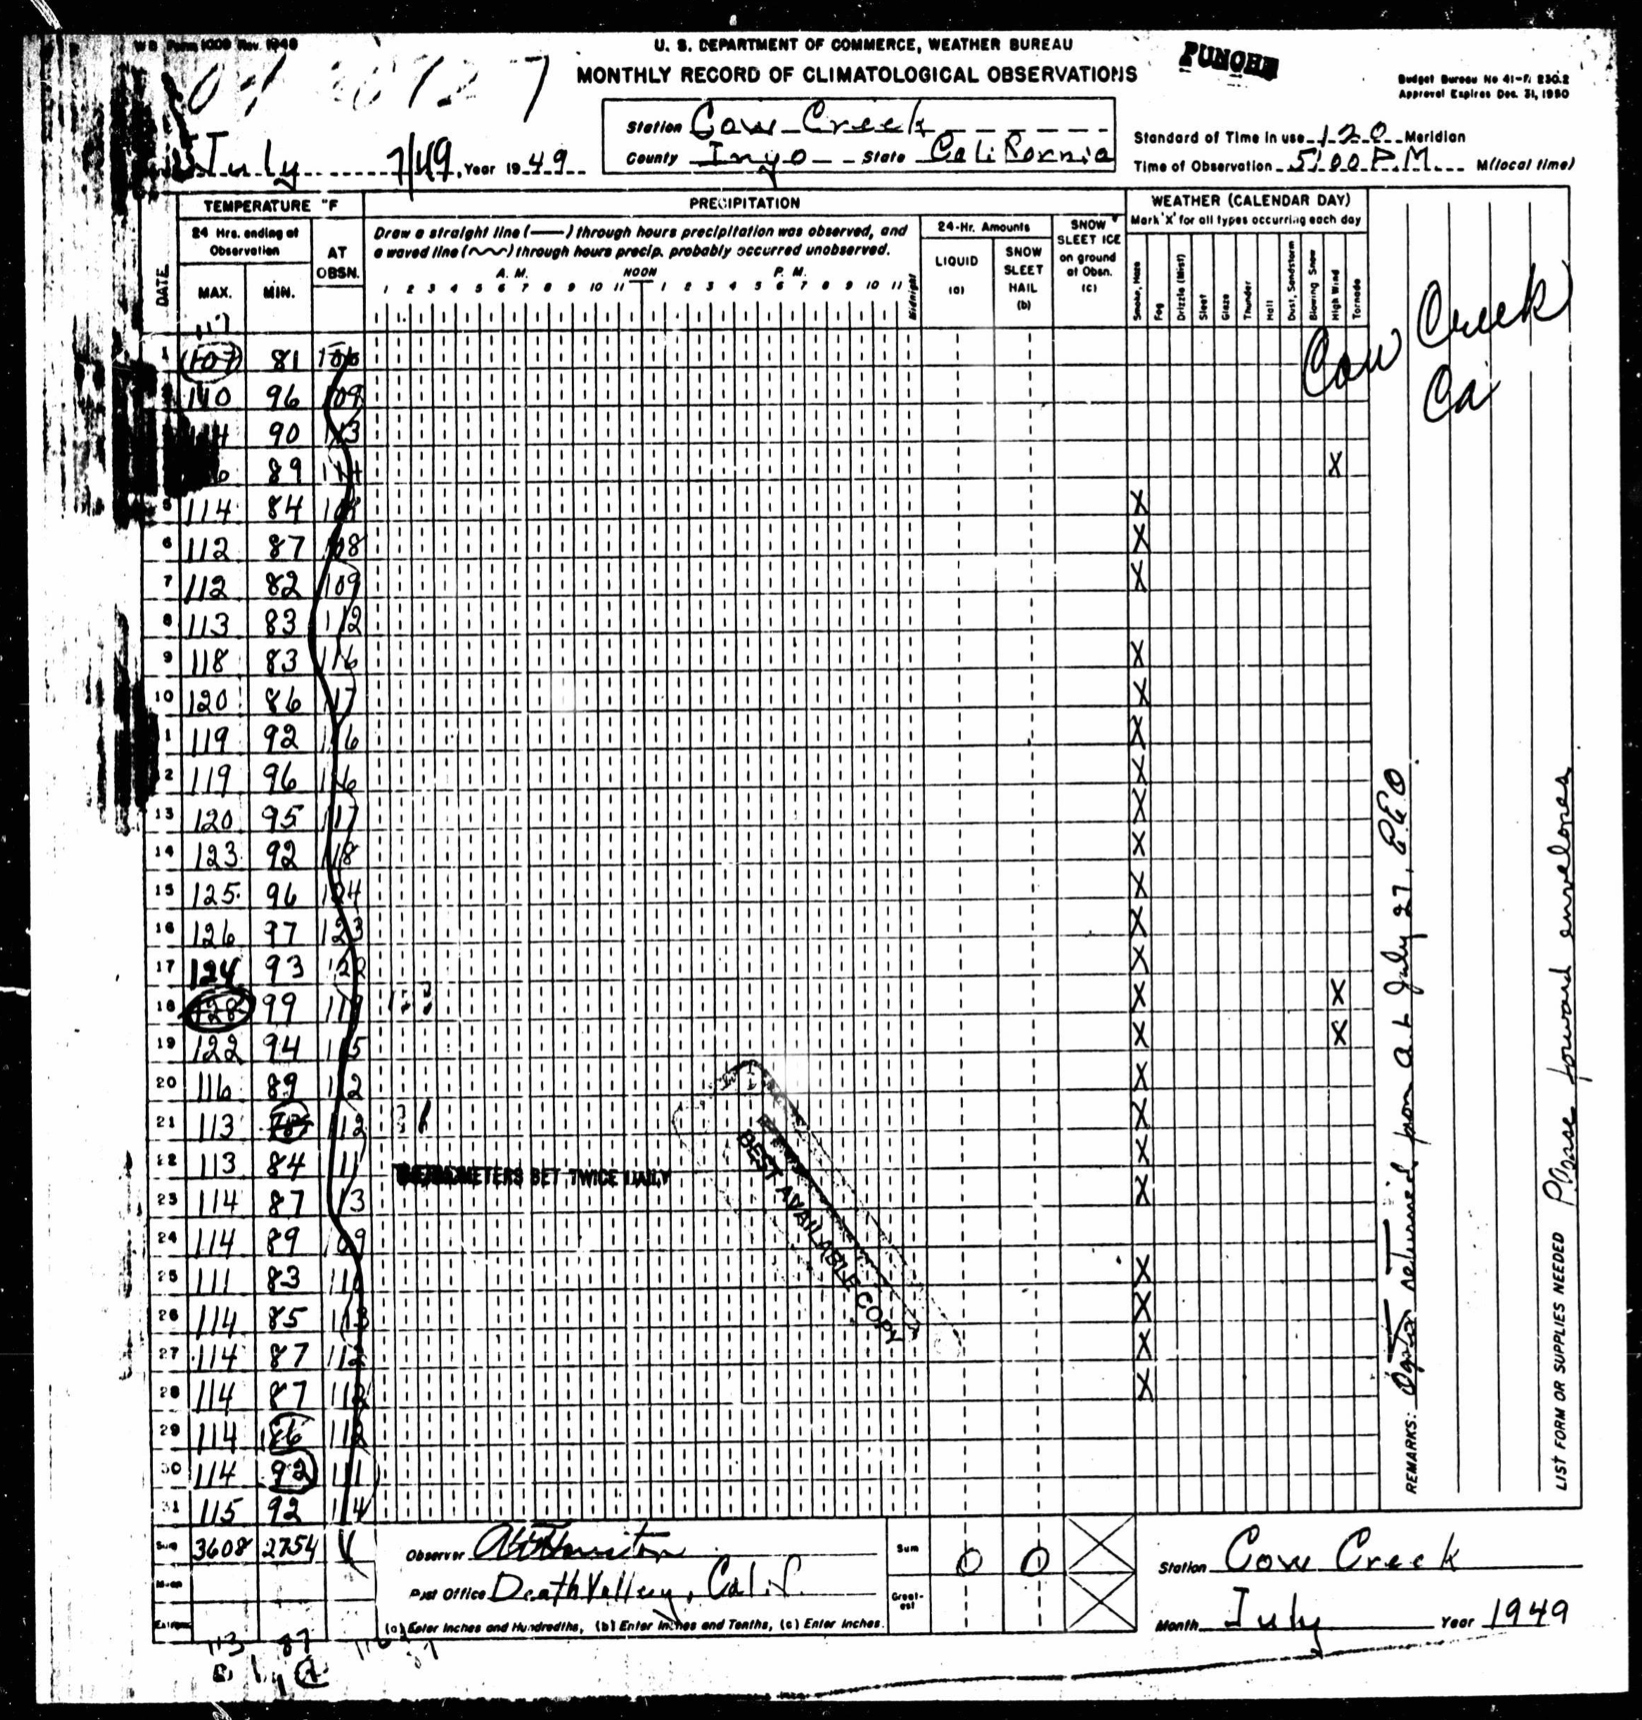
Not long after this record was made, Arnold Court noticed that the associated Cow Creek thermograph trace showed a maximum of only 123F on the 18th. In his 1952 BAMS article “Duration of Very Hot Temperatures” (about halfway down here), Court details how this entry was officially adjusted downwards to 123F in conferences with USWB personnel. The Cow Creek thermograph trace and the maximum of only 121F at Greenland Ranch on the 18th were strong arguments against the 128F maximum. Other discrepancies between the thermograph record and some max and min temp entries in 1949 were also resolved. See the July 1949 section here for more info on this incorrect observation and the associated heat wave.
Ironically, the presumably misread and bad observation of 129F at Greenland Ranch in 1960 (when its thermograph showed only 124F) was also on the date of July 18th. The 129F in 1960 at Greenland Ranch has not yet been officially adjusted downwards!
THE NEWER “COW CREEK” STATION
The California Air Resources Board (CARB) has had an automatic weather station (named Death Valley National Park–Park Village operating on the low slopes just above the Cow Creek housing area since 1994. Some details on this station are discussed in this entry. Highest reliable temperature here was 124F on July 10, 2021. This is a very well-exposed station at an elevation of 410 feet above sea level (and about 560 feet higher than the old NPS Cow Creek station). The radiation shield is WAY up on a pole, more than 25 feet above the ground. Thus, max temps in summer here are very conservative. Daytime temperatures are less apt to fluctuate due to lulls in the wind as at the official FC/DV station. Summer maximums at this CC/CARB station average a good 6-7 degrees F cooler as compared to the official NWS/NPS FC/DV station, which is just a few miles to its south. About three degrees of this typical 6-7 degree difference can be attributed to the elevation difference, with the remainder due to the differences in station exposures, ventilation, and height of the sensors above the ground.
The records for this Cow Creek/CARB station show a max temp of 125F on June 19, 2017, but this reading is not supported by regional maximums and is not credible. Did you know that electronics tends to struggle on occasion when overheated?!
So, again, the highest reliable maximum temperature from the very-well exposed DV CARB station just above the NPS Cow Creek settlement is 124F for the period from 1994 to 2025. Annual maximums here since 1994 have ranged from 118F to 124F and have averaged 120.1F. The summers of 2010 and 2011 were missing. Only 2024 (with 123F on July 7th) and 2021 (with 124F on July 10 and 123F on July 11) have had a temperature of greater than 122F at Cow Creek/CARB.
HIGHEST “DEATH VALLEY” MAXIMUM TEMPERATURES
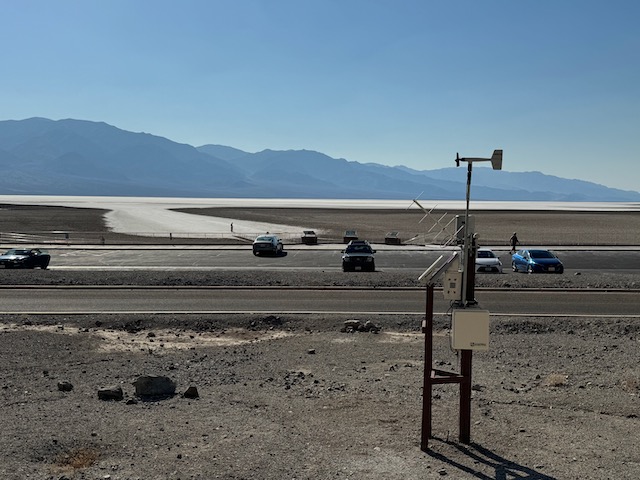
The National Park Service and the U.S. Weather Bureau closed the Greenland Ranch and Cow Creek weather stations in March of 1961. A new “Death Valley” station was established near the new NPS Visitors Center at Furnace Creek. (I sometimes refer to it as the “FC/DV” station.) This was about 2000 feet NNW of the final station site for Greenland Ranch. This Death Valley station continues to operate in 2025. Its elevation is -194 feet. You can find pictures of it here, and read about my take on its exposure and instrumentation here and here.
Annual maximums at Death Valley from 1961 through mid-July 2025 have ranged from 119F through 130F. Annual maximums during the first 30 years of record at Death Valley (1961-1990) averaged 123.3F. This was quite close to the average of 123.5F for the previous 30 years (1931-1960) at Greenland Ranch. Cow Creek averaged 124.1F on average annual maximums from 1934 to 1960. Average annual maximum temperature has jumped up to 126.6F for the period from 1991 to 2024 at Death Valley. What has caused this increase? I think it is a combination of warmer summer heat waves comparably, poorer ventilation through the weather station area due to an increase in vegetation and structures to its south, and the switch to electronic sensors in a non-aspirated radiation shield which is mounted close to metal support bars and a solar panel which heat up tremendously in Death Valley’s afternoon sunshine. The Campbell Scientific web site indicates that its non-aspirated radiation shield (which has been used at this FC/DV station for more than a decade) is associated with a spurious, unwanted, upward temperature drift in bright afternoon sunshine when wind is very light. How “too hot” can the temperature readings get with this electronic measuring apparatus? Answer: up to 1 to 2 degrees Celsius too high! UGH!
Again, the links to these radiation shield studies and associated measurements, comparisons and issues are on a web entry of mine here. The station data are here.
The highest temperature reports on record from FC/DV were on August 16, 2020, with 129.9F; and on July 9, 2021, with 130.0F.
However, regarding the max of 130F on July 9, 2021, Dirk Baker of Campbell Scientific states:
“The record-breaking number is not supported by the co-located measurements.“
The maximums of 129.9F and 130.0F on August 16, 2020, and July 9, 2021, respectively, at Death Valley (taken with the electronic and automatic CS215 sensor in the non-aspirated shield) both occurred during periods of very light wind. On July 10, 2021 (the day after the 130.0F reading on July 9) the wind was stronger during the afternoon, the closest surrounding stations were hotter than on the 9th, and the Death Valley (FC/DV) station hit 129.4F. In other words, the weather was a little hotter on July 10 versus July 9 as a whole in Death Valley and the Furnace Creek area, but the official weather station showed a slightly higher maximum on July 9th because of the weaker winds and the inadequacies of the instrumentation in combination with the somewhat compromised exposure of the instruments.
Supposedly the NWS is still in the process of testing (i.e., validating) the sensors which measured both 130F maximums at Death Valley for verification…four and five years later! I doubt that a problem will be found with the sensors, but the experts and decision-makers would be smart to look at Baker’s study and the Death Valley station exposure issues that I have written about. I would recommend that both 130F readings be knocked down a degree or two.
Are we splitting hairs and being a little too picky? Maybe. But we are talking about the record high temperature for the planet, and there should not be any reason to doubt the authenticity, veracity, precision, and trustworthiness of the data. You don’t want to have picky climatologists like me coming along with a good reason to question a report.
If the two 130s are knocked down to 128F or 129F, then what is the hottest, most reliable high temperature at Death Valley/Furnace Creek (DV/FC) since 1961? I would go with the 129.4F on July 10, 2021. Maximums of 129F have been recorded here on five additional dates, all since 1998:
July 17, 1998
July 19, 2005
July 6, 2007
June 30, 2013
July 7, 2024 (129.3F)
The two 130F readings in 2020 and 2021, and the 129F in 2024, were measured with the automatic electronic Campbell Scientific instrumentation. The 129F readings from 1998 and 2013 were read by the Park Service employee’s eyeball as he or she checked the maximum thermometer in the Death Valley shelter. (Hopefully the thermometer was turned to a vertical position.) The Historical Observing Metadata Repository web site entry for the Death Valley station indicates that an MMTS system (electronic temperature sensor) was used for determining the daily max and min temps from 1999 to 2009. Thus, the observer was, presumably, looking at a digital display in the much cooler HQ office for the maximums of 129F in 2005 and 2007. The shelter and the liquid-in-glass max/min thermometers were in use again from September 2009 to November 2015, and then the official switch was made to the electronic Campbell Scientific instrumentation. I need to do a separate entry on this crazy switching around of instrumentation at Death Valley. The station changes are not really what a research climatologist likes to see. The numerous station changes can have subtle but important implications for the climate record that the climatologist needs to sort out.
Unfortunately, because the two days with 130F (in 2020 and 2021) had very light wind and the instrumentation in use had (and have) the issues mentioned, I would claim that the most reliable, authentic high temperature on record at the Furnace Creek-area stations since 1911 is the 129.4F maximum on July 10, 2021.
Honorary mention should be given to the 127F readings at Greenland Ranch in 1916 and 1933, and to the 128F readings on both July 14 and 15, 1972, at Death Valley. The 128F maximums in mid-July of 1972 were likely the new authentic highest temperatures on record for Death Valley, and perhaps for the world, at the time of their occurrence (and well into the 1990s, too). But nobody blinked an eye or gave much notice because of the long-accepted 130F, 131F, and 134F reports from Greenland Ranch in July, 1913, and because of the (now-discredited) 136F in Libya in 1922. Well, nobody gave notice except perhaps for a few of us from the Geography Department at Cal State Northridge — shout out to Hein, Radis, Rodie, Reid and Court! It should be mentioned that these older maximums of 127F and 128F at Greenland Ranch and Death Valley were likely suppressed slightly (figure a degree or two F) due to the cooling influence of the ranch. The cooling influence on summer maximums due to evaporative effects at the current Death Valley station appears to have been mitigated, at least a little bit, in the previous few decades.
HIGHEST BADWATER MAXIMUM TEMPERATURES
About 20 miles south of Furnace Creek, nestled tightly between the steep slopes of the Black Mountains and the white salt flats of the Death Valley playa, is Badwater. Badwater Road conveniently passes right through here! The salt flats are close to 280 feet below sea level, or 100 feet lower than Furnace Creek. There is no vegetation to help cool the area (as there is at Furnace Creek). Badwater is in a bit of a “notch” or “niche” topographically which may help a little bit to weaken winds and to promote somewhat hotter maximums locally. The steep west-facing slopes nearby effectively catch the direct rays of the summer afternoon sun. Temperature comparisons through the decades (by myself and by rangers and others) have shown Badwater to typically be a couple of degrees (F) hotter on most summer afternoons compared to the Furnace Creek area. This is due mostly, I suspect, to the evaporative cooling effects in and around the ranch which reduce the temperature there a little. The difference in elevation between Badwater and Furnace Creek would help to make Badwater just a half-degree F hotter.
Badwater has had a handful of temporary and not-so-temporary weather stations. A high-end automatic /electronic station was established just to the east of Badwater Road (elevation -219 feet) by NASA scientist Chris McKay in 1998. This station operated for 22 summers until 2019, and the highest temperature recorded was a 128.1F on July 5, 2007. The exposure of this station is excellent, and the RTD sensor for temperature measurement (with aspiration!) was 1.5 meters above the ground. The maximum here on June 30, 2013, was 128.0F. A second temperature sensor at this Badwater station was 3 meters above the ground, but was not aspirated. The highest temperature from 1998 to 2018 as registered by this “207” sensor in a non-aspirated radiation shield was 129.0F, on July 5, 2007.
McKay found that summer maximums from 1998 to 2019 between Badwater and the current FC/DV cooperative station are quite similar. I would contend that the observed summer maximums between the two stations since 1998 are rather similar because the oasis/evaporative cooling effect near the FC/DV station is largely cancelled out by the issues I have been harping on: the FC/DV station has the exposure/ventilation/instrumentation/non-aspirated shield attributes which result in a small increase in temperature readings there. Thus, the 2-3 degrees F of evaporative cooling on sunny summer afternoons at Furnace Creek (generally speaking for the settlement as a whole) is now offset by the warm bias of the station.
The NWS and NPS established an automatic station at the same (NASA) Badwater site in late summer 2021 (yes, right after the high-end heat wave of July 2021). The highest maximum for the four summers thus far (2022 to 2025) is a 128.5F on July 16, 2023. From what I understand, this new Badwater station has the same Campbell Scientific instrumentation as the official FC/DV station near the NPS facility in Furnace Creek (i.e., non-aspirated radiation shield). I suspect that the better exposure and wind flow through the Badwater station (as compared to the FC/DV site) greatly mitigates the unwanted, spurious increases in temperature measurements there on sunny summer afternoons.
The NPS set up a temporary station at Badwater for much of the summer of 1934. The equipment consisted of a standard cotton region shelter and standard max/min thermometers. The climate form shows a high of 131F, but the maximums are “lined out.” I guess we can’t trust this 131F report. The highest maximum at Greenland Ranch this month was 125F. If I had to guess, the weather instruments here at Badwater were moved by the Park Service to Cow Creek, which opened in December, 1934.
A similar weather station was in place at Badwater for the Julys of 1959, 1960 and 1961. I don’t know what side of Badwater Road it was on! Maximums reached 129F in 1959, 128F in 1960, and 128F in 1961. These maximums were generally about 3 – 4 degrees F higher than the maximums registered by the Furnace Creek stations. See C.A. Scott’s study “Defining Extreme Desert Environments With Microclimatological Measurements” (1962) and the great study by Hunt et al. (1966). The Badwater maximum temperatures appear to be reliable and are supported by the data from Greenland Ranch and Cow Creek (1959 and 1960) and Death Valley (1961).
The 129F maximum at Badwater in 1959 was on July 11. The daily maximums at this summer-only station at Badwater were taken off of the thermograph, and I do not know if there were also max/min thermometers in the shelter to help corroborate the thermograph. I would suspect so…and hope so.
HIGHEST STOVEPIPE WELLS MAXIMUM TEMPERATURES (updated November 2025)
A USCRN station, dubbed Stovepipe Wells 1SW, has operated just south of Stovepipe Wells since 2004. The elevation here is 80 feet above sea level. Highest temperature through August 2025 at this state-of-the-art weather station is 128.3F on July 10, 2021. (Correction, highest here is 128.6F on July 11, 2021…see below.) Temperature reports from this station are 5-minute averages and the shields (three shields!) are aspirated. A maximum of 128 to 129F would easily support a maximum of 130F at Furnace Creek, which is 275 feet lower. (The DV/FC station had 129.4F on July 10, 2021.)
For the 22 summers from 2004 through 2025, annual maximums at Stovepipe Wells 1SW have ranged from 120.0F to 128.3F, averaging 124.0F. These values were obtained off of the station’s “monthly” summary pages.
UPDATE:
The numbers that I have been using for Stovepipe Wells maximums have come off of the “monthly” summary pages of the USCRN web site for the station. It is easy to grab the monthly extremes off of the monthly summary pages. However, the actual maximum provided on station’s “daily” summary is often slightly higher than that provided on the “monthly” sheet, and I will provide the reason why in a bit. The maximum temperatures shown on the monthly page for Stovepipe Wells 1SW for July 2021 shows highs of 128.1F on the 10th and 128.3F on the 11th. But the daily summary page for July 10 here shows a high of 128.3F, and the daily summary for the 11th shows 128.6F. Thanks to Balazs Veszeli for pointing this out. I knew that such a discrepancy on the maximums existed between the two, but I was lazy and didn’t look into it closely.
Here is the e-mail from Balazs to me of November 5, 2025, with the details!
——————–
Hi Bill,
This time I’m writing to you in connection with the maximum temperatures recorded at Stovepipe Wells.
I read the last article on your website (Highest Temperature Reports in Death Valley (and California)), which was very informative and I gained a lot of new knowledge from it.
I noticed that you have 128.3F / 53.5C on July 10, 2021 as the highest temperature ever recorded at the Stovepipe Wells 1SW station. But on the next day it was 128.6F / 53.7C:
https://www.ncei.noaa.gov/access/crn/daysummary?station_id=1105&date=2021-07-11
If we look at the monthly summary of July 2021, 128.3F / 53.5C is indeed indicated there as the extreme maximum, recorded on 11th:
https://www.ncei.noaa.gov/access/crn/month-summary?station_id=1105&date=2021-07
The fact is that it’s not a real maximum temperature, since it was 128.6F / 53.7C on that day. An explanation of the conflicting data can be found at the bottom of the following page:
„Since the minimum and maximum are computed from all 360 5-minute averages, not just the 12 values shown above, the minimum may occasionally be less than, or the maximum greater than, the minimum and maximum of the 12 5-minute values shown.”
So, we can say that day summaries contain the real maximum temperatures, and monthly summaries contain the „raw” maxima on this website.
If we are interested in the final, quality-controlled datasets, we should look here:
We can choose here the year, and then the USCRN station we are interested in. Here the temperatures are in °C.
Based on these data Stovepipe Wells recorded 53.5C / 128.3F on July 10 and 53.7C / 128.6F on July 11, 2021.
Best regards,
Balázs
Thank you, Balazs! Isn’t it nice to have readers who care about these things?
And, for your convenience, here is the full explanation on the USCRN web site on the temperature measurements for their stations:
(*) Note regarding temperature values: the station datalogger polls each of the three temperature sensors once every 10 seconds, and keeps a running average of the last 30 of these 10-second samples. This “running 5-minute average” is computed every 10-seconds throughout the hour, for a total of 360 times. The temperature values reported by the station and shown above are the running 5-minute averages from the end of each of the 12 5-minute periods during the hour, and the mininum, maxium, and standard deviation of all 360 5-minute averages. Since the minimum and maximum are computed from all 360 5-minute averages, not just the 12 values shown above, the minimum may occasionally be less than, or the maximum greater than, the minimum and maximum of the 12 5-minute values shown.
And my two cents right here to the USCRN people: “Let’s not have two different maximums per date, PLEASE!”
Bottom line: This Stovepipe Wells station had a 5-minute average temperature of 128.6F on July 11, 2021. This is very impressive for such a well-exposed and high-end station.
END UPDATE!
HIGHEST SARATOGA SPRING MAXIMUM TEMPERATURES
The RAWS station at Saratoga Spring has been in operation since 2013. It is at the southern end of Death Valley at an elevation of +198 feet. The station is on the flats, near the moist and cooler and vegetated environment (with pools!) associated with the spring. But it does not appear that the nearby spring causes much (if any) decrease in maximum temperatures on most summer days. Most afternoon winds in summer have a southerly component, and the station is a bit south of the spring.
Unfortunately, I cannot say that I am a big fan of RAWS stations. As far as I know, this Saratoga Spring RAWS station (and most or all RAWS stations) do not have an aspirated radiation shield. In my 30 years of examining online RAWS station data with surrounding non-RAWS stations, I have determined that some, or most, RAWS stations provide temperatures which drift too high in sunny conditions with light winds. Most RAWS stations enjoy excellent exposure, where the wind easily blows and where an aspirated shield is USUALLY not required. But if there is bright sunshine and if the wind is not blowing consistently at more than about 5 mph, then you can expect the RAWS temperature to be perhaps 2-4 degrees F too high. This is actually not much different than the specs for the Campbell Scientific instrumentation that is at Furnace Creek and Badwater.
Fortunately, the Saratoga Spring station is very well-exposed and ventilated. And it, like Badwater, is usually somewhat on the breezy side during the hottest part of most summer afternoons. So all-in-all, the Saratoga Spring summer afternoon temperature reports and maximums are quite reasonable. But there are the occasional very hot days when the wind is light and it looks like the Saratoga Spring temperature is a couple of degrees higher than I would expect it to be.
Annual maximums at Saratoga Spring in the southern end of Death Valley have ranged from 121F to 130F, averaging 124.9F since 2013. The maximum of 130F was on July 11, 2024, around 3 to 4 p.m. The wind was averaging only 2 mph for this hour, and the intra-hourly temperatures ranged from 123F to 130F. I suspect that a properly aspirated shield and sensor would have topped out at closer to 127F or 128F and not 130F. A few days earlier, on July 8, this RAWS station hit 129F, and wind was averaging just 3 mph. Again, that maximum is likely a degree or two too high. On the very hot day of July 11, 2021, Saratoga Spring had a 127F between 6 and 7 p.m. with very light winds. Some mid-level clouds kept the area a little cooler than the Furnace Creek and Stovepipe Wells area during much of the afternoon.
Should the 130F at Saratoga Spring be a candidate for hottest temperature on record in Death Valley? I say firmly “NO” because it is a RAWS station. The bright sun and light wind at the time of the 130F on July 11, 2024, is exactly what results in somewhat inflated temperature reports at most RAWS stations. I would not give Saratoga Spring an authentic temperature above 128F since 2013. Can we take up a collection to get this station an electric fan?
I think that’s it for the low-elevation/basin-bottom stations in Death Valley. There have been other stations at higher elevations in and close to the basin, such as Scottys Castle, Chloride City, and Wildrose RS. But these are above 3000 feet elevation and rarely (or never) hit 115F. The NPS has a thermometer shelter at Stovepipe Wells (elevation about sea level). The shelter is easily viewed from the road still. But as far as I know regular observations have not been made here since about the 1990s. In the late 1980s I contacted the NPS and they would provide the July max and min temps (which were off of the standard liquid-in-glass thermometers) to me for this Stovepipe Wells station. The maximums were typically within a degree F or two of the Death Valley/Furnace Creek station. No surprise. I don’t recall any maximums higher than 127 or 128F at this Stovepipe Wells station, and the data were never officially published.
Here is a handy-dandy review for you.
Greenland Ranch (Furnace Creek Ranch, elevation -178 feet) 1911 to 1960: highest reliable maximum 127F on four dates, once in July 1916 and three times in 1933. Eight reported maximums from 127 to 134F in July 1913, and the 129F in July 1960 are not supported, are not authentic (in my opinion), and have not yet been officially discredited (as of October 2025). Note: The 127F in July, 1916, was recorded by an unreliable observer. The report does have some support from surrounding stations.
Death Valley (Furnace Creek resort, elevation -194 feet) 1961 to 2025: highest reliable maximum is arguable. Maximums of 129.9F and 130.0F occurred in August 2020 and July 2021, respectively, and these measurements are awaiting official verification as of October 2025. But these occurred during very light winds and bright sunshine, when the (non-aspirated) instrumentation provides somewhat inflated readings (by one or two degrees F at least). There are about a half dozen other maximums of 129F here since 1961, including a 129.4F in July 2021. For now, let’s go with 129.4F as the highest reliable temperature ever measured at Furnace Creek since 1911, at both the Greenland Ranch and Death Valley stations.
Cow Creek (Cow Creek NPS employee residential area, elevation -152 feet) 1934 to 1960: highest reliable maximum is 126F in four different Julys, and on four consecutive dates in mid-July 1960. A reading of 128F at Cow Creek in 1949 was officially changed to 123F by the USWB.
Death Valley National Park — Park Village (Cow Creek CARB station, elevation +410 feet) 1994 to 2025: highest reliable maximum is 124F in July 2021. Reliable and very conservative temperature measurements are from this station due to excellent exposure on elevated terrain and a sensor high on a pole. Add a couple of degrees F for maximums which would have been measured here at a standard level of about 5 feet above the ground.
Stovepipe Wells 1 SW (USCRN station at +80 feet elevation) 2004 to 2025: highest reliable temperature is 128.6F in July 2021. Very reliable and well-exposed, with aspirated shield and temperature sensor. The gold-standard of automatic weather stations.
Badwater (various stations at about -219 to -240 feet elevation, depending on which source you believe) summers of 1931 and 1959-1961, and 1998-2018 and 2021-2025: highest reliable maximum temperatures are 129F in July 1959 in a cotton region shelter, 128.1F in July of 2007 (aspirated shield), and 128.5F in July 2023 (non-aspirated shield).
Saratoga Spring (RAWS station at +198 feet) 2013 to 2025: highest reliable temperature is about 127F to 128F. Reported maximums of 129F and 130F in July, 2024, are likely too high due to the inadequacies of the station’s non-aspirated shield. This problem is commonplace at RAWS stations. Maximums at RAWS stations can’t be trusted, especially when attained during bright sunshine and light winds. Lower sun angles (which bathe the radiation shield more fully in direct sunlight compared to the higher sun angles of midday) appear to be especially problematic in this regard. Death Valley maximums in summer are typically mid-late afternoon when the sun is lower in the sky, when more of the RAWS radiation shield is in direct sunlight, and when temperature reports might (unfortunately) edge up a few degrees F.
At these seven locales in Death Valley, the highest reliable maximum is the 129.4F at Death Valley/Furnace Creek on July 10, 2021. There have been numerous days with maximums of 128F and 129F and even a couple of 130s, but for these official stations it is my contention that the most reliable maximum since 1911 is that 129.4F at the NWS/NPS Death Valley station. Other climatologists may not agree with me, contending that the 130.0F on July 9, 2021 at Death Valley deserves the honors.
Other high maximums in California
A station near the bottom of the Salton Sink, elevation -200 feet, reported maximums of 130F in 1896 and 129F in both 1891 and 1902. This was a (SPRR) railroad depot station by the name of Volcano Springs, “on the east shore of Salton Sea,” according to the station’s substation history. However, there was no Salton Sea until about 1906, when the Colorado River spilled through a berm and the Salton Sea came to be. Volcano Springs (later called just “Volcano,” if memory serves correctly) was thus a very hot and dry and isolated and lonely place with no lake nearby prior to 1905-06. It was about five miles northwest of Niland. At an elevation similar to Furnace Creek and Greenland Ranch in Death Valley, authentic summer temperatures no doubt flirted with 125F and above on occasion. Its Substation History notes that the station and town no longer exist, and that the original Volcano Springs monthly climate records were destroyed by fire (courtesy of the San Francisco earthquake in April of 1906). My weather records from the California Climatological Data publications show 15 annual maximums at Volcano Springs from 1891 to 1905, ranging from 117F to 130F, averaging 124.3F. Unfortunately, the Substation History indicates that this train depot station did not have a standard thermometer shelter. The instrumentation consisted of a “DT” and a “3-inch SRG.” These were the dry-bulb thermometer and a rain gage. At these depots or stations with a “DT,” temperature measurements were generally made off of the dry bulb thermometer which was mounted somewhere in the shade, on a post or on a wall beneath a veranda, presumably. The thermometer would be read a few times a day, with temperature reports provided for the hours of 7 a.m., 2 p.m. and 7 p.m….give or take. Thus, the exposure may or may not have been very good. The 2 p.m. reading, which would almost always be the highest of the three observations, might not have been very representative of the day’s high, depending on the weather pattern, cloud cover, etc. The bottom line: it would be very difficult to take any reports from such a station seriously enough to include in a discussion for the state’s, the country’s, or the world’s hottest temperature ever measured.
Mammoth Tank was another SPRR railroad station, or siding, about 22 miles southeast of Volcano Springs and 17 miles southeast of Niland (and currently 20 miles southeast of the southern shore of the Salton Sea in Imperial County). Its elevation was +255 feet, and the weather instrumentation did consist of a cotton region shelter and the standard max/min thermometers. The original early records (before 1905) were destroyed by fire, and it is not known for certain (well, I don’t know) exactly when the cotton region shelter instrumentation was installed here at Mammoth Tank. The station name was changed to “Sterling” in 1916 and to “Amos” in 1926. A maximum of 128F is indicated for 1887. Annual maximums from 1891 to 1917 ranged from 114F to 124F. It is quite possible that the 128F reading at Mammoth Tank from 1887 was off of (dry bulb) thermometer on a post or on the outside wall of the depot building. In other words, the exposure may have not been adequate.
An SPRR station called “Salton” operated from about 1889 to 1907. This spot was about 12 miles southeast of Mecca at an elevation of 263 feet below sea level. It would have been drowned by the floodwaters of the Colorado River into the Salton Sink by sometime in 1907. I have annual maximums for Salton from 1891 to 1907, and these range from 118F to 127F. Like Volcano Springs, the thermometer in use here was a dry bulb thermometer which was read at 7 a.m., 2 p.m., and 7 p.m. by the Southern Pacific Railroad agent. Most of the original records from Salton were lost to the San Francisco fire in 1906.
One of the hottest spells for the Salton Sink and the Coachella Valley was July 5-8 in 1905. Maximums for the event included 128F at Volcano Springs, 124F at Mammoth Tank, 120F at Salton, 125F at Indio, and 122F at Palm Springs.
This is a good spot to copy and paste the blurb by Christopher Burt regarding the highest maximums from these railroad stations in the Salton Sink:
130° (54.4°) Aug. 17, 1885 Amos (Mammoth Tank), California, USA
SOURCE: Climatology of California, U.S. Dept. Of Agriculture Bulletin L, 1903
NOTES: the Southern Pacific Railroad maintained several weather stations in the Colorado Desert region of southern California during the 19th century as watering stations for trains using their lines. It is likely that the thermometers and shelters and, most importantly, exposure location of these, was not up to official standards. Mammoth Tank, recorded 128°-130°F every summer between 1883 and 1887. After 1887 it would appear that there was some change in the instruments or shelter exposure since no temperature higher than 122° was reported (from 1887-1903). The old sites of Volcano Springs and Salton (now submerged under the waters of the Salton Sea) once reported temperatures of 129° (June 23, 1902) and 128° respectively. Instruments were most likely overexposed.
My notes don’t go back far enough to show the 128-130F maximums at Mammoth Tank, back in the mid-1880s. It appears that both Mammoth Tank and Volcano Springs recorded a 130F temperature. But, again, the exposure of the thermometer (and perhaps absence of a thermometer shelter) probably resulted in somewhat inflated temperatures. A little more information is provided by Willson in his Monthly Weather Review article “The Hottest Region of the United States:”
“It appears strange that General Greely should give the record of 128F in July, 1887, at Mammoth Tank, Cal., as the highest when the records at that station show 130F on August 17, 1885, as stated in the Weather Bureau Bulletin L. The old station at Volcano Springs, now under the waters of Salton Sea, has a record of 129F on June 23, 1902, and of 128F on July 5, 1905. This latter record was reached on a Weather Bureau standard maximum thermometer exposed in a standard shelter.”
This information by Willson casts doubt on my claim that Volcano Springs had 130F. Another in-depth investigation is warranted…someday. The Substation History for Volcano Springs does NOT indicate that a standard thermometer shelter was in use there, contrary to Willson’s statement. Yes, I know — these old records from these long-gone railroad stations are rather problematic for the climatologist, but they are kind of fun and better than nothing. The history of this area and the flooding into the Salton Sink is quite interesting. Google “The Railroad in the Salton Sink” for additional details and a good timeline on the birth of the Salton Sea. If the Salton Sink were still bone dry, then no doubt many summertime maximums there would consistently rival those in Death Valley.
I found an old account online of someone’s experience on the train through the Salton Sink in mid-May 1897, and it provides a little bit of information on Volcano Springs:
There is not much doubt,” continued Mr. Steere, “but what ages upon ages ago all this immense basin was the bottom of a great sea. You can see upon the sides of these barren bluffs and upon those walls of rock the mark of the water line that for thousands of years perhaps have withstood the ravages and test of time. This little station is called Volcano Springs because of the number of springs in this locality that are apparently of volcanic origin. They are not in operation at the present time, but certain seasons of the year they are very active and spout up mud and water to a height of from 10 to 25 feet.”
A thermometer hanging in the doorway of the station, in the shade, registers 101 degrees, and it is not unusual, we are told, for it to reach 125. It is actually too hot in the sun to stand still; it almost takes one’s breath away.
The WRCC (Western Region Climate Center) web site shows a maximum of 129F at Niland (elevation-125 feet) on August 23, 1915. A maximum thermometer is indicated for this station, but not a standard cotton region shelter. The day prior to the 129F was only 114F, and the max temp on the day after was only 109F. I don’t think that this 129F at Niland is valid. (The high temp at Mecca in August, 1915, was 117F.)
In about 100 summers of temperature measurement at Mecca (elevation -175 feet), from 1905 to 2019, the highest temperature observed was 126F in September, 1950. I visited this station around 2004 when it was in a confined yard of a fire station. The exposure was not good.
Highest temperature at Thermal Airport (elevation -120 feet) from 1950 to 2025 was 126F in July, 1995. A little farther northwest, at Indio and Palm Springs, the long climate records show maximums of 123F. Needles (city) and Needles AP have reached 125F. I think that Palm Springs AP has reached as high as 124F-125F rather recently. Iron Mountain has had a couple of 127F maximums, but all other annual maximums are 122F or less. Iron Mountain’s 127F from 2013 is almost certainly invalid due to an electronic glitch.
Blythe city and Blythe AP have been as high as only 122F and 124F, respectively. Needles city and Needles AP both had 125F. Gold Rock Ranch had 127F in July 1995, but this reading looks rather inflated compared to its other annual maximums. Bullhead City and Laughlin have hit 126F and 125F, respectively. Yuma-area stations have been as hot as 124-125F. Tacna, AZ, had a 126F in July, 1995. Perhaps this is sufficient support (along with Thermal’s 126F) to support the 127F at Gold Rock Ranch in California!
In the farmlands of the Imperial Valley, the long-lived cooperative stations at or near Imperial, Brawley and El Centro have had maximums of (only) 122F since the 1910s. Imperial managed a 124F in July 1905. I suspect that the valley’s widespread irrigated areas effectively keep summer maximums here from soaring into the mid-upper 120s in many summers. The Imperial Valley was turned into farmland around 1900 when water was diverted into it from the Colorado River. The area airports (KNJK at El Centro and KIPL at Imperial) have likely managed some maximums above 122F. I have yet to look into those records.
A look online for “hottest temperature in Arizona” gives 128F at Lake Havasu City in June 1994. However, the maximums here during the summers of the 1990s suggest an exposure which was poor and which allowed heat to build up around the shelter. I think that NWS Phoenix still recognizes this 128F report. I have read reports somewhere that the report is known to be from a poorly-exposed locale and that it should be discredited. Maybe it has been. Someone check with the Arizona state climatologist, please. Burt briefly mentions exposure and instrumentation problems at Arizona stations around this period, with reference to this informative article which discusses spurious maximum temperatures at Tucson, largely due to non-aspirated instrumentation. Sound familiar?!
That pretty much covers most of the long-term and reliable United States stations which have reported maximums in the mid-and-upper 120s. Perhaps the overall screaming messages for this write-up are:
—There have been reports of 130F at Death Valley/Furnace Creek, at Saratoga Spring, and at Volcano Springs and at Mammoth Tank in the Salton Sink, and at Greenland Ranch in Death Valley with 130F, 131F, and 134F in July, 1913.
—But it is arguable (for various reasons) that none of these are solid enough to be eligible for “hottest reliable temperature on record” for the state, the country and the planet. The Death Valley maximums of 129.9F and 130.0F in August 2020 and July 2021 are likely the most legitimate of the 130F-plus reports mentioned here, but again the mediocre ventilation through the Death Valley station site and the non-aspirated thermometer shield which allows spuriously high readings in bright sunshine and weak winds throws a monkey wrench into those two reports.
—I still like the 129.4F on July 10, 2021, at Death Valley (official Furnace Creek station near the NPS Visitors Center) for most reliable highest temperature report and measurement in California. So far, a legitimate maximum temperature of 130F from a sensor in an aspirated shield or off of a maximum thermometer (which we 100 percent know was inside of an adequately-sited thermometer shelter and correctly read by a careful and reliable observer) has eluded the climatological community. Given all of the 128s and 129s at the stations mentioned here, maybe the title of this article should be: “130 Degrees Is Just a Little Too High.”
Leave a Reply
You must be logged in to post a comment.