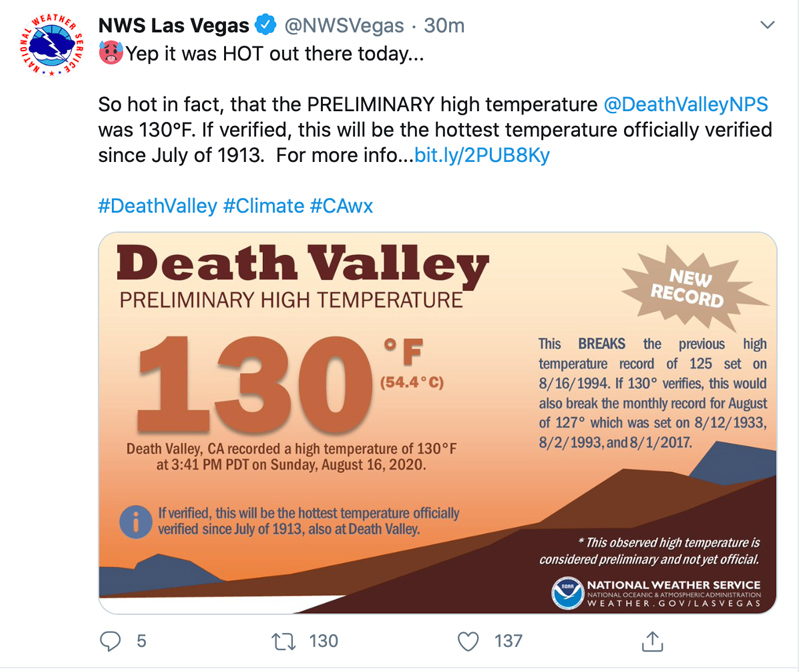
130!!
The official National Weather Service station in Death Valley, at the National Park Service Visitors Center in Furnace Creek, registered a high temperature of 129.9F at 3:41 p.m. PDT (2241Z) today/Sunday/August 16, 2020. This reading came off of the Campbell Scientific weather instruments in the fenced weather instrument “corral” that is just northwest of the visitors center building. This reading is 0.7F higher than the 129.2F maximum of June 30, 2013. That temperature was from the liquid-in-glass (mercury) maximum thermometer in the standard wooden weather shelter (which is also in the corral). The reading today, rounded up to 130F, is generally considered “provisional,” or not officially official yet, as NWS personnel may want to verify the measurement. It is the hottest maximum temperature EVER recorded from cooperative weather stations in the Furnace Creek area, outside of 1913. Official reports began here in 1911 (Greenland Ranch, 1911-1960/Cow Creek 1934-1960/Death Valley 1961-present). The station elevation is 194 feet below sea level. (By the way, today’s official electronic instrumentation was installed in 2012. It did not become the “official” station instrumentation, replacing the shelter, until 2015.)
Pictures of this Death Valley weather station are on a blog post from July, 2017. Scroll about 2/3 of the way down for those.
I was interviewed by THE VERGE online news site regarding the record. The article discusses some methodology on what happens in order to get the record verified. They have a quote from me that I do not recall saying, and which makes little sense. Oh, well. Maybe I had not had my Mountain Dew yet that morning.
NPR has a decent article on the record. And, this one in Fortune mentions my research on the old record. The Washington Post’s Capital Weather Gang has a similar article.
I visited the Death Valley weather station on the day after the 130F reading and took a bunch of pictures. These and some additional analysis will be in a separate post. The NPS ranger at the Visitors Center told me that the maximum thermometer in the adjacent thermometer shelter read 129F that morning. Thus, the automatic (electronic) sensor measured a temperature almost a full degree hotter than the older shelter instrumentation. The older equipment remains as a backup and as a check on the electronic equipment. This IS the most important weather station in the world, you know!
******
EDIT/UPDATE (September 2021): An e-mail exchange in late summer 2021 with a forecaster from the NWS office in Las Vegas, who was and is familiar with the Death Valley station, confirmed to me that the (old) thermometer shelter instrumentation at the NPS station in Furnace Creek is no longer maintained by the NWS, and has not been maintained or officially checked by NWS/NOAA officials for more than a year. I.e., the thermometers inside of the thermometer shelter are no longer the official instruments for temperature reports, and they may (or may not be) in good working order. Further, the NWS employee told me that maximum thermometer was observed to have had a separation in the liquid column during a visit to the station around the time of this record in August, 2020. This observation matches that of an acquaintance of mine who also noticed a separation in the maximum thermometer in July of 2021. It is believed that this separation would, or might, result in maximum temperature values that are a degree (F) or so too high. This estimate is by my friend an acquaintance who is familiar with the thermometer. But, the main point is that any observations or data from thermometers in the shelter after about 2019 are probably problematic to some extent (and these are not official and not published anyway, but I think that it is worth noting these things here for the record!). Apparently the NPS still has a ranger going out each morning to the station to check the thermometers and rain gage. The NWS reported (in summer of 2021) that they no longer ask or require the NPS to do this task.
******
So, the burning question of the day is: “Is this reading of 130F authentic?” The early thinking is “yes,” as THERE IS the support of the 129F measurement from the thermometer in the shelter. The Death Valley station had a bit of an unusual “jump” in temperature from 1 p.m to 2 p.m., which raised some eyebrows among longtime Death Valley temperature watchers. The jump was from 121F to 127F as the wind shifted from S to E. The temperature went back down to 125F at 3 p.m., but then jumped up to the 129.9F at 3:41 p.m. These relatively large jumps are somewhat unusual. More on that later. What are the chances that this reading of 129.9F is invalid? I would put the chance that the reading is more than a degree “off” at only 1%. But, weird stuff does sometimes happen to electronics during abnormally hot conditions. The all-time high temperature record at downtown Los Angeles was a 113F in September, 2010. Moments after reporting that temperature, the station died. The temperature could have gotten hotter, but we will never know! A California desert station called “Iron Mountain” had a wildly high temperature of 127F at the start of the June 2013 heat wave. The same thing happened in June, 2008. These are both five degrees higher than all other maximums at Iron Mountain for the period from 1935 to 2020. I suspect that a faulty electronic system is responsible for the 127F readings at Iron Mountain.
The Death Valley instrumentation will be tested in the coming months to verify the 130F temperature. This brings up the question: why are they doing this if the all-time high temperature record is 134F? Perhaps someone has been reading my 134F blog and has figured out that the 1913 reports are indeed a little bit far-fetched. Another question: Does Death Valley get a nice, new replacement weather station while the current instrumentation gets checked?
This entry is basically made to share and archive a bunch of weather information associated with the record, such as weather maps and hourly weather data from surrounding stations. Some analysis by me is below.
My research has shown that the reports of 130, 131, and 134F at Greenland Ranch in 1913 are bogus. Thus, today’s temperature of 130F IS, presumably, the hottest reliable maximum temperature on record for Furnace Creek and Death Valley, for California, for the United States, and perhaps for the world. 130F at Death Valley on August 16, 2020! Who would have thought that the place would hit 130F in mid-August?! The previous record for August was 127F, in 1933, 1993, and 2017. The record for July is 129F, attained in 1998, 2005, 2007 and 2013. Remember, the 129F on July 18, 1960, at Greenland Ranch is not authentic. The actual thermograph record for that week shows a temperature trace up to only 124F on the 18th. The same chart shows the trace up to 124F on the previous day, when the reported high was 124F. The highest reliable maximum at Greenland Ranch from 1911 to 1960 was only 127F.
If you are interested in a semi-quick read on why the 134F record is not authentic, then check out the WU blog post by myself and Chris Burt here.
For a very detailed analysis of my Death Valley research, check out my web site here, with links to a bunch of entries.
I am still working on getting the old 134F record officially overturned.
Here are two products from the Twitter feed of HPC (Hydrometeorological Prediction Center) on Sunday afternoon:
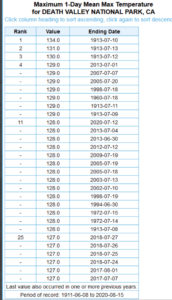
The listing on the left shows all of the maximum temperatures of 128F and above (with some recent 127s) at Greenland Ranch/Death Valley since 1911. The maximums from 1913 are not supported by the climate record of Death Valley nor are they supported by the data from the other closest stations in operation in July, 1913. It is my contention that the observer at the time “fudged” the actual high temperatures upwards by about 7-9 degrees, based on other thermometers at the ranch. (Or, the observer moved the official equipment from its intended location to a hotter area.). And, as mentioned, that 129F in 1960 is five degrees too high, so throw that one out.
One other important note: Notice that about all of the 128 to 129F maximums in the table above are since the mid-1990s. (One exception is the mega-heat wave of mid-July, 1972, with two consecutive 128F maximums.) This is PROBABLY because the Death Valley weather station exposure has deteriorated through the decades. An increase in vegetation and some man-made structures not too far south of the station have resulted in poorer ventilation through the station area. Since the station is above a bare and sandy surface, hot air along the ground during afternoon sunshine is less effectively mixed away from the instrumentation. The result is higher temperature readings during the afternoon comparably. I figure that most summer maximums at Death Valley today are a couple of degrees higher because of the poorer station exposure. A day that hits 125F today probably would have only been as high as 122F to 123F before 1980. And, yes, I suspect that if today’s conditions and exposure at the Death Valley weather station were as they were in the 1960s and 1970s, then the high temperature on August 16, 2020, would have been closer to 127F than to 129.9F.
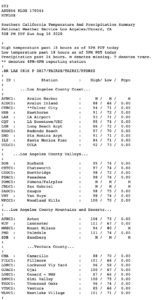
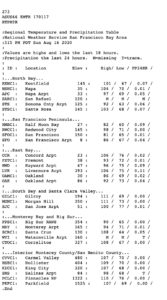
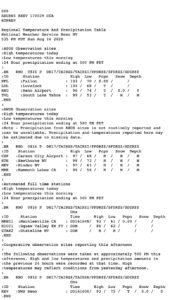
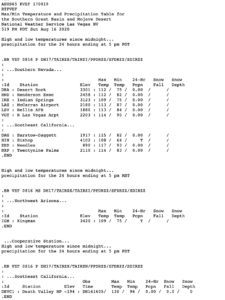
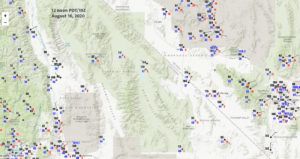
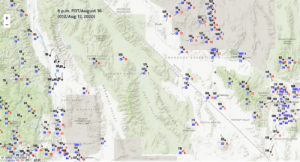
Okay, let’s look at some tables. These are the late afternoon RTP (temp/precip) tables for the region. The one out of Las Vegas, with the Death Valley 130F, is at the bottom.
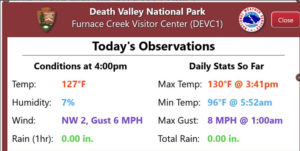
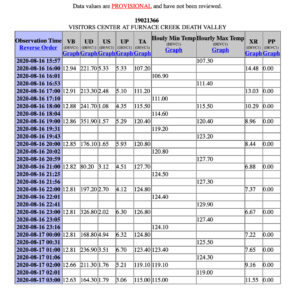
Below are a couple of screen grabs from NOAA sites providing the hourly weather information from the NWS Death Valley station at Furnace Creek. The first graphic shows a high of 129.9F between 3 and 4 p.m. (between 22 and 23Z), as the highest and lowest temperatures attained between each hourly report are provided.
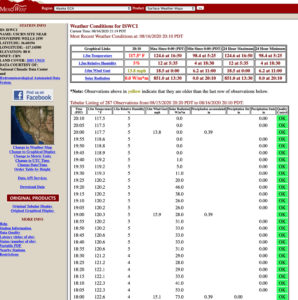
Below are the 5-minute temperature observations from a very reliable station near Stovepipe Wells, in Death Valley at an elevation of 80 feet. This well-exposed station reached 125F on August 16th, 5 degrees lower than Death Valley’s 130F. The elevation difference between this Stovepipe Wells station and Death Valley/Furnace Creek would generally mean a 1.5 degree (F) difference in summertime maximums. The difference in station exposures is probably responsible for a good chunk of the rest of maximum temperature difference this day.
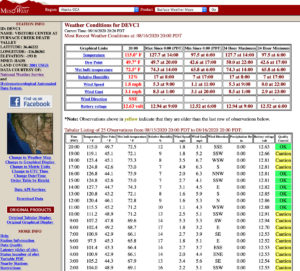
Below are the hourlies from the CARB (California Air Resources Board) station in Death Valley near Cow Creek, elevation 410 feet above sea level. The sensor is WAY up above the ground, around 30 feet up, so temperatures are very conservative compared to shelter-level temperatures on sunny summer afternoons.
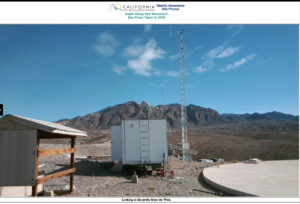
The CARB station’s web site indicates that the hourly temperatures provided are the HIGHEST temperatures measured during the previous hour. This well-exposed station (see CARB photo above) showed an ENE wind towards sunrise, and then winds slackened considerably from 9 a.m. to 2 p.m. PDT. A South to SW breeze developed from about 4 p.m. to 8 p.m. PDT. The lowest hourly temperature during the morning was 106.5F! Since it is on the slope of an alluvial fan, some 600 feet or so above the valley floor to its west, and since the station’s thermometer sensor is well above the ground, this station is generally situated above the basin’s nighttime radiation inversions. (Minimum temperatures at this station are usually warmer than those at Furnace Creek, even though it is higher in elevation.) The highest hourly temperature here on the 16th was 121.1F, at 5 p.m. (This temperature occurred sometime between 4 and 5 p.m.) The difference in high temperature between the CARB station and the NWS Death Valley station on August 16th was just shy of 9 degrees!
Why would the two stations be so far apart on maximum temperature? They are only three miles apart, and the elevation difference is not that great (-194 feet versus +410 feet). Both are above bare ground. I think that it would be helpful for the reader to understand! These are the primary reasons for the discrepancy:
1) The Furnace Creek station has an advantage of about 3 degrees (F) due to its lower elevation (versus the CARB station). Lower elevation stations are generally hotter on sunny summer afternoons due to good air mixing and compression. Maximum temperatures generally decrease with increasing elevation at a rate of 4.5 degrees (F) per 1000 feet. Death Valley is the hottest area in the region on most sunny summer afternoons because it is the lowest in elevation.
2) The temperature sensor for the CARB station is near the top of a 10-meter mast. (Additional details for this COW CREEK/DV CARB station are on this Stormbruiser entry, about 3/4 of the way down. On sunny afternoons with relatively light winds, the air at five feet above the ground (where the NWS Death Valley/Furnace Creek temperature sensor is) is going to be hotter than air 25 feet higher (where the CARB sensor is). I would hazard to estimate that on most summer afternoons, the difference in sensor height is responsible for higher temperatures by at least 2 degrees (F) at Death Valley versus the Cow Creek CARB station.
3) Okay, we have accounted for about 5 degrees of the 9-degree difference on August 16. The remainder of the difference is due to station exposure. The Cow Creek CARB station is very-well exposed, perhaps even extremely-well exposed. It is on a bit of a ridge on the generally sloping alluvial fan. There is no vegetation of consequence nearby. There is a little shack and a covered water reservoir below the instrument tower. Ventilation through the radiation shield near the top of the instrument tower could not be any better. This is in stark contrast to the Death Valley/Furnace Creek station (i.e., the official NWS/NPS Death Valley station). The NWS Death Valley station has buildings, solar panels, a covered parking area with vehicles, a propane tank of some sort, and assorted trees and vegetation all within s stone’s throw. These all act as obstructions to the wind, and thus ventilation through the weather station area is poorer than it would be well away from any such obstructions. The poorer ventilation allows very hot air near the ground surface (on sunny afternoons) to build up. The difference in station exposures accounts for about a 2 to 4 degrees (F) difference in temperature. The Death Valley station gets a boost in maximum temperatures due to its relatively poor exposure.
One other factor which can be important when comparing temperatures, and when trying to explain any differences, is the timeframe used in determining temperature. For instance, at your airport stations with your typical ASOS instrumentation, the temperature is updated each minute, and the maximum temperature for the day is the highest value of all of these one-minute values. BUT!! But these one-minute temperatures are actually determined by averaging the five temperatures that the ASOS has measured in each of the previous five minutes! Sometimes, small-to-large swings in temperature during short durations are “masked” by ASOS because all official temperature measurements — all of the temperatures that you ever will see from the ASOS — are from 5-minute time frames and are 5-minute averages. If your electronic weather instrumentation is basing maximum and minimum temperatures on 1-minute (or 1-second) averages, then chances are very good that that instrumentation is going to provide a higher maximum temperature than an ASOS system would provide at the same place. This is especially true in the desert, as the bare ground gets very hot. Local hot bubbles of air come and go rapidly at shelter level as the atmosphere works to even things out. Very sensitive sensors which base maximums on very short intervals of time will provide hotter temperatures than those that aren’t as sensitive, and will provide hotter readings than those that base maximums on averages over several minutes. Before about the year 2000, when most official temperatures were those manually read off of the thermometers in the shelters, these issues were not yet part of the equation!
So, yes, I need to find out exactly how the Death Valley station determines temperatures.
And, yes, maximum temperature measurement in the desert is not as straight-forward and simple as you thought, is it?!
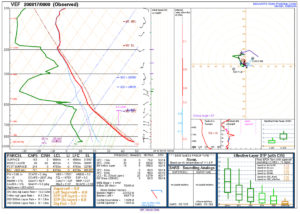
Morning and afternoon soundings from NWS Las Vegas below. One thing that sticks out is the nearly dry adiabatic lapse rate to almost 500 mb, especially on the morning sounding. Usually the summer soundings show less steep lapse rates between 600 and 500 mb. The deeper mixing to heights above the 600-mb level would contribute to somewhat higher ambient air temperature in the afternoon.
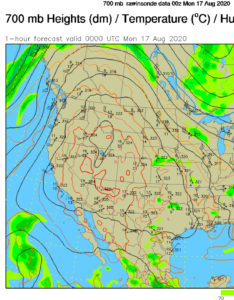
The Las Vegas sounding and the detailed data, from the SPC site. The 700 mb temperature of 18.6C is about one degree (C) shy of the highest that I have documented at Las Vegas and Desert Rock, NV, for summer heat events. Note how weak the wind field is all of the way up to 500 mb.
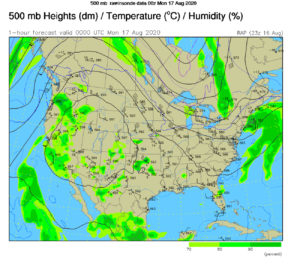
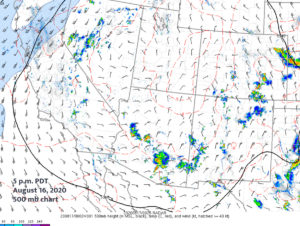
Big 599-decameter-plus upper high over Nevada and Utah!
Below are links to the weather observations in the Death Valley Region from about August 13-19, 2020.
Amargosa Valley Gate 510 Area 12 Mesa ASH MEADOWS
BAKER (P618) CA. Bishop, Bishop Airport BORAX
CIMA UPR CW9067 Ridgecrest Daggett, Barstow-Daggett Airport Death Valley Natl Park CARB
Deep Springs DUNN UPR DYER – WALLACE FARMS Edwards Air Force Auxiliary North Base
Edwards Air Force Base Essex EUREKA VALLEY FIVE MILE FURNACE CREEK DEATH VALLEY
FW5911 Darwin FW6556 Big Pine Goldfield HORSE THIEF SPRINGS HUNTER MOUNTAIN
INDEPENDENCE CA INYOKERN Jean KBYS — Fort Irwin:Barstow, Bicycle Lake Army Airfield
KBYS RAW Fort Irwin:Barstow, Bicycle Lake Army Airfield KDAG RAW Daggett, Barstow-Daggett Airport
KDRA Mercury, Desert Rock Airport KEDW RAW Edwards Air Force Base
KEED RAW Needles, Needles Airport KLAS RAW Las Vegas, McCarran International Airport
KLSV RAW Nellis Air Force Base KNID China Lake, Naval Air Facility KNID RAW China Lake, Naval Air Facility
KNXP Twentynine Palms SELF Airport. KTPH Tonopah, Tonopah Airport KWJF General Wm J Fox Airfield
Las Vegas, McCarran International Airport LAURAL MOUNTAIN MANIX UPR Mesquite MID HILLS
Mojave National Preserve CARB Needles, Needles Airport Nellis Air Force Base OAK CREEK Olancha
OPAL MOUNTAIN Overton OX RANCH Pahrump CEMP SARATOGA SPRING Sarcobatus Flats
SCE (Little) Lake Canyon Dr SCE Big Pine SCE Grapevine Canyon SCE Mountain View Rd Bishop
Shadow Mountains (Mountain Pass) SQUAW SPRINGS Tecopa:Shoshone Trona-Athol & Telegraph
US95 Tonopah Summit USCRN SITE NEAR STOVEPIPE WELLS 1SW W6BST Ridgecrest
WX6HNX-13 Jawbone Cyn WX6HNX-15 Boron
And, to make it easier, here are the links to the stations that are in Death Valley. The second one below provides more detailed temperature data for the NWS/NPS station at Furnace Creek.
USCRN SITE NEAR STOVEPIPE WELLS 1SW
These stations are of varying type and varying quality, with varying station exposures and varying frequency of observation times. Some stations report only hourly, and some have sensors well above the typical 5-foot level, so these tend to be a little lower on maximums comparably. I have not done a detailed study of the temperature data from all of these stations, but a quick look when I was downloading each one revealed nothing obviously suspect.
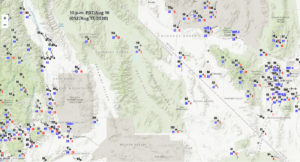
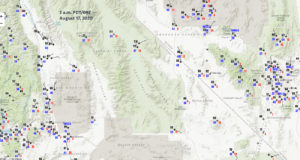
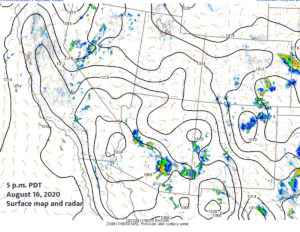
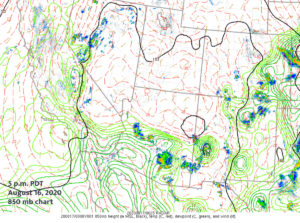
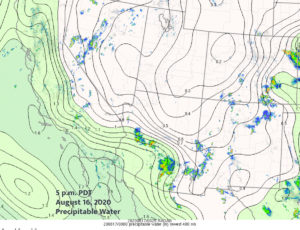
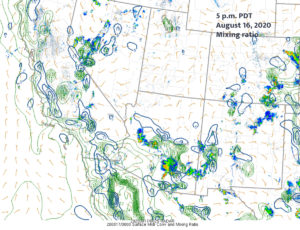
Above are NWS surface maps of the Death Valley region for noon/12 p.m., 2 p.m., 4 p.m., 6 p.m., and 10 p.m. on August 16, plus 2 a.m. on the 17th. Below are some graphics from the SPC mesoanalysis page, for 5 p.m. (0Z August 17).
The SPC 700 mb meso-map for 00Z on the 17th (5 p.m. PDT on the 16th) shows that Death Valley is fairly close to the center of the 700-millibar anticyclone. Note the westerly winds at 700 mb near Tonopah, the northerly winds over Utah, the easterly winds near Barstow, and the weak flow with a southerly component around the Sierra Nevada. These winds are based on a computer model’s analysis, and of course will be “off” some on the details. But the main takeaways are: the Death Valley region was very close to the center of a hot high-pressure system aloft, and 700-millibar temperatures were near 19C. Very similar synoptic conditions have been associated with maximums of 127F to 129F at Death Valley in recent decades. It cannot be argued that the weather pattern was NOT capable of producing record or near-record maximums in the Death Valley region.
Lets look at maximums for August 15/16/17/18 at select stations, with departures from average (from 1981-2010 normals) for August:
(note: edited in August 2021 to update the RAWS stations maximums, based on the official RAWS web site data instead of the hourly data)
DV/Furnace Creek. 126/130/127/126. +11/+15/+12/+11
Cow Creek/CARB 120/121/121/120
Stovepipe Wells 1SW 123/125/126/124
Saratoga Spring RAWS 123/122/125/123
Eureka Valley RAWS. 110/112/112/110
Amargosa Vly CEMP 112/115/113/113
Beatty CEMP 108/110/111/110
Bishop AP 107/108/105/106* +11/+12/+9/+10 *approx max for 18th
Darwin 106/110/112/111
Independence MAP 105/101/106/104
Daggett AP 113/115/115/113 +10/+12/+12/+10
China Lake NAS 113/115/115/115
Fort Irwin AP 110/110/110/110
Needles AP 123/117/117/118 +16/+10/+10/+11
Desert Rock AP msg/112/112/111 msg/+14/+14/+13
Las Vegas AP 113/113/112/114 +11/+11/+10/+12
Nellis AFB/Las Vegas 113/113/114/116
Baker MAP 119/118/118/119
Tecopa CEMP 120/118/120/120
Trona 113/115/116/114 +9/+11/+12/+10
Sarcobatus Flats 106/109/109/107
Goldfield CEMP 99/100/101/101 +12/+13/+14/+14
Tonopah Summit 92/94/93/msg
Tonopah AP 100/101/103/101 +10/+11/+13/+11
The maximums at the surrounding stations provide more-than-adequate support for the record high of 130F at Death Valley.
The 30-year “normal” average maximum for August at the Death Valley station in Furnace Creek is 114.7F, according to the Western Region Climate Center web site. This is for the period from 1981 to 2010. Only a couple of stations were close to the +15 departure that Death Valley had. These were at Desert Rock AP (112F/+14) and Goldfield CEMP (100/+13). Departures at most other stations on August 16 were about +11 to +12 degrees (F) above average.
It appears that the Independence station was beneath some cloudiness due to convection on the afternoon of the 16th, as the maximum was only 101F. The maximum here jumped up to 106F on the 17th as the afternoon was much sunnier.
Let’s compare maximums for this heat wave with the all-time maximums, and with the maximum temperature reached in the big heat event of late June/early July 2013.
Listed below are the maximums for this heat event of August 2020, followed by the maximum for the heat event of June-July 2013, and the station’s all-time (reliable) record high temperature, if known, with year of occurrence.
2020/2013/all-time
DV/Furnace Creek. 130/129/130 (130F on August 16, 2020, Greenland Ranch 134F in July, 1913)
Cow Creek/CARB 121/122/—
Stovepipe Wells 1SW 126/126/—
Saratoga Spring RAWS 125/126/—
Eureka Valley RAWS. 112/113/—
Amargosa Vly CEMP 115/114/—
Beatty CEMP 111/111/—
Bishop AP 108/109/110 (110F on July 10, 2002, Independence 103F in July, 1913)
Daggett AP 115/116/118 (118F on July 5, 2007, Barstow 110F in July, 1913)
China Lake NAS 115/116/119 (119F in July 1988)
Needles AP 123/123/125 ( 125F on July 17, 2005, Needles 114F in July, 1913)
Desert Rock AP 112/113/113 (113F on June 30 and July 3, 2013)
Las Vegas AP 114/117/117 (118F in July, 1931, at Las Vegas COOP, Las Vegas 112F in July 1913)
Baker 119/122/123 (123F on July 14 and 15, 1972)
Tecopa CEMP 120/119/—
Trona 116/115/118
Sarcobatus Flats 109/109/111 (111F in July, 1959)
Goldfield 101/101/103 (103F in July 1931 and July 2002, Columbia 97F in July, 1913)
Tonopah AP 103/103/104 (104F in July 1960 and July 2016)
Tonopah CEMP 96*/98/99 (99F on July 10, 2002, Tonopah 92F in July 1913)
- high temp is missing for Tonopah CEMP on August 16. 96F was reached on the 17th and 18th.
The highest temperature attained at regional stations on and around August 16, 2020, was (for the most part) the same as or a degree lower than that reported for the big heat event of 2013. The only stations which were HOTTER in 2020 versus 2013 were Death Valley, Tecopa, Trona and Amargosa Valley. These are also some of the closest stations to Furnace Creek. Keep in mind that the maximums for the RAWS stations are based on the list of hourly observations. Is there a site that provides the real maximum temperatures for these RAWS stations?
So, once again, the regional maximums for this heat event do support the 130F temperature at Death Valley. It might be a little perplexing that the other Death Valley stations fell quite a bit short of 130F, but the differences can be explained by differences in elevation, exposure, and sensor height above ground. And, there is always the “weather” factor! Some minor local differences in wind, air mass temperature, cloudiness sometimes present themselves. These are usually of minimal influence on the hottest days, but perhaps on August 16, 2020, the Death Valley station at Furnace Creek just “over-achieved” a little and everything came together perfectly to nudge it a tad over 129F.
Also included for some of the places above are the maximums during the hot period of July 7-14, 1913. The stations and the station environments were not the same as today, of course. For the most part, the maximums in 1913 were 4-to-5 degrees (F) LOWER than the maximums realized during the heat events of 2013 and 2020. The Greenland Ranch maximum of 134F in July, 1913, is still 4 degrees (F) HIGHER than this latest all-time (presumably reliable) record maximum at Furnace Creek-area stations.
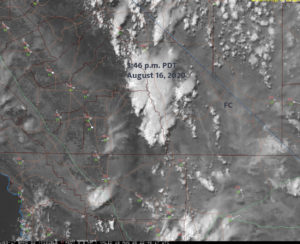
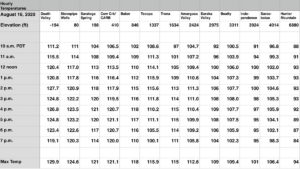
Before wrapping this up, we should talk about the rather unusual jump in temperature at Death Valley from 1 p.m. to 2 p.m. on August 16th. Let’s show a comparison of hourly temperatures among some of the stations:
None of the other station show the little “wiggle” in temperature on the way up to the afternoon’s maximum as occurred at Death Valley. (Tecopa’s march of temperatures is interesting, as after 2 p.m. there is cooling. The visible satellite image above shows a curious batch of clouds covering the Tecopa area of far southeastern Inyo County around 4 p.m. PDT). If the temperature at 2 p.m. at Death Valley were 123.0F, and not 127.7F, then that would conform more to the other stations and would appear, uh, let’s say it would appear “less unnatural.”
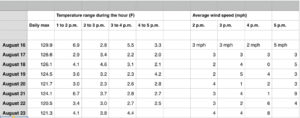
Let’s do a little investigating. Below is a link to the more-detailed hourly temperature data for the official NWS Death Valley station, for the 7-days from August 16 to 23. I am going to look at the differences between the highest and lowest temperatures provided between 1 and 2, 2 and 3, 3 and 4, and 4 and 5 p.m for each day.
The chart above shows the range of temperature at the Death Valley station for afternoon hours from 1 p.m. to 5 p.m. (Also provided is the average wind speed.). This is a very limited data set, obviously, but it shows that the spread of 6.9 degrees between 1 and 2 p.m. on August 16 was a bit of an outlier compared to the other values later in the week. There was a similar hourly spread of temperature on the 21st for the same timeframe. The 1 to 2 p.m. timeframe is generally a couple of hours prior to the hottest time of the afternoon, with the gradual rise in diurnal temperature leveling off around 3 to 5 p.m. So, on average, temperature range for the 1 to 2 p.m. hour is probably a little larger than the succeeding three hours.
From 1 p.m. to 2 p.m. on August 16th, the temperature ranged from a low of 120.8F at 1:02 p.m. PDT to a high of 127.7F at 1:59 p.m PDT. Temperature ranged between the following values for the next three hours:
2 p.m. to 3 p.m., 124.5F to 127.3F
3 p.m. to 4 p.m., 124.4F to 129.9F
4 p.m. to 5 p.m., 124.1F to 127.4F
These are somewhat wide spreads of temperature over the course of an hour. And, these spreads reflect the significant influence of the rather localized and transient “hot pockets” which develop above the hot, bare desert surface during the high-sun hours. In addition, it is my contention that these “hot pockets” persist for longer periods and can become hotter in places where ventilation is locally poor. It would be fun to compare data from this Death Valley station with identical instrumentation a short distance away, and completely free of the influence of any vegetation and structures. In my entry for August 17, when I visited the station, I detail the transects made near the station with the sensitive, handheld Kestrel thermometer.
The wind was from the east at only 3 mph on the 16th at 2 p.m., when the temperature rose rather abruptly to 127.7F. At 3 p.m. it was SSW at 3 mph, and at 4 p.m. it was NNW at 2 mph. At 5 p.m. it shifted again, to S at 5 mph, and at 6 p.m. it was WSW at 3.5 mph. The wind was decidedly very light and variable at the Death Valley station this afternoon! Clear and near calm are the perfect conditions during the afternoon to promote very high surface and ambient air temperatures. The light winds help to promote the “hot pockets.” The lighter the wind, the less mixing there is. And the less mixing there is, the longer the air near the surface lingers near the surface, and the hotter it is permitted to get. Just to the east of the station is a parking area and an array of black solar panels. This darker area may get a little hotter in the midday sun, and may be the reason for that somewhat pronounced and peculiar temperature spike at Death Valley around 2 p.m. The wind at 2 p.m. was East at 3 mph!












Leave a Reply
You must be logged in to post a comment.