January 5, 2022 update — adding more analysis and comparisons of additional stations in the region…about halfway done with that…
Image above: The Death Valley weather station on July 10, 2021, around 4 p.m. PDT. The handheld Kestrel reads 128.8F. The readings that it provided were close to those by the automatic HADS station inside of the fenced area. The maximum on the 10th was 129.4F at 4:27 p.m. PDT (2327Z).
—————
The Death Valley and Mojave Desert regions were subjected to a very high-end heat event from about July 8 to July 12, 2021. Numerous all-time high-temperature records were tied or broken! Death Valley came in with a high of 130.0F on July 9th and 129.4F on July 10th. See details on my drive to Death Valley on July 10th here.
A previous entry provides the detailed (hourly) weather station weather data for the intense heat event of July 8-12, 2021 in the Death Valley region. And, here (below), I provide some analysis and commentary, and try to put this major heat event into perspective. Detailed looks at previous heatwaves in the region are also available for perusal on the Bruiser — Parts 4A (1931-1960) and 4C (1911-1930) and 4B (1961-2013).
I started collecting archived weather station max and min temperature data for the Death Valley region for this event, and I just could not stop! I strayed outside of the region a bit by including stations as far south as Thermal and Blythe (about 200 miles distant from Furnace Creek), as far east as Rachel and Mesquite (150 miles), as far north as Hawthorne and Bridgeport (170 miles), and as far west as Lancaster and the eastern slopes of the Sierra Nevada (140 and 75 miles, respectively). I think it is important to see how adjacent areas fared during the heat event, so I may as well share it all. Most of the 200-plus stations are within about 100-125 miles of Furnace Creek. Yes — data from 200-plus stations were collected. One hundred years ago there may have been a dozen stations to compare, and now the online weather map is littered with desert weather stations of all types.
I will provide a couple of ways to view the daily data. This link (just below) will conveniently open a pdf file, and you will see a list of all of the stations with the daily max and min temperature data for July 8-12, 2021 (by county). Also provided are the max and min, and average max and min temperatures for the 5-day period.
Daily max and min data, July 8-12,2021, all stations (pdf)
Since that file is large and unwieldy, the links below go to the county that you may be more interested in. Hopefully you know that the California counties are Inyo, Mono, Kern, Los Angeles, Riverside, and San Bernardino. The Nevada counties are Clark, Lincoln, Nye and Mineral; and, La Paz and Mohave counties are in western Arizona.
Inyo Kern and Los Angeles San Bernardino Riverside and La Paz and Mohave
Clark Nye and Lincoln Esmeralda and Mineral and Mono
The first (upper part) of the file includes the temperature data. Additional information about the station is provided also, so keep scrolling to the bottom for all of the info (such as elevation, my estimation of station exposure, etc.) Most of the stations here are available on the NWS/NOAA Weather and Hazards map. Also listed are NWS cooperative weather stations, many of which are not online (well, not online real-time) and are not on the NWS map. The cooperative station data were collected from the NOAA National Centers for Environmental Information site, formerly NCDC.
The “Freq” column in the tables indicates how often the current temperature is updated and provided online. A “60” means once every 60 minutes, a “10” means that temperature is updated every 10 minutes, for example. The daily maximum and minimum temperatures from stations with a “freq” number (mostly APRS, SCE, SCAN and DRI stations) were based on the highest and lowest temperatures reported on these “updates.” A blank in the “Freq” column means that conventional maximum and minimum temperatures were available (at COOP, ASOS, CEMP, RAWS, and CARB stations). In other words, it is quite possible that the maximum temperature was actually a degree or two (or three?) higher at a station in the former group, as it may have been a little hotter between the available observations/updates.
By zooming in online on the NOAA weather map with the station plots, I could get a fairly decent notion as to the station’s exposure. In some instances, I checked the street view on Google maps to see if the station was visible. Many, if not most, of these online desert weather/climate stations are in remote areas, far from structures, usually far from trees, and enjoying exposures which can be described as “very good” or “excellent.” Some stations are at airports, usually with excellent exposure, and some are in towns or suburban neighborhoods, with varying exposures. Not all desert stations are created equal, so sometimes comparisons between stations are not particularly fair, or easy, or direct. Since station exposure and various other factors are so important for high-temperature measurement in desert environments, let’s take a little time and space here to discuss this. (We know that elevation is the primary control on maximum temperature differences in the region for summer heat waves, but this current discussion is just addressing the importance of the other influences.)
Here is a list of other factors which come into play with regard to temperature measurement on a typical sunny summer afternoon in the Death Valley region:
STATION EXPOSURES
This one is listed first because it is the most important. The desert is, for the most part, a wide-open area with little to slow down the wind. Where the wind is interrupted or slowed due to terrain, vegetation, structures, or a combination of these, low-level air is less effectively mixed away. Thus, above a typical dry desert surface that is baking in the midday summer sunshine, a poorly-exposed station would likely be several degrees warmer than a well-exposed station. Stations on hilltops, steep slopes and ridges are generally better-exposed to wind than those on the desert flats, or in washes or canyons or in settlements. Hot near-ground-level air is more effectively mixed out and away in the areas of higher terrain locally, and maximum temperatures tend to be less impressive (i.e., lower) at stations in these environments. For more on the importance of exposure, see my writeup on the current Death Valley station and this comparison between that station and the nearby CARB station.
Fortunately, most of the desert stations found online are well-exposed. The entities which establish many of the desert weather stations are (perhaps!) generally more interested in wind information (compared to temperature), so stations tend to be located in or near the most-exposed locales in order to best catch the wind. In flat areas without varied topography, stations are typically very far from anything which might diminish the wind. Airport (ASOS) weather stations are generally very-well exposed, near airfield runways. One exception, at least to some extent, are the “CEMP’ stations. These were installed to monitor weather and radiation levels around the Nevada National Security Site. The CEMP stations are fabulous and provide a great climatological record for the eastern side of the Death Valley region. Most of the CEMP stations have been operating since 2000. But, since the stations are located in desert towns (for the most part), nearby structures and trees generally result in station exposures which are not as good as most “remote” stations. One would expect somewhat higher maximums at your typical CEMP station versus a nearby station outside of town with an excellent exposure. At least one CEMP station (the Las Vegas one!) appears to be exceptionally poor on exposure, and some maximums here are commonly much too warm. (And, I say “much too warm” assuming that one is desiring maximum temperature measurements which are decently representative of a general area, and not desiring conditions at a local spot with poor ventilation.) Also, some of the NWS cooperative stations are in town environments and may have somewhat questionable exposure. Typically the NWS does a very good job at siting stations, but sometimes conditions change around the instrumentation and station exposure suffers. It is rare that a long-term station finds itself with better and better exposure with time!
Since nearly all of the stations in the region are above a natural desert ground surface, which gets very hot on sunny summer afternoons, poorly-exposed stations tends to be much warmer on maximum temperature comparably. Maximum temperature might be “inflated” by more than 3-5 degrees (F) at a poorly-exposed station. I would describe such a station as woefully inadequate and unacceptable. Sometimes it is not possible to site a station in an adequately-exposed spot, and the instrumentation finds itself with a poor or fair exposure. If maximums at these sites routinely are within about 2-3 degrees (F) of a well-exposed site (other things being equal), then that is not too unreasonable…in my opinion! The bottom line is that it is important to know how well your desert stations are exposed if you want to make reasonably fair and valid comparisons on maximum temperatures.
GROUND COVER
The ground cover at desert stations can have a very significant effect upon temperature measurement. Since the desert atmosphere is usually very dry, with afternoon relative humidities often near or under 10-20 percent, cooling due to evapotranspiration can be rather extreme. Imagine walking through a barren empty lot in Las Vegas on a 115F-degree afternoon, and moments later walking onto a golf course fairway (with the sprinklers on nearby!). The moist grass under your shoes is probably some 50-70 F degrees cooler than the hot sand in the empty lot. Ambient air temperature might be 5-10 degrees (F) cooler above the fairway and also just downwind of the golf course. Thus, stations above (or near) irrigated or naturally-moist areas (such as springs) will report maximums which are on the low side. These stations might not be particularly representative of conditions on the whole for a particular area. Early in the 20th century, it was considered optimal to locate desert-region thermometer shelters above grass, in order to minimize the effects of direct and indirect solar radiation. That notion went by the wayside for the most part by mid-century. (Perhaps it was just too unrealistic, difficult and expensive to maintain grassy areas around most desert weather stations!) Many old temperature records at Mojave Desert stations show significantly cooler average maximums compared to much more recent averages. I suspect that moist (i.e., grassy) ground covers near stations in the old days (especially around 1875-1925) are largely responsible for the cooler maximums comparably. And now the good news: Nearly all automatic stations found online (currently) are above natural (mostly barren) desert surfaces. But, there are exceptions. Some stations are near springs, with pools of water and plenty of vegetation around. Some are amidst farmland. Know your station ground covers! If a station seems to be reporting maximums that are on the low side, then maybe the ambient air is affected by nearby vegetation, a moist ground cover, and associated evaporative cooling.
One last note here: I have found that there is little difference in ambient air temperature on sunny summer afternoons in the desert between the natural/mostly barren surface areas and paved areas, such as parking lots. I don’t think that siting a desert weather station near a paved road or parking lot is especially problematic. In moist regions, I suspect otherwise. There would be much more of a difference between paved areas and natural ground cover in humid areas, and stations should be sited accordingly!
Oops — another last note on ground cover beneath desert weather stations: My college climate professor, Dr. Arnold Court, once mentioned to me that the (CAA/aviation) airfield at Silver Lake, California (north of Baker) had a thermometer shelter that was above bare ground. And, he said that this was the first weather station in the country to have its thermometer shelter above bare ground (and not above grass!). I wish that I could discuss this further with Dr. Court, but he passed away around 1999. Unfortunately, I don’t have any other details about this tidbit of information. The Silver Lake airfield was in operation (with weather observers working around the clock) for about ten years, from about 1940 to 1950. Don’t quote me on these numbers. I don’t know if Dr. Court was speaking of airfield stations only, or all cooperative weather stations in the country. It is hard to imagine that all of those old railroad stations in the West had grass beneath the instrumentation. Most weather stations prior to start of the aviation period were in towns or at ranches, where there was sufficient water available to survive, to plant some crops, etc. The Silver Lake airfield was dreadfully dry, and if I had to guess, probably had to import water for the few folks who lived here. The now-abandoned site was a small town and siding for the T & T Railroad in the early 20th century.
So, to reiterate, it was the norm to site desert thermometer shelters above grass during the early decades of the 1900s. That “rule” was relaxed some about halfway through the 1900s. Some stations remained over grass, some stations did not. Therefore, if you are comparing heat waves and “normal” and extreme temperatures at desert stations with very long records, your conclusions may be quite flawed if you are not aware of changes in ground cover beneath the instrumentation.
STATION TYPE
A variety of different organizations establish weather stations in the desert, and these agencies tend to have different objectives and needs when it comes to measuring the weather parameters:
— Ideally, each temperature sensor would be five feet above the ground, but some are near the top of 25-to-30-foot poles. On sunny summer afternoons with little wind and above a barren desert surface, the temperature at five feet above the ground is typically 2-3 (F) degrees warmer than the temperature at 30 feet above the ground. Many of the newer automatic stations have their radiation shields much higher than five feet above the ground, and thus tend to be quite conservative on temperature measurement (i.e., conservative on both maximums and minimums).
— Ideally, all temperature sensors would be in high-quality radiation shields (or equivalent) with reliable and good aspiration (i.e., a fan continuously blowing air past the radiation shield). Some of our desert stations have aspirated temperature measurement, and some do not. The lower the sensor is to the ground, the more important this is! (An aspirated temperature shield is probably not necessary for sensors more than 15-20 feet above the ground, or well above a roof, where natural airflow is usually adequate.) An aspirated shield might result in maximum temperature measurements a degree or two (F) cooler compared to a non-aspirated shield.
No radiation shields are perfect. In conditions with bright sunshine and weak winds (that is, on your typical hottest day of the year), even a “good” radiation shield might cause an inflated maximum temperature by a degree (F) or two. I have found that the shields used by the NWS for their cooperative “MMTS” stations are excellent. The Campbell-Scientific station at Furnace Creek in Death Valley has a shield which is “fair” (in my estimation). Studies show that weak winds and sunshine do cause an unwanted drift upwards in temperature with the shields used with the Campbell-Scientific weather stations. Accurate and reliable ambient air temperature measurement in the desert on bright and sunny afternoons when wind is light is not as straight-forward as it might seem.
Note on RAWS stations! The shields on the RAWS stations seem to be quite poor. I have found many RAWS stations report temperatures on sunny afternoons (with light wind) to be much too warm, perhaps up to 3-6 degrees (F) too warm. If wind is more than about 10 mph, then the inflated warm readings in such conditions tend to be much diminished. I strongly suspect that inferior quality (and non-aspirated) radiation shields are the cause of the too-warm temperatures at most, or perhaps “many,” RAWS stations. Some RAWS stations seem to have much less problem in this regard than others. Perhaps the shield types vary station-to station. Also, most RAWS stations are located in very well-exposed locales, such as on hilltops and ridges. The great exposure in these usually breezier locales would tend to dampen the influence of poor-quality temperature-measurement instrumentation. Beware of the maximum temperature reports from RAWS stations on sunny afternoons with light wind, especially for RAWS stations in the lower-terrain areas, such as valley bottoms. These maximums might be inflated by several degrees due to poor equipment.
— Ideally, each station would measure temperature the same way! Before electronics took over the weather-measuring world starting around the 1990s, the typical cooperative weather station had the liquid-in-glass max/min thermometers inside of the cotton-region thermometer shelter. The thermometers were a little slow to respond to small temperature changes (the thermometers actually measured the temperature of the thermometer’s bulb and not the air directly), but the way that official temperatures were measured was very consistent station-to-station. Today’s stations are made by a variety of companies, with a variety of models, with a variety of quality and sensitivity, with a variety of software and programming to determine the current temperature and to determine the daily or hourly temperature extremes. (Some temperatures are 5-minute averages, some are instantaneous readings.) By-and-large, the automatic electronic stations found online in the Death Valley region are excellent quality (except for some RAWS stations due to the problematic radiation shields), and the temperatures are very trustworthy. As with any electronic equipment, sometimes there are glitches, sometimes the sensors go out of calibration. Sometimes an aspiration fan fails and suddenly the reported temperatures drift too high. Problems with electronics tend to be more likely under more extreme conditions, such as during high-end heat waves. If a station’s temperature looks funky, then there is a chance that something is wrong and that the data are not trustworthy. The main message here is that “glitches happen,” equipment and programming and maintenance are not the same station-to-station, and instrument sensitivity and the length of time used to determine the temperature might be important.
A summary of the above few sections would go like this:
Desert stations that are very well-exposed — those on hilltops, ridges, mountain-tops and those far from structures and tall vegetation — tend to measure temperature on the conservative side on sunny summer afternoons. Generally speaking, stations with such exposure are favored (in the meteorological and climatological communities) and are easiest to compare directly. Desert stations with poor or only fair exposures, those close to buildings or fences or a row of dense vegetation, and/or those in narrow canyons or close to a topographic feature which diminishes ventilation, are those which would likely report maximums on sunny summer days that run higher compared to a well-exposed locale not too far away.
Other factors which promote warmer maximum temperature readings on sunny summer afternoons are bare ground, temperature sensors closer to the ground, non-aspirated shields, and shorter measurement times (averaged out) to determine the official temperature. For cooler, more conservative maximums, stick your sensor way up near the top of a tall pole, base the temperature on 5-minute (or longer) averages, use an aspiration fan, and site the station above grass or in frequently irrigated and cultivated farmland where evaporative cooling is significant. Also, a station located in the shade of a large tree or two during the mid-afternoon hours would be cooler! I don’t necessarily advise the implementation of these ultra-conservative options!
What is a perfect exposure? What would be a highly desired siting for a desert weather station? I would say one such as the UCRNS Stovepipe Wells station, which is above a natural surface and is more than 150-300 feet from any structures. Plus, its temperature sensor is at the standard 5-6 feet above the ground, and is in a high-quality aspirated radiation shield.
An important difference (on hot and sunny afternoons) between desert stations which are very-well exposed and those with a somewhat less-than-desirable exposure is that temperature tends to vary quite a bit more intra-hourly at the stations with the poorer exposure. This contributes in part to higher maximums at the more-poorly-exposed stations.
THE HEAT WAVE, July 8-12, 2021
Let’s stick the weather map data plots for the heat wave period in here first, before the discussion. Remember, you can go to this map and its historical archives and bring up the data from any hour during the event.
Below is a collection of NWS/NOAA surface maps for most 6-hour periods from 11 a.m. PDT July 9 to 5 a.m. July 12.
July 9, 2021 11 a.m. PDT (18Z 09 Jul) DV region surface weather plots, north and south
July 9, 2021 5 p.m. PDT (00Z 10 Jul) DV region surface weather plots, north and south
July 9, 2021 11 p.m. PDT (06Z 10 Jul) DV region surface weather plots, north and south
July 10, 2021 11 a.m. PDT (18Z 10 Jul) DV region surface weather plots, north and south
July 10, 2021 5 p.m. PDT (00Z 11 Jul) DV region surface weather plots, north and south
July 10, 2021 11 p.m. PDT (06Z 11 Jul) DV region surface weather plots, north and south
July 11, 2021 5 a.m. PDT (12Z 11 Jul) DV region surface weather plots, north and south
July 11, 2021 11 a.m. PDT (18Z 11 Jul) DV region surface weather plots, north and south
July 11, 2021 5 p.m. PDT (00Z 12 Jul) DV region surface weather plots, north and south
July 11, 2021 11 p.m. PDT (06Z 12 Jul) DV region surface weather plots, north and south
July 12, 2021 5 a.m. PDT (12Z 12 Jul) DV region surface weather plots
The Death Valley and Mojave Desert heat event during the second week of July, 2021, appears to be the most intense for the region for the previous 49 summers, and ranks among the top 2 or 3 heat events on record for the region (since about 1900). All-time record high temperatures were tied or set at practically all weather stations in and near Death Valley. Here, we will investigate the meteorology of the event and see how the temperature reports compare with previous heat waves.
Upper Level Data
As is the case with all warm-season heat events for the region, an area of high pressure at mid-and-high levels of the troposphere dominated the Desert Southwest region of the United States. The center of this anticyclone (or “upper high”) was close to Clark County in southern Nevada from July 9 -11. Late afternoons soundings from Las Vegas measured 500-millibar heights of 6000 meters (600 dm) on both the 9th and 10th (i.e., on the soundings for 00Z 10 July and 00Z 11 July. The balloons are usually released about an hour before 00Z, or at about 3 p.m. PST/4 p.m. PDT).
500 mb heights and temperatures at Las Vegas (VEF)
July 8 (00Z 09 Jul) 5940 meters, -6.9C/SE 4 kts at 500 mb
July 9 (00Z 10 Jul) 6000 meters, -5.1C/SE 8
July 10 (00Z 11 Jul) 6000 meters, -4.5C/S 11
July 11 (00Z 12 Jul) 5980 meters, -4.5C/NW 4
July 12 (00Z 13 Jul) 5970 meters, -5.0/N 15
Above: Afternoon soundings at Las Vegas, July 9, 10, 11 and 12 (or 00Z soundings for 10, 11, 12 and 13 July).
Above: Comparisons of sounding data at Las Vegas (VEF) and Desert Rock AP (DRA) for heat waves in the region since 1988.
The table above does not include the upper air data from Las Vegas (VEF) for the heat wave of mid-August, 2020, when the official max temp at Death Valley was 130F. Below are the 500mb heights (meters) and the temperatures (C) at 500, 700, 850 and 925mb at Las Vegas for the afternoons of August 16-18, 2021:
16 Aug 2020 5980/-6.5/18.6/34.0/43.0 DV max 130F
17 Aug 2020 6000/-6.7/18.8/33.8/42.4 DV max 127F
18 Aug 2020 5990/-6.1/19.2/34.6/43.6 DV max 126F
500 Millibar Level
NCAR 500 mb maps
08Jul 500 map 10Jul 500 map 11Jul 12z 500 map 12Jul 500 map
09Jul 500 map 500 zoom for 10Jul 11 Jul 500 map
SPC 500 mb maps
July 9 map (00Z 10Jul) July 11 map 23Z
(sorry about the sideways maps. You can click on it and fix that, I think!)
500-millibar heights of this magnitude (i.e., around 6000 meters) are about as high as it gets for the region. On rare occasion, 500-millibar heights of 6010 or 6020 meters are noted during hot periods in the western United States, but usually these are from soundings taken in high-elevation areas, such as from Flagstaff and Grand Junction. (The 500-mb level was at 602 dm at Desert Rock AP on July 7, 1989 and on July 9, 2002!). Temperatures at the 500-millibar level do not correlate especially well with high temperatures at the surface in the Desert Southwest, as the troposphere is rarely “mixed” as high as 6000 meters on summer afternoons. The temperature at the 500-millibar level was as warm as -4.5C (above Las Vegas) for this event of 2021. Winds at this level at Las Vegas switched from south to north around the 10th, indicating that the upper high was migrating east-to-west during this timeframe.
The main takeaways from the 500 mb maps are: the center of the upper high was over or close to the Death Valley region, the wind speeds at 500 mb were light, the temperature was about -4 to -5C, and the relative humidity was on the high side and roughly 65-85 percent at 500 mb for much of the region during the heart of the event. The mid-levels usually are not quite this moist during major heat waves. Perhaps noteworthy is that at 500mb, the temperatures for this event were about two degrees (C) warmer compared to the heat event of August 16-18, 2020.
The 00Z Las Vegas soundings, unsurprisingly, show the typical (very steep) lapse rates in the lower half of the troposphere from the 9th to the 12th. There is a shallow super-adiabatic lapse rate in the lowest 25-50 meters. Above that layer and all the way up to about the 550-millibar level the environmental lapse rate is dry adiabatic (or very nearly so). This surface-based layer is deeply mixed. Above the 550-millibar level, the lapse rate is not quite so steep. This suggests that deep convection and mixing are weaker (or less prominent, or perhaps absent). A little higher still, between about 500 mb and 400 mb, is a somewhat shallow layer that is nearly isothermal. If daytime convection were able to mix up to the 400-millibar level during such heat waves, then regional maximum temperatures would likely be at least 5-10 degrees (F) warmer. Mixing up to about the 600-to-550-millibar levels appears to be about the norm for typical mid-summer heat events in the Death Valley region and on the Las Vegas soundings.
700 Millibar Level and Moisture
Temperatures at the 700-millibar level were as warm as I have seen in my research on regional heat waves, up to 20.0C on July 10:
700 mb temperature and wind at Las Vegas (VEF)
July 8 (00Z 09 Jul) 17.2C/W 4 kts at 700mb
July 9 (00Z 10 Jul) 19.2C/NE 2
July 10 (00Z 11 Jul) 20.0C/N 5
July 11 (00Z 12 Jul) 19.6C/NW 5
July 12 (00Z 13 Jul) 19.0C/W 10
NCAR 700 maps:
08Jul 700 map 10Jul 700 map 11Jul 12Z 700 map 12Jul 700 map
SPC meso page 700 maps:
09 Jul 700 map (00Z 10 Jul) 11 Jul 700 map 23Z) 12 Jul 700 map (00Z 13 Jul)
Note that the flow at this level was very weak. The height of the 700-millibar level for the sounding on July 10 was 3230 meters, or about 10,600 feet. The Las Vegas sounding for this day showed a near-dry-adiabatic lapse rate (i.e., a mixed air mass) to nearly 550 mb. Of course, the deep surface-based mixing to the 700-millibar level and beyond on hot desert afternoons is responsible for the close correlation between (surface) maximums and the temperature at the 700-millibar level.
The hottest 700 mb temperatures that I have found at Las Vegas and Desert Rock ranged from 19.4C to 19.8C for the major heat events of 1998, 2002, 2005, 2007, and 2013. (For the heat event of August, 2020, temperatures at 700 mb at Las Vegas ranged from 18.6 to 19.2C.). The hottest temperature at the 700 mb level for this event of 2021 was 20.0C on July 10 (i.e., for the sounding at 00Z 11 July). On the day prior, the temperature at 700 mb was 19.2C. Most regional stations had slightly higher maximums on the 10th, as the general airmass was warmest on the 10th. However, the Furnace Creek station in Death Valley was warmest on the 9th (130.0F on the 9th, 129.4F on the 10th). The reason for this may be due to some nearby cloud cover on the 10th, and/or may be due to somewhat better mixing around the instrumentation on the 10th compared to the 9th.
On the NCAR 700 mb maps, the temperature in Celsius is plotted at each sounding station. For instance, on the map for July 10 (i.e., 11 Jul 00Z), the 700mb-temperature at Las Vegas is 20C. Below that figure is a “21,” meaning that the dew point at this level is 21 Celsius degrees lower than the temperature (the dew point depression!). If you are familiar with reading a typical surface map, you will find the temperature above the dew point. But here, that is not the case, as the temperature and “dew point depression” are plotted.
Dew point depressions at the 700-millibar level were generally 15-20 degrees (C) at Las Vegas from July 8-12. This equates to relative humidities near or below 30 percent. A check of the soundings for this period shows the temperature and dew point differences narrowing from the 700 to 500-millibar level. Dew point depressions are around 6-7 degrees (C) at 500 mb on the 10th and 11th. This corresponds to relative humidities near 70 percent. The NCAR maps for the 500-mb level indicate where relative humidities are 70 percent and greater. And, indeed, much of the Death Valley region (especially west and northwest of Las Vegas) was somewhat moist at the 500-mb level from July 8 to July 11. Periodic mid-level clouds and showers resulted. This was in the southerly flow on the west side of the mid-level anticyclone. Showers and thunderstorms were most numerous in the Sierra Nevada and vicinity, and cloud cover was thick enough in the afternoons in some areas, primarily west of Death Valley, to keep maximum (ambient) temperatures from going as high as they could have (given the warm airmass aloft). The amount of cloud cover and shower activity for this heat event was rather unusual (unusual for a major heat wave!). It is likely that most of the mid-level cloudiness that drifted over the Death Valley region from July 8-11 was around 18,000 to 20,000 feet above sea level. The LCL (lifted condensation level) for the 9th and 10th at Las Vegas was higher than the 600 mb level, or above 15,000 feet above sea level.
Below are three visible satellite images for July 9, 2021, when Death Valley had a maximum of 130F. An “FC” shows the location of Furnace Creek in Death Valley. Unfortunately, my saved satellite images do not include the times. But, I do know that these are for the afternoon of July 9, with the first one around 3 p.m. PDT, the second one around 5 p.m. PDT, and the third one around 7 p.m. PDT. Exact times may be off by an hour or so, but the images provide an excellent look at how the skies in the region were during the hottest part of the day.
Cloud cover was rather significant on the 9th for the Stovepipe Wells area mid-afternoon. These clouds moved northward towards late afternoon. Much of the Owens Valley and areas northwest of Death Valley were partly cloudy or mostly cloudy during the afternoon of the 9th. The clouds on the 9th appear to be primarily mid-level altocumulus clouds, at least in the Death Valley vicinity, with perhaps some weak showers and deeper moist convection over the higher terrain (such as the Sierra Nevada).
Below are two visible images from July 11, 2021. Times are 2116Z and 2326Z (2:16 p.m. and 4:26 p.m. PDT). As on the 9th, the southern Sierra Nevada and the Owens Valley region are cloud-covered by mid-afternoon. Maximum temperatures here were definitely “held down” some by the moist convection and associated cloud cover. Deep moist convection also occurred on the west side of Death Valley between 2 and 5 p.m., with Furnace Creek on the eastern edge of cloud cover at 4:26 p.m. PDT. Much of this afternoon cloud cover is, presumably, surface-based shower activity (and some thunder?) which developed over high terrain. Anvil clouds and debris clouds moved northwards for the most part and shaded a good chunk of Inyo County on the afternoon of the 11th.
The image below is for July 12 at 2246Z/3:46 p.m. PDT. Again, afternoon convection over the Sierra Nevada and high terrain north and northwest of Death Valley is evident. Storms appear to be developing over the Panamints on the west side of Death Valley mid-afternoon.
The satellite images that I have here for the 9th, 11th and 12th of July show that parts of the Death Valley region, especially to the west and northwest and north of Death Valley proper, had significant cloud cover and some shower and/or thunderstorm activity during what is typically the hottest part of the afternoon (on clear days). Thus, some stations no doubt had their high temperatures relatively early in the day, perhaps late morning or very early in the afternoon, right before the sun was blocked by clouds. These stations likely did not get as warm as they would have had the atmosphere not been moist enough to cause such afternoon cloud development. Death Valley did have some afternoon cloudiness which may have caused slightly lower maximums, especially the northern part of Death Valley on the 9th. (The Stovepipe Wells area looked to be quite cloudy early-mid-afternoon on the 9th). Some cloud development over the Panamints on the 11th and 12th could have thrown some late-afternoon shade upon the Furnace Creek and Stovepipe Wells stations, but I suspect that it was too little/too late to impact the high temperatures (by more than a degree?) here.
And, that’s right, I did not save any satellite images from July 10th, which was the hottest day at most stations in the region. But, I do have plenty of pictures from the region in this entry thanks to my visit to Death Valley. There was a good bit of mid-level clouds covering the middle of Death Valley during the hottest part of the afternoon. I think that these clouds were “debris clouds” from afternoon development over the Panamint Range. Regardless of their origin, they shaded parts of the lowest elevation areas near Furnace Creek on July 10th. The cloud cover and shade on much of the landscape MIGHT have been responsible for a somewhat diminished maximum temperature at the Furnace Creek station. I was at or near the Furnace Creek Visitors Center during most of the mid-late afternoon, and do not recall prominent shade upon the weather station. My images from the 10th generally show mostly clear conditions in and around much of the Death Valley and Panamint Valley areas…but again, there was that batch of clouds near Furnace Creek around 4-5 p.m. Regionally, I suspect that the way that July 10th evolved cloud-wise was not too dissimilar to that on the 9th and 11th. There seemed to be a bit more deep moist convection over the Panamints day-to-day from the 9th to the 11th.
Since we are on the subject of moisture, this is probably a good place to provide the Precipitable Water maps from SPC. The “one-inch” line of precipitable water (below the 400 mb level) generally is near the southern edge of Inyo County, with diminishing amounts north and increasing amounts south. There is a gradual uptick in PW values from the 9th to the 12th, especially in and around San Bernardino County.
July 9th/SPC Prec water map 9 p.m./04Z
July 10th/SPC Prec water map 11 p.m/06Z
July 11th/SPC Prec water map 4 p.m./23Z
July 12th/SPC Prec water map 5 p.m./00Z
850 Millibar Level
July 9th SPC 850 map July 11th SPC 850 map 23Z
(Again, sorry that these are sideways. You can go to the bottom to find a way to properly orient the image!)
Temperatures at the 850-millibar level were about 35-36C; again, about the highest documented at Las Vegas:
July 8 (00Z 09 Jul) 33.8C/SW 8 kts at 850mb
July 9 (00Z 10 Jul) 36.0C/SW 3
July 10 (00Z 11 Jul) 35.8C/N 5
July 11 (00Z 12 Jul) 35.2C/SW 3
July 12 (00Z 13 Jul) 35.0C/S 10
The 850 mb temperature of 36.0C on July 9 matches the 36.0C measured by the Las Vegas sounding of June 30, 2013, when KLAS had 117F and Death Valley had 129.2F.
A handful of previous soundings at Desert Rock AP have shown 850-millibar temperatures higher than 36C, including 36.4C on July 9, 2002; 36.8C on July 18, 2005; and 37.0C on July 5, 2007. However, since the elevation of Desert Rock AP is about 1000 feet higher than the Las Vegas upper air sounding site (3238 feet versus 2257 feet), the ground surface is much closer to the 850 mb level at Desert Rock comparably. Slightly higher 850-millibar temperature measurements might be, or would be, expected (comparably) from stations in higher-elevation terrain for any given heat event.
The height of the 850-millibar level on the 9th was 1515 meters, or 4970 feet above sea level.
Similar to the 700-millibar level, the wind at 850 mb was very weak at Las Vegas during the heart of the heat wave (July 9-11). Pressure gradients at the 850-millibar level were very weak over the Death Valley region and vicinity, with SSW winds around 10 knots on the 9th and around 5 knots on the 11th…if you believe the analysis here, which is based largely on computer model output.
The SPC mesoanalysis charts for the 850 mb level on the 9th and 11th show dew points diminishing rapidly from south to north, from near 12C in Imperial County to less than 6C in Inyo County.
Surface Maps
Unsurprisingly, a (thermal) low pressure area was over the desert areas of Southern California and adjacent states during this heat event. Lowest pressures (around 1004 mb) were centered around Needles from the 8th to the 10th, with a weak lobe of low pressure extending north-northwestward. Surface pressure was about 6-8 millibars higher comparably over coastal southern California and over the high terrain from Bishop to Tonopah during this period. On the 11th, the 1004-mb surface low had broadened quite a bit, and extended from Blythe to Beatty. Again, on the 11th, the coastal section of Southern California showed pressures some 8 millibars higher, while the Tonopah area was about half that. There was moderate-to-strong onshore flow along the southern California coast during this event, which effectively prevented exceptionally hot afternoons in the coastal and intermediate valleys, and even at stations on the western fringes of the Mojave Desert, such as those in the Antelope Valley and Mojave area. Afternoon and evening winds were quite strong from the west and southwest here during the heat wave. The heat event was decidedly one which favored the Death Valley region and vicinity. Though it was plenty hot in the southern deserts and the Central Valley, high temperatures in these regions were generally not very close to all-time records. On July 12th, after the peak of the heat wave, the air aloft moderated in temperature a bit, and onshore flow into the deserts increased as the marine layer deepened. High temperatures in the Death Valley region dropped a little in response.
This heat event was somewhat unusual in that it was associated with a good deal of mid-level moisture and even some shower and thunderstorm activity, especially on the western side of the upper-level high. I almost wrote (here) that it was associated with a “considerable” amount of moisture, but that would probably be overstating the situation a bit. Precipitable water values (according to the SPC mesoscale analysis web site) ranged from about 0.8” in northern Inyo County to 1.0” in southern Inyo County on the hottest days, July 9-11. These values are at least double what I would think are about average for early July. Dew point values at the Saratoga Springs RAWS station (elevation 198 feet in southern Death Valley) were mostly in the mid-upper 40s on the 9th, low 40s on the 10th, and mid 40s on the 11th. At the NWS coop station at Furnace Creek, dew point measurements were a little higher, mostly upper 40s to low 50s from the 9th to the 11th. These surface dew points aren’t quite high enough to cause much extra discomfort to human beings during hot spells. But, the values are quite a bit greater than the more typical (very dry) dew points in the 20s and 30s on most early summer days in Death Valley. A long-time Death Valley resident likely would have noticed that the air felt a little on the moist side during this event.
The Death Valley region had considerable sunshine during the heart of the event, from the 9th to the 11th. (There would be no chance of record-setting maximum temperatures, presumably, if the region were getting a good deal of afternoon cloudiness.) However, there WAS some scattered mid-level cloudiness about during the hottest parts of the afternoon above Death Valley and above adjacent basins and mountains. There is no doubt that this cloudiness affected high temperatures (at least a little bit) on one or two or three days at some stations. On the 9th and the 10th, under southerly flow on the west side of the upper high, afternoon convection west of Death Valley (especially over the Owens Valley and vicinity) shaded many stations during what is usually the hottest part of the day, moderating the high temperature. I suspect that high temperatures may have been “held down” by some 3-6 degrees (F) in many instances in the Owens Valley and vicinity. For some stations with nearby or overhead altocumulus clouds during the middle of the afternoon, the high temperature might have been tempered by 1 or 2 degrees (F). Still, the air mass was so hot and mixing more than adequate region-wide on each day of the event to allow 2-3 days of record or near-record maximum temperatures at practically all stations. Despite the associated moisture, and local shade due to clouds, and even some storms, this heat event was VERY high-end.
Record Hottest Maximum Temperatures
Let’s do some comparisons of the regional maximums for this event of July 2021 with historic heat waves. I will borrow this little table that I devised for my summary of the heat event of mid-August, 2020, when Death Valley/Furnace Creek had its first authentic temperature or 130F on record. In this table are the maximum temperatures attained during the heat events of July 2021/August 2020/JuneJuly 2013, and the all-time record maximum for the station through July 2021.
2021/2020/2013 all-time maximum temperature
DV/Furnace Creek 130/130/129 130 (130F on August 16, 2020, and on July 9, 2021, records since 1961)
Cow Creek/CARB 124/121/122 124 (1994-present)
Stovepipe Wells 1SW 128/126/126 128 (2004-present)
Saratoga Spring RAWS 127/125/126 127 (2013-present)
Eureka Valley RAWS 115/112/113 115 (2013-present)
Amargosa Vly CEMP 117/115/114 117 (2000-present)
Beatty CEMP 114/111/111 114 (2000-present)
Bishop AP 111/108/109 111 (1944-present)
Daggett AP 118/115/116 118 (1944-present)
China Lake NAS 119/115/116 119 (1945-present)
Needles AP 122/123/123 125 (1940-present)
Desert Rock AP 114/112/113 114 (1978-present)
Las Vegas AP 117/114/117 117 (1949-present, 118F in July, 1931, at Las Vegas COOP)
Baker 119/119/122 123 (several Baker-area stations since 1940)
Tecopa CEMP 122/120/119 122 (2006-present)
Trona 119/116/115 119 (1920-present)
Sarcobatus Flats CEMP 112/109/109 112 (2000-present)
Goldfield 105/101/101 105 (1906-present, coop and CEMP stations)
Tonopah AP 105/103/103 105 (1954-present)
Tonopah CEMP 100/96/98 100 (2000-present)
The heat wave of July 2021 set all-time maximum temperatures at nearly ALL of the stations above in the Death Valley region! Let’s dig into the data sets some…
DEATH VALLEY
The official maximum temperature of 130.0F at Death Valley, at 4:54 p.m. PDT on July 9th, 2021, is the hottest official and reliable temperature on record for Death Valley and for the Furnace Creek-area stations since regular observations began in 1911. This reading barely surpassed the 129.9F reading attained on August 16, 2020. From 1911 to 1960, the hottest temperature recorded was 127F, except for the very questionable and disputed maximums (as high as 134F) in July, 1913.
The official NWS/NPS climate station in Furnace Creek is called “Death Valley.” It opened in 1961, and the nearby Cow Creek and Greenland Ranch stations closed when Death Valley opened. Death Valley had four maximums of 129F from 1961 to 2019 (in 1998, 2005, 2007 and 2013). A new record maximum for Death Valley was set on August 16, 2020, with 129.9F. Less than 11 months later, on July 9, 2021, the Death Valley station hit 130.0F. I have determined via my research and personal familiarity with the Death Valley station that maximums have trended upwards a bit here because the exposure and ventilation has degraded some through the decades. The all-time maximum prior to 1998 was 128F in mid-July, 1972. It is likely that had that heat wave of July 1972 occurred in July 2021, the station would likely have attained at least 130F. (Another way of saying this is: if the heatwave of July, 2021, had occurred in July, 1972, when the instrumentation enjoyed better exposure, the registered high temperature would likely have been much closer to 128F than to 130F.)
Anyway, this latest heat wave of July, 2021, was probably similar in intensity to that of July, 1972. I have long thought that the heat wave of July 14-15, 1972 was, or is, the “gold standard” for the Death Valley region. Many stations here and in the Mojave Desert set new all-time maximum temperature records in 1972, some which still stand. Death Valley had 128F on both the 14th and 15th in July, 1972. Yes, a handful of days with 129F have occurred since 1998, but I think that the somewhat poorer station exposure helped boost these later maximums a degree or two.
From July 8 to July 13, 2021, the official Campbell Scientific weather station in use now at Death Valley registered daily maximums of 125.5F, 126.4F, 130.0F, 129.4F, 127.9F, and 126.6F. I have not checked closely, but this is likely the hottest 6-day stretch of maximums on record for Death Valley since 1911, when Greenland Ranch opened. (Of course, I am disregarding the very questionable maximums of July 7-14, 1913, when all 8 days had recorded maximums of 127F to 134F.). Though the regional air mass and most other stations were slightly hotter on July 10th, Death Valley had its hottest day (130F) on the 9th. I think that a very light wind at the station on the 9th helped to boost the maximum temperature a little on the 9th. The hourly temperature reports for the 9th are below:
Above: Hourly weather data from Death Valley/Furnace Creek on July 9, 2021
The four-degree (F) jump from 4 p.m. to 5 p.m. is somewhat atypical for a Death Valley station during the hottest part of the afternoon. The Campbell Scientific instrumentation has been shown to have a warm bias by a couple of degrees in such circumstances with very light wind and bright sunshine. Note that the wind was calm at 5 p.m., when it was 130F. The more-detailed “HADS” data set shows that 130.0F occurred at 4:54 p.m. PDT (2354Z) and that it was 129.5F at 5:00 p.m. PDT and 129.7F at 5:02 p.m. PDT.
Again, it is very noteworthy that the wind was very, very light during the hottest part of the afternoon at the station. Near-calm wind helps to boost maximums in two ways: by the “natural” way in diminishing mixing and keeping hot air near the ground longer and allowing heat to build up at sensor level, and the “unnatural” way due to instrumentation which provides readings a degree or two too high because of the strong radiation and inadequate (or should I say, “less-than-desired”?) ventilation or aspiration through the shield. I would hazard a guess that an aspirated radiation shield at the Death Valley station on July 9th would have resulted in a max temp of 128 or 129F.
The data provided by the HADS web site for the Furnace Creek station shows the max and min temperatures for each hour. Here are some values for the afternoon of July 9:
Intra-hourly temperature ranges for July 9 at Furnace Creek:
1 to 2 p.m. PDT: min 120.8 max 123.9
2 to 3 p.m. PDT: min 122.0 max 124.4
3 to 4 p.m. PDT: min 122.8 max 126.5
4 to 5 p.m. PDT: min 124.7 max 130.0
5 to 6 p.m. PDT: min 123.3 max 129.7
6 to 7 p.m. PDT: min 123.4 max 126.7
The intra-hourly temperature ranges were about 2.5 to 3.5 degrees (F) from 1 to 4 p.m., when a light breeze blew. The range of 5.3 degrees (F) from 4 to 5 p.m. PDT is definitely on the large side, and can be attributed to the near-calm winds. Given that the station was registering “only” 122.8F at 3:53 p.m. PDT, it is indeed a bit astounding that a maximum as high as 130.0F was attained 61 minutes later.
Note: A study by Court back around 1952 (“Duration of Very Hot Temperatures”) found that temperature tended to stay within a couple of degrees of the day’s maximum for several hours at the Cow Creek station in Dearth Valley. This conclusion was based on the station’s extensive thermograph record. It would be difficult to come to quite the same conclusion based on the hourly data provided by the HADS station in use now at Death Valley. It seems fair to state that the electronic instrumentation in use today is more sensitive to temperature change compared to the thermometers and thermographs which were relied upon during the most of Death Valley’s climate record. The referenced article by Court can be found about two-thirds of the way down here.
As we will see shortly, July 10th was actually the hottest day of the heat wave for the region as a whole. However, The Death Valley Furnace Creek station had a maximum that was slightly cooler than the 9th, with 129.4F. This occurred at 4:27 p.m.PDT, between 126.8F at 4:00 p.m. and 127.7F at 5 p.m. Below are the hourly reports for the 10th:
Above: Hourly weather data from Death Valley/Furnace Creek on July 10, 2021
The 10th was running about four degrees hotter than the 9th from 10 a.m. to noon PDT, and continued to run warmer each hour comparably into the mid-afternoon.
Note that the wind on the 10th was also quite weak, but not as weak as on the 9th during the hottest period. At 5 p.m., with 128F, there was a SSW breeze at 4 mph. I cannot say for sure, of course, but I have a hunch that the slightly more active breeze on the 10th (compared to the 9th) helped to keep the temperature from hitting 129.5F, which would have been rounded up to 130F for the official high. Also, I was at the station and in Furnace Creek on the 10th from 3 to 6 p.m. PDT. There was an area of mid-level clouds shading areas not too far southwest of the station around 4 and 5 p.m. This nearby cloudiness probably was responsible for a somewhat cooler maximum at Furnace Creek on the 10th.
Intra-hourly temperature ranges for July 10 at Furnace Creek:
1 to 2 p.m. PDT: min 122.6 max 126.0
2 to 3 p.m. PDT: min 124.8 max 127.4
3 to 4 p.m. PDT: min 125.9 max 129.0
4 to 5 p.m. PDT: min 126.5 max 129.4
5 to 6 p.m. PDT: min 123.2 max 128.3
6 to 7 p.m. PDT: min 120.3 max 123.0
So, if you are interested in knowing why the 9th was a little hotter than the 10th at Death Valley/FC, my educated guess is that it is a combination of the calm wind at 5 p.m. on the 9th which caused a somewhat inflated maximum (130.0F) on that day, and the nearby clouds mid-late afternoon on the 10th which caused a somewhat diminished maximum on that date (129.4F). Note that the LOWEST intra-hourly temperatures during the afternoon of the 10th were 2-3 degrees (F) HOTTER than those on the 9th.
On July 11, Death Valley/FC reached 127.9F at 4:11 p.m. PDT. The lowest temperature here from 3 to 5 p.m. was 125.1F — hotter than the lowest intra-hourly temperatures from 3-4 p.m. and 4-5 p.m. PDT on July 9! I would venture to say that July 11 was just as hot as July 10 up to 4 p.m. But, some clouds shaded the area around the station on the 11th and disallowed further warming soon after the max temp of 128F at 4:11 p.m. On July 11, afternoon winds from 2 to 5 p.m. PDT were generally SSW at 3-7 mph.
Below are the hourly reports for the 11th at Death Valley/FC:
OTHER DEATH VALLEY STATIONS
The heat event of July 2021 caused record maximum temperatures at the remaining Death Valley weather stations! (Unfortunately, the new automatic station at Badwater was not in operation until August, 2021.) Here are the daily temperature data for Death Valley stations.
(Note: the table above incorporates historical data from monthly tables for Stovepipe Wells 1SW. The individual daily summaries for the same station generally show slightly warmer maximums and slightly cooler minimums, by about 0.1 to 0.3 degrees F. On July 11, 2021, the high temperature at Stovepipe Wells 1SW was 128.6F according to its daily summary for that date. This would be rounded up to 129F in this table, if the daily summary data were to be used.)
The table below provides some long-term averages for maximum temperatures for stations in Death Valley. Note that average daily maximums for July at DV/FC (Death Valley Furnace Creek, 1991 to 2020) are about six degrees warmer compared to the CARB (California Air Resources Board) station near Cow Creek and about two degrees warmer than at Stovepipe Wells and Saratoga Spring. The differences for the average annual maximums are slightly wider. Note that the periods-of-record (POR) differ.
The values in the column of “Record – July AvDlyMx” are the differences between the all-time record max temp and the stations’ corresponding average daily maximum temperature for July. Note how close the values are, station to station (i.e., around 12 degrees). This consistency implies that these differences of 12-13 degrees between the average daily maximum for July and the all-time record maximum for the same station are reasonable. The consistency provides a sense of trustworthiness and confidence in the long-term data and the extreme maximums.
(Second note: the record maximum of 128.3F at Stovepipe Wells 1SW was on July 11 and not on July 10, 2021. Also, the daily summary for July 11, 2021, for Stovepipe Wells 1SW, shows a maximum temperature of 128.6F. The Stovepipe Wells data above are from the monthly summary tables, which apparently provide maximum and minimum daily temperatures which are calculated differently as compared to the data in the daily summaries. See Stovepipe Wells section below for more on this discrepancy.)
Death Valley NP near Cow Creek station, also called Cow Creek/CARB
The CARB station just above Cow Creek (elevation 410 feet above sea level, we will abbreviate it as CC/CARB) is about three miles NNE of the DV/FC station (at the NPS Visitors Center) and is 600 feet higher. Temperature measurements here, made well above the ground on a tower, began in 1994. For about the last 30 years, the average daily maximum temperature for July at CC/CARB is about 6 degrees (F) lower than that at DV/FC. About half of this 6-degree difference can be attributed to the elevation difference, and the other half is due to exposure and ventilation differences (the CARB station is much better exposed). Since the CC/CARB station is so well exposed, with its sensor about 10 meters above the ground, temperature does not fluctuate as much on sunny summer afternoons compared to the DV/FC station. The temperature at CC/CARB is much less apt to change by more than a degree or so (hour-to-hour) mid-afternoon, as mixing tends to be consistently good. Though temperature at DV/FC was 126F at 4 p.m. and 130F at 5 p.m. on the 9th, at CC/CARB it was “only” 119F at 4 p.m. and 120F at 5 p.m. The maximum at CC/CARB on the 9th of 121F was at 6 p.m. (Keep in mind that these “hourly” temps at CARB stations are the highest temperatures attained during the preceding 60 minutes.)
CC/CARB hourly obs (temperature and wind) for July 9th below:
09 Jul 8:00 pm 119 W 4
09 Jul 7:00 pm 120 W 6
09 Jul 6:00 pm 121 W 6
09 Jul 5:00 pm 120 W 6
09 Jul 4:00 pm 119 SW 8
09 Jul 3:00 pm 117 SSW 11
09 Jul 2:00 pm 116 S 11
09 Jul 1:00 pm 114 SSW 9
09 Jul 12:00 pm 113 SSW 6
09 Jul 11:00 am 110 S 7
09 Jul 10:00 am 109 SSW 7
09 Jul 9:00 am 108 ENE 4
Yes, it is quite striking that DV/FC, with 130F at 5 p.m., was a full 10 degrees (F) warmer than the CC/CARB station, despite their close proximity and the elevation difference of only 600 feet. I think this is another good illustration of the somewhat less-than-adequate exposure now for DV/FC, which I have written about at length! And here, too! I should probably note here that clouds were not an issue at Furnace Creek and Cow Creek during the afternoon of the 9th. Also note that wind at the well-exposed CC/CARB station decreased quite a bit from early-to-late afternoon on the 9th. This is a little unusual for a hot July afternoon (the wind typically is getting a little stronger towards late afternoon). With a west wind of only 6 mph at the well-exposed station up at Cow Creek at 5 p.m., it is not particularly surprising that the DV/FC station showed calm wind and was able to creep up to the record 130F maximum around that same time.
10 Jul 9:00 pm 119 SW 7
10 Jul 8:00 pm 121 SSW 8
10 Jul 7:00 pm 122 SSW 11
10 Jul 6:00 pm 124 SSW 11
10 Jul 5:00 pm 123 SSW 9
10 Jul 4:00 pm 123 WSW 8
10 Jul 3:00 pm 122 WSW 6
10 Jul 2:00 pm 120 W 5
10 Jul 1:00 pm 118 W 4
10 Jul 12:00 pm 116 WSW 4
10 Jul 11:00 am 113 S 4
10 Jul 10:00 am 109 S 11
10 Jul 9:00 am 108 SSW 8
CC/CARB’s maximum of 124F on July 10, 2021, is now its hottest on record. The previous hottest was 122F for its period of record beginning in 1994 (with data missing for the summers of 2010 and 2011). Four months from 1994 to 2020 reached 122F here (Jul 1998, Jul 2005, July 2007 and Jun 2013). CC/CARB had only 121F in August, 2020, when DV/FC hit 130F. That was another day with very light wind at the DV/FC station. (The records for CC/CARB show a max temp of 125F on June 19, 2017, but this reading is not credible.)
CC/CARB set its second hottest daily maximum temperature on record on July 11, 2021, with 123F. The report of 123F on the 11th was at 5 p.m. PDT. Wind at 4 p.m. was SSW at 11 mph and at 5 p.m. was SW at 13 mph. Wind increased to SW 19 mph at 6 p.m., with a temperature of 122F.
The temperature reports from this very well-exposed CARB station near Cow Creek indicate that the “free air” in the general Furnace Creek area was actually a couple of degrees (F) warmer on both the afternoons of the 10th and 11th compared to the 9th.
The well-exposed nature of the CC/CARB station, on an elevated ridge just above the floor of Death Valley (with its sensor high up on a pole!), is ideal for the measurement of very warm minimum temperatures. On most nights, the CC/CARB station finds itself above the shallow surface radiation inversions common to Furnace Creek and adjacent areas below sea level. The warmest overnight minimum temperature at CC/CARB during this heat wave was 107F on the morning of July 11. The report of 107F at 7 a.m. on the 11th means that the warmest temperature at this CARB station from 6 to 7 a.m. was 107F. Thus, it is rather probable that the temperature here dropped a little lower than 107F on this morning. This reporting quirk is unique to CARB stations. The wind was active on this morning, averaging 9 mph at 7 a.m. PDT.
From 7 a.m. on July 6, 2021, to 4 a.m. on Jul 14, 2021 (nearly 8 full days), all hourly temperature reports at CC/CARB were from 100F to 124F. Minimums from the 7th to the 13th were 101, 103, 104, 106, 107, 105 and 105F, respectively. Again, since the hourly (only) temperature reports provided from this station are the HIGHEST temperature attained during the previous 60 minutes, it is quite possible, or probable, that temperature here dropped a little lower than the provided values. And again, since CC/CARB is so well-exposed with its temperature sensor high on a pole, temperature changes are usually very small intra-hourly. The range of temperature from the morning of the 6th to the morning of the 14th was only 24 degrees (F)!
Stovepipe Wells 1SW station
The USCRN (U.S. Climate Reference Network) station near Stovepipe Wells is an excellent long-term automatic weather and climate station. It is at an elevation of 80 feet and is about 75 feet above and a mile southwest of Stovepipe Wells. Stovepipe Wells is about 19 miles northwest of Furnace Creek. The nearby terrain is gently sloping and barren. Like the Furnace Creek station, the temperature sensor (actually, there are three!) is about 6 feet above the ground. Unlike the Furnace Creek station, there is no vegetation and there are no structures in the vicinity which might diminish the natural airflow through the station site. And, unlike the official Furnace Creek station, the Stovepipe Wells 1SW radiation shield is ASPIRATED! Stovepipe Wells 1SW is very well-exposed, but since it is low on an alluvial fan and not up on a slope or low ridge as the CC/CARB station, its exposure is not quite as good as that at CC/CARB.
The long-term average daily maximum (of 115.6F) for July at Stovepipe Wells 1SW (2004 to 2021) is a couple of degrees cooler than the latest 30-year average/normal (1991-2020) for Death Valley/Furnace Creek (with 117.4F). If you would prefer, we can do a more apples-to-apples comparison: the average daily maximum for July at Stovepipe Wells 1SW from 2004 to 2021 was 115.6F, and for the same 18 Julys at DV/FC was 118.4F! Since 2004, average daily maximums for July have been 2.8 degrees warmer at DV/FC compared to Stovepipe Wells 1SW.
The elevation difference between the two stations is about 275 feet. The lower elevation at Furnace Creek gives its station an advantage of approximately 1.2 degrees (F) on summer maximums (which change about 4.5 degrees (F) per 1000 feet in the region. The remaining difference of about 1.6 degrees (F) can be attributed primarily to the differences in exposure between the two stations. The Furnace Creek station is not as well exposed. Thus, ventilation through the station is not as good, and hot air that builds up near the instrumentation (on summer afternoons) is less efficiently mixed out and up and away comparably. There is also a real possibility that vegetation south of the Furnace Creek station (a date grove and a golf course) contributes some towards MODERATING afternoon high temperatures some at DV/FC, since most summer afternoon winds here have a southerly component. If this is the case, then this moderating effect is effectively masked, (or overwhelmed?), by the current exposure/ventilation conditions. Also, the non-aspirated radiation shield at Furnace Creek may contribute some to the average maximum temperature differences between the two stations.
Stovepipe Wells 1SW set an all-time high temperature record on July 10, 2021, with 128.1F, and that was broken (barely) a day later with 128.3F. Previous record maximum temperatures were 125.8F on August 17, 2020 and 125.9F on July 5, 2007. So, interestingly, on July 9, 2021, when the official Furnace Creek station hit 130.0F, Stovepipe Wells 1SW was only able to reach 122.6F. Satellite imagery shows that Stovepipe Wells and vicinity was heavily shaded by clouds during the afternoon of the 9th, whereas Furnace Creek was not. As was the case at the CARB station just above Cow Creek, July 10 and 11 were both hotter at Stovepipe Wells compared to the 9th. (In August, 2020, Stovepipe Wells was also a little hotter on the 17th versus the 16th. Furnace Creek hit a record 129.9F on the 16th.)
Though the record at Stovepipe Wells 1SW consists of only 18 summers so far (2004 to 2021), it is doubtful that any other days since the heat event of mid-July, 1972, have been as hot here as July 11, 2021, with 128.3F. The 24-hour (midnight-to-midnight) minimum temperature of 107.8F at Stovepipe Wells 1SW on July 11, 2021, is likely the hottest reliable minimum temperature on record for the United States.
And, having written all of the above, a little more digging into the official records for Stovepipe Wells 1SW reveals that the actual daily maximums provided above may be slightly incorrect. The numbers above are from the “monthly summary” pages for Stovepipe Wells 1SW. Also available on the USCRN web site are “daily summary” pages, and the maximums and minimums on these pages do not necessarily match those on the monthly summary page. No, I do not know the reason for this. Anyhow — here are the numbers from the daily summary pages:
Maximum at Stovepipe Wells 1SW on July 11, 2021, was 128.6F (versus 128.3F on the monthly summary page)
Maximum at Stovepipe Wells 1SW on July 10, 2021, was 128.3F (versus 128.1F on the monthly summary page)
Maximum at Stovepipe Wells 1SW on July 09, 2021, was 122.8F (versus 122.6F on the monthly summary page)
Maximum at Stovepipe Wells 1SW on August 17, 2020, was 125.9F (versus 125.8F on the monthly summary page)
Maximum at Stovepipe Wells 1SW on July 05, 2007, was 126.1F (versus 125.9F on the monthly summary page)
Minimum at Stovepipe Wells 1SW on July 11, 2021, was 107.7F (versus 107.8F on the monthly summary page)
These daily extremes provided on the daily summary page are generally a couple of “tenths” wider as compared to the values provided on the monthly summary. Why can’t these folks make things easy for us climatologists?! All of the data provided in the tables on this web page for Stovepipe Wells 1SW are based on the numbers provided in the monthly summaries. But, I am comfortable saying that the all-time maximum temperature for Stovepipe Wells 1 SW is 129F, on July 11, 2021, which is rounded up from the station’s official reading of 128.6F as provided in its daily summary data!
SARATOGA SPRING
The one remaining low-elevation station in Death Valley is the RAWS station at Saratoga Spring. This station is at 198 feet (above sea level) and is about 50-60 miles SSE of Furnace Creek. It has 9 summers of data available so far (2013 to 2021). As you might know, I advise extreme caution when dealing with maximum temperature data from RAWS stations. Some RAWS stations seem to read several degrees too warm under bright sunshine and with light winds, due to radiation shields which just are not very good. The RAWS station at Saratoga Spring may or may not be too bad in this regard — I haven’t looked too closely at its data yet. Average daily maximums in summer here are similar to those at Stovepipe Wells 1SW, which is just 118 feet lower in elevation. So, let’s go ahead and assume that the highest summer maximums at Saratoga Spring are reasonably good…with a little trepidation…
Saratoga Spring had a maximum of 127F on July 11, 2021. It had 125F on the 9th and 124F on the 10th. The 127F temperature is its hottest on record! Interestingly, or maybe “somewhat alarmingly,” all of the daily maximums here from the 9th to the 11th occurred between 6 and 7 p.m. local standard time. This would be between 7 and 8 p.m. PDT, if we can assume that the time information on the RAWS web site is correct. Maximums this late in the day (just an hour or so before sunset!) seem odd. The temperature at Saratoga Spring on the 9th, 10th and 11th was generally some 2 to 4 degrees lower during what is usually the hottest part of the afternoon as compared to these late-occurring maximums. I would need to do a lot more research of this station before saying that these daily maximums are very likely bogus. But, I do think that it is possible that the low sun angle might be helping to bump up the temperature late in the day due to a “junky” radiation shield. I also do not know how much the local springs environment might play a role in keeping daytime temperatures moderated.
Prior to 2021, the hottest temperatures at Saratoga Springs RAWS were 125F in August, 2020 (and other months), and 126F in June and July of 2013.
The main takeaways for this heat wave for the Death Valley region:
—Highs of 130.0F at DV/Furnace Creek, 128.6F at Stovepipe Wells/1SW, 127F at Saratoga Spring, and 124F at DVNM/Cow Creek/CARB are the hottest reliable readings for all of the stations for their respective periods of records. The record heat wave was not surprising, given the time of the year (first half of July), given the strong upper-level high pressure system that was over the region, and given the very hot air between the 850 and 600mb levels, including temperatures from 19.2 to 20.0C at 700mb from the 9th to the 11th (from the soundings at Las Vegas taken around 4 p.m. PDT). Also important to note is that skies were mostly clear for the region, though it is very plausible that some mid-level clouds kept high temperatures in some parts of the region (if not at some of these Death Valley stations) at levels a little lower (1-3 F degrees?) than they otherwise would have been on at least one of the days from July 9-11.
—Only a couple of other heat waves since 1911 might have been about as hot as this one, namely those in 1931, 1933, 1972 and 2013. (The heat waves of 1998, 2005 and 2007, when Furnace Creek had 129F, deserve honorable mention.) I don’t include the August 2020 heat wave, despite the 129.9F at DV/Furnace Creek, since maximums at regional stations were generally a couple of degrees cooler than this heat wave of July, 2021. The maximums at Cow Creek/CARB and Stovepipe Wells/1SW in July, 2021, were both two degrees (F) hotter than previous record maximums.
—Another takeaway: The very hot air mass and all-night mixing of the low-levels caused a couple of extremely warm overnight minimums, including 107F at Cow Creek/CARB and 108F at Stovepipe Wells/1SW on July 11. These are probably the hottest reliable daily minimum temperatures on record for the United States. (Greenland Ranch had a handful of minimums at and near 110F prior to 1930, when periods of unreliable temperature reports were not unusual.)
—And, the final takeaway: Though the other three weather stations in Death Valley had their hottest maximums on the 10th and the 11th, and though sounding data showed the 700 mb layer to be a little hotter on the 10th and 11th versus the 9th, the official DV/Furnace Creek station had its hottest temperature on the 9th. This was, or is, probably due to differences in the local wind condition in the Furnace Creek area (though we can’t totally rule out some mid-level cloud-cover influence). That is, winds were lighter (and near calm) on the afternoon of the 9th when 130.0F was attained. Breezier conditions on the 10th and the 11th helped to better mix the near-surface air a little, presumably, and kept the station a trifle under 130F. The poorer exposure of the unaspirated DV/Furnace Creek station (comparably) does tend to permit an extra “boost” on maximum temperature when winds are near calm (and when the sun is high and bright, of course). It is suspected that the 129.9F maximum on August 16, 2020, was also “boosted” some during near-calm conditions. I should emphasize here that these exposure conditions and wind conditions and station conditions (i.e., not aspirated) do not necessarily mean that some maximum temperatures are less worthy or less credible. The official DV/Furnace Creek station is reliable, is of high quality, and is generally sited adequately! But, it is important to be aware of these influences on maximum temperature measurement which would normally receive little notice. I wish that we could get the current Death Valley/Furnace Creek station sited further from the influence of the vegetation and buildings around the Visitors Center, to a spot that is better exposed. Station environments tend to change through the decades, and it is almost always that the changes result in a warming of both maximums and minimums. That has been the case here at the Furnace Creek station in the past 60 years.
CEMP STATIONS
I decided to lump many of the CEMP stations together here for comparison. Many of these CEMP stations supplement the data sets from nearby cooperative weather stations. The first table below provides some long-term averages and extremes for the Death Valley stations and the selected CEMP stations. The second table provides some annual maximum temperature data for selected years when the Death Valley region had record or near-record maximums. I had to dig into the online archived CEMP station numbers (and the Death Valley stations, too!) to determine these averages and extremes, so maybe we should consider the data as “probably very good,” but not “official.” Most CEMP stations are located in towns, above or near bare ground and pavement, and often where ventilation is compromised at least a little due to buildings in town. Nevertheless, most CEMP stations provide great temperature data and are awesome! The one CEMP station with bad exposure issues looks to be the one in Las Vegas. Most of these CEMP stations have data back to around 2000-2002. A couple were installed a few years after 2002.
and, below, a quick table providing the CEMP daily maximums from July 9-11:
CEMP station maximums, July 9-11, 2021
Tecopa 121/121/122
Las Vegas 119/121/119
Mesquite 120/119/116
Indian Spgs 110/114/111
Alamo 111/111/109
Rachel 105/107/107
Pahrump 113/114/117
Amargosa V. 113/117/116
Beatty 109/114/113
Sarcobatus F. 109/112/111
Goldfield 103/105/104 (and 105F on July 12)
Tonopah 98/100/99
For the CEMP stations listed above, the hottest temperatures were recorded on the 10th for the most part. Exceptions were the stations farther east, such as Mesquite and Alamo, which were hottest on the 9th, and Pahrump and Tecopa, which were hottest on the 11th.
Tecopa CEMP July 09 Tecopa CEMP July 10 Tecopa CEMP July 11
The hottest (and lowest) CEMP station is the one at Tecopa/Shoshone, at an elevation of 1337 feet. This station is adjacent to the Post Office building in Tecopa. The average daily maximum for July here (based on 2006-2021 data) is 109.2F, or about 8.5 degrees (F) lower than that for the DV/Furnace Creek station from 1991-2020. The all-time maximum temperature here at Tecopa (since 2006) was 120F, until it hit 121F for both July 9 and 10 and then 122F for July 11 (in 2021). Tecopa hit an impressive 120F with the heat wave of August, 2020, and 119F in June 2013 and July 2005. The hourly and daily data for the heat event at Tecopa CEMP are provided above. Note that the maximum temperature for the day as indicated on the monthly form is generally a degree or two higher than the highest hourly temperature on the daily forms. (And this is the case for all CEMP stations.)
On July 9, when the max temp at Tecopa CEMP was 121F, the daily “march of temperatures” through the afternoon was quite typical, with 118.6F at 4 and 5 p.m. PST and 118.1F at 6 p.m. (I think we can assume that these times in the CEMP tables are PST, but I am not 100 percent positive.) In contrast, July 10 had hourly temperatures from 116.0F to 116.4F at 1, 2, 4 and 5 p.m. PST, with only 114.5F at 3 p.m. PST. I would surmise that some mid-level clouds were interfering with the sunshine around 3 p.m. at Tecopa to moderate the temperature some. There must have been a decent stretch of bright sunshine in-between two of these (top-of-the-hour) readings as the maximum made it to 121F. On the 11th at Tecopa, there is no indication that clouds influenced afternoon temperatures. It was 119.9F at 3 p.m. and 119.5F at 4 p.m. PST. Perhaps the max temp of 122F was between 3 and 4 p.m., but the 0nline CEMP tables don’t provide the times of the max and min temperatures.
Recall that the Death Valley/Furnace Creek station had its hottest temperature on July 9th, when wind was very, very light towards mid and late afternoon. I suspect that the very light wind helped to bump the temperature up to 130.0F at Death Valley on the 9th. Similarly, the Tecopa CEMP station had very light winds on the 9th. Average wind speed was about 4 mph from 1 to 4 p.m. PST here, and weakened even further at 5 p.m. (2.3 mph) and 6 p.m. (1.5 mph). As stated above, the highest hourly temperatures on the 9th at Tecopa were 118.6F at 4 and 5 p.m. Wind during the afternoon at Tecopa on the 10th was lighter still (under 1.5 mph from 2 to 7 p.m. PST), so it might not be particularly surprising that the maximum was able to jump up to 121F again (when the sun came out!).
The Beatty CEMP station (3215′) smashed its old (CEMP) record of 111F (set in several years) with a 114F on the 10th. (A cooperative station in Beatty had 114F and 115F in 1960 and 1961, respectively.)
On the 10th, when the record of 114F was set at Beatty, wind switched from ENE 3 G10 at 4 p.m. to SSW 6 G16 (mph) at 5 p.m. Chances are good that the max temp for the day at Beatty occurred close to 4 p.m. (temp 112.2F) and close to the time of the change in wind direction.
Beatty Mon Max Beatty 8N Mon Max
Beatty CEMP July 09 Beatty CEMP July 10 Beatty CEMP July 11
The Indian Springs CEMP (3160′) also handily broke its old record of 112F (in 2005 and 2007) with 114F on the 10th. An Indian Springs cooperative station (1939-1964) had a 118F in June, 1954, and a 115F in July 1960 and June 1961. Given the elevation above 3000 feet for this settlement, it would not be surprising to learn that the exposure of the cooperative station at Indian Springs was not particularly good during the 1950s and 1960s. Authentic temperatures of 118F at 3000 feet are extremely rare. Recall that Trona, at 1695 feet elevation, went about 100 years with an all-time record maximum of 118F (1920 to 2020) before finally hitting 119F in 2021. The 114F at Indian Springs CEMP on July 10, 2021, is likely a much, much better representative value for the hottest temperature on record for Indian Springs. An airfield just north of Indian Springs (KINS) shows a maximum of 112F (on the 10th) for the heat event of July 2021.
Indian Spgs CEMP July 09 Indian Spgs CEMP July 10 Indian Spgs CEMP July 11
The Pahrump CEMP (2640′) broke its old record of 116F in July 2005 with a 117F on July 11th, 2021. A long-term cooperative station at Pahrump (1958 to present, with some earlier years, too) had a 117F in July 1924, but since 1958 the highest here is 115F (June of 1961, Julys of 1960, 61, 72, and 2021). August 2020 hit only 112F at Pahrump, to tie the all-time maximum for Pahrump in August since 1958.
The hourly temperatures at Pahrump for the 10th suggest that clouds were moderating temperature some during the mid-afternoon. The wind picked up briefly around 3 p.m., also (gusting to 23 mph), so perhaps a convective downdraft or shower was nearby.
A light-to-moderate SW to WSW wind was blowing during the afternoon of the 11th at Pahrump, and it appears that clouds and nearby convection were absent. The hourly temperatures from 2 to 5 p.m. were a few degrees warmer compared to the 10th, and the high of 117F on the 11th was 3 degrees hotter than the high on the 10th.
Pahrump CEMP July 09 Pahrump CEMP July 10 Pahrump CEMP July 11
Pahrump Mon Max A Pahrump Mon Max B Pahrump Mon Max C
Amargosa Valley CEMP (2425′) handily broke its old record max of 115F (in July 2002 and August 2020) with 117F on July 10th, 2021.
The cooperative station at Amargosa Farms-Garey (1978-2014) had a record of 117F in July 2002. It was 115F in July 2013, and several previous summers hit 116F (at the coop station). This particular station was at Lathrop Wells 16SSE (elevation 2176 feet) from 1971-77, hitting 118F for the very high-end heat wave of July 1972 (when Death Valley had 128F).
And, I would be remiss if I neglected to mention an old, short-lived station called Clay City. The weather station here was high-end, with wind and evaporation data alongside the daily temperature and precipitation numbers. Here is what I typed regarding Clay City in the heat-wave summary for July 1931:
Clay City was a small community near the CA/NV border, south of Amargosa Valley and north of Death Valley Junction, at an elevation of 2185 feet. Weather records here run from 1926 to 1937.
Clay City hit 116F in the hot Julys of 1931 and 1933, and on the mornings of August 11, 12 and 13 of 1933, 24-hour maximums of 116F, 117F and 118F were recorded (respectively)!
It would appear that the heat event winners for the Amargosa Valley and vicinity are:
August 1933 (118F at Clay City),
July 1972 (118F at Lathrop Wells 16SSE),
July 2002 (117F at Amargosa Farms-Garey), and
July 2021 (117F at Amargosa Valley CEMP)
Given that authentic temperatures of 120F are very rare at elevations of 2000 feet in the region, these numbers (of 117F and 118F) neatly fit into the highest expected values for elevations from about 2200 to 2400 feet.
Amargosa CEMP July 09 Amargosa CEMP July 10 Amargosa CEMP July 11
This is a good spot to squeeze in the numbers for Desert Rock Airport (elevation 3238 feet), which is east of Amargosa Valley and west of Indian Springs. This airport is also called “Mercury Desert Rock AP.”
Mercury Desert Rock AP Mon Max
The temperature record at this military airport (KDRA) in the Mercury Valley appears excellent. Hottest temperature at Mercury/KDRA was 112F in four different Julys (1985, 2002, 2005 and 2007) since its first summer of operation in 1978. The big heat event of June 30/July 1 2013 saw maximums of 113F for both months. And, after a couple more 112s (in July 2016 and August 2020), Mercury/KDRA managed its first 114F on July 11, 2021! The 3:53 p.m. PDT hourly METAR at KDRA (on the 11th) showed a temperature of 114F and a WSW wind at 13 mph, gusting to 23 mph.
Its similar elevation to Indian Springs, the usually trustworthy and well-exposed airport weather instrumentation at Mercury/KDRA, and Mercury’s 44 summers of record with an extreme maximum of 114F, I think all combine to throw more doubt on the 118F at Indian Springs in June, 1954. Authentic temperatures of 115F and higher are extremely rare at elevations above 3000 feet in the Death Valley and Mojave Desert regions!
Sarcobatus Flats CEMP (4016′) registered the first 112F for that area on July 10th! The previous high at the CEMP station was 109F on at least six different dates since 2000. A cooperative station here from 1942 to 1961 had a 111F in July 1959 and a 110F in July 1960. It is unfortunate that this station was not open in July, 1972. Authentic temperatures of 110F or more at elevations above 4000 feet are very rare, as are 120F-plus temperatures for places at 2000 feet and above, and 129F for sea level and above! The heat wave of July 2021, pretty much hit the top of the extreme maximum temperature scale for the region. This area of Nevada is flat and empty, so exposure and ventilation should be excellent.
On July 10, 2021, highest hourly temperature at the Sarcobatus CEMP station was 109.3F at 4 p.m. PST. Early afternoon winds from the north at about 6-16 mph shifted to westerly a little prior to 3 p.m. PST. A little lull in the wind around 3:20 p.m. PST helped to get the temperature up to 112F, and then the breeze from the west increased again and the temperature dipped slightly below 110F after 3:40 p.m. PST.
Sarcobatus Flats CEMP July 09 Sarcobatus Flats CEMP July 10 Sarcobatus Flats CEMP July 11
Sarcobatus Flats CEMP July 2021
Goldfield CEMP (5625′) really smashed its previous record maximums (of 101F in six summers since 2000) with 105F on July 10th! It actually first set a new record with 103F on the 9th, and followed that up with 105F on the 10th and 104F on the 11th. For good measure, this station added another maximum of 105F on July 12. Goldfield boasts a very long and generally good climate record that runs from 1906 to 2009, with a handful of missing years. The long-lived cooperative station had reliable maximums of 103F in July 1931, August 1934, and July 2002. There were a couple of other possibly suspect maximums of 103F in a couple of other years (perhaps due to a so-so station siting), and there were also a couple of extremely suspect maximums of 108F in July 1906 and June 1935. The two 108s are not supported by data at any nearby stations (and by a large margin)! Anyway, the 105F at the Goldfield CEMP is quite impressive. It is a good indication of the very hot airmass over the higher-elevation areas north of Death Valley for this heat event of July 2021. Authentic temperatures of 101F or higher at elevations of 6000 feet or higher in the Death Valley region and Mojave Desert are very rare, and Goldfield is only 375 feet shy of 6000 feet. Some old vehicles, structures and signs are close enough to the Goldfield CEMP station to help restrict ventilation some and probably allow maximums here to creep up a degree or so during light winds on the hottest days.
Goldfield CEMP July 09 Goldfield CEMP July 10
Goldfield CEMP July 11 Goldfield CEMP July 12
Goldfield coop mon max A Goldfield coop mon max B Goldfield coop mon max C
(the first decade of record at the Goldfield coop station was a mile north, at Columbia)
Just up the road from Goldfield is Tonopah. The CEMP station in town is at 6110 feet, and it managed a maximum of 100F on July 10th. This temperature is very impressive given the high elevation and Tonopah’s elevated position (along a ridge line) above the surrounding terrain. (Elevated areas are generally much better ventilated than areas near streams and rivers. The better ventilation means that the ambient air is less apt to get a local boost in temperature when winds are weak.) The previous maximum at Tonopah CEMP was a 99F in July 2002 (with records since 2000). The average daily maximum for July at Tonopah CEMP is 88.7F. The cooperative station at Tonopah hit 103F in July 2021 (and in June 2017), higher than any other Tonopah weather station since records began at a USWB station in the late 1800s. It is likely that this current cooperative station suffers some from inadequate exposure, however, and that 2017 max of 103F needs looking into. The “gold standard” maximum temperature at Tonopah is the 98F in July 1931. Later station moves resulted in a couple 99s in the 1940s and 1950s, but it is doubtful that the exposure was as good then compared to the older USWB siting. Tonopah was without a cooperative station in town from 1954 to 2011.
Several miles east of Tonopah is Tonopah AP, at 5426 feet. The hottest day here (POR 1954 to the present) was in July 1960 with 104F, until the 105F on July 11th, 2021! Tonopah Airport also had 104F on July 9, 10 and 12 in 2021.
Tonopah CEMP July 09 Tonopah CEMP July 10
Tonopah CEMP July 11 Tonopah CEMP July 12
Tonopah coop mon max A Tonopah coop mon max B Tonopah coop mon max C
Tonopah AP mon max A Tonopah AP mon max B
SUMMARY FOR THESE CEMP STATIONS: All of the CEMP stations closest to Death Valley, from Tecopa on the south to Tonopah on the north, set all-time record maximum temperatures in July 2021. Most of these stations opened around 2000, with some as late as about 2007. New records ranged from one to three degrees (F) higher than the previous highest. The record maximums of July 2021, at these CEMP stations rivaled all-time record maximums set at other nearby long-term cooperative stations in town.
Other Nearby Cooperative Stations
Yep, there are a lot more long-term weather stations to check! Let’s start to the south…
…at Trona, elevation 1695 feet…New all-time record max of 119F on July 10, 2021
Trona July 2021 Trona monthly maximums A Trona monthly maximums B
(Trona had a long run of very unreliable data from about 1992 to 2003. Trona temperature data during this timeframe should be considered flawed. Minimums appear to be more problematic than the maximums.)
A cooperative weather station opened at Trona (elev. 1695 feet) in 1920. Amazingly, Trona’s all-time maximum temperature was 118F as early as August 1933, and in 2020 its all-time maximum temperature was still 118F. A total of ten summers between 1933 and 2021 hit 118F at Trona, including the big-time heat event of July 1972. Finally, on July 10, 2021, the cooperative station at Trona hit 119F. Chalk up another win for 2021! After 100 years of record, Trona had a maximum higher than 118F. One would think that a 120F maximum here would not be TOO difficult, since Trona is a full 300 feet below 2000 feet. One aspect for Trona which might help keep summer afternoon temperatures down a degree or two is — its aspect! Trona is on the western side of Searles Dry Lake and on the eastern side on nearby mountain slopes. Thus, it is situated such that the area does not catch the mid-and-late afternoon solar radiation quite as efficiently as would a town on desert flats or along western-facing slopes.
Randsburg, elevation 3570 feet…New all-time record max of 114F on July 10, 2021
Randsburg July 2021 Randsburg Mon Max.
More than half of the daily temperature data were missing for Randsburg during July 2021. Fortunately, the hot spell from July 7-12 is not missing. Randsburg temperature data begin in 1937, and the quality and reliability appear to be very good for just about all of its period of record. (It appears that missing days have become more commonplace since 2017.) I visited the station a few years ago and found the instruments rather close to the town’s fire station (see pic above, looking north, from April 2016). I was not very impressed with the exposure, but the Randsburg maximum temperature data through the years do not suggest a poor exposure. Prior to 2021, Randsburg had failed to attain a temperature greater than 111F. After 83 summers, Randsburg smashed the 111F record with a 114F on July 10. (This was recorded at 8 a.m. on the 11th). The next day was nearly as hot, with 113F. The Randsburg climate form for July 2021 shows a minimum temperature of 39F for the 11th, but I think the observer transposed the two numerals and entered “39” instead of “93.” Or, more likely perhaps, the minimum was “89.” Minimums in the 90s at Randsburg are extremely rare (just one since 1937, a 92F on August 12, 1940).
Barstow Fire Station, elevation 2220 feet — record 115F for the Fire Station location on July 10 and 11, 2021
Barstow July 2021 Barstow July 2021 B
Barstow town Mon Max (pre 1980) Barstow town Mon Max B (pre 1980)
Barstow FS Mon Max (post 1980)
The Barstow temperature record is split into a few parts. There were stations in town, near the Mojave River, from 1903 to 1920, and then from 1939 to 1979. The Barstow weather station was relocated to the new fire station in 1980. This was on a hill near I-15, about 100 feet higher than the previous stations in town. The Barstow FS shelter was above grass when I checked it out for my Masters Thesis work in the early 1980s. The Barstow FS maximums of 115F on both the 10th and the 11th of July 2021 (recorded on the mornings of the 11th and 12th) are the highest reliable maximum temperatures on record for the newer fire station location. (Edit: The Barstow FS closed and the Barstow climate station was moved a little north and 100 feet lower around 2005.). The Barstow FS station reported a 115F in July 1995 and a 120F in July 1996. The 115F in July 1995 looks okay, but the 120F on July 23, 1996 is a bad report. Nearby Daggett AP showed a maximum of 111F on the date, and it is usually a little warmer. Climatological Data disregarded the 120F report (they changed it to 107F), but the 120F reading shows up in the Western Region Climate Center tables for Barstow. It should be tossed.
Anyhow, there was one other day with a reliable temperature above 115F in Barstow’s long record, and that was the 116F on July 14, 1972. That was from the station in town, and it is authentic. I strongly suspect that the same location would have registered a 116F or a 117F, perhaps even a 118F in July 2021. The Barstow FS on the hilltop is generally a couple of degrees cooler on summer maximums due to its slightly higher elevation (which would make it 1/2 degree F cooler comparably), its hilltop location (which promotes better ventilation and cooler maximums), and perhaps its grassy ground cover. I do not know what the ground cover was in July 1972 at the old station. (Edit again: So from about 1979 to 2005 the instruments were at the conservative Barstow FS site on a hilltop near Interstate 15, at 2320 feet, with grass below the shelter. Since about 2005, the station elevation is 2220 feet, it is closer to the river to the north of Interstate 15, and I haven’t checked the exposure of it!)
At an elevation just a little over 2000 feet in elevation, it is somewhat surprising that Barstow has only exceeded 115F on one day since 1903. (Unfortunately, the Barstow station was not operating during the very hot summers of 1931 and 1933). It may be that its weather station has been sited generally conservatively through the years with good exposures (which is the case with the current Barstow FS). And, it may be that the station in town (prior to 1980) was above grass. I need to look for some old photos of it.
Barstow-Daggett AP, elevation 1917 feet — record of 118F tied on July 10, 2021
Daggett AP Mon Max A Daggett AP Mon Max B
Barstow-Daggett AP has an excellent long-term climate record, beginning in 1944. The instruments have always been well sited and well-maintained, with reliable FAA observers, presumably! Today the ASOS equipment is taking the measurements automatically out along the runways. All-time maximum temperature records at Daggett were broken in 1960 and 1961 with 115F, and broken again in mid-July 1972 with 117F (there’s that 1972 event winning again!), and then a toasty 118F on June 30, 1994. The 110F at Barstow FS does not support this 118F at Daggett AP very well, but near all-time record highs of 118F at Trona, 128F at Death Valley, and 121F at Iron Mountain do lend good support. Daggett AP managed to reach 118F on a couple of later dates: in July 2007 and on July 10, 2021. It appears that the minimum temperature of 90F at Daggett AP on July 11, 2021, is the warmest minimum on record for the station. Don’t quote me — this is based on the record daily data off of the WRCC site.
Note that Trona, Randsburg, Barstow and Daggett AP were all 4-6 degrees cooler on maximum temperature on July 9, 2021, compared to July 10th. So was Stovepipe Wells! The Death Valley Furnace Creek station was hottest on the 9th (130.0F on the 9th and 129.4F on the 10th). This was due presumably, to a combination of the Death Valley’s somewhat compromised exposure and very light winds on the afternoon of the 9th, and perhaps due to some nearby cloudiness on the 10th. But, again, it was the 10th which was hottest, with the 11th very close behind, for Mojave Desert areas in eastern Kern and western San Bernardino counties.
East of Daggett, at Iron Mountain (118F) and Needles AP (122F), maximums during the heat event of July, 2021, fell a few degrees short of all-time record high temperatures. Unfortunately, cooperative weather stations at Amboy and Baker were not in operation in July 2021. An automatic Caltrans station one mile southwest of Baker had maximums of 119F on the 9th, 10th and 11th. The temperature sensors for such stations are usually well up on a pole, and thus tend to be more conservative on maximums compared to a typical cooperative weather station (and compared to an ASOS station), where the radiation shields and temperature sensors are typically 5 to 6 feet above the ground. The highest reliable maximum on record at Baker is a 123F in mid-July 1972. There was a 124F in Baker at the Caltrans Yard in July 1980, but that yard was very poorly ventilated and high temperatures were several degrees too high for several summers. A maximum of 123F at Baker 9NNW on August 10, 1969, has no support from surrounding stations. A well-ventilated and standard cooperative weather station in Baker in July 2021 probably would have reached 121 or 122F. The same goes for Amboy!
Las Vegas Airport/KLAS, elevation 2180 feet, record of 117F tied on July 10, 2021
Las Vegas AP Mon Max A Las Vegas AP Mon Max B
Las Vegas coop Mon Max A Las Vegas coop Mon Max B
Las Vegas Airport (KLAS, elevation 2180 feet) has temperature data back to 1949. Six summers managed to reach 116F here through 2004, and finally a 117F maximum temperature occurred in July, 2005. The Junes of 2013 and 2017 also hit 117F, and this record was tied again with the 117F on July 10, 2021 (following a 116F on the previous day). The minimum of 94F on the 10th is one degree shy of the all-time warmest minimum at KLAS, apparently.
Just across the freeway on Dean Martin Drive is the NWS forecast office building. Instrumentation here yielded hotter maximums compared to Las Vegas AP (aka McCarran, Harry Reid). Here is a comparison of maximums from the 8th to the 12th at KLAS AP, the Las Vegas NWFO, North Las Vegas AP (KVGT), and Nellis AFB/KLSV:
KLAS/LV AP 114 116 117 114 113 2180′
LV NWFO 118 119 119 118 117 2275′
KVGT/N LV AP 115 117 118 116 113 2203′
KLSV/Nellis AFB 113 115 117 115 111 1880′
The maximums at North Las Vegas AP/KVGT were a degree or so higher than those at KLAS, and even 1-2 degrees (F) hotter than at Nellis AFB/KLSV despite being 320 feet higher in elevation. Why would there be higher maximums at the higher-elevation airport? I suspect that it is probably due to some of the tried-and-true reasons that I discuss frequently! The exposure and ventilation of the instrumentation might be a little better at Nellis than at North Las Vegas AP. Since airports generally have excellent exposure, that explanation may not fly. How about different ground covers? Is there black asphalt near and around the North Las Vegas station to help boost maximums? Is the Nellis ASOS near or above grass or natural ground cover? I don’t know. Or, maybe just being in and around the large urban area of Las Vegas helps to boost the North Las Vegas maximums some. The typical summer afternoon breeze is from the south here, wafting through a lot of urban environs prior to reaching the airport. On the other hand, a south wind approaching Nellis AFB is moving through a residential area, with some trees and lawns. That air would be cooled slightly on summer afternoons. Another possibility is that by a quirk of nature, some cloudiness kept maximums at Nellis down a tad each day during this event. There were showers around Las Vegas during the heart of this heat event. One last possibility. Perhaps one or more of these temperature sensors were a little out of calibration. I would hope that this is not the case, but I have worked at airports as a weather observer for more than 15 years and have closely examined ASOS temperatures at many airports for more than 25 years. It is not that unusual for the ASOS temperatures to drift a little out of calibration, and when they do, they tend to go higher! The NWS is tasked to keep tabs on these things. Some offices do a great job and they quickly jump on any problems. Sometimes stations that are slightly out-of-calibration remain that way for years. Another occasional problem with ASOS is that the aspiration fan can fail. These electronics don’t last forever, you know! And, they tend to falter during the most extreme weather. When the aspiration fan quits on the ASOS, the temperature goes too high on sunny afternoons. Usually the temperature problem is quite obvious in these instances.
Anyway, enough of the postulating on that. I really don’t know why North Las Vegas AP was warmer each day than Nellis.
But, I think I do know why the Las Vegas forecast office (NWFO) was hotter than all of the airports —- exposure! The instrumentation is probably above bare ground and not too far from the office building. The exposure might be adequate for the most part, but you know the story: when the ventilation is diminished by nearby structures and trees and/or walls and fences, the maximums go up on summer afternoons for desert stations above bare or natural ground cover.
The Las Vegas CEMP station shows a max of 121F for July 10. This station’s exposure is not adequate! By the way, other now-closed Las Vegas-area stations, such as Sunrise Manor and North Las Vegas Doxarm, have reported maximums of 120 and 121F. I haven’t looked closely at these records, but let’s just say that I would not be surprised if the exposure at these stations was not nearly as good as at the area airports.
Let’s get back to the Las Vegas record of 117F. A reliable cooperative station in Las Vegas operated from 1913 to 1956. The observer was “Pop” Squires. (Some temperature records for Las Vegas prior to 1913 are not very good.) This cooperative station hit 118F in the big heat event of July, 1931. The NWS in Las Vegas does not recognize this report. The NWS in Las Vegas currently states that 117F is the city’s all-time record maximum temperature. That is fine, if they want to stick with the higher-quality, long-term airport data and disregard the old cooperative station. But, the 118F report appears to be legitimate, appears to be authentic, and if I were in charge of these things, then I would be going with the 118F in 1931 for the all-time record maximum for Las Vegas. Since the NWS in Las Vegas dismisses the earlier reasonable report of 118F in Las Vegas, why do they accept the 134F at Greenland Ranch in July 1913? Why do they not dismiss a record maximum that has little or no support that is in their own forecast area? There seems to be some inconsistency here!
Desert National Wildlife Refuge (elevation 2914′) falls well short of its record of 117F! What is going on?!
Desert Ntl Wildlife Refuge July 2021
Desert NWR Mon Max A Desert NWR Mon Max B
About twenty miles northwest of Las Vegas is the Desert National Wildlife Refuge (2914 feet). Records here extend from 1940 to 2021 — not bad! This station hit 112F on July 10, 2021. (It also reached 112F on June 17, 2021!). This 112F in July, 2021, is rather odd, as a handful of other summers in the past few decades have been quite a bit hotter: 115F in July 1985, 115F in July 1998, 114F in July 2001, 117F in July 2003, and 116F in July 2007. Also odd is that Desert NWR shows run-of-the-mill maximums during some of the big-time heat events of the past 80 years: 112F in 1954, 1959 and 1960 and 1961; only 110F in July 1972(!), and only 112F in 2013 and 2020. Without a detailed investigation into this station, I am unable to explain what looks like bad inconsistencies for this station. Perhaps the instrumentation changed and moved around a bit. It is not unusual for observers to change often at these types of state and federally-managed cooperative stations, and bad observers aren’t hard to come by. This station looks like a nightmare that I would prefer to ignore! Another awful consideration to ponder is that sometimes the weather instruments are near or above well-watered lawns, or above inconsistently watered lawns. Can you imagine the inconsistencies which would result at such a station if during some summers a lawn was not watered, and some summers it was kept very well-watered?! Ugh.

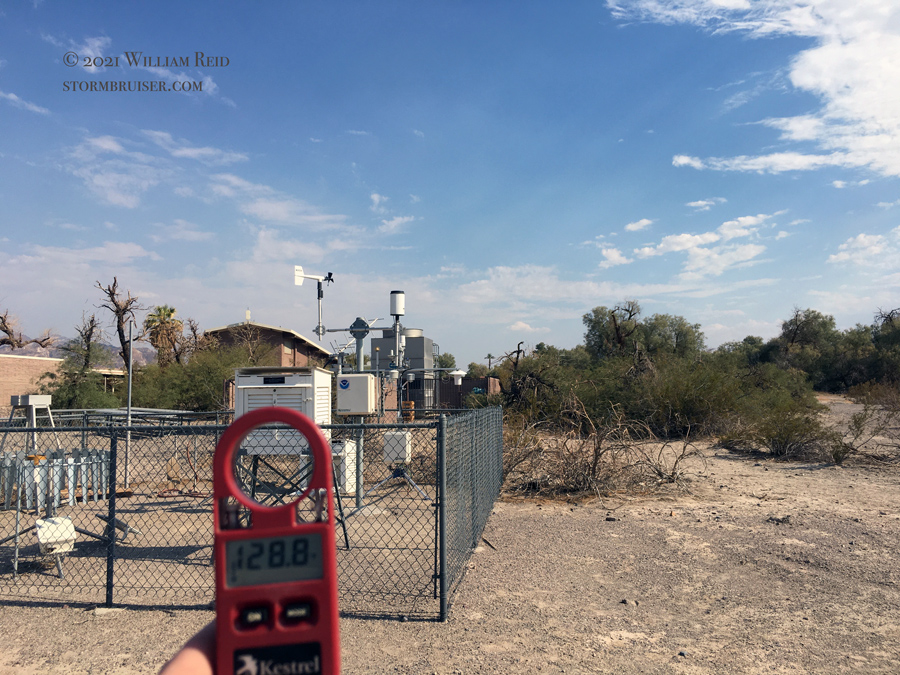

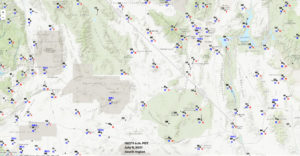
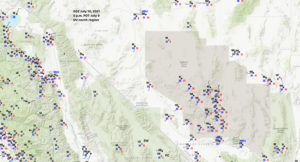
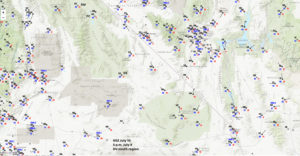
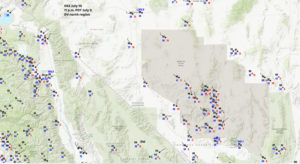


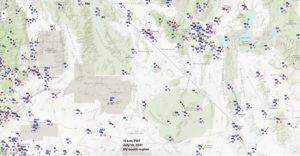
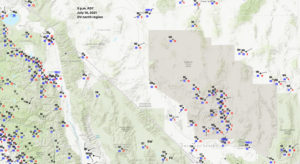
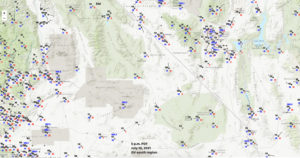
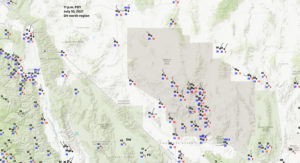


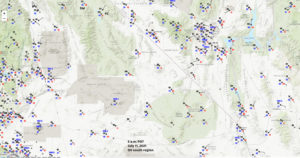

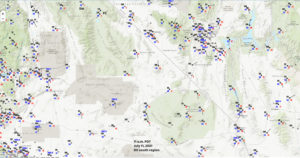
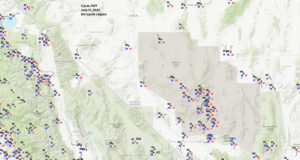
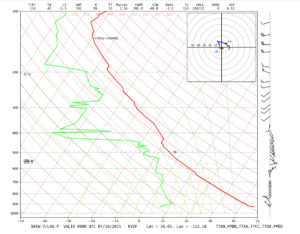
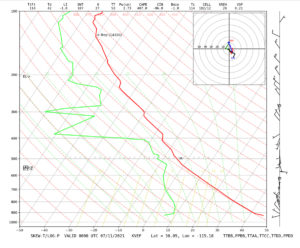
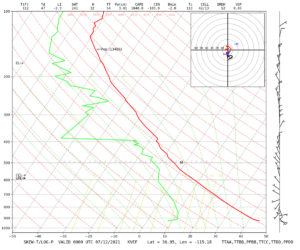


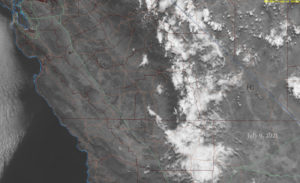
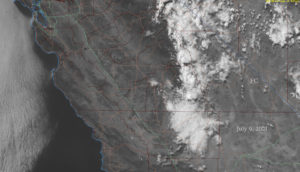
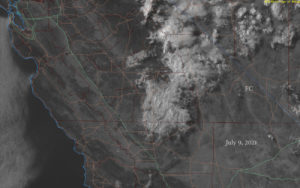
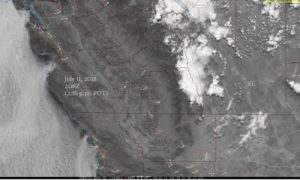
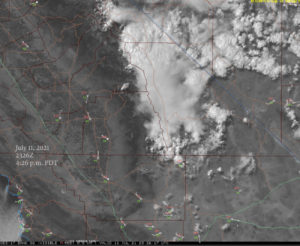
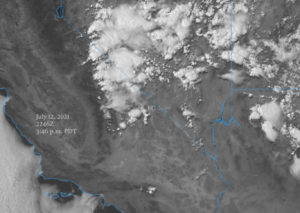
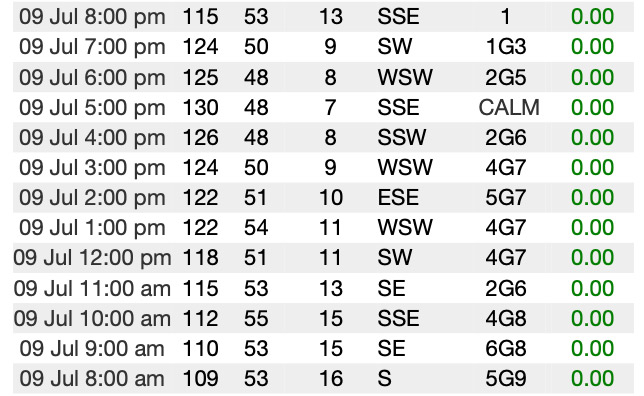

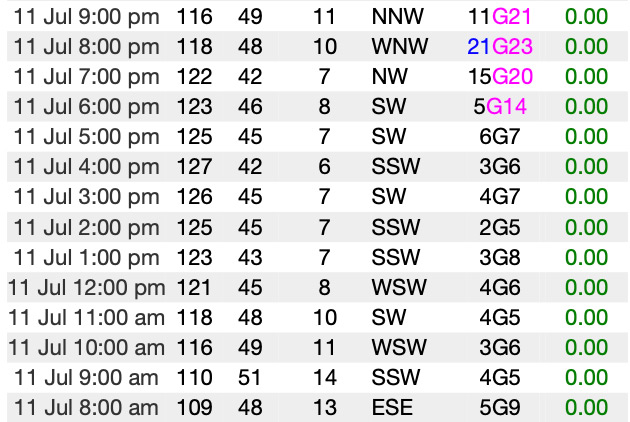
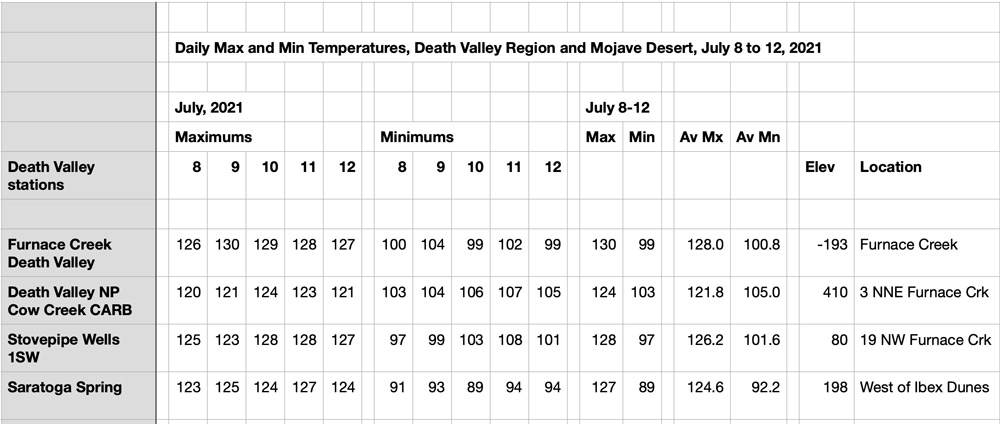


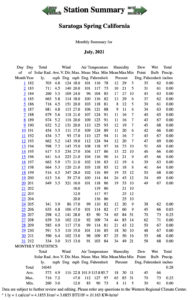
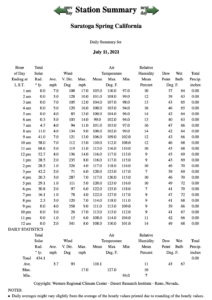

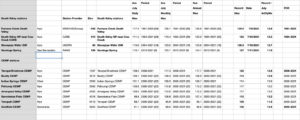
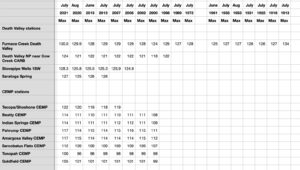
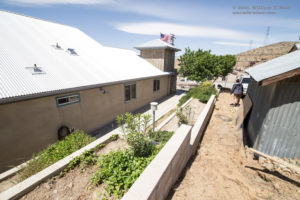
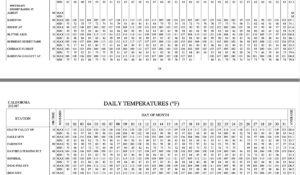
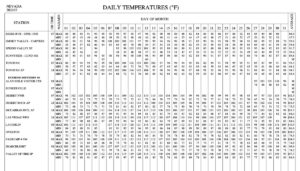
Leave a Reply
You must be logged in to post a comment.