Welcome to Part 4B. Here, we investigate the hottest Death Valley heat events from 1961 to 2017. The Cow Creek and Greenland Ranch stations closed in spring 1961, when the new station (named “Death Valley”) at the NPS Visitors Center opened.
Link to Part 4A Greenland Ranch 1931 to 1960 Heat Events (Use this link to navigate to other Parts of this study.)
Link to Part 4C Greenland Ranch 1911 to 1930 Heat Events
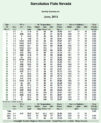
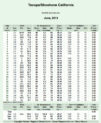
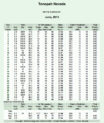
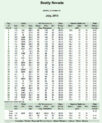
June 1961
June 15 to June 28 heat wave
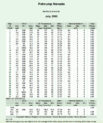
1961 Jun Death Valley 1961 Jun Trona 1961
Jun Deep Springs 1961 Jun Cantil 1961 Jun Barstow 1961 Jun Baker 9NNW
1961 Jun Haiwee 1961 Jun Independence 1961 Jun Inyokern
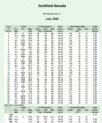
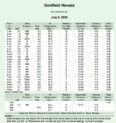
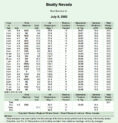
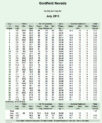
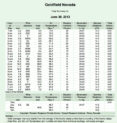
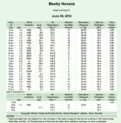
1961 Jun Bishop 1961 Jun Beatty 1961 Jun Dyer 1961 Jun Goldfield
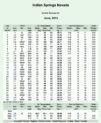
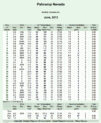
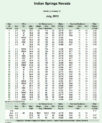
1961 Jun Pahrump 1961 Jun Sarcobatus 1961 Jun Indian Springs
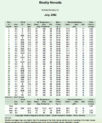
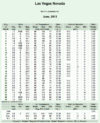
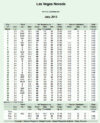
1961 Jun Las Vegas a 1961 Jun Las Vegas b 1961 Jun Randsburg
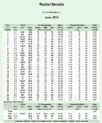
The summer of 1961 continued the trend of the previous two summers, with several periods of very hot weather in Death Valley and vicinity. A couple of months prior, the new weather station for the Furnace Creek area was established by the Weather Bureau and the Park Service. The instruments were installed just north of the new Visitor’s Center on the north edge of Furnace Creek. The station was named “Death Valley.” This location was approximately 4/10 of a mile north of the Greenland Ranch instrument site. The Cow Creek and Greenland Ranch stations closed. Here are links to the last forms for these two stations, and the first one for Death Valley:
The last observation at Cow Creek was on April 25, 1961. There is no form for Greenland Ranch for April. The last observation at Greenland Ranch was apparently on March 31, 1961, after nearly 50 years of operation. The first official entry there was on June 8, 1911. The first entry for the new Death Valley station was April 1, 1961, and the high temperature was 96F that afternoon. Cow Creek and Death Valley overlapped for 25 days.
Back to June of 1961: the average daily maximum at Death Valley this month was a very healthy 113.7F. The highest average maximum for June at Greenland Ranch was 115.6F in 1924. The Junes of 1994, 2006, 2013 and 2015 at Death Valley had average maximums from 114.6F to 114.9F. Summer maximums have been creeping up a bit in the last couple of decades at Death Valley, it seems, perhaps due to poorer ventilation through the instrument site. Thus, June of 1961 is probably very comparable to these very hot Junes since 1990.
The average maximum in June, 1961, would have been quite a bit higher had the first week of June not been so cool. The last half of the month was brutally hot for June. Here are the average maximums week-t0-week this month at Death Valley:
June 1-7 100.7F
June 8-14 110.7F
June 15-21 121.9F
June 21-28 121.7F
(June 29 and 30 113.5F)
Death Valley recorded twelve consecutive maximums of 120F or hotter from June 16 to June 27. Maximums from the 19th to the 25th ranged from 123F to 125F! The 125F readings for the 20th and 21st were the hottest for any June days at Greenland Ranch/Death Valley from 1911 to 1993. Since then, both June of 1994 and June of 2013 reached 128F, and 2000 had a 126F.
The run of maximums temperatures from the 19th to the 25th was just as impressive as that in the middle of the previous July. The list below provides the average maximum for the seven days from June 19 to June 25, and the highest temperature measured (hottest days were the 20th and 21st at most stations):
Death Valley 124.0/125/hottest June temperature from 1911 to 1993 at GR/DV
Baker 9NNW 116.9/119
Trona 113.9/118/highest temperature on record—1920 to 2015 (reached several times)
Daggett AP 111.9/115/hottest June maximum 1944 to 1971
Las Vegas AP 112.3/113
Barstow 111.1/114/hottest June maximum on record for Barstow
Inyokern 111.6/114/hottest June temperature on record, 1949-2010 (tied)
Beatty 109.4/111/second-hottest June maximum, second to 112F in June 1918
Randsburg 107.7/110/one-degree short of all-time max (111 in several Junes and Julys)
Haiwee 103.4/107/hottest June day from 1923 to 1999
Sarcobatus 105.6/109/second-warmest June maximum
Bishop 105.6/108/one-degree short of the record maximum for June
Dyer 4SE 102.6/106/hottest June day on record (1950-2015)
Deep Springs 99.6/104/hottest June day on record (1949-2007)
Tonopah AP 99.7/102/one-degree short of the record maximum for June (1954-2015)
Goldfield 93.3/95/not quite as warm as might be expected…new grass-covered surface?
Compared to the very hot five-day stretch from July 16-20, 1960, this seven-day period in June, 1961, was cooler by a degree or two on average maximums at most stations, but a few stations (Deep Springs, Inyokern, Las Vegas) averaged slightly warmer. Death Valley’s average of 124.0F matched that at Greenland Ranch the previous July; but, again, this June, 1961, period was longer by two days.
July 1961
July 8 to July 18 heat wave
1961 Jul Death Valley 1961 Jul Barstow 1961 Jul Independence
1961 Jul Baker 9NNW 1961 Jul Bishop AP 1961 Jul Deep Springs
1961 Jul Inyokern 1961 Jul Goldfield
1961 Jul Las Vegas AP a 1961 Jul Las Vegas AP b 1961 Jul Pahrump
1961 Jul Beatty 1961 Jul Indian Springs 1961 Jul Dyer 1961 Jul Trona
1961 Jul Randsburg 1961 Jul Haiwee
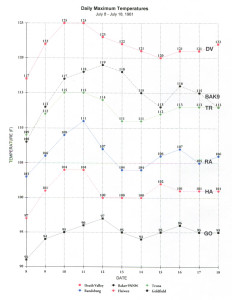
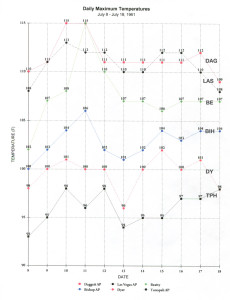
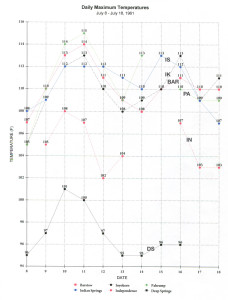
Death Valley had a second impressive heat wave this summer. All maximums from July 9 to July 21 were 120F or hotter. Hottest were the 10th, 11th and 12th, all with 125F. When this station opened, maximum temperature measurements were relatively conservative for the first couple of decades. Though the ground cover was bare, the exposure and ventilation were good. The oasis environment of Furnace Creek was just to the south, and the typical breeze from the south on summer afternoons might have contributed to a slight moderation of high temperatures at the station site.
After its first summer with 125F in both June and July, Death Valley was hotter on only one other heat wave during all of the 1960s and 1970s. The mid-July event of 1972 was truly a high-end event, with 128F. Summers with 125F-plus at Death Valley were the norm after 1980s, perhaps because of poorer ventilation and mixing in the vicinity of the instruments in afternoon sunshine. The culprits were the increase in vegetation and man-made objects in the vicinity of the station.
Randsburg tied its all-time high with 111F on the 11th. Pahrump had another 115F, its hottest temperature from 1949 to 2015. Most station maximums in July, 1961, were 2-3 degrees short of their all-time highs.
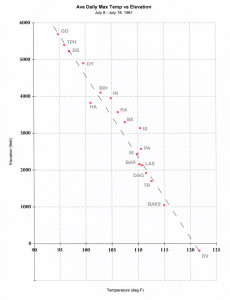
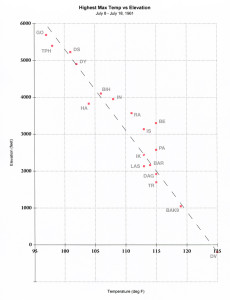
Death Valley maximums averaged 122F from July 8 to July 18, 1961. This is about 6.5 degrees above the 1951-1980 “normal daily maximum” for July. A line with a slope of 4.5 degrees (F)/1000 feet through 122F and -194 feet elevation (see graph above) comes very close to the other station plots for this 11-day period: within a degree or two in most instances. Given the relatively “tight fit” of the station plots near the line, it implies that the siting for the new Death Valley station was good, it was adequate, and that it was likely not dissimilar to the exposure, ventilation, and ground cover for the other stations in the region.
The 1960s
After the three hot summers of 1959, 1960 and 1961 in our region of interest, the summers from 1962 to 1969 were decidedly short on big-time heat. Annual maximums for this 8-year period ranged from 119F to 123F at Death Valley and averaged a ho-hum 121.5F. By comparison, annual maximums from 1949 to 1961 averaged 123.5F at Death Valley. Was the abrupt downward trend in annual maximums a function of the station change? It appears not. At Trona, annual maximums decreased three degrees on average (from 1949-1961 to 1962-1969, 115F to 112F). At Beatty, the decline was four degrees, from 110F to 106F.
Death Valley had three maximums of 119F in early August, 1965, and these were its hottest days of the year. No other year in the record books at Greenland Ranch, Death Valley and Cow Creek had an annual maximum cooler than 120F. Coming close with only 120F were 1912 and 1963.
July 1972
July 11 to July 18 heat wave
1972 July Death Valley 1972 Jul Barstow 1972 Jul Independence
1972 Jul Baker 1972 Jul Bishop AP 1972 Jul Deep Springs
1972 Jul Inyokern 1972 Jul Goldfield 1972 Jul Las Vegas AP
1972 Jul Pahrump 1972 Jul Lathrop Wells 16SSE 1972 Jul Beatty
1972 Jul Silverpeak 1972 Jul Dyer 4SE 1972 Jul Wildrose RS
1972 Jul Trona 1972 Jul Cantil 1972 Jul Randsburg
The heat event of mid-July, 1972, just might be the most extreme of all for the 20th century, if not for the entire period-of-record for all stations in the region. Unfortunately, there is always that “caveat” lurking when comparing maximum temperatures, old and new: station sitings change, instruments change, ground-cover changes, and exposures do not remain the same. A recorded maximum of 120F in July, 1915, does not automatically mean that the day was exactly as hot as a day with a maximum of 120F in 2015.
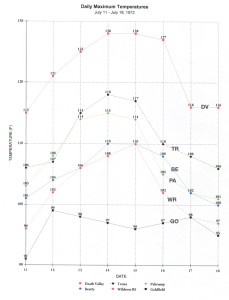
Death Valley recorded maximums of 128F on both July 14 and July 15, 1972. The maximum temperature observation of 127F at 4 p.m. on July 16 may reflect conditions on the previous afternoon.
July 13 DV 125/87 set max 123
July 14 DV 128/94 set max 126
July15 DV 128/96 set max 126
July 16 DV 127/100 set max 113
July 17 DV 116/95 set max 115
Again, the time of observation was at 4 p.m., which is quite close to the hottest part of the afternoon.
There was generally no precipitation in the region during mid-July, except for some thunderstorms north of Death Valley on the 15th and 16th. According to the notes on the forms at surrounding stations, the 13th, 14th and 15th were primarily clear. There were some scattered clouds at Trona on the 15th, and the 16th was “cloudy” at Trona. Deep Springs noted thunder on the 15th and 16th. Bishop was dowsed by 0.02″ on the 15th and 0.01″ on the 16th. Dyer 4SE and Deep Springs both had a trace on the 16th. Baker noted light wind on the 14th and 15th, and “mild” wind on the 16th. Lathrop Wells noted “clear and calm” on the 13th and 14th, “clear and humid” on the 15th and “hazy and humid” on the 16th. Dyer 4SE had a “N Breeze” on the 13th and 14th, and a “gentle NW Wind” on the evening of the 15th. Randsburg noted “windy” on the 12th and “high wind” on the 16th. The Death Valley evaporation pan anemometer data suggest very light winds for the most part on the 13th, 14th and 15th, with breezy conditions on the 16th.
The increase of winds through the region on the 16th, and the cooler maximums, suggests that there was a strong thermal low developing over the Death Valley region. Onshore gradients from the coastal sections of Southern California to the Mojave Desert were likely strengthening and cooler air was filtering into the desert from the southwest and west on the 15th and 16th. Some increase in humidity was apparent from the 14th through the 16th, at least for the northern and eastern areas. Stations near and south of Death Valley generally saw maximums cool by 5 to 10 degrees (F) from the 15th to the 16th. The cooling to the north was not as great, and Bishop’s maximum of 109F on the 15th was equaled on the 16th.
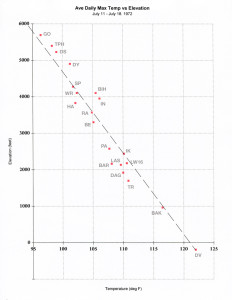
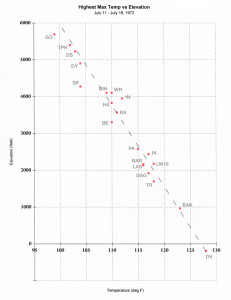
The maximum of 128F at Death Valley is very, very well-supported by the maximums at the other stations in the region. A plot of maximums for the July 13-16 event shows an excellent correlation with elevation among the stations, both south and north of Death Valley. The “tight fit” along the sloping line through Death Valley’s plot simply means that the maximum at Death Valley is well-supported by surrounding stations. The maximum of 104F at Silverpeak, west of Goldfield and north of Furnace Creek at 4263′ elevation, is 3-to-4 degrees on the “cool” side of the line, providing only “soft” support for 128F in Death Valley. There is no reason to doubt Death Valley’s 128F temperatures in July, 1972.
Many stations in the region set all-time record maximums in mid-July, 1972. The 128F readings at Death Valley’s were the hottest up to that time, if the suspect reports in 1913 (134F) and 1960 (129F) are discarded. Of course, in 1972, the 130-plus readings in 1913 were regarded as legitimate and the hottest on record, so the 128F observations were given little fanfare. The station has had 129F in four summers since 1998, but are these measurements “inflated” a degree or two because of gradual environmental changes near the instruments? That seems to be the case.
Given the different station exposures and environments, were the 128F days at Death Valley in July, 1972, indeed even hotter than the days with 127F in July, 1916, and again in July and August, 1933, at Greenland Ranch? It is impossible to say with much certainty. How close was the shelter to “cultivated land” in 1916 and 1933? Were winds blowing across irrigated land before impacting the thermometers during the hottest part of the day? In 1972, the maximum temperature reports for Death Valley were relatively conservative. And, the same can be said for Greenland Ranch (when the observers’ entries could be trusted!). The Greenland Ranch station siting by the Weather Bureau in 1911 emphasized excellent exposure and a ground surface which would not promote “reflected heat” from the desert surface. Early pictures of the station indicate that the instruments were over bare ground by the 1920s, with irrigated farmland adjacent to the shelter. It is probable that the summer maximums measured at Greenland Ranch for much its period of record were on the conservative side, also. Any obstructions to the wind were far enough away to have practically no effect on ventilation through the station site. The nearby farmland and irrigated areas may have resulted in lower maximums by a degree or two on some days at Greenland Ranch, compared to those which would have been realized if local water were not available for crops and trees and other vegetation. In the first few years at least, the instruments were directly above irrigated and cultivated ground, and summer maximums might have been several degrees lower than nearby spots that were free from the cooling effects of water, evaporation, and transpiration. It is possible that the days with 127F in 1916 and 1933 at Greenland Ranch (and perhaps even the days with 126F in 1914, 1922, 1931 and 1936) would have been at 128F to 129F had the weather station and its environment been the same as that in July, 1972.
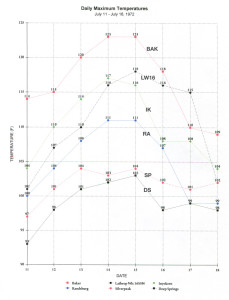
At Baker, a new station was in town at a private residence (following the closure of Baker 9NNW in March, 1971), and summer maximums here in 1972 reflect a relatively well-sited and well-exposed instrument shelter. Its maximum thermometer reached 123F on both the 14th and 15th, five degrees cooler than Death Valley on both days. Baker, at 940 feet elevation, is about 1130 feet higher than Furnace Creek, so summertime maximum temperature differences of 5 to 6 degrees would be expected. On the 16th, according to the form for Baker for July, 1972, a maximum of “110” is crossed out. A maximum of “118” is provided as a replacement. The set max temperature on the 15th at 5 p.m. was 118F. The observer, Lloyd Metheny, must have reset the maximum thermometer again, probably on the morning of the 16th, in order to determine what the “real” high temperature would be on the 16th in case it did not reach 118F. He should have entered “118” as the maximum on the form. Slightly different handwriting suggests that a reviewer of the Baker form made the change from “110” to “118.” Obviously, if the researcher is checking only the Baker maximums as published in Climatological Data, which gives “118” as Baker’s maximum on the 16th, he or she would not know that the maximum during the day on the 16th was “actually” only 110F.
Since Death Valley’s “set max” temperature on the 15th was 126F, since the time of observation (4 p.m.) was so close to the hottest part of the afternoon at Death Valley, and since many surrounding stations showed considerable cooling on maximums from the 15th to the 16th, Death Valley’s recorded maximum of 127F on the 16th is very likely due to conditions around observation time on the 15th. The entry is correct, of course (with regard to proper observing procedures), but it does not convey the actual high temperature during the day on the 16th.
The 123F maximums at Baker in 1972 are the hottest reliable temperatures on record for all of the stations in and around town. The hottest at Silver Lake AP (1940-1952) was 121F in June, 1950. The hottest at Baker 9NNW (1954-1970) was 121F a couple of times (a maximum of 123F in August, 1969, is very doubtful). The town of Baker has had a number of stations and observers since 1972. One of these was in the equipment yard of the California Department of Transportation (Caltrans), from 1980 to spring of 1983. The ventilation through the yard was quite poor, due to tall trees surrounding the yard, and perhaps in part due to equipment and trailers near the instruments. Maximum temperature readings suffered! The observations of 124F at Baker Caltrans in both July and August of 1980 might be considered reliable, but these are not representative of a spot in Baker with good ventilation. The highest temperatures in Death Valley in these two particular months were 124F and 123F! Unfortunately the maximums for Baker Caltrans during the summers of 1980, 1981, and 1982 are too warm by several degrees due to the station siting and inadequate exposure of the thermometer shelter. Instrument exposure at ensuing locations in Baker were adequate. The highest temperature observed from 1983 to 1989 was 122F, and from 1997 to 2013 was also 122F.
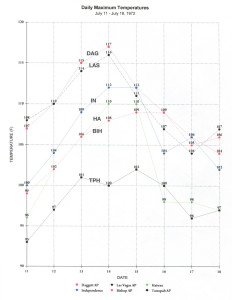
From the 13th to the 15th, Daggett AP had maximums of 115F, 117F, and 112F. (Observation time was midnight.) Nearby Barstow had maximums of 110F, 116F, and 114F on these three days. Observation time at Barstow was 4 p.m., and the “set max” on the 14th was 114F, so the “actual” afternoon maximum on the 15th at Barstow was probably closer to 110F. It is apparent that the cooling trend in the desert areas well south and southwest of Death Valley began on the 15th. Daggett Airport’s maximum of 117F on the 14th was the hottest at the station from its opening in 1944 through 1993. A maximum of 118F was recorded in June, 1994, and again in July, 2007. Authentic temperatures of 120F at elevations near and above 2000 feet in the region are extremely rare. Daggett/Barstow AP, at an elevation of 1922 feet, has been within a few degrees of 120F on several occasions, but has yet to reach that plateau. The exposure of the instruments at the airport is excellent.
Barstow is a couple of hundred feet higher than Daggett, and the exposure of the instruments at the various station locations in town through the years is not known. (After 1980, the Barstow instruments were above grass and were well-exposed at a fire station, at the top of a hill.) The highest temperature prior to 1920 at Barstow was 114F. The equipment was destroyed by fire in 1921, and the town waited 18 years for its next official weather station. From 1939 to 1979, hottest was 114F in four different years, except for the 116F on July 14, 1972. The hottest reliable temperature report from the Barstow “Fire Station” since the summer of 1980 is 1115F in July, 1995. The following July showed an observation of 120F, but it was changed to “107” in Climatological Data. The “Western Region Climate Center” web site shows “120” for July, 1996, in the table of monthly maximums for each year here. But, it provides “115” as the record hottest for July in the monthly summary table. The report of “120” for Barstow on July 23, 1996, is not supported by the maximum at Daggett (111F) nor by any other stations in the region.
How did a maximum of 120F wind up on Barstow’s form for July, 1996? The “set max” temperature provided is 109F. Time of observation was 4 p.m. This observation time is close to the hottest part of the afternoon, so one can probably assume that the actual maximum was likely around 110F. Did the observer just write down “120” mistakenly instead of “110”? Why didn’t Climatological Data change the 120F maximum to at least 109F (instead of the 107F), given the “set max” reading? We will never know the answers, but this is just another example of apparent human error finding its way into the record books. No station is immune!
Cantil is a small community in the Kern County desert, west of Randsburg and between Inyokern and Mojave, at an elevation of 2010 feet. Daily weather records are available for 20 summers here, from 1955 to 1974. Its average maximum for July was 103.6F, which is close to that for other stations at a similar elevation, such as Barstow and Daggett Airport. The extreme maximum at Cantil in July, 1972, was 121F on the 15th. This is the hottest temperature on record for Cantil, and is one of the rare, seemingly authentic observations of 120F or greater at an elevation of 2000 feet or higher. Most annual maximums at Cantil from 1955 to 1974 were from 109F to 114F, but a handful of years had much warmer, including 117F in July, 1960; 119F in June, 1961; and of course the 121F in July, 1972. Was the 121F at Cantil “boosted” by a degree or two due to less-than-superb ventilation and exposure?
Nearby Randsburg had 111F on both July 14 and 15, tying its all-time maximum temperature set in 1960 and 1961. Randsburg has had a couple of 111F readings since 1972, and never has it reached 112F since its start in 1937. Inyokern is north of Randsburg, in the Indian Wells Valley, and it had 117F on the 14th and 116F on the 15th. The 117F reading is the highest for its period of record from 1948 to 2010. Somehow, a maximum of 119F was recorded at Inyokern for July 30, 1972. Surrounding stations were a few degrees above normal on July 30 — nowhere near the all-time record maximums. Inyokern’s 119F on the 30th was likely only 109F. The observer, or someone copying data from one form to another, likely did not exercise enough care in this instance. Inyokern’s hottest up until 1972 was a 115F day in July, 1960. After 1972, it had a 115F in July, 2007. Its reliable temperature of 117F on July 14, 1972, is impressive for a station at 2440 feet elevation.
Moving north towards the Owens Valley, the station at Haiwee Reservoir had about a dozen annual maximums of 106-107F during its period of record up to 1972. These were its hottest on record, since 1923. Maximums of 110F on the 14th and 15th of July, 1972, obliterated the old records. From 1973 to 2000, its hottest maximum was 109F (if a very dubious report of 113F is discarded). After about 2000, Haiwee’s record appears less reliable, and/or the local environment around the instruments changed significantly. An annual maximum of 119F and two other 113F maximums have been reported.
July 1988
July 16 to July 22 heat wave
1988 Jul CA CD 1988 Jul NV CD 1988 Jul Death Valley
1988 Jul Amargosa Farms 1988 Jul Baker 1988 Jul Barstow 1988 Jul Beatty 8N
1988 Jul Deep Springs 1988 Jul Dyer 1988 Jul Goldfield 1988 Jul Haiwee
1988 Jul Independence 1988 Jul Mina 1988 Jul Pahrump
1988 Jul Randsburg 1988 Jul Silverpeak 1988 Jul Trona 1988 Jul Wildrose
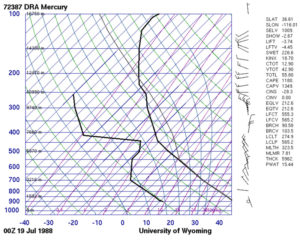
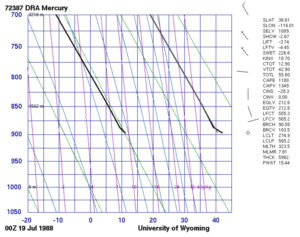
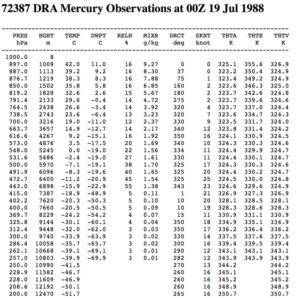
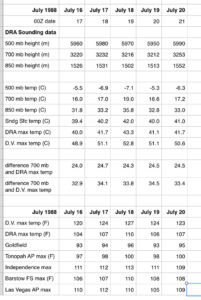
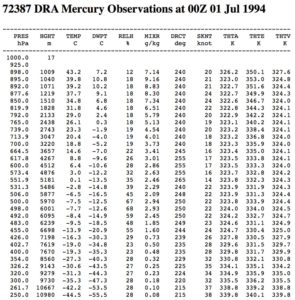
DRA 1988 July Sounding data for July 16-21
Following the major heat event of mid-July, 1972 (which peaked at 128F), the hottest summer days in Death Valley found it difficult to break 125F for about 16 years. From 1973 to 1987, annual maximums ranged from 121F to 124F, except for 125F for 1981 and 126F for 1984. These 16 years mimicked, to a large extent, the ten years following the very hot Julys of 1959-61. From 1962 to 1971, annual maximums ranged from only 119F to 124F. There was a “flip of the switch” beginning in 1988. Suddenly, annual maximums of 125F and higher became the norm, and annual maximums cooler than 125F were unusual. At the “Death Valley” station, three years had annual maximums of 125F or higher from 1961 to 1987. From 1988 to 2017, only two annual maximums were lower than 125F!
The cause, or causes, of the jump in maximums has been mentioned in this study in a couple of places, but it bears repeating. An decrease in general ventilation though the Death Valley weather station through the decades, due to an increase in vegetation (and perhaps structures) south of the station, has promoted higher summer temperatures comparably. An article by Roof and Callagan (BAMS, 2003) found that wind movement through the station had decreased markedly, and that the culprit was probably the growing vegetation in the vicinity of the visitor’s center. It is also probable that generally hotter summers regionally from the late 1980s to the present, compared to the previous few decades, have contributed to the jump in annual maximums.
Anyway, beginning around the late 1980s, exceptionally hot days at the Death Valley weather station were now those which reached 127F or more, and not 125F or more.
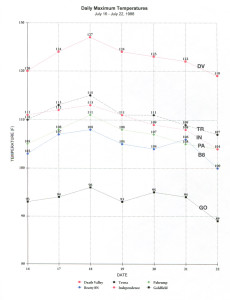
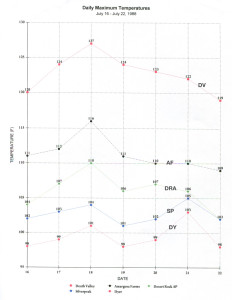
Death Valley reached 127F for the heat wave of mid-July, 1988, just one degree lower than its most-reliable all-time maximum up to then. Most stations in the region reported maximums which were 2-5 degrees cooler than their all-time (trustworthy) record maximums. An exception was Independence, which soared to 113F on July 18, the same day that Death Valley hit 127F. This broke the previous hottest temperature on record of 112F at Independence in the July 1972 heat event.
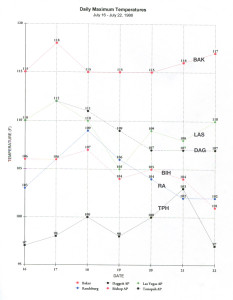
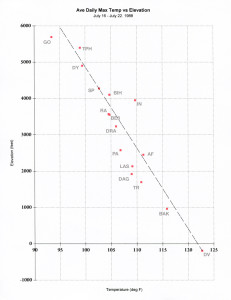
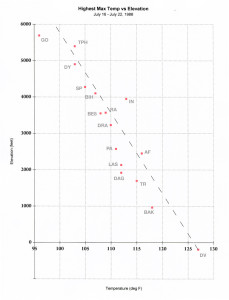
A comparison of average maximums in the region from July 16-22, plotted against the station elevations, shows that most stations plot on the cooler (left) side of a line with a slope of 4.5 degrees F/1000 feet through the Death Valley plot. However, the higher-elevation stations that are north of the latitude of Death Valley plot quite closely to the line. Again, the exception is Independence, which is well to the right (warmer side) of the line. This suggests that the Independence station was in an exceptionally hot locale with inadequate exposure and ventilation, or (much less likely) an instrument problem. Recall that during the first few years of the Greenland Ranch record that Independence plotted well to the left of the line, due to a very conservatively cool station siting in a moister Owens Valley. Bishop Airport’s maximum of 107F on the 18th is probably a much more representative high temperature for Owens Valley on that date.
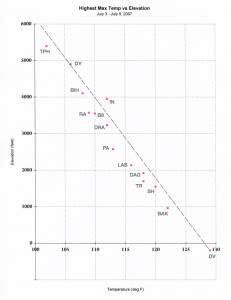
The temperature/elevation graph for the highest maximums for the July 1988 heat wave shows all but three stations on the warm side, with the bulk of stations some 2-5 degrees (F) on the cool side. Compare this with the graph for mid-July, 1972, where the line through Death Valley (with the same slope of 4.5 degrees F/1000 feet) better fits with the other temperature plots in the region. The mid-late 1980s was about the time that the Death Valley station began to show a warmer bias.
July 1989
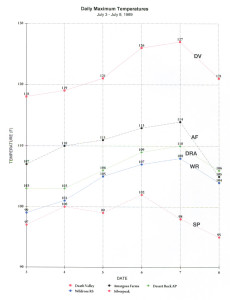
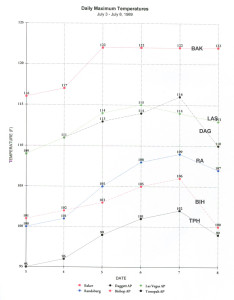
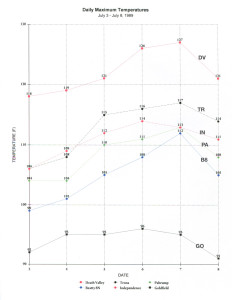
July 3 to July 8, 1989 heat wave
1989 Jul CA CD 1989 Jul NV CD 1989 Jul Death Valley
1989 Jul Amargosa 1989 Jul Baker 1989 Jul Barstow 1989 Jul Beatty 8N
1989 Jul Dyer 1989 Jul Goldfield 1989 Jul Haiwee 1989 Jul Independence
1989 Jul Inyokern 1989 Jul Mina 1989 Jul Pahrump 1989 Jul Randsburg
1989 Jul Silverpeak 1989 Jul Trona 1989 Jul Wildrose
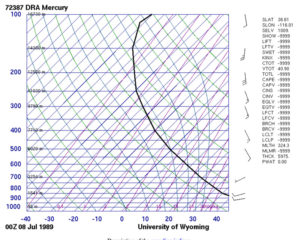
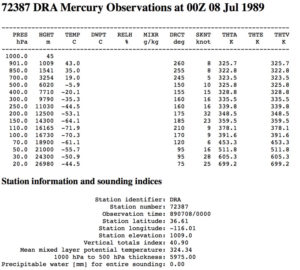
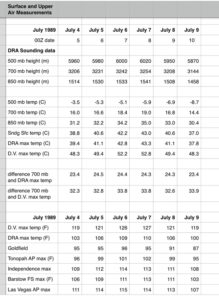
DRA 1989 July Sounding data for July 4 to July 9, 1989
An early July heat wave in 1989 gave Death Valley another 127F reading. Most surrounding stations were 2-3 degrees off of their all-time maximums. Some notable maximums were
126F at Stovepipe Wells on the 6th and 127F on the 7th. This was an unofficial but reliable NPS station.
114F at Independence (hottest on record!),
117F at Trona (one short of its all-time maximum),
112F at Beatty 8N, one short of its all-time maximum (POR 1973-2008)
This was the last summer of the “super-warm” maximums at Independence. The town’s maximum of 114F is an outlier compared to the monthly maximums of 106F at Bishop and 108F at Haiwee. A change to a better-exposed location seems to have occurred before the summer of 1990, as annual maximums at Independence lowered to more reasonable levels, ranging from 105F to 108F from 1990 to 1997.
Baker had a run of four consecutive days with 122F (from the 5th to the 8th). The original form shows “120+” for the maximum on each of these days, and in the remarks section the observer (William R. Locke) notes that the “thermometer only goes to 120F, temp was over that approx 2 degrees.” It is doubtful that each of the four days at Baker reached 122F, based on the day-to-day trends at Daggett and the other closest stations.
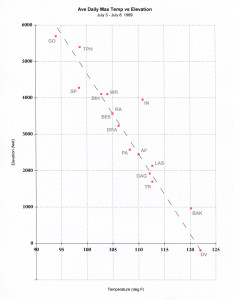
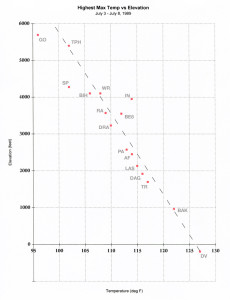
The temperature-versus-elevation plots for the July, 1989, heat wave better support the 127F at Death Valley compared to those for July, 1988.
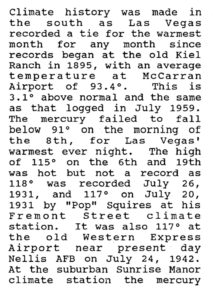
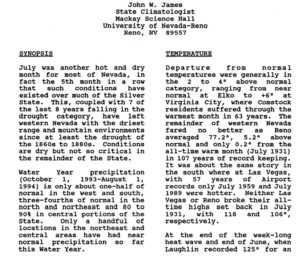
Finally, John James (Nevada climatologist) provided some interesting temperature information in the July 1989 issue of Climatological Data for Nevada:
June and July 1994
June 24 to July 2 heat wave
1994 Jun CA CD 1994 Jun NV CD 1994 Jun Death Valley
1994 Jul CA CD 1994 JuL NV CD 1994 Jul Death Valley
June 1994
1994 Jun Amargosa Farms 1994 Jun Barstow 1994 Jun Beatty 8N
1994 Jun Deep Springs 1994 Jun Dyer 1994 Jun Goldfield 1994 Jun Haiwee
1994 Jun Independence 1994 Jun Inyokern 1994 Jun Iron Mountain
1994 Jun Mina 1994 Jun Pahrump 1994 Jun Randsburg
1994 Jun Silverpeak 1994 Jun Trona 1994 Jun Wildrose RS
July 1994
1994 Jul Amargosa Farms 1994 Jul Barstow 1994 Jul Beatty 8N
1994 Jul Deep Springs 1994 Jul Dyer 1994 Jul Goldfield 1994 Jul Haiwee
1994 Jul Independence 1994 Jul Inyokern 1994 Jul Iron Mountain
1994 Jul Mina 1994 Jul Pahrump 1994 Jul Randsburg
1994 Jul Silverpeak 1994 Jul Trona 1994 Jul Wildrose RS
DRA 1994 June for sounding data June 24 to June 30
DRA 1994 July for sounding data June 30 to July 2
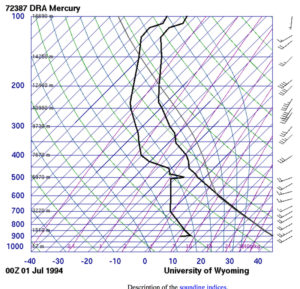
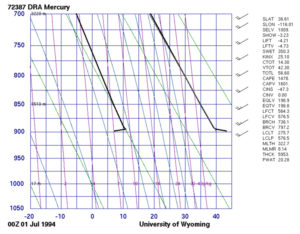
Above are data from the sounding at Desert Rock AP, Nevada, on the afternoon of June 30, 1994 (00Z, July 1).
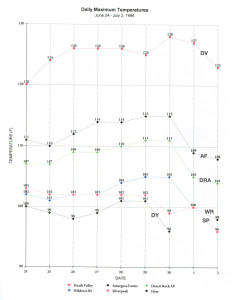
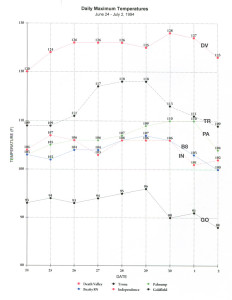
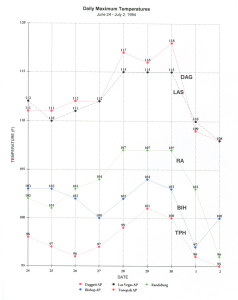
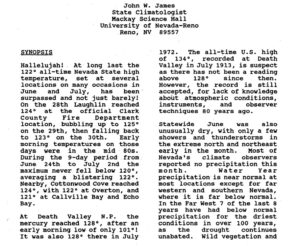
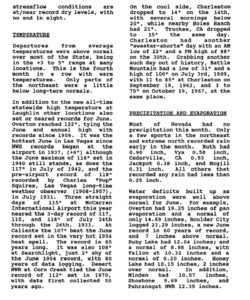
On June 30, 1994, Death Valley reached 128F. There was not much fanfare at the time for such a hot temperature, but on this day Death Valley tied its highest reliable high temperature on record. Of course, here we have determined that higher temperatures in 1913 at Greenland Ranch (five days with 129 to 134F) and in July 1960 (129 on the 18th) are not valid. Through 1994, the highest authentic temperatures from Death Valley are the readings of 128F in July 1972 and June 1994.
This brutal heat wave “favored” areas to the south of Death Valley versus areas to the north. Both Daggett and Trona reached 118F, their all-time record high temperatures. Nearby Amargosa Farms (115F) and Desert Rock AP (111F) were two degrees short of all-time maximums. In the Southern Deserts, 120-plus maximums were common, with 123F at Blythe AP and 121F at Palm Springs FS, Needles AP, Iron Mountain, and Parker Reservoir.
In Arizona, Lake Havasu City (at the Mesquite Fire Station) reached 128F on June 29th (or on June 28th!). This is the hottest temperature on record for Arizona. However, this high temperature is likely somewhat unrepresentative and a couple of degrees too warm due to a questionable instrument exposure at the time. (The Lake Havasu City weather station was relocated in 1999: from 1999 to 2017 annual maximums ranged from 116F to 124F.) The same heat wave gave official readings of 126F at Bullhead City, 125F at Salome 17SE, and 123F at Alamo Dam.
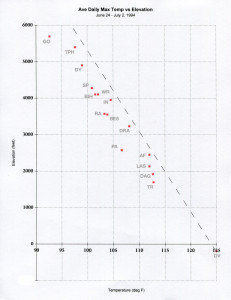
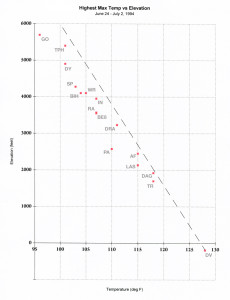
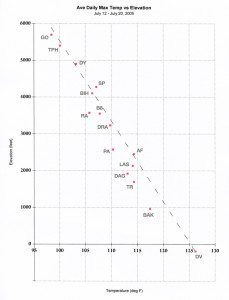
The nine-day period from June 24 to July 2 at Death Valley had a remarkable average daily maximum temperature of 125F. The temperature-versus-elevation graph for average maximums (for these nine days) shows a bit of a warm bias at Death Valley. All of the station plots are on the cool side of the 4.5 deg F/1000 ft line through the Death Valley plot. Once again, compare this with the graphs for the heat wave of July, 1972, which showed no obvious warm bias at Death Valley. Also note that the maximums at Independence are much more reasonable compared to those for the heat waves in 1988 and 1989.
Nevada state climatologist John James prepared the following on the heat wave of 1994 for Nevada’s Climatological Data.
July 1998
July 15 to July 19, 1998
1998 Jul CA CD 1998 Jul NV CD 1998 Jul Death Valley
1998 Jul Amargosa Farms 1998 Jul Baker 1998 Jul Barstow 1998 Jul Beatty 8N
1998 Jul Bishop 1998 Jul Deep Springs 1998 Jul Desert NWR 1998 Jul Dyer
1998 Jul Haiwee 1998 Jul Indy 1998 Jul Inyokern 1998 Jul Iron Mountain
1998 Jul Las Vegas AP LAS 1998 Jul Las Vegas VEF 1998 Jul Mitchell Caverns
1998 Jul Mountain Pass 1998 Jul Pahrump 1998 Jul Parker Reservoir 1998 Jul Randsburg
1998 Jul Silverpeak 1998 Jul Tonopah AP 1998 Jul Trona 1998 Jul Wildrose RS
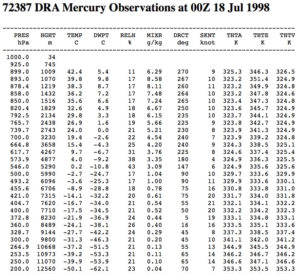
Sounding Data DRA 1998 July 14-20
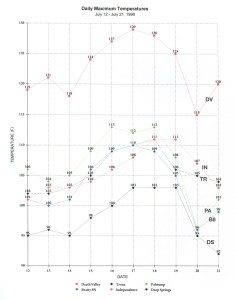
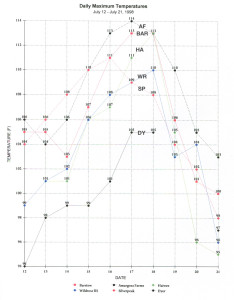
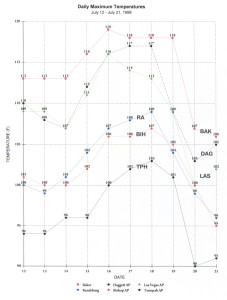
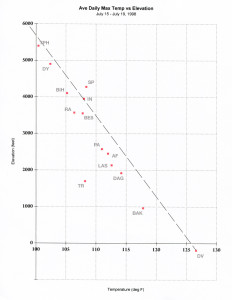
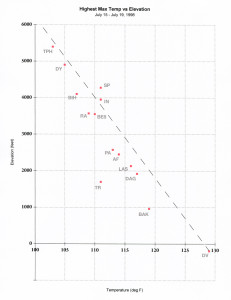
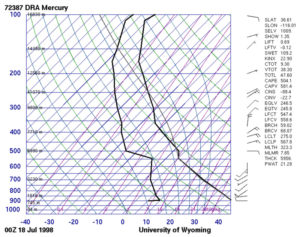
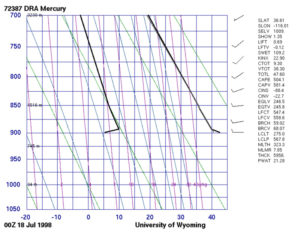
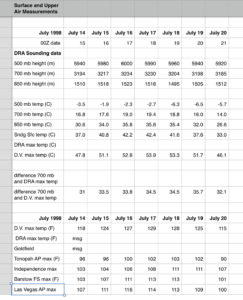
As was the case for the 1994 heat wave, Death Valley shows a warm bias on maximum temperature for the heat wave in mid-July, 1998. Independence and Silverpeak are the only stations on the warm side of our “average lapse rate” line through Death Valley. (Was there a recent change in station location in these towns, perhaps to more poorly-exposed locales?) Death Valley achieved its first legitimate and authentic temperature of 129F on July 17th (the official reading was made on the morning of July 18). Though Death Valley hit its all-time maximum, other stations in the region were generally 1-to-3 degrees (F) short of their record maximums. Note that Trona is absurdly cool. Unfortunately, the Trona station provided a long run of bad and unreliable temperature reports for about a decade around this time. On the sounding at Desert Rock on the afternoon of the 17th, the temperatures at 700mb (19.4C) and 850mb (35.6C) were about as warm as you will ever find for the region.
If it assumed that the temperature and height at 700-millibars was the same above Furnace Creek as it was above Desert Rock AP on the 17th, then the temperature difference through 3424 meters was 34.5 degrees C, which yields a temperature slope of 10.1 deg C/km, or 5.53 deg F/1000 feet.
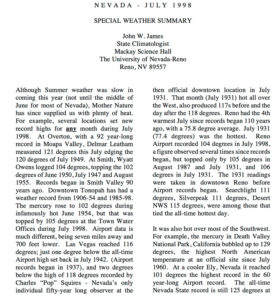
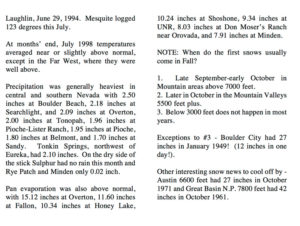
Notes by John James for July, 1998, in Climatological Data:
July 2002
July 8 to July 15 heat wave
2002 Jul CA CD 2002 Jul NV CD 2002 Jul Death Valley
2002 Jul Amargosa Farms 2002 Jul Baker 2002 Jul Barstow 2002 Jul Beatty 8N
2002 Jul Deep Springs 2002 Jul Desert NWR 2002 Jul Dyer 2002 Jul Goldfield
2002 Jul Haiwee 2002 Jul Independence 2002 Jul Las Vegas VEF 2002 Jul Pahrump
2002 Jul Randsburg 2002 Jul Silverpeak 2002 Jul Trona
July 2002 CEMP Stations:
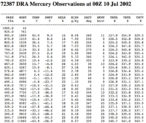
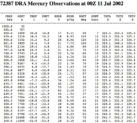
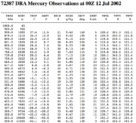
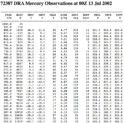
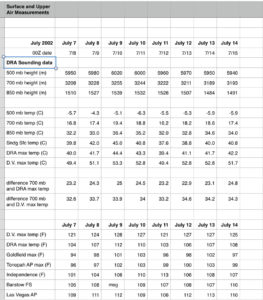
Desert Rock AP Sounding Data, July 7 to 14:
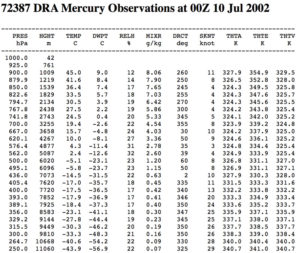
Desert Rock AP Sounding Data for July 9:
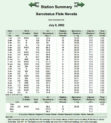
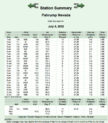
Blazing heat visited Death Valley again in July, 2002. Maximums from the 7th to the 15th were 121, 124, 128, 127, 121, 127, 127, 125, and 123F. The 128F on July 9th fell a degree short of the all-time highest (reliable) record of 129F (first set in July, 1998). Here are some hourly data from nearby CEMP stations in Nevada for the 9th:
and a couple for the 10th:
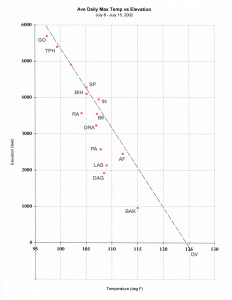
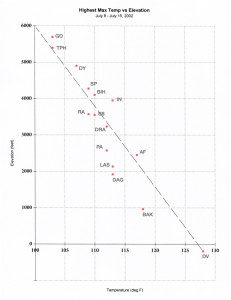
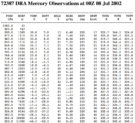
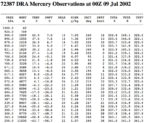
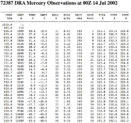
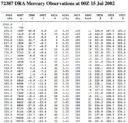
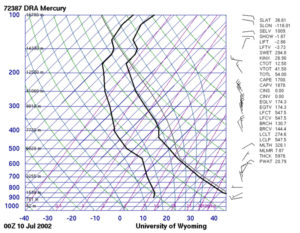
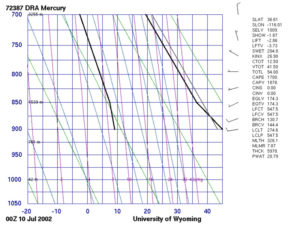
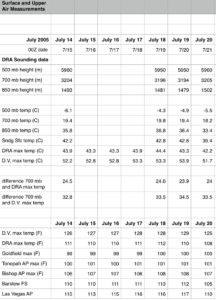
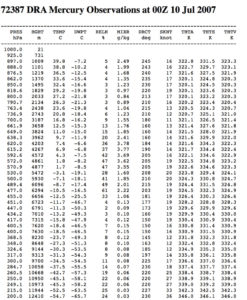
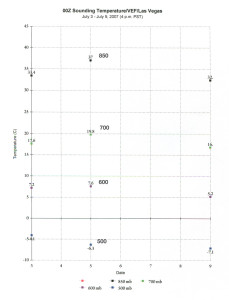
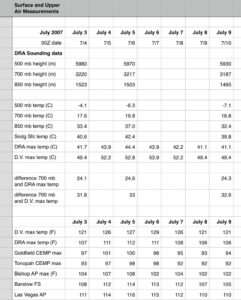
The upper-level high pressure system over the Desert Southwest was exceptionally strong for this event. Heights at the 500-millibar level reached 602 decameters on July 9 (00Z Jul 10). Provided above are upper-air data from Desert Rock Airport (DRA) in Nevada (elevation 3301 feet) for the afternoons from July 7 through July 14th. The table above compares sounding temperatures at mandatory levels with maximums in the Death Valley region. Desert Rock Airport is about 48 miles east of Furnace Creek. During periods of hotter-than normal weather in summer, the temperature of the air from the 850-millibar level to the 500-millibar level above Desert Rock Airport would presumably be very representative to that above Furnace Creek in Death Valley. The difference in topography between the two places, i.e., the relatively confined and protected nature of a deep basin such as Death Valley versus the more open desert-plain setting of Mercury and Desert Rock, may promote slightly warmer temperatures comparably above Death Valley on most summer afternoons. At 700mb at DRA, the temperature was highest on the afternoon of July 9, with 19.4C. At the 850mb level, it was 36.4F. This is about as warm as it gets at these levels on the DRA and VEF (Las Vegas) soundings in summer (though temperatures on July 18, 2005, were slightly warmer!). The temperature at 700 mb above Desert Rock is generally 18C-20C on the very hottest summer afternoons in the region. At 850mb, expect a temperature of about 35C-37C on the very hottest afternoons.
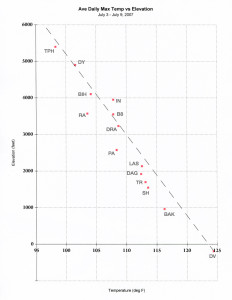
From about the 10th to the 12th, monsoon moisture was on the increase into the region from the east and southeast. This resulted in an increase in deep moist convection and a general decrease in maximum temperature for a day or two. Showers and rainfall occurred in the southern portions, from Las Vegas to Baker and Barstow. The atmosphere dried out quickly thereafter. Stations in the Death Valley region were generally able to reach their “upper-limit” temperatures based on the temperatures aloft during this heat wave, except for a day or two in the middle of the event due to clouds and shower activity. In the elevation/ave-max-temp graph for July 8-15 (above), the higher elevation sites that are north of the latitude of Death Valley plot much closer to the 4.5 deg F/1000 ft sloping line (drawn through the Death Valley plot). This suggests that the upper high favored northern portions of the region, and that the moisture and cloudiness in the southern portions helped to keep maximums down a bit.
Let’s look at some of the monthly maximums for July 2002, and how they compare to the all-time (reliable and trustworthy and representative) record maximums. We will begin with the region generally north of Furnace Creek. Below are the maximums for July 2002, the difference from the 30-year normal (1971-2000) average daily maximum for July, and how the maximum ranks all-time.
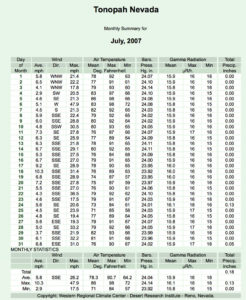
Tonopah Airport: 103F on the 9th and 12th (+11) Tonopah AP has been warmer on only two other days from 1954 to 2017, with 104F in the Julys of 1960 and 2016.
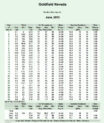
Goldfield: 103F on 9th (+15) Hottest day on record for Goldfield, tying a 103F in 1931 and other early years. (Three days with 108F in the early years are extremely suspect and are ignored.) The hottest temperature at Goldfield from 1938 to 2010 was 101F, except for the 103F on July 9, 2002. The Goldfield CEMP station, open since 2000, had 101F on July 10, 2002. This is the hottest on record for Goldfield CEMP, tying 101F maximums in six other Julys (2003, 05, 06, 07, 13 and 16) and one June (2013).
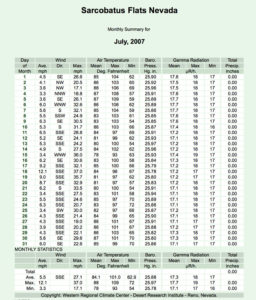
Sarcobatus CEMP: 109F on 10th (+10 degrees compared to the average daily maximum of 98.8F for 18 Julys from 2000 to 2017. From 1942 to 1960 at the USWB cooperative station at Sarcobatus, the average daily maximum for July was 98.3F and the record high temperature was 111F in July, 1959.) Sarcobatus CEMP has reached its all-time record maximum of 109F in six different Julys (2002, 03, 05, 06, 07 and 13) and one June (2013) since 2000.
Dyer, NV: 107F on 10th (+14) 107F is the hottest on record for Dyer (elevation 4100), if a suspect 111F in July, 1910, is discarded. (The station near Dyer from 1903 to 1910 was at “McAfee’s Ranch,” elevation 4835 feet.) Reliable maximums of 106F were recorded in June of 1961 and the Julys of 2003, 2005 and 2007. A station near Dyer, called Oasis Ranch (elevation 5106 feet) observed a maximum of 98F for the month of July, 1913, when Greenland Ranch reported its 134 maximum.
Mina, NV: 109F on the 10th (+13) Mina (elevation 4550 feet) has a remarkably long and almost uninterrupted climate record from 1896 to 2017 (including nearby Sodaville, Nevada, for the first two decades). Its hottest temperature on record was 110F on July 16, 1933, but that value appears too high for that date compared to surrounding stations. (The next hottest temperature in July, 1933, at Mina was 105F.) So, Mina’s 109F on July 10, 2002, is likely its hottest reliable maximum on record. It was also 109F on July 12, 1905, when the weather station was four miles south of Mina at “Sodaville” (elevation 4665 feet). The high temperature at Mina in July, 1913, was 102F.
Silverpeak, NV: 109F on the 9th (+12) Silverpeak has had several months reach 110 and 111F since 1967, though several of these are in months not noted for having especially hot days in the region: 111F in July, 1975; 110F in both July and August, 1990; 111F in August, 1997; 111F in July, 1998 (this one is good!).
Bishop AP: 110F on the 10th (+12) Hottest on record at Bishop AP! Six months since 1944 have had 109F at Bishop Airport (June of 1954 and 2013, and the Julys of 1972, 2000, 2003, and 2013).
Independence, CA: 113F on the 11th (+13) Independence just keeps on getting hotter! It first reached 110F in June 1960; first reached 112F in July 1972; and then 113F in 1988 and 114F in 1989. It seems that the exposure of the Independence station was not very good for quite a while during the 1980s and perhaps into the 2000s, as these maximums are much warmer than those from 1893 to 1972. Independence hit an all-time high of 115F on June 18, 2017. This temperature is not supported by other station data (e.g., Bishop AP was only 103F on the 18th.) The Independence station is automated…how did that 115F occur? An electronic glitch of some sort, perhaps? The 115F report looks to be about ten degrees too high. More credible maximums of 110F occurred on the 19th and 22nd of June, 2017 at Independence. This heat wave produced a 107F at Bishop AP and 127F at Death Valley.
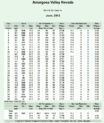
Amargosa Farms, NV: 117F on the 9th (+13) This station is only 25 miles ENE of Furnace Creek, at 2450 feet elevation. And, the maximum of 117F this month is/was the hottest on record! The station existed from 1966-70 and 1978-2014. Maximums of 116F occurred in three Julys (1988, 1995, 2005) and one August (1993). Amargosa Farms’ station was not operating during the hot event in mid-July, 1972, and it reached 115F in the hot spell of late June/early July of 2013.
Desert Rock Airport: 112F on the 9th (+12) Desert Rock came up one short of its all-time record maximum. Its high of 113F was reached on June 30 and July 3 of 2013. For its period of record from 1978 to 2017, five other Julys have had 112F (1985, 2002, 2005, 2007 and 2016).
And, south of Furnace Creek:
Trona: 99F on the 11th. Do you believe that? Hopefully not. All of the maximums for Trona this month were in the 90s, and 16 of the minimums ranged from 89F to 97F. How does this happen? Or, how does an observer manage to enter data which are not possible? The maximum temperature at Trona was likely near 115F this month, and the average daily range was likely around 30 degrees, like it is in most Julys. The temperature data provided on the form for Trona this month bears no resemblance to reality. On July 18th, the climate form shows a high temperature of 90F and a low of 91F. The temperature data for Trona were terrible for years around this time, unfortunately. Fortunately, the flawed temperature data for Trona were not included in Climatological Data.
The moral of the story here — not every observer provides a good record of weather observations.
Randsburg’s 109F fell two degrees short of its all-time maximum, and Baker, Las Vegas, Daggett, and Pahrump were 3-5 degrees short.
July 2005
July 12 to July 20 heat wave
2005 Jul CA CD 2005 Jul NV CD 2005 Jul Death Valley
2005 Jul Amargosa Farms 2005 Jul Baker 2005 Jul Barstow 2005 Jul Beatty 8N
2005 Jul Dyer 2005 Jul Goldfield 2005 Jul Inyokern 2005 Jul Mina 2005 Jul Pahrump
2005 Jul Randsburg 2005 Jul Silverpeak 2005 Jul Trona
Upper Air Data from Desert Rock Airport:
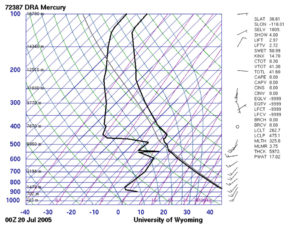
Sounding graph for the afternoon of July 19th at DRA:
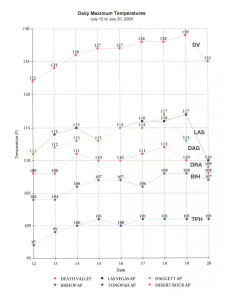
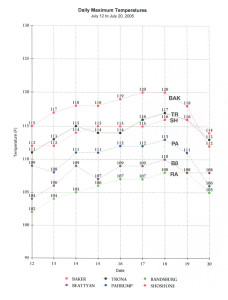
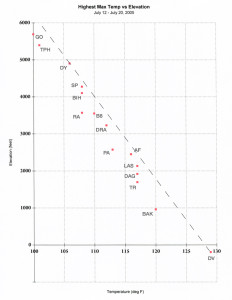
The heat wave of mid-July, 2005, was another doozy in Death Valley, in both intensity and duration. Maximum temperatures ranged from 127F to 129F for the five-day period from the 15th to the 19th (and you might want to throw in the 126F on the 14th for a 6-day stretch of 126F to 129F). The only 5-day stretch that is more extreme than this streak is the period in July, 1913, at Greenland Ranch with the doubtful maximums from 129F to 134F. Minimums were hot at Death Valley from July 15 to 21, ranging from 97F to 101F. The temperature-elevation graphs for this event again show that the Death Valley maximums have a warm bias by a couple of degrees (F). Death Valley’s official station site is warmer now compared to the 1960s and 1970s due, presumably and primarily, to poorer ventilation through the weather station site. If a heat wave identical to this one had occurred shortly after the Death Valley station had been established, in the early 1960s, it is likely that the shelter maximum would have been closer to 127F. If a heat wave identical to this one had occurred shortly after the Greenland Ranch station had been established, around the summer of 1911, it is estimated that the maximum temperature attained (above the “cultivated land”) would have been closer to 125F.
Note that the warmest sounding temperatures from Desert Rock Airport at both 700mb and 850 mb, reached on the 18th, are even slightly warmer than on the hottest day for July, 2002 (the 9th), by 0.4 degrees C. Also note that afternoon sounding data from DRA are not available for three days of the heat wave.
Death Valley’s maximum of 129F on July 19, 2005 (officially recorded at 8 a.m. on the 20th), tied its most-reliable all-time maximum of 129F on July 17, 1998. Surrounding stations generally came within a degree or two of tying all-time record maximums:
Las Vegas Airport had 117F, hottest on record for the airport (since 1949, breaking the 116F reached in numerous summers). The Las Vegas cooperative station had 118F in July, 1931, and was only as hot as 112F in July, 1913.
Daggett Airport had 117F, one shy of its 118F on June 30, 1994.
Baker hit 120F, compared to numerous years with highs of 122-123F.
Trona came up one degree short of its all-time record with 117F,
Beatty 8N (with 110F) was two degrees short of its most reliable maximum of 112F, set in July, 1989. Note: Beatty 8N reported 113F on July 19, 2003, but this high temperature is not supported by maximums at nearby stations. The CEMP station in Beatty shows a high of only 100F on July 19, 2003, a full 13 degrees lower than the Beatty 8N station maximum for same date! It appears that the hottest maximum for July, 2003, in the Beatty area was 109F, which was achieved at both stations. Where did that 113F at Beatty 8N come from? It looks like observer error. Observers are human!
Desert Rock Airport tied its all-time maximum of 112F (which was broken in June and July of 2013).
Amargosa Farms-Garey (with 116F) was one short of its record 117F (set in July 2002)
Tonopah/CEMP recorded maximums of 97 to 98F each day from July 14 to July 20. The USWB station in Tonopah had a record maximum of 99F for its long period of record prior to 1953. In July, 1913, when Greenland Ranch reported 134F, Tonopah had a maximum of only 92F.
Goldfield (100F at the NWS Cooperative Station site and 101F at the CEMP site) was a couple of degrees shy of its record of 103F. Nearby Columbia was 97F in July, 1913.
Unfortunately, no temperature data are available for this month at Independence, Haiwee, and Deep Springs College.
July 2007
July 3 to July 9 heat wave
2007 Jul CA CD 2007 Jul NV CD 2007 Jul Death Valley
2007 Jul Baker 2007 Jul Barstow 2007 Jul Beatty 8N 2007 Jul Dyer 2007
Jul Indy 2007 Jul Inyokern 2007 Jul Las Vegas VEF 2007 Jul Pahrump
2007 Jul Randsburg 2007 Jul Shoshone 2007 Jul Silverpeak
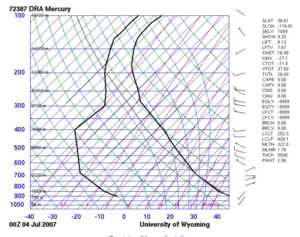
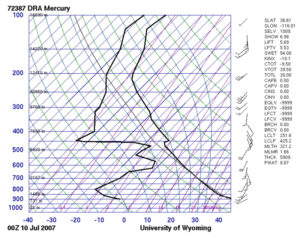
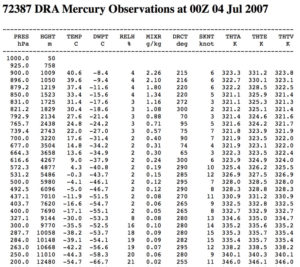
DRA Sounding data for the afternoons of July 3, 5, and 9 (00Z for the 4th, 6th, and 10th):
Upper Air data at Desert Rock AP were available at 00Z on only a few dates during the heat event:
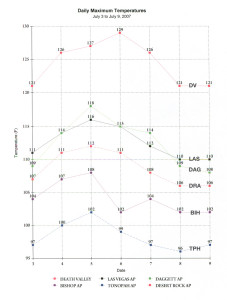
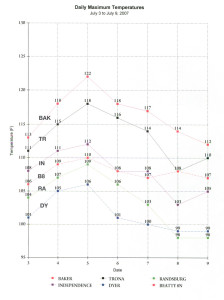
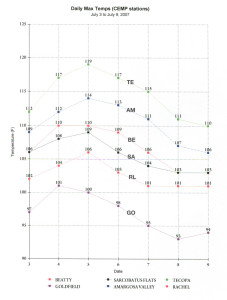
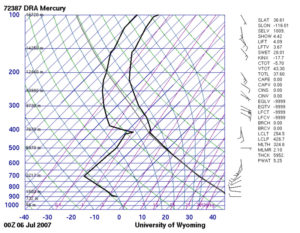
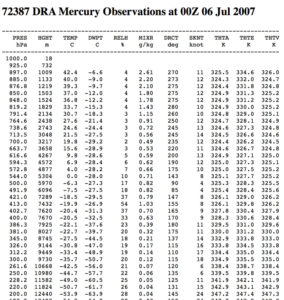
Maximum temperatures in the Death Valley and Mojave Desert regions on July 5 and 6 of 2007 were at or near all-time record levels. We have incomplete upper air data (at 00Z) for Desert Rock Airport, but fortunately there was a balloon launch on the afternoon of the 5th (00Z July 6th). Temperature at 700 mb was an impressive 19.8C, tying the warmest that I have yet to see at that level at Desert Rock (DRA) and Las Vegas (VEF) in my (admittedly incomplete) upper-air analyses and comparisons of heat waves in the region. (The other occasion with 19.8C was July 18, 2005.) Temperatures of 20C or slightly warmer at 700 mb have occurred in the western United States in some of the hottest summer heat waves, but these are above higher-elevation regions. It is easier to warm the air at the 700-millibar level if the terrain below is closer. As an example, the sounding at Flagstaff, AZ, showed a temperature of 21.8C on the afternoon of July 4, 2007. Flagstaff is at 7000 feet, on the expansive Coconino Plateau. It is no coincidence that the large upper-level anticyclones of summer favor the higher-elevation regions near the 4-corners (UT/CO/NM/AZ), as this is where the terrain is highest.
On the DRA sounding on July 5 (00Z on the 6th, see the graph above), temperature decreases at or very near the dry-adiabatic lapse rate from the surface all the way up to the 500-millibar level, and perhaps even to about the 425-millibar level. The boundary layer, or “mixed” layer, was about 7000 meters deep above Death Valley on this afternoon! Typically, on the hottest afternoons in summer, this “mixed” layer extends up to about the 600-mb level. Above that level, temperature might decrease at a rate slightly lower than the dry adiabatic lapse rate. There might even be a shallow inversion or an isothermal layer between the 600 and 400-millibar levels.
The hot mid-levels allowed Death Valley to again reach 129F. This occurred on July 6, but was officially observed at 8 a.m. on July 7. Though this tied Death Valley’s all-time record reliable maximum temperature, there was little fanfare because the unreliable reports from 1913 still overshadow the Death Valley temperature record.
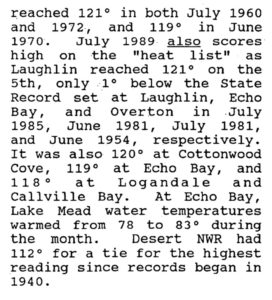
Stations tying all-time record maximums were Trona and Daggett, both with 118F. Baker hit 122F, one degree shy of its blistering 123F in July, 1972. (A poorly-exposed thermometer shelter at Baker resulted in an unrepresentative maximum of 124F in Baker in July, 1980). Dyer’s 106F was one short of its all-time max. Mina’s 107F was second hottest since 1933, which had 110F. Shoshone hit 120F, as did Iron Mountain (121F), Needles AP (121F), Callville Bay (122F), Laughlin (122F), Overton (121F) and Mesquite (120F). Hottest in Arizona were Willow Beach and Bullhead City, both with 122F.
As has been the case since about the late 1980s, the Death Valley maximums for this heat event, when plotted with the other stations on the temperature-elevation graph, showed a warm bias by a couple of degrees. The Independence station has an even greater warm bias.
June and July 2013
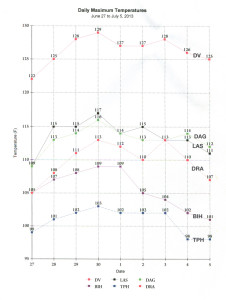
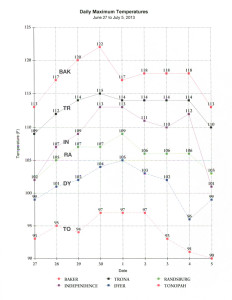
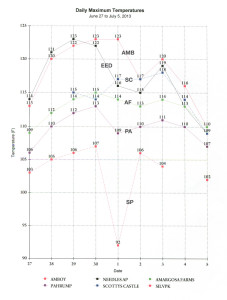
June 27 to July 5 heat wave
2013 Jun Death Valley 2013 Jun Death Valley alt 2013 Jun Las Vegas AP
2013 Jun Amargosa Farms 2013 Jun Amboy 2013 Jun Baker 2013 Jun Barstow
2013 Jun Desert NWR 2013 Jun Dyer 2013 Jun Haiwee 2013 Jun Inde
2013 Jun Iron Mtn 2013 Jun Las Vegas VEF 2013 Jun Mina 2013 Jun Pahrump
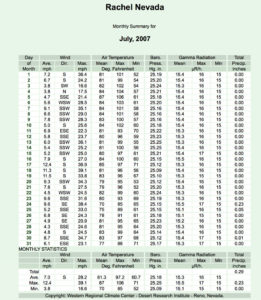
2013 Jun Rachel 2013 Jun Randsburg 2013 Jun Silverpeak 2 2013 Jun Silverpeak
2013 Jun Tonopah 2013 Jun Trona 2013 Jun Bishop AP
2013 Jul Death Valley 2013 Jul Death Valley alt 2013 Jul Las Vegas AP
2013 Jul Amargosa Farms 2013 Jul Amboy 2013 Jul Baker 2013 Jul Barstow
2013 Jul Desert NWR 2013 Jul Dyer 2013 Jul Haiwee 2013 Jul Inde
2013 Jul Iron Mtn 2013 Jul Las Vegas VEF 2013 Jul Mina 2013 Jul Pahrump
2013 Jul Rachel 2013 Jul Randsburg 2013 Jul Silverpeak 2 2013 Jul Silverpeak
2013 Jul Tonopah 2013 Jul Trona 2013 Jul Bishop
June 2013 CEMP stations
July 2013 CEMP stations
Hourly data for June 30 at select CEMP stations:
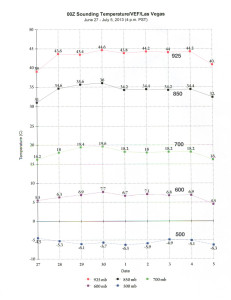
Sounding plot, Las Vegas, July 1/00Z (afternoon of June 30)
Additional NWS info regarding this heat event
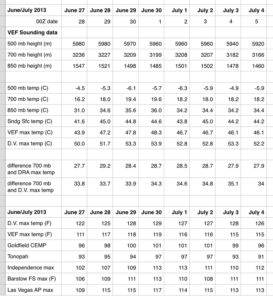
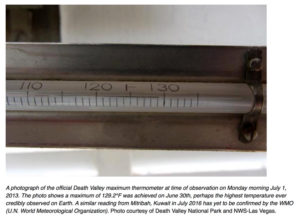
The great desert heat wave of late June/early July of 2013 caused ANOTHER 129F maximum at Death Valley! A picture of the maximum thermometer by the NPS shows 129.2F (54.0C). The record-tying day was June 30. Through 2017, and excluding the reports from July, 1913, five days have registered maximums at Greenland Ranch and Death Valley: July 18, 1960 at Greenland Ranch (questionable veracity), and at the Death Valley/Furnace Creek Visitors Center on July 17, 1998; July 20, 2005; July 7, 2007; and June 30, 2013.
The NPS image above was taken from the Burt/Reid Weather Underground web site article of October, 2016.
Temperature at 700 mb on the Las Vegas (VEF) upper-air sounding was 19.6C on June 30, only 0.2C cooler than that reached for the July heat waves of 2005 and 2007. Death Valley had five consecutive days with maximums of 127F to 129F, matching a 5-day period in July, 2005.
Las Vegas Airport reached 117F on June 30, tying its all-time maximum. Records here began in 1948. A USWB coop station in Las Vegas hit 118F in July, 1931. Stations with 120F or hotter in this heat event include Baker (122F), Amboy (123F), Needles Airport (123F), and a half-dozen stations in the Southern Deserts from Palm Springs (122F) to Mecca (123F) to Blythe and Borrego (both 120F).
Iron Mountain came in with a very dubious 127F on June 27, but that temperature is not supported by the surrounding stations or the upper-air observations. Iron Mountain is at 922 feet elevation, about 50 miles southwest of Needles AP and about 50 miles southeast of Amboy. These are the daily maximums for the three stations from June 25 to June 30 (with maximums shown for the actual date of occurrence):
Amboy (el. 648′) 104 110 113 120 122 123
Needles AP (el. 890′) 105 109 114 121 123 116
Iron Mountain (el. 922′) 108 113 127 121 msg 114
Iron Mountain’s 127F on the 27th does not fit with the other two stations. A maximum of 117F would fit — perhaps an observer misread the thermometer. The missing maximum for Iron Mountain on the 29th, when Needles Airport had its hottest temperature on record up to that point, is unfortunate. Was there a problem with the instrumentation, which might explain the 127F? Or did the observer miss the observation? Well, no, he or she did NOT miss it — the 7:30 a.m. observation on the 30th shows a 24-hour minimum temperature of 82F and a current (at observation) temperature of 89F. The entry place for the maximum was left blank. Maybe the maximum temperature indicated by the thermometer was so high that the observer did not believe it. Maybe the instrumentation was problematic, and is the cause of the dubious 127F on June 27, 2013.
Several low-elevation stations in Arizona reached 120F in late-June 2013, including Bullhead City with 123F, and Parker, Beaver Dam and Lake Havasu City with 121F. Fortunately, the poorly-exposed station at Lake Havasu City which recorded 128F in late June, 1994, was closed (and relocated) for the big heat waves since 2000.
In the Death Valley region for the late June/early July 2013 heat event, stations generally came to within a degree or two of all-time maximum temperatures:
Independence 113F (one degree short of all-time maximum of 114F on July 6, 1989)
Trona 115F (three degrees short of all-time maximum of 118F)
Daggett AP 116F (two degrees short of all-time maximum of 118F in June 1994 and July 2007)
Desert Rock AP 113F (all-time record maximum)
Bishop AP 109F (one short of all-time maximum of 110F on July 10, 2002)
Tonopah AP 103F (one short of all-time maximum of 104F in July 1960 and July 2016).
Baker 122F (one short of all-time maximum of 123F in July 1972 and July 2007)
Amargosa Farms 115F (two short of all-time maximum of 117F on July 9, 2002; the Amargosa Valley CEMP station had 114F for this 2013 event)
Pahrump 113F (two short of all-time record of 115F in the Julys of 1960, 1961, and 1972, and June of 1961. A short-lived station at Pahrump had 117F in 1924.)
Barstow FS 113F (one short of all-time record of 114F on July 5, 2007; another long-term station in Barstow had 116F on July 14, 1972)
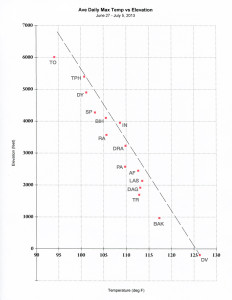
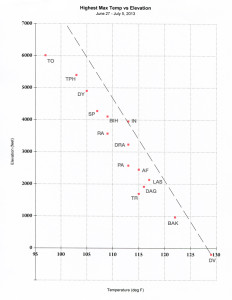
Similar to previous summertime heat waves since the late 1980s, the maximums at Death Valley for this event show a warm bias when compared to other regional stations on the temperature-elevation graphs. For the June 27 to July 5 timeframe, average maximums at the surrounding stations generally averaged 1-4 degrees on the cool side of the (4.5 deg F/1000 feet) slope drawn through the Death Valley plot. As mentioned several times prior in this research, part of this discrepancy is likely due to poorer ventilation through the Death Valley station site in recent decades due to the increase in vegetation, and perhaps structures, just to its south. The average maximum temperatures at Death Valley for this 9-day stretch was an amazing 126F! Recall that the most reliable maximum temperature at Greenland Ranch (1911-1960) was 127F; the most reliable maximum temperature at Cow Creek (1934-1961) was 126F; and the Death Valley station that was established near the new Visitors Center at Furnace Creek in 1961 exceeded 126F in only ONE heat event (July 1972) from 1961 to 1987.
2016 and 2017 Heat Waves
Death Valley reached official highs of 127F in July of 2016, and in June, July and August of 2017. Of course, maximums as high as this would have been big news for the first eight decades of the combined Greenland Ranch/Death Valley record. But nine summers from 1994 to 2017 have reached 128F or 129F at Death Valley. A maximum of 127F is close to an all-time record maximum, but in the past three decades a temperature as hot as this in Death Valley is not especially noteworthy. In the next section is a table which compares upper air temperatures and surrounding station data on some of the hottest days in 2016 and 2017.
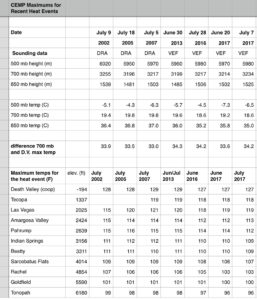
Recent Heat Waves Summary, CEMP stations, Maximum Temperatures and Associated Upper Air Temperatures
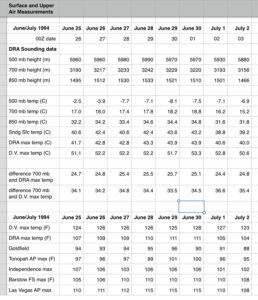
The tables below compare upper air and surface maximums at Death Valley region stations for notable heat events from 1988 to 2013 (first table) and from 2002 to 2017 (second table). The second table incorporates maximums from CEMP stations only, except for the cooperative station at Death Valley. The CEMP stations are generally very reliable, the station exposures are very good, and the maximum temperature data are very trustworthy. The maximums at CEMP stations appear to be very similar to those at cooperative stations during summer heat waves, at least in places which have both to compare. One exception is Las Vegas. The CEMP station in Las Vegas provides high temperatures which appear to be a few degrees warmer than the nearby NWS stations. This is likely due to a relatively poor station siting and exposure, assuming that the CEMP folks strive to locate stations in places which best represent conditions for a general area. Of course, in highly-developed areas, it is often difficult to site stations where vegetation and structures do not have a significant impact on maximum-temperature measurement.
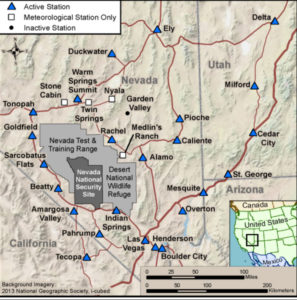
Here is the handy link to the CEMP page. The CEMP (Community Environmental Monitoring Program) stations generally surround the Nevada National Security Site, east of Beatty. These stations have greatly improved the coverage of daily temperature and precipitation data in the Death Valley region, and they provide hourly temperature data, too!
The most intense Death Valley heat waves from 1988 to 2017 have been associated with the following upper air temperatures (in degrees C, for 00Z soundings at Desert Rock and Las Vegas):
at 500mb, -7.0 to -3.0
at 700mb, 18.8 to 19.8
at 850mb, 35.0 to 37.0
The 500-millibar level temperatures are not an especially good indicator of maximum temperatures in the Death Valley region, as the mixed layer usually does not extend as high as the 500-millibar level on the hottest summer afternoons. Oftentimes, the 500-millibar temperature peaks a day or two prior to the hottest surface-station maximums during regional heat events in summer.
The 700-millibar temperature is indeed a very good indicator, or predictor, of surface maximums in the Death Valley region in summer. On the hottest summer afternoons, Death Valley’s maximum temperature is typically 33.5 to 34.5 degrees (C) warmer than the temperature measured at the 700-millibar level by the instruments carried above Desert Rock or Las Vegas (for the 00Z sounding) on the same afternoon. This is a fairly narrow range, even though Furnace Creek is not especially close to these sounding stations. (In the later stages of some some exceptionally hot spells, when a moister air mass is impacting the Nevada stations but not Furnace Creek, this difference typically increases by a couple of degrees.)
During these exceptionally hot periods in summer, the 500-millibar heights generally peak anywhere from 597 to 602 decameters (19,600 to 19,750 feet), and the 700-millibar level generally resides around 3200 to 3250 meters (10,500 to 10,660 feet) above sea level. As detailed in Section 1 of this study, the boundary layer above Death Valley and surrounding desert areas on the hottest afternoons in summer extends to roughly the 600-millibar level, at least. The 600-millibar level is about 4500 meters (or 14,760 feet) in altitude above sea level during the hottest summer weather. On occasion, the mixed layer (characterized by dry adiabatic lapse rates) might extend to near or above the 500-millibar level, but this seems to be rather infrequent.
Given a hypothetical 700-millibar temperature of 19.5C, a 700-millibar height of 3225 meters, and a temperature of 53C (127.4F) at Furnace Creek (elevation -60 meters): the difference in temperature between the 700-millibar level and the ambient air temperature at Furnace Creek would be 33.5C. The altitude difference of 3285 meters results in an average temperature lapse rate of 10.2 degrees C/1000 meters (or 10.2 Kelvins/1000 meters, or 5.6 degrees F/1000 feet). This is slightly steeper than the dry adiabatic lapse rate (9.8 degrees C/1000 meters or 5.38 degrees F/1000 feet) because this air layer includes the super-adiabatic layer in the lowest 50-100 meters.
Heat Waves from 1930 to 2017
If you were patient and persistent enough to wade through all of the discussion in this section thus far, and if you checked most of the charts and graphs, then several things should be quite apparent with regard to maximum temperature behavior in the Death Valley region during the hottest summer heat waves:
When the maximum and average daily maximum temperatures for a heat event are plotted versus station elevation, a close correlation is evident between temperature and elevation in the region. Maximums decrease at a rate of about 4.5 degrees F/1000 feet in the region (8.5 deg C/km). It is the same for every heat wave. Yes, there are some station outliers from time-to-time (usually slight outliers), and these are usually explainable due to local effects and station exposure, or perhaps differing weather effects of monsoon moisture or high cloudiness. However, the nature of these heat events effectively minimizes or eliminates the “weather” differences. The large anticyclones which are responsible for the hottest weather are slow-moving, with little change in temperature at 700-millibar over vast horizontal distances, so that all stations in the region are “working off of” the same air mass on the hottest afternoons. Of course, this is when the upper-air anticyclones are near their peak and when 700-millibar temperatures are at or near their hottest for the event. If a station tends to “stray” with time (whether suddenly or slowly) away from its usual spot near the average temperature/elevation line on the chart, then that likely suggests a station siting change, a change in exposure or ground cover near and around the station, or perhaps a problem with the instrumentation and/or observations.
Yes, I have harped on this over and over again, but I need to because this is why Greenland Ranch could not have been as hot as 134F in 1913! The physics of the atmosphere is the reason for the close correlation among stations in each heat event. The physics of the atmosphere is not going to change, and each and every heat event in summer in the Death Valley region is generally due to the same weather pattern: high pressure aloft. If a station is providing some maximum temperatures which are not in line with the other regional temperatures during a heat event, and if they cannot be explained by exposure or siting (or even by some local weather event), then the maximums are suspect. In the desert in summer, excessive maximum temperatures do not occur at a local level.
When one station in the region is at or near a record maximum temperature, then the other stations are at or (generally) near record maximums. If one station is 5 degrees, or 10 degrees, above its average daily temperature on a sunny summer day, then the stations surrounding it are also going to be about 5 degrees, or 10 degrees, respectively, above their average daily maximum. This results in a generally similar day-to-day trend in maximums for all of the stations in the region.
And so, when we look closely at the summertime maximums during the first decade or two of observations at Greenland Ranch, we should find similar patterns, similar trends, and similar correlations. Where there are inconsistencies and outliers, there is probably a problem with the reported maximums temperatures.
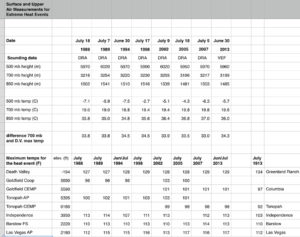
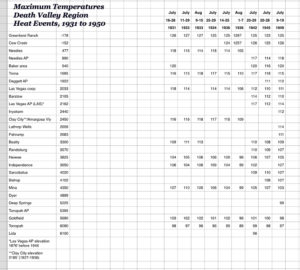
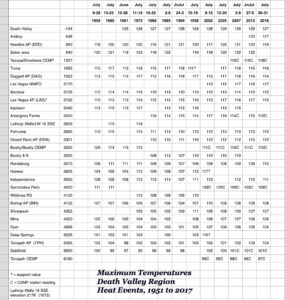
Tables were prepared to show and compare maximum temperatures for each regional heat wave listed in this study. This is kind of a One-Stop Shop to check the reports for the hottest events:
The first table provides data for events from 1931 to 1950, when the Death Valley stations Greenland Ranch and Cow Creek were active. Note that the Death Valley station maximums were generally 124 to 127F for this timeframe. The second table covers the period from 1951 to 2017. From the late 1980s to the present, Death Valley generally needed to hit 127 or hotter to qualify.
The one event since 1931 where the Death Valley maximums are not supported by surrounding maximums is that of the first week of August, 1936. That was truly a strange several days, as the Cow Creek and Greenland Ranch maximums do not correlate at all. I am not sure as to what was going on — see the section for August 1936 for the discussion on this event. If the maximums at Cow Creek and Greenland Ranch are authentic, then there was indeed a freakish local heat event in August of 1936. It may have been due to a convective-related heat burst. It is difficult to imagine that maximums at BOTH of the stations are doubtful due to observer error…though the Greenland Ranch maximums do indeed appear problematic.
So, the next part of this “Historic Heat Waves” section will examine the hottest periods during the first two decades of the Greenland Ranch record, from 1911 to 1930. We would expect to see the same temperature support and good correlation among the stations as we saw from 1931 to 2017.







Leave a Reply
You must be logged in to post a comment.