This is Part 4C, an in-depth investigation of the hottest periods in the Death Valley region during the first 20 years of the Greenland Ranch temperature record.
Link to Part 4A 1931 to 1960 Heat Events (Use this link to navigate to other Parts of this study.)
Link to Part 4B 1961 to 2017 Heat Events
March 2018 update: This section is not finished!
As discussed previously, I believe that it is prudent to first examine the regional heat waves since 1930 before tackling those of the early years…so, I recommend reading Parts 4A and 4B before 4C!
In addition, Part 6 explores the establishment of Greenland Ranch and its weather station, and some background on observer Oscar Denton. It might be helpful to be familiar with the information in Part 6 prior to reading this section.
——
The first official daily observation at Greenland Ranch was around 5 p.m. on June 8, 1911, by observer Thomas Osborn. The daily extremes were 104F and 68F, and the (5 p.m.) set max temperature was 100F. The “set max” temperature is the temperature indicated on the maximum thermometer immediately after it is reset. It is reset by spinning it inside of the thermometer shelter. The set max reading should be the same as the current temperature reading on the minimum thermometer, and should reflect the current ambient air temperature. When proper observing procedures are followed, it follows that the maximum temperature report for the following day must be the same or higher than this “set max” temperature observation. An observation time of 5 p.m. is rather close to the typical time of maximum temperature during the afternoon in Death Valley in summer; thus, on occasion, the daily maximum temperature for a particular day reflects conditions on the previous afternoon. This can make comparisons of day-to-day maximums among stations in the Death Valley region somewhat tricky, especially if the official time of observation is not the same at all stations. (The USWB stations at Independence and Tonopah were midnight-to-midnight, and most daily observations at cooperative stations were from 5 p.m. to sunset.) Keep this in mind when comparing daily maximums, especially when heat waves are decreasing in intensity. Usually, the set-max temperature is provided on the original climate forms. This can help the researcher determine whether or not a maximum temperature provided for a certain date actually occurred on that date or not. Of course, when comparing maximums by month or year or by each heat event, the time of observation is not a factor.
We have found that maximum temperatures behave in a generally predictable and consistent fashion during the hottest spells in summer in the Death Valley region. There is a very strong correlation between maximum temperature and elevation, with maximums decreasing by about 4.5 degrees F with every 1000-foot increase in elevation. The excellent mixing of the lower troposphere up to the 600-millibar level (and beyond) on sunny summer afternoons is the reason for the strong correlation. The maximum temperature at each station in the region generally will support the maximum temperatures at the stations that surround it. And, of course, this presumes that the maximum temperatures are from adequately-sited and properly-maintained instrumentation, and that the observer properly read and recorded the observation. If the station sitings and surrounding environment remain consistent from year-to-year, then one should expect to find similar differences in maximum temperature between stations for summer heat events from year-to-year and even decade-to-decade.
Early Weather Stations in the Death Valley Region
Since the veracity of the Greenland Ranch maximums in July, 1913, is the primary concern for this research project, it will be interesting to examine the differences in maximums among the stations in the region for heat events during the first several summers in which Greenland Ranch temperature data are available.
There weren’t many climate stations operating near Greenland Ranch in 1911, and the closest, at Lone Pine, CA, was 67 miles distant! There were only a half dozen or so stations within 120 miles of Greenland Ranch. These are the ones utilized on the temperature/elevation plots that were made for this project:
Greenland Ranch, Inyo County, CA (Pacific Coast Borax Company observer, elevation -178′)
Lone Pine, Inyo County, CA (67 miles to the WNW, observer Gustave F. Marsh, elevation 3728′)
Independence, Inyo County, CA (78 miles to the WNW, USWB observer, elevation 3957′)
Columbia, Esmeralda County, NV (90 miles to the north, observer A. Booth, elevation 5750′)
Jean, Clark County, NV (98 miles to the ESE, observer Salt Lake Route, elevation 2840′)
Barstow, San Bernardino County, CA (108 miles to the south, observer E.L. White, elevation 2105′)
Tonopah, Nye County, NV (113 miles to the north, USWB observer, elevation 6090′)
and operating by the summer of 1913 and within 120 miles of Greenland Ranch:
Lida, Esmeralda County, NV (77 miles NNW, observer L.F. Detwiler, elevation 6037′)
Oasis Ranch, Mono County, CA* (92 miles to the NW, observer A.S. Patterson, elevation 5106′)
Las Vegas, Clark County, NV (98 miles to the ESE, observer C.P. “Pops” Squires, elevation 2033′)
Recall that Columbia, Nevada, now a ghost town, was located about a mile N to NNE of Goldfield, Nevada.
The following stations were deemed to be too distant from the Death Valley region to include on most of the charts and tables that were prepared for this study. Generally speaking, maximums at the stations below will support the maximums in the Death Valley region (and vice-versa) for a summer heat event. On occasion, monsoon moisture, clouds and storminess might impact one area and not the other to cause poor support, especially on a day-to-day basis.
Mina, Mineral County, NV (150 miles to the NNW, observer Southern Pacific Company, elevation 4600′)
Logan, Clark County, NV (now called Logandale, 133 miles to the east, observer Orin W. Jarvis, elevation 1355′)
Caliente, Lincoln County, NV (153 miles to the ENE, observer Salt Lake Route, elevation 4407′)
Needles, San Bernardino County, CA (169 miles to the SE, observer Santa Fe Company, elevation 477′)
Bagdad, San Bernardino County, CA (141 miles to the SSE, observer Santa Fe Company, elevation 784′)
Bishop, Inyo County, CA (105 miles to the northwest, observer Paul E. Lodge, elevation 4450′)
Mojave, Kern County, CA (122 miles to the SW, observer Southern Pacific Company, elevation 2751′)
*Oasis Ranch data appeared in the Nevada Section of the climatological data publication when the station opened in 1913. It was shown to be in Esmeralda County, in Nevada, on both the USWB publication and on the Oasis Ranch climate forms, until its closing in 1919. However, later it was determined that this station was actually in Mono County, California.
Also, the Bishop station from 1895 to 1918 had an elevation of 4450 feet, which is 350 feet above the elevation of today’s Bishop Airport, and 300 feet above the elevation of the town itself. I have yet to determine exactly where this old Bishop station was located.
Click on the maps below for station locations, including several from the old Department of Agriculture/USWB Climatological Service. Note that Greenland Ranch is not plotted in the right place on the 1916 USWB map. It should be where I added “FC” (for “Furnace Creek”).
Pre-1930 Maximums in the Death Valley Region
Before getting into the specific heat events from 1911 to 1930, let’s examine some average and extreme data for these earlier stations. The following numbers (average daily maximum for July, average annual maximum, and extreme maximum) include data through 1930 only.
Since the number of (Death Valley region) stations operating during the first few years of the Greenland Ranch record was only a half dozen or so, several additional and somewhat more-distant stations were added here to help fill in some gaps, both spatially and with regard to elevation.
Some notes regarding the data in this table:
—There are two values of average daily maximum for July. The first one is the official USWB Bulletin W value for (all) data through 1930, if available. The second one is an adjusted value, and is derived only from data which appear trustworthy and representative. For instance, temperature data for Needles were available for the 1920s but were not used in the calculations. A change in the Needles climate station around 1920 caused a significant and abrupt increase in summertime maximum temperature readings there. It is more prudent here, for comparison purposes to Greenland Ranch especially, to use only data from that (reliable and representative) Needles station which was operating in 1913. Needles recorded a 125F maximum in 1925. This value is not especially well-supported by surrounding stations, and it may be from a relatively short-lived and poorly-exposed instrument location in town.
—The average daily maximum for July for Greenland Ranch from 1911 to 1930 was 116.4F, according to USWB Bulletin W. This figure is likely “artificially” on the high side, given the number of untrustworthy maximum temperatures discovered in the first 10-20 Julys of the Greenland Ranch record. The figure of 116.4F is maintained here, however, for the tables and the charts. A more representative average daily maximum temperature for July for Greenland Ranch from 1911 to 1930 is about 116.0F. The average annual maximum of 124.1F at Greenland Ranch from 1911 to 1930 does NOT incorporate the 1913 maximum of 134F. And, the range of annual maximums from 1911 to 1930 is 120F to 127F if the 134F maximum is excluded. Keep in mind that the Greenland Ranch thermometer shelter, originally sited above “cultivated ground,” was above bare ground for at least parts of its first two decades of service. The average daily maximum for July at Greenland Ranch through 1930 might have been a couple of degrees cooler (than 116.4F) if the shelter environment had remained the same through 1930 as it was, presumably, in 1911 and 1912.
—Temperature records from Las Vegas prior to 1913 were rather spotty and somewhat inconsistent with regard to representativeness. For example, the average annual maximum at Las Vegas from 1895 to 1899 was only 101F, compared to 113F at “Pop” Squires’ Las Vegas station from 1913 to 1930. The data from 1913 to 1930 compare much more closely to more recent data, so the pre-1900 maximums from Las Vegas appear unrepresentative and are discarded. How could these pre-1900 annual maximums be so cool? Was the instrument shelter, or thermometer, above a very wet grassy area and in a very shady area? Or were the maximums from a non-recording thermometer, with readings taken not very close to the hottest part of the afternoon? The answers are elusive!
—Temperature data are especially problematic for the final few years of observation at Lone Pine (about 1918 to 1920) and were not incorporated in the averages here. The average annual maximum at Lone Pine should be 99.7F and not 99.0F (as is shown in the table above). Also, there are occasional periods of a few days or a week or two in the Lone Pine record prior to 1918 when the temperature data appear contrived, or estimated. It is presumed that the observer (Gustave Marsh) estimated some maximums and minimums for periods when he was not in town to take the daily observations.
— Columbia showed a maximum temperature of 108F on July 20, 1906, during its first summer of operation. Up the road at Tonopah, the maximum was only 87F on this same date. The actual maximum at Columbia was probably no higher than 95F. The highest reliable maximum on record from 1906 to 2017 at Columbia and Goldfield is 103F. How and why did 108F wind up on the climate form for Columbia in July, 1906?
— Four of the stations here have quite short histories, with only 5-8 summers of data (Jean with 8, Lida with 5, Oasis Ranch with 7, and Caliente with 7). Monthly averages from these relatively brief periods might not be good estimations of long-term averages.
The graphs below plot summer maximum temperatures (extreme, average annual, and average daily for July) versus elevation in the Death Valley region, and include a handful of stations a bit outside of the region.
- Extreme Maximum versus Elevation, data through 1930
- Average Annual Maximum versus Elevation, data through 1930
- Average Daily Maximum for July versus Elevation, data through 1930
Note that 127F is plotted for Greenland Ranch on the “extreme” chart (and the 134F from July 10, 1913 is not), as 127F is the hottest reliable maximum there from 1911 to 1930 (set on July 23, 1916). Again, the average annual maximum at Lone Pine should be 99.7F instead of 99.0F.
The good correlation between summer maximums and elevation is apparent, with temperature decreasing at a rate of about 4.5 degrees (F)/1000 feet. The lower-elevation stations outside of Death Valley (Bagdad, Needles, and Logan) are all more than 130 miles to the south and east of Greenland Ranch. The greater monsoon activity (and associated cooling) at these stations in summer compared to Death Valley likely promotes slightly lower average maximum temperatures compared to locales at similar elevations in the Death Valley region.
One might ask why Mina, Nevada, despite being more than 600 feet higher than Independence and Lone Pine, had a warmer average daily July maximum by a couple of degrees (F). The reason is probably due to the difference in ground cover and local moisture sources in and around the weather station. Though the station environment for Mina has not been researched yet by me, it is apparent that the early Owens Valley stations were in moister, cooler environments, as we will discuss below.
Owens Valley Stations
The closest long-term weather stations to Greenland Ranch which were in operation in 1913 (when the record 130F-plus maximums were recorded) were Lone Pine and Independence, in the southern part of the Owens Valley. These stations were 67 and 78 miles to the WNW of Furnace Creek. Practically all of the next-closest stations operating from 1911-1920 were 90 miles or more distant. (A couple of very short-lived stations, at Lida and Rhyolite, were not as distant.)
The three stations in the Owens Valley (Lone Pine, Independence and Bishop) plot on the “cool side” comparatively in the maximum/elevation charts above. Owens Valley was much moister prior to the diversion of Owens River flow to Los Angeles, which began in 1913. Owens Lake was a large lake! Some summer maximums at nearby Lone Pine were no doubt moderated somewhat due to Owens Lake. Agriculture and irrigation in the basin were likely much more prevalent prior to 1913, and water was likely much more plentiful to maintain lush lawns and shade trees in the area towns. The moister surfaces of Owens Valley would moderate summer maximums significantly (due to evaporative effects). Summer maximums in the basin increased after the water diversions began, as the water resources diminished and the lake evaporated. A comparison of maximums between Owens Valley and non-Owens Valley stations through the years is not straight-forward because of the gradual drying of the basin.
In about half of the summers from 1988 to 2017 at Independence, the temperature reached from 110F to 114F. In its first 30 years of record, from 1893 to 1924, the highest on record at Independence was only 105F! (It was 103F on July 10, 1913, when Greenland Ranch reported its 134F.) That is a very impressive and significant increase in extreme maximums in 100 years. The tremendous change is due to the water diversions and the drying of Owens Valley, and is also due to the exposure, local environment, and nature of the instrumentation at the Independence weather station(s). Let’s compare average daily maximums for July past and present at Independence and Bishop:
Independence (1893-1930) 93.6F, (1981-2010) 99.8F (elevation 3950 feet)
Bishop (1895-1918) 92.2F, (1981-2010) 98.4F (elevation 4450 feet for early years, 4102 feet currently at Bishop AP
The average daily maximum for July increased 6.2 degrees (F) at both towns from circa 1900 to circa 2000. The earlier Bishop station was 350 feet higher than the current station at Bishop Airport, which corresponds to an approximately 1.5 degrees temperature advantage at Bishop Airport. The increase in average maximum temperature for July at Bishop is reduced to about 4.7 degrees (F) if the elevation factor is incorporated.
The increase in summertime maximums at Independence is even more impressive if the first 28 years of record (1893-1920) is compared to the most recent (unofficial) 30-year period (1988-2017). For these periods, the average daily maximum for July at Independence increased from approximately 93F to 101F, an 8-degree (F) jump! As mentioned, the increase can be attributed in part to station instrumentation and nearby station environment. The USWB thermometer shelter at Independence prior to 1930 was well off of the ground, above a grassy lawn (presumably), with large shade trees not far to the west.
above: Images of the United States Weather Bureau weather station at Independence, California, circa 1900.
Photo Credits: County of Inyo, Eastern California Museum
The exact dates of these photographs are not known. In the first photo (Jones99, photographer likely John Jones, circa 1900), the view is towards the north-northwest. For photos two (donated by Helen Gunn) and three (unknown source), the view is towards the northeast. Photo #4 (unknown source) is a view to the west, and Photo #5 (photographer Walter Harris) is probably a view to the east, towards a schoolhouse perhaps. Photo #5 shows the aftermath of a windstorm which destroyed the thermometer shelter assembly, apparently, and may have even blown the bell tower off of the schoolhouse (which is visible in Photo #3). The date of the windstorm was February 12, 1923. An article in Monthly Weather Review discusses this major wind event, which deposited 0.15″ of sand in the rain gage!
The white “X” in the recent satellite image above denotes the location (on Jackson Street between Main and Center) of the USWB office in Independence circa 1893-1930. The weather station for Independence in these early years was in the yard on the south side of the structure, which was built in 1890, according to Internet realtor records. This was a short distance north of the Inyo County courthouse.
Maximum temperature measurements from this early station in Independence would have been very conservative. The two-story structure just to the north of the shelter might have promoted somewhat warmer maximums due to a decrease in ventilation through the south yard, especially on sunny afternoons with north winds. The hottest summer afternoons are usually associated with a southerly breeze, however. This nearby house probably had little affect on shelter temperatures on the hottest summer afternoons.
Now, compare this early Independence weather station to the current one, in a maintenance yard (operated by the Los Angeles Department of Water and Power) on the west side of town:
The images above are of Independence and its weather station in late September, 2017. The thermometer shelter and rain gages were in a fenced area on the south perimeter of a maintenance yard for the Los Angeles Department of Water and Power. Image 1 above is looking east from the slopes of the Sierra Nevada above Independence. Image 2 is a view to the east towards the area where the weather station is located. The remaining images show the thermometer shelter and station environment.
The satellite images above show the location of the Independence weather station in September, 2017, and its location at the LADWP maintenance yard on the southwest edge of the town.
The Independence thermometer shelter in September, 2017, was above a bare surface, with the floor of the shelter about four feet above the ground. It is generally very well-exposed to the wind, though some equipment in the yard may decrease local ventilation slightly. Compared to the station environment some 100 years earlier, the bare ground (versus grass) promotes hotter maximums, the shelter situated much closer to the ground (versus more than ten feet above the ground) promotes hotter maximums, the general lack of trees and vegetation around the station site promotes hotter maximums, and the general region-wide drying compared to pre-Owens River-water-diversion times has promoted hotter maximums in and around Independence. The result is about an 8-degrees increase in observed average maximum temperatures. This climatologist estimates that about 4-5 degrees of the 8-degree increase is due to the stark difference in weather station environments and instrumentation, and about 3-4 degrees is due to the general drying of Owens Valley. It appears that the current Independence station is indeed in a relatively “warm” locale, and that the poorly-maintained shelter itself may promote higher maximums on sunny days. The roof of the shelter has lost most of its white paint, which is generally considered to be unacceptable when it comes to standard temperature measurement and instrumentation.
The screaming message here is this: temperatures in very dry (desert) environments on sunny summer afternoons is significantly influenced by local moisture (or lack thereof), local ground cover and vegetation, general exposure and ventilation in the vicinity of the station, and the height of the thermometer above the ground. Very dry desert air is VERY sensitive to the effects of solar radiation and local moisture. The U.S. Weather Bureau was well aware of these influences. When establishing new weather stations in the desert back in the first several decades of the Signal Corps and U.S. Weather Bureau, every effort was made to minimize the influence of excessive heat sources near the thermometers. Conservative and consistent station sitings were considered essential in order to promote valid and comparable temperature measurements, temporally and spatially. Since weather stations in the eastern United States were generally sited above grass, it followed that thermometer shelters in the Desert Southwest should also be above grass. A conservative siting above grass would minimize any spurious (i.e., unwanted) warming due to a super-heated barren desert surface. Of course, the instrument shelter at Greenland Ranch was originally sited above “cultivated ground,” according to Willson and its substation history. It is important to know of any changes in the environment and ground cover around a station through its period of record.
Several decades into the 1900s, it seems that the general USWB guideline that a desert station’s thermometer shelter be above grass was relaxed. More and more weather stations were being established at airports, where maintaining grassy areas was very low on the priority list. Cooperative USWB and NWS stations in and near desert towns were more frequently sited above natural (i.e., mostly barren) ground cover after the middle of the 20th century. When I visited about a dozen weather stations during the 1980s for my master’s thesis research on Eastern Mojave Desert temperatures, I observed only one thermometer shelter that was above a grassy and well-watered lawn (at the Barstow Fire Station).
So while we are on this topic, let’s compare average daily July maximums at other desert stations, old data versus latest 30-year normal, where available:
Greenland Ranch (1911-1930) 116.4F
Death Valley (1981-2010) 116.5F
increase of 0.1 degrees (F), though the early Greenland Ranch maximums are problematic
Needles (1893-1919) 106.3F
Needles AP (1981-2010) 108.8F
increase of 2.5 degrees (F), and Needles AP is a few hundred feet higher in elevation versus the town
Trona (1920-1952) 106.4
Trona (1981-2017) estimated 106.0F (long period of bad data during the 1990s omitted)
decrease of 0.4 degrees (F)
Las Vegas (1913-1930) 102.8F
Las Vegas Airport (1981-2010, 130 feet higher) 104.2F
increase of 1.4 degrees (F)
Barstow (1903-1920) 101.4F
Barstow Fire Station (1981-2010, 200 feet higher) 102.0F
increase of 0.6 degrees (F)
Haiwee (1923-1952) 94.5F
Haiwee (1991-2016) 98.2F
increase of 3.7 degrees (F)
Independence (1893-1930) 93.6F
Independence (1981-2010) 99.8F
increase of 6.2 degrees (F)
Bishop (1895-1918) 92.2F
Bishop Airport (1981-2010, 350 feet lower) 98.4F
increase of 6.2 degrees (F)
Mina (1896-1930) 95.6F
Mina (1981-2010) 95.3F
decrease of 0.3 (F)
Goldfield (1906-1930) 89.6F (includes data from Columbia)
Goldfield (1981-2010) 88.8F
decrease of 0.8 (F)
The stations with the increases of more than two degrees (Needles, Haiwee, Bishop, Independence) likely were over grass during the early years, and over a typical (relatively dry and barren) surface in the most recent decades. The Las Vegas cooperative station may have also been above grass for part, if not all, of its period of record from 1913 and into the 1950s.
Finally, though the Greenland Ranch shelter was initially placed above grass or alfalfa, several early images show that it was above bare ground. Its average daily maximum of about 116F before 1931 strongly suggests that the station was not above grass for most of its first 20 years of record.
It can probably be assumed that, for those stations without much of a change past versus present (namely Trona, Mina and Goldfield), that the early stations were not above a grassy surface, or at least were sited where summer maximum temperatures were little affected by local moist ground cover.
A station operated at Lone Pine from 1904 to 1920. The observer was Gustave F. Marsh (1869-1946), a prominent citizen (born in England) who was largely responsible for establishing and constructing the trail from Lone Pine to Mount Whitney. His first month as observer in Lone Pine was August, 1904 (the month after he completed the trail to Mount Whitney).
The image above of Gustave Marsh is from Mount Whitney by Christopher Langley and Michael Prather.
UPDATE and correction: the image above is of Gus Marsh, who died in 1998 and was the son of Gustave. This is according to the grand daughter of Gus Marsh. This FB link provides an image of Gustave and Gus.
The Eastern California Museum at Independence contains plenty of information on the life of Marsh, much of it compiled and provided by George Marsh, his grandson. Marsh was a rancher, a miner (Ballarat claim), and mail carrier from 1902 to 1930. He installed and maintained local water distribution, installed the first telephone lines in the area, and was a freight hauler. He was on the Inyo County Board of Supervisors and the Lone Pine Unified School Board. In 1909 Marsh built the Mount Whitney hut/observatory for the Smithsonian.
The Lone Pine temperature record appears good for the most part, except towards the final few years (post-1915) when there are periods when the data are very suspect. We will examine some of the suspect data in the forthcoming sections in this entry. It seems reasonable to assume that Gustave Marsh was not in Lone Pine on occasion and that some observations would have been made by family or friends.
Unlike Independence, where the USWB had a forecast office and paid observers, Marsh was a volunteer cooperative observer at Lone Pine. Observation time at Independence was midnight, and at Lone Pine was 5 p.m. Lone Pine was/is about 230 feet lower in elevation than Independence, and its average maximum temperature in the summer months was close to one degree warmer. It is probable that the Lone Pine thermometer shelter was above grass for all or most its period of record. Also, keep in mind that prior to the 1920s, Lone Pine was situated near a very large body of water. Owens Lake no doubt had a moderating effect on temperature on some, if not many, summer afternoons.
——————-
And now, finally, let’s compare some maximums from the earliest summers of the Greenland Ranch record! And, as a convenient reminder, here are the average daily maximums for June/July/August (rounded off to the nearest whole degree F, data through 1930 only) for the stations operating before 1930:
Greenland Ranch 110/116/114F
Lone Pine 89/94/92F
Independence 88/94/91F
Las Vegas 99/103/102F
Barstow 96/101/100F
Goldfield 82/90/87F
Tonopah 78/86/83F
June 1911
June 9 to June 14, first hot spell at new Greenland Ranch weather station
1911 Jun Great Basin CD 1911 Jun CA CD 1911 Jun Colorado Basin CD
1911 Jun Barstow 1911 Jun Independence 1911 Jun Lone Pine
1911 Jun Columbia 1911 Jun Jean Greenland Ranch 1911 Jun
A decent heat wave developed in the region during the first week of daily weather observations at Greenland Ranch, culminating with 120F on June 12. The Greenland Ranch instrument shelter was above “cultivated ground” and adjacent to irrigated alfalfa fields for its first two summers of operation, presumably. This likely resulted in official maximum temperature measurements that were two, perhaps three degrees (F) cooler comparably to maximums which would have been attained in a shelter placed above barren ground and well-removed from any irrigated areas (in the vicinity of Furnace Creek Ranch/Greenland Ranch). In other words, the weather conditions which caused the 120F maximum at Greenland Ranch on June 12, 1911, would likely cause a maximum temperature of about 123F at today’s Death Valley climate station. In addition, the moist ground cover contributed to minimum temperatures which were much cooler compared to nearby barren areas.
Following the 120F maximum on the 12th was a significant cool down. Greenland Ranch recorded north winds on the 13th, and the maximum was only 107F on the 14th. Another warm spell developed thereafter, leading to a maximum of 116F on the 18th. At Tonopah, maximum temperature fell from 88F on the 12th to 72F on the 13th, no doubt due to the arrival of the cold front. To its south, at Columbia, the observer (A. Booth) reported “low winds” (presumably meaning “light” winds) on the 12th, when the maximum was 92F. “High winds” from the NE and NW were reported at Columbia on the 13th and 14th. Columbia’s maximum on the 13th was 80F, and rain fell late morning and midday. (The actual maximum on the 13th might have been even cooler at Columbia, as the set max temperature on the 12th was 80F.) Rain also fell at Independence and Lone Pine on the 13th.
The daily plot of maximums from June 8 to 20 (above) shows very good conformity among the stations, as is typically the case during summer. Let’s compare how the departures from the norm (i.e., the average daily maximum for July before 1930) for maximum temperature compare at both Independence and Greenland Ranch:
As is typically the case during warm events in summer, the maximum temperatures are about the same at the two stations with respect to the average daily maximum for July. (In this study, for the sake of consistency, we will compare any warm-season heat event to the average daily maximums for July. The consistency and conformity of the departures from day-to-day between the locations is the key here, not necessarily the magnitude of the departures.) The difference in departures between Greenland Ranch (-1) and Independence (-11) is fairly wide on the 13th, as the region-wide cool down had commenced. This difference may be due to the different times of observation at Independence (midnight) and Greenland Ranch (5 p.m.).
Below are the departures from the daily maximum for July for the maximum temperature observed for the heat event of June 11-12, 1911:
Greenland Ranch 120F, +4
Lone Pine 95F, +1
Independence 96F, +2
Columbia 92F, +2
Tonopah 88F, +2
Barstow 107F, +6
The main takeaway here is that departures are generally about the same in the region, ranging from +1 to +4 except for +6 at Barstow. These departures, and the spread of the departures for these stations, are quite typical for a modest heat event such as this one in June, 1911.
July 1911
July 5 to July 17 hot spell
1911 Jul Great Basin CD 1911 Jul CA CD 1911 Jul Colo Riv Vly CD
Greenland Ranch 1911 Jul 1911 Jul Barstow 1911 Jul Independence
1911 Jul Lone Pine 1911 Jul Columbia 1911 Jul Jean
The first half of July, 1911, was a little hotter than average in the Death Valley region. Greenland Ranch reached 120F or more on five days from the 1st to the 18th, with 13 of these 18 maximums at least 118F. Maximums at Independence ranged from 90F to 96F from the 1st to the 18th, which is not particularly impressive compared to its average daily maximum of 94F for July through 1930. (Keep in mind that this average incorporates many years both before and after the Owens Valley water diversions, which commenced in 1913.) The warmer “post-diversions” period no doubt bumped this daily average upwards a degree or two.)
The first 16 maximums of the month at Independence are rather curious in that they are all either 90, 94, or 96F. The final nine maximums in June, 1911, were also even numbers. Why were 25 consecutive maximums even numbers? Was the thermometer in use a “sixes” thermometer which showed marks for only “even” numbers? During these same 25 days, ten minimums were “odd” numbers. This is probably not a big deal, and there is no reason to suspect the Independence temperature data. However, it is unusual to see such a data set from a United States Weather Bureau station with USWB observers. In contrast, at Lone Pine, the distribution of maximums from July 1-18 was quite different:
90–1 day, 91–2, 92–2, 93–3, 94–2, 95–4, 96–2, 97–0, 98–2
I need to point out some curious data at Barstow, too. The chart above with the plots of daily maximums from July 5 to 19 show four maximums of 100F. The maximum on the 3rd at Barstow was also 100F. The maximums of 100F on the 10th, the 14th, and the 17th at Barstow are generally much lower than maximums on adjacent dates, and there are no similar dramatic drops at the other stations (though, granted, the other stations are all quite distant). The Barstow climate form for July, 1911, does not provide “set max” temperature information, so that does not help to determine what might be going on here. The entire period is characterized as “fair” by the observer, with prevailing west winds. No rainfall occurred in the region, including Needles, to account for the somewhat aberrant decreases in maximum temperature at Barstow. I suspect that the maximums of “100F” at Barstow on the 10th, 14th, and 17th at Barstow are not entirely trustworthy. In summer, under fair skies, Mojave Desert maximum temperatures generally do not “bounce up and down” like the maximums reported at Barstow from July 5 to 18, 1911. I suspect that the observer missed the observation on several dates, and he simply filled in the empty space on the climate form with temperatures which were typical for the time of the year. I may be wrong here, but consider that the max/min report at Barstow was 100/70 on July 5, July 10, and July 14. The repeated daily temperature extremes of 100F and 70F are likely estimated values by the observer, given that the data do not fit very well in the day-to-day trends which are not supported by surrounding stations.
The chart above which compares the daily departures of the maximum for Greenland Ranch and Independence from July 4 to 19, 1911, shows generally fair conformity day-to-day. Some days differ by about six degrees, with Independence lower. Independence reached a maximum of 96F on 8 separate days. These are the departures for the maximum temperature during this period for all of the stations in the region:
Greenland Ranch 122F, +6
Lone Pine 98F, +4
Independence 96F, +2
Columbia 97F, +7
Tonopah 93F, +7
Barstow 111F, +10
As occurred in June, 1911, for the maximums for the heat event, Barstow showed the largest departure compared to its average daily maximum for July. It may be the case that the Barstow station during the summer of 1911 was in a warmer spot compared to other Barstow station sites prior to 1930.
Let’s average all of the maximums for the first 18 days of July, 1911, and compare these to the average daily maximum for July:
Greenland Ranch 117.8F +1.8
Lone Pine 93.9F -0.1
Independence 93.7F -0.3
Columbia 91.4F +1.4
Tonopah 86.8F +1.0
Barstow 104.3F +3.3
The departures range from about 0 to +3 degrees, which is a typical range of departures! For this timeframe, the maximums at each of the stations generally support the maximums at each of the other stations. This is generally ALWAYS the case during periods of fair and mostly sunny weather in summer in the Death Valley and Mojave Desert regions. The plot of “average maximum versus elevation” for July 5-17 (above) depicts a relatively good correlation. Maximums in the region decrease at a rate near 4.5 degrees F/1000 feet. The Owens Valley stations (Independence and Lone Pine), plot nearly six degrees onto the “cool side” of this slope through Greenland Ranch. It is likely that Owens Valley was much less of a desert basin back in 1911 (prior to the water diversions, as discussed earlier) compared to today, and that the moister environment significantly moderated summertime maximum temperatures.
August 1911
August 16 to August 21 hot spell
1911 Aug Great Basin CD 1911 Aug CA CD 1911 Aug Colo Riv Vly CD
1911 Aug Barstow 1911 Aug Independence 1911 Aug Lone Pine
1911 Aug Jean Greenland Ranch 1911 Aug
The summer of 1911 cooked up one more decent heat wave in mid-August. Greenland Ranch had four consecutive maximums ranging from 120F to 122F from the 17th to the 20th. Below are the maximums for each station for this event and the departure from the average daily maximum for July:
Greenland Ranch 122F, +6
Lone Pine 99F, +5
Independence 100F, +6
Columbia 97F, +7
Tonopah 92F, +6
Barstow 112F, +11
Again, note the consistency of the departures from average for the maximum temperature for this heat event. The temperature/elevation charts above are quite similar to those for the July 1911 heat event.
Interestingly, the maximum temperatures reached during this August event were within a degree of those reached a month earlier in mid-July at each station, except at Independence, which was four degrees higher with a 100F. Perhaps the Owens Valley, or Independence area, or the general vicinity of the Independence weather station, dried out significantly from July to August, promoting hotter maximums at Independence. Generally speaking, the region’s desert basins are always in “drought” mode (the ground is very parched) by late May, so that the region is “primed” for high maximums throughout the summer (at least before any significant monsoon moisture occurs). In most regions of the United States, exceptionally hot temperatures would not be possible except during drought conditions when soils are unusually dry. The Death Valley region and the Mojave Desert region do not have to wait for region-wide drought conditions in order to be vulnerable to near-record extreme maximum temperatures. Very little precipitation occurs here from April through July, and the hot and dry conditions quickly and effectively sap moisture from the ground.
September 1, 1911
The first day of September, 1911, was exceptionally warm for so late in the summer. Here are the maximums for 9/1/1911 and the departure from the average daily high for July:
Greenland Ranch 118F, +2
Lone Pine 94 0
Independence 96F, +2
Columbia 93F, +3
Tonopah 84F, -2
Barstow 107F, +6
These departures are loosely clustered around +2 degrees. The maximum of 118F at Greenland Ranch is well-supported by the maximums at the surrounding stations.
In each heat event during the summer of 1911, the maximums in the Death Valley region, from the Owens Valley to Tonopah and Columbia, to Barstow and Greenland Ranch; the maximums behave in a fairly predictable manner. The maximums at each station support the maximums at the other stations.
April 7, 1912/Warm spring day
We will continue into 1912 and look closely again at the hottest periods in the Death Valley region. Perhaps we will be able to detect a moment when maximums at Greenland Ranch begin to look a little “off” as we near July, 1913, when the record 130F-plus temperature reports were made.
By April, the sun is high and mixing on the warmest, sunny afternoons is excellent. The behavior of the maximum temperatures in the region is generally a little less predictable and consistent for the April warm events as compared to the summer warm events, but a warm or hot maximum temperature in Death Valley should still be well-supported.
Thomas Osborn continued as the Greenland Ranch observer into April, 1912. The warmest maximum here for this month was 98F on the 7th. Some of the surrounding stations had their warmest day during other parts of the month. The warm spell of April 6-8 produced the following maximums:
Greenland Ranch 98F
Lone Pine 66F
Independence 74F
Columbia 66F
Tonopah 62F
Barstow 90F
The maximum of 98F at Greenland Ranch is generally well-supported by the maximums at each of the surrounding stations, except at Lone Pine. The maximum of only 66F at Lone Pine (on the 6th and 7th) is a full 32 degrees lower than the maximum at Greenland Ranch. Given an elevation difference of nearly 4000 feet between the two places, the difference in maximum temperature on the typical “warmest day of the month” in spring should be roughly from 18 to 22 degrees F. Since Lone Pine is in a moister area, the difference would be a little larger, perhaps increasing to as much as 20 to 25 degrees. The differences in maximums between Greenland Ranch and Lone Pine for the heat events during the warm season in 1911 were close to 24 degrees F. So, the difference for this event around April 7 appears abnormally large. Perhaps the maximum of only 66F at Lone Pine is not authentic, especially since nearby Independence had 74F on the 6th and 70F on the 7th. A closer look at the Lone Pine maximums for the first part of April, 1912, casts additional doubt onto its record. We will veer off course slightly here to compare the maximums at Lone Pine and Independence for one very big reason: it is important to demonstrate that there are plenty of unreliable data and unreliable climate stations in the climate record! (Labelling some stations which report occasionally suspect data as “unreliable” may be a little strong or unfair, but it is good to know just how reliable, or unreliable, each station is.)
Independence and Lone Pine are only 16 miles from each other in the Owens Valley. Both towns are near the bottom of the basin, along the Owens River. The climate for the two places is essentially the same. Back in 1912, Lone Pine was just northwest of a large lake (Owens Lake), so maximum temperatures could (conceivably) have been moderated by the lake on warm days. But Lone Pine, about 200 feet lower in elevation, had long-term average maximums which were slightly warmer than Independence during the warmer months. This suggests that nearby Owens Lake was not a significant “player” with regard to maximum temperatures in Lone Pine. Maximums on the warmest days during the warm half of the year should be very similar at both towns.
Maximums at Lone Pine for the first seven days of April, 1912, were reported as:
69, 69, 67, 65, 65, 66, 66
and for the same seven days at Independence:
70, 70, 66, 62, 64, 74, 70
The relatively narrow range of maximums at Lone Pine compared to the 12-degree range (from 62F to 74F) at Independence raises a red flag of caution.
Maximums at Lone Pine from April 8 to 14:
64, 65, 66, 64, 59, 56, 60
and for Independence from April 8 to 14:
66, 52, 51, 48, 54, 56, 54
A significant cooling took place in Owens Valley (according to the Independence record) from April 9th to the 12th, with maximums from 48F to 54F. Maximums at Greenland Ranch were 76F and 77F on the 10th and 11th, down a full 20 degrees from the 98F maximum on the 7th. The reported maximums at Lone Pine remained in the mid-60s from the 9th to the 11th, practically the same as its high temperature on April 7! Undoubtedly, the Lone Pine temperature record for at least part of the first two weeks of April, 1912, is flawed; it is not trustworthy. Why is this the case? Did the observer (Gustave Marsh) guess or estimate the maximums (and perhaps also the minimums) on a number of days? Was Marsh out of town, and was a substitute observer making the daily observations? My best guess is that Marsh was absent for a couple of weeks, and that the daily observations were not taken. Marsh “filled in the blanks” with his best estimates upon his return to Lone Pine. In fact, a look at the previous month at Lone Pine
shows those same mid-to-upper 60s maximums persisting from March 18 to the end of the month. This strongly suggests that Marsh was not available to take the daily observations during most of the last half of March. Though the prevailing wind, and the character of the day, and the daily rainfall amounts are provided, the beginning and ending times of the precipitation are not provided for the rain event of March 26/27. These times WERE provided for rain events earlier this March, when the temperature data appear more realistic. The maximum and minimum temperature record at Lone Pine is very questionable from mid-March to mid-April in 1912.
Mid-May, 1912 hot spell
Thomas Osborn continued as observer at Greenland Ranch into May of 1912. Summer-like weather occurred in the Death Valley region mid-month. Maximums at Greenland Ranch from May 14-20 were:
98F, 104F, 105F, 107F, 104F, 102F and 98F
Note how the warm spell built quickly, leveled off some, and then diminished somewhat gradually. This type of pattern is very characteristic of heat events in the region, as sluggish upper-level ridges or “upper highs” take up residence over the Desert Southwest. Sometimes springtime heat waves end very abruptly as a cool Pacific trough crashes into California, or a cold low dives south into the Great Basin. Regardless of how they end, the most-impressive heat events are usually marked by at least a couple of days of exceptionally high maximums, as the weather systems that are responsible for the hot weather are generally vast and slow-to-move.
Maximums for the heat event centered on May 17th, 1912, include:
Greenland Ranch 107F
Lone Pine 87F
Independence 85F
Columbia 80F
Tonopah 75F
Barstow 96F
Jean 94F
Mina 84F
Needles 100F
I didn’t make a graph for this heat event, but the correlation between elevation and temperature is excellent. Each maximum is supported by the maximums at the other stations in the region. Note the differences in the maximums. The difference between the Greenland Ranch maximum and the Owens Valley maximums is about 20 degrees, which is right on target for stations that differ by about 4000 feet in elevation. Columbia is nearly 6000 feet higher than Greenland Ranch, and was 27 degrees cooler. Tonopah is nearly 6300 feet higher and 32 degrees cooler, again right about the difference to expect on warm afternoons with excellent mixing. Barstow is about 2300 feet higher than Greenland Ranch and is 11 degrees cooler, very close to the normal difference expected.
Though the maximum at Lone Pine for the mid-May heat event appears trustworthy, the temperature record for the station appears problematic once more. The significant cool-down in the region around the 21st is not reflected in the Lone Pine daily temperatures. The Lone Pine temperature record can NOT be trusted!
May and June 1912
May 27 to June 7 hot spell
1912 May Great Basin CD 1912 May CA CD 1912 May Colo Riv Vly CD
Greenland Ranch 1912 May 1912 May Barstow 1912 May Independence
1912 May Lone Pine 1912 May Columbia 1912 May Jean
1912 May Las Vegas 1912 May Needles
1912 Jun Great Basin CD 1912 Jun CA CD 1912 Jun Colo Riv Vly CD
Greenland Ranch 1912 Jun 1912 Jun Barstow 1912 Jun Independence
1912 Jun Lone Pine 1912 Jun Columbia 1912 Jun Jean
1912 Jun Oasis Ranch 1912 Jun Needles
A rather impressive heat event developed over the Death Valley region in early June of 1912. And, if the Greenland Ranch record is to be believed, a remarkably hot day occurred about a week prior, on May 29. Check the daily trend of maximums for the regional stations in the chart above. Greenland Ranch jumped up ten degrees from the 28th to the 29th, from 110F to 120F, and then dropped back down to a maximum of 110F on the 30th. Strangely, none of the other stations show such a drastic spike in maximum temperature for May 29th. Let’s look closely at this unusual one-day “heat wave!”
As mentioned, the greatest heat waves in the region tend to be of 2 or 3 days in length, at least, as the large upper-level systems that are responsible for very hot weather are large and rather slow-to-move. A ten-degree increase in maximum temperature to near-record levels (for this time of the year) is very unusual. Given that the surrounding stations do not show such a spike, the Greenland Ranch maximum of 120F on May 29, 1912, appears very questionable. For all Greenland Ranch Mays from 1912 to 1960, the hottest maximums were 120F, in both 1912 and 1913! The Death Valley station (1961-present) did not reach 120F in May until the year 2000.
Maximums on May 29th, 1912, with departure from average daily maximum for July:
Greenland Ranch 120F (+4)
Lone Pine 94F (0)
Independence 92F (-2)
Columbia 85F (-5)
Tonopah 79F (80F on the 28th) (-7)
Barstow 96F (98F on the 28th) (-5)
Jean 99F (-1)
Mina 83F (87F on the 28th) (-13)
Bagdad 106F (0)
Needles 105F (-1)
The surrounding stations provide little support at best for the 120F maximum at Greenland Ranch on May 29th. The maximums at Independence and Lone Pine are close to their average daily maximum for July, while Greenland Ranch is four degrees above average. The difference in maximum between Greenland Ranch and Independence of 28 degrees is several degrees greater than what might be expected: this large spread suggests that there might be some problematic data. The differences of 35 degrees from Columbia and 41 degrees from Tonopah’s maximum are much greater than the lower troposphere typically permits. The 20-plus-degree difference from the maximum at Barstow is much greater than the 11-degree difference observed in the mid-May heat event.
Lending some very weak support to the 120F at Greenland Ranch is Jean, NV, where the maximum jumped up six degrees from the 28th to the 29th, from 93F to 99F. Jean is about 3000 feet higher than Greenland Ranch, and is typically about 12-16 degrees cooler.
The 5 p.m. “set max” temperature is provided on the Greenland Ranch form for May, 1912. This screenshot shows the last week of daily temperatures, with the “set max” temperatures after the maximum and minimum:
The temperature at 5 p.m. PST in late May at Furnace Creek is typically about 4 to 6 degrees (F) lower than the maximum temperature attained during the afternoon (which occurs around 2:30 to 3:30 PST). It is quite possible that the maximum thermometer was reset an hour or two (or more!) before or after 5 p.m., of course, but we don’t know the exact time of the observation each day. The “set max” temperatures above are about 5-12 degrees lower than the maximum for the day, which suggests that the observer might have frequently been taking the observation later than 5 p.m. The one exception is May 29, where the “set max” temperature of 102F is a full 18 degrees lower than the day’s maximum of 120F. If the temperature was indeed 102F at or around 5 p.m., on a breezy and clear-to-partly cloudy and fair-weather afternoon such as this one, then it is very unlikely that the maximum temperature for the day was as warm as 120F at Greenland Ranch.
The heat event during the first week of June, 1912, was much more conventional, as the daily maximums at Greenland Ranch gradually increased from 107F on May 31st to 120F on June 5th. The highest maximums for the event were mostly on the 3rd and 4th at the closest surrounding stations. Since the Greenland Ranch time of observation (5 p.m.) is somewhat close to the hottest time of the afternoon, it is possible that the 120F for June 5th actually occurred on the previous afternoon. Unfortunately, the Greenland Ranch observer did not provide the “set max” temperatures in June, 1912.
And, speaking of observers, the Greenland Ranch observer appears to have changed this month. The form is signed “Thos Osborn,” but the signature is much different than the “Thos Osborn” signatures on the forms for April and May. The initials “FHC” are on the form, so I think that Fred Corkhill filled out the form for Osborn and signed Osborn’s name. May, 1912, appears to be the last month with Osborn as observer, as “Wm Meston” signed the forms for July and August. It may be the case that Osborn decided that he would not be able to tolerate the heat at Greenland Ranch for a second summer. It may be that he quit as caretaker and observer around the hot period at the end of May and the beginning of June, 1912, and it is possible that someone other than Osborn took the dubious weather observation on May 29, 1912.
Finally, let’s compare the maximums at each station for the heat events of mid-May, late May (May 29), and the first week of June:
Greenland Ranch 107F, 120F, 120F
Lone Pine 87F, 94F, 98F
Independence 85F, 92F, 97F
Columbia 80F, 85F, 94F
Tonopah 75F, 80F, 89F
Barstow 96F, 96F, 110F
Jean 94F, 99F, 104F
Mina 84F, 83F, 98F
Needles 100F, 108F, 110F
Bagdad na 106F, 113F
The maximums for the heat event around June 3-5, 1912, are very well correlated to station elevations, and the 120F maximum at Greenland Ranch is well-supported by ALL of the maximums at the surrounding stations.
A comparison of maximums for the June 3-5 event versus the (possible) one around May 29th shows that the early June event was 9 degrees warmer at Columbia and Tonopah, and 4-5 degrees warmer at Lone Pine and Independence and Jean. Of course, Greenland Ranch had 120F for both. The one-day “spike” in temperature at Greenland Ranch on May 29, 1912, appears to be an outlier, and is likely not authentic. This researcher estimates that the actual maximum at Greenland Ranch on May 29, 1912, was about 114F. Perhaps a replacement or second caretaker and observer, working while Osborn was away for a while, recorded the higher value of 120F based on readings from another thermometer (or two) at the ranch. It is also possible that an observer recorded the wrong maximum, perhaps recording “120” instead of “110” or “112.” It appears that all of the temperature entries on the May climate form were written by Osborn.
July 1912
July 7 to July 16 hot spell
1912 Jul Great Basin CD 1912 Jul CA CD 1912 Jul Colo Riv Vly CD
1912 Jul Barstow 1912 Jul Independence 1912 Jul Lone Pine
1912 Jul Columbia 1912 Jul Jean 1912 Jul Oasis Ranch
Note: The maximum temperature record for Lone Pine appears to be unreliable this month, and a couple of Barstow maximums are questionable.
July, 1912, was decidedly cool in the region. The highest temperature at Greenland Ranch was only 118F. The only other July here which failed to reach 120F was in 1946, with 118F. (The July with the coolest monthly maximum at Death Valley, 1961-2019, was 1962, with 117F.) The maximum temperatures for the month in the region correlate reasonably well with each other.
There was a significant cool July day during the first week. On July 3, regional maximums were 20-28 degrees lower than average for July, and Greenland Ranch had a maximum of only 96F. Columbia and Oasis Ranch were cloudy with a wind out of the northwest and highs of 65F. Oasis Ranch had 0.07″ of rain in the morning.
August 1912
August 4 to August 10 hot spell
1912 Aug Great Basin CD 1912 Aug CA CD 1912 Aug Colo Riv Vly CD
Greenland Ranch 1912 Aug 1912 Aug Barstow 1912 Aug Independence
1912 Aug Lone Pine 1912 Aug Columbia 1912 Aug Jean
1912 Aug Lida 1912 Aug Oasis Ranch
The highest temperature at Greenland Ranch in 1912 was only 120F. It was recorded in May, June and August (and the May report is probably not authentic). The Greenland Ranch daily maximums for the two warm spells in this August correlate well with those at the two USWB stations in the region: Independence and Tonopah. The maximums and departures (from ave max temp for Aug) for the two warm spells, around the 8th and the 25th:
Greenland Ranch 120/+6 117/+3
Independence 100/+9 96/+5
Tonopah 89/+6 86/+3
The departures are fairly similar. The maximums at each station for each warm spell support the maximums at the other two stations.
The Greenland Ranch thermometer shelter was above and/or very near the cooling influence of the alfalfa field in 1911 and 1912. The proximity to the irrigated farmland likely held maximums down a couple of degrees or so on summer days. It is interesting to note that on July 10, 1913, when Greenland Ranch reported the 134F maximum, Tonopah had a maximum of 89F, the same as it did on August 8, 1912 (when Greenland Ranch had 120F).
May 1913
May 21 to May 28 hot spell
1913 May Great Basin CD 1913 May CA CD 1913 May Colo Riv Vly CD
Greenland Ranch 1913 May 1913 May Barstow 1913 May Independence
1913 May Lone Pine 1913 May Columbia 1913 May Jean
1913 May Las Vegas 1913 May Lida 1913 May Oasis Ranch
A handful of maximum temperatures at Greenland Ranch appear to be anomalously warm during the warmest parts of March and April of 1913. Additional suspicious maximums continued into the summer.
By the spring of 1913, Oscar Denton was the observer at Greenland Ranch. As occurred in the previous May, a maximum of 120F was recorded during the last week at Greenland Ranch which appears suspect. Let’s look at area maximums from May 23-25:
Gr. Ranch 114/113/120
Independence 89/89/89
Tonopah 81/81/81
Las Vegas 99/98/97
Columbia 86/86/86
Oasis Ranch 90/92/91
Barstow 96/98/96
Lone Pine 88/87/90
The regional stations around Death Valley show similar maximums for all three days, but Greenland Ranch has the unsupported 7-degree jump from the 24th to the 25th. (The Lone Pine data for the last week of May, 1913, are a bit suspicious, but the increase from 87F to 90F from the 24th to the 25th may be valid.) Why did Greenland Ranch have a significant increase while the other stations stayed about the same? And there is that maximum temperature ending in a “0,” which often is associated with untrustworthy data during the Denton years. The 120F maximum at Greenland Ranch on May 25, 1913 is not to be trusted and is probably five degrees or more too high.
And while we are here in May of 1913, lets look at another suspect high temperature at Greenland Ranch. Here are the daily maximums from May 1 to May 5, 1913:
Gr. Ranch 82/90/90/110/104
Independence 59/65/73/76/80
Tonopah 46/50/61/69/74
Las Vegas 66/71/77/87/90
Columbia 51/51/65/72/78
Oasis Ranch 78/77/78/82/84 (very dubious)
Barstow 62/70/76/80/84
Lone Pine 60/68/70/78/82
The maximums at Oasis Ranch do not reflect the cool weather around May 1st. None of these maximums at Oasis Ranch can be trusted. A station at Jean, Nevada, not too far south of Las Vegas, showed all maximums from the 1st to the 5th ranging from 90F to 92F. Jean is higher in elevation than Las Vegas, and there is no way that the maximum there was near 90F on a day when both Las Vegas and Barstow were only in the 60s. I need to emphasize this now: temperature data are occasionally unreliable from many of the cooperative stations in the region, at least during the first decade or two of the 1900s. The USWB station data (Independence and Tonopah) are generally very trustworthy and very reliable. But careful temperature comparisons show sporadic periods of doubtful temperatures at some, or even most, cooperative stations. My best educated guess is that observers simply “filled in the blanks” for periods when daily observations were missed. The observers estimated the daily temperatures based on the maximum and minimum readings on the thermometers upon their return. Sometimes the estimates were not too bad, and it is not possible to know that the data were estimated. Sometimes the temperatures are so far from what the surrounding stations were showing that it is obvious that something is going on that should not have. It seems that the observers figured that estimated daily temperatures were much better than blank spaces on the monthly form.
Anyway, back to the first five days this May. The first thing to notice is that there are three consecutive days at Greenland Ranch with maximums ending in a “0.” This is a BIG RED FLAG. Denton often plugged in values ending in “0” and “5” when “estimating” or “artificially enhancing” the temperature entries. I think we can assume that Denton was not taking the observations, or at least not taking the observations correctly, on each of the first five days this month. It is highly unusual, if not unprecedented, to have a jump in maximum temperature of 20 degrees during the warm season, as occurred from the 3rd to the 4th. Other stations showed temperature rises of 3 to 10 degrees form the 3rd to the 4th. The maximum of 110F at Greenland Ranch on May 4th is at least 10 degrees warmer than that which would be supported by the closest surrounding stations.
June 1913
June 18 to June 25 hot spell
1913 Jun Great Basin CD 1913 Jun CA CD 1913 Jun Colo Riv Vly CD
Greenland Ranch 1913 Jun 1913 Jun Barstow 1913 Jun Independence
1913 Jun Lone Pine 1913 Jun Columbia 1913 Jun Jean
1913 Jun Las Vegas 1913 Jun Lida 1913 Jun Oasis Ranch
As July 1913 (and its record reports) drew near, more and more maximums at Greenland Ranch creeped upwards with regard to regional maximums. See the chart of departures from average for June, 1913. First off, Lone Pine maximums seem to wander off a bit (what is going on there on June 3, 4 and 27?). Its departures should mimic those of nearby Independence much more closely. I figure that observer Marsh was not at home to take the observations for a good number of days this month at Lone Pine.
Let’s take a look at Greenland Ranch maximums for the hottest periods of June, 1913, and compare to the other USWB stations. These are the maximums for June 4, 7, 14, 19, 22, 24, 26 and 30:
Gr. Ranch 110/110/115/116/119/118/117/114
Independence 79/81/89/86/90/88/76/92
Tonopah 74/72/79/78/80/74/62/82
and these are the departures from average (GR 110/Indy 88/Tono 78) for these eight dates in June, 1913:
Gr. Ranch 0/0/+5/+6/+9/+8/+7/+4
Independence -9/-7/-1/-2/+2/0/-12/+4
Tonopah -4/-6/+1/0/+2/-4/-16/+4
On the dates (June 4 and 7) when Tonopah and Independence were about 4 to 9 degrees below average, Greenland Ranch was 110F, its average for June. On the dates when Independence and Tonopah were within a few degrees of average (June 14, 19, 22, and 24), Greenland Ranch was 5 to 8 degrees above average. Something very strange occurred on June 26, with Greenland Ranch more than 40 degrees warmer than Independence and 55(!) degrees warmer than Tonopah. And, no, the 117F at Greenland Ranch on June 26th was not due to a previous-day temperature at observation time. (The maximum on the 25th was 109F.) A good warmup occurred on the last couple of days of the month, and Greenland Ranch, Independence, and Tonopah were all four degrees above the average (for June) on the 30th. For June 4, 7, 14, 19, 22 and 24, maximums at Greenland Ranch were generally 4 to 8 degrees warmer than the departures at Independence and Tonopah would support.
The June maximum of 119F on June 22 is not well-supported by the maximums at the surrounding stations (see graph of maximums above). The other station plots (except for Jean) lie a good 4 to 7 degrees to the left of the line through Greenland Ranch. (The slope of the line through Greenland Ranch is 4.5 degrees F/1000 feet, which is the average decrease in maximum temperatures with elevation for the region in summer.) A quick look at the maximums for Jean, Nevada, shows an extremely dubious and peculiar record, with a gently upward sloping trend during most of the month. None of the Jean temperatures can be trusted on its form for June 1913.
The maximum temperature record at Greenland Ranch in June 1913 is suspect. During the summers of 1911 and 1912, the departures of the maximum temperatures at Greenland Ranch closely followed, or mimicked, those at Independence and Tonopah, and the other surrounding stations which were providing reliable temperatures. However, for a good number of days in the spring of 1913, and for many days in June, 1913, Greenland Ranch maximums are a good 4, 6, and even 8 degrees warmer than would be expected when comparing departures on typical warm summer days. Of course, this trend of warmer-than-expected (or warmer-than-possible) maximums culminated with the 127F to 134F maximums during the first half of the following month. What is the explanation? Well, we will never know for certain. I will provide my thoughts in the next section, for July, 1913.
July 1913
July 5 to July 15 heat wave
1913 Jul Great Basin CD 1913 Jul CA CD 1913 Jul Colo Riv Vly CD
Greenland Ranch 1913 Jul 1913 Jul Barstow 1913 Jul Independence
1913 Jul Mammoth Tank 1913 Jul Lone Pine 1913 Jul Columbia
1913 Jul Jean 1913 Jul Las Vegas 1913 Jul Lida 1913 Jul Oasis Ranch
New forms below: some daily data and hourly data, from the two USWB offices in the region!
The table above provides the daily conditions at regional stations for July 1-15, 1913. Included are the daily max/min temps, the departure of the maximum temperature from the long-term average, the sky condition, and the prevailing wind. For Independence and Tonopah, the wind observation at 5 p.m. PST is given.
The table above provides additional weather data for Independence and Tonopah at 5 a.m. and 5 p.m. PST for July 1-15, 1913. Wind speeds are in mph. Barometric pressure values are reduced to sea level. Independence is at 3957 feet, and Tonopah is at 6090 feet elevation.
The table above provides an indication as to which direction the wind was from aloft, based on the movement of clouds. Empty spaces means that there were no clouds.
July, 1913, is the month when Greenland Ranch showed a maximum temperature of 134F. This occurred on July 10th. Two other maximums of 130F and 131F were recorded, as were two 129s, a 128F and two 127s. These all occurred from July 7th to July 14th, and it is the most remarkable period of hot maximum temperatures on record for any station in the United States and the world. The maximum-temperature entries by Oscar Denton, the observer at Greenland Ranch, are not supported by the maximums at the surrounding stations, however (see the two temperature versus elevation graphs above!). The temperature reports of 127F and higher are almost certainly not authentic.
Let’s review the long Greenland Ranch record briefly. The annual maximums in 1911 and 1912 were 122F and 120F, respectively. In 1913, many maximums from March to June were some 4-to-8 degrees too warm when compared to surrounding stations. July, 1913, has a maximum of 134F, which is nearly 10 degrees warmer than that which would be supported by surrounding stations. Annual maximums from 1914 to 1960 at Greenland Ranch ranged from 121F to 127F. (The 129F in July, 1960, is not supported by the record at Cow Creek, and is probably 124F.) How does Greenland Ranch have three days of 130F-plus in July of 1913 and never reach 130F during the next 47 years? The annual maximums at Death Valley (1961 to 2018) range from 119F to 129F. Only three days in the 100-plus years of official temperature measurement at Furnace Creek-area stations have (purportedly) reached 130F, and they were all during the same week of July, 1913. But, again, the closest surrounding stations do not support such hot readings in Death Valley in July, 1913. Let’s see how the numbers compare.
A quick look at the temperature/elevation graphs above shows that the Greenland Ranch temperatures are not supported by any of the surrounding stations. The sloping line drawn through Greenland Ranch (which represents the average change in maximum temperature with elevation in July) is well to the right of the other station plots. It is about ten degrees warmer than the plots for the average daily maximum for the period from July 5 to 14. It is about a dozen degrees warmer than the other plots for extreme maximum for the month. Compare these two charts with those from the Julys of 1911 and 1912. In these months, the sloping line through Greenland Ranch runs much more closely to the other station plots. The same can be said for ALL of the other very hot summer events in the Greenland Ranch and Death Valley records! And for your convenience, here are the plots for the Julys of 1911, 1912 and 1913. Plotted are the regional maximum temperatures (for the hottest period in each of the months) versus the station elevation.
Let’s look at the daily trend line of the departures of the maximum temperature from average (provided above in this section). And, as has been the case during previous months, the record at Lone Pine appears slightly “off” for a handful of days (when compared with the nearby USWB station at Independence). It might be a good idea to discard the Lone Pine record — it is a tough call! On July 1st, most stations, including Greenland Ranch, are very close to average. But thereafter (ignoring Lone Pine), Greenland Ranch jumps up comparably, and is consistently about 5 to 9 degrees warmer on departures than the others for the first half of the month. There is a significant cool-down during the second half of July, 1913, and the departures at Greenland Ranch are once again quite close to those at the other surrounding stations.
From July 5th to 8th, the closest surrounding long-term stations (Independence, Tonopah, Columbia, Las Vegas and Barstow) reported maximums which were 3 to 7 degrees above their averages for July. For the same dates, Greenland Ranch reported maximums of 126, 125, 127 and 128F. These values are 9-to-12 degrees warmer than the long-term July average maximum of 116F at Greenland Ranch. Skies were clear to partly cloudy in the region from July 5 to 8, and Columbia (a mile north of Goldfield) had a trace of rain on both the 6th and 8th. Lone Pine had thunder on the 6th, and Independence had 0.06″ on the 6th. Oasis Ranch (about 90 miles northwest of Furnace Creek on the NV/CA state line at 5106 feet) had its high temperature for the month (of 98F) on July 5th. A trace of rain was recorded on the 7th at Oasis Ranch. (One interesting note for Oasis Ranch: it was thought that the ranch was in Nevada originally, but it was later found to be on the California side of the border.) Tonopah reached 92F on the 6th, which was its maximum for the month (tied on July 12). Similarly, Columbia hit its high for the month (of 97F) on the 6th, and 97F was also observed on the 12th. Lida noted a “severe electric storm” on July 6, with just a trace hitting the rain gage.
On July 9th, the reported maximum at Greenland Ranch edged up one degree to 129F, 13 degrees above average. The minimum temperature on the 9th was a very warm 93F. This was the warmest July minimum at Greenland Ranch up to this point in its brief record. Maximums at Lone Pine, Independence and Las Vegas also changed little from the 8th to the 9th. Barstow came up three degrees to 108F, while Tonopah and Columbia decreased by two and four degrees, respectively. Tonopah had 0.02″ on the 8th and Columbia had 0.11″ on the 9th. The Columbia climate form notes that this rain was at night, so it probably fell late on the 8th or early on the 9th. Here are the departures of the maximums for July 9:
Gr. Ranch 129/+13
Independence 98/+4
Tonopah 89/+4
Columbia 92/+2 NW
Las Vegas 109/+5 SE
Barstow 108/+7 W
Oasis Ranch 96 SW
Lone Pine 99 S
Clearly, the maximums at these surrounding stations fail to support the +13 departure on July 9th at Greenland Ranch. Skies were clear to mostly clear in the region on the 9th. Some of the cooperative stations provide the prevailing wind direction for the day, as shown. At Columbia, the northwest winds on the 9th followed up the south and east winds on the 7th and 8th, respectively, suggesting a switch to a drier airmass (there was no precipitation in the region from the 9th to the 16th). Perhaps a weak front or surface trough skirted through the region, or at least through western Nevada, around the night of July 8th. This “system” swept the moisture out (which was responsible for some storms and rainfall from the 6th to the 8th) and may have caused the slight drop in maximums at Tonopah and Columbia on the 9th.
July 10
Greenland Ranch reported a high of 134F and a low of 85F on July 10, 1913. This maximum currently stands as the highest accepted temperature observation for the world. The daily range of 49 degrees is exceptionally large for summer at a Furnace Creek station. Here are the maximums and departures on the 10th:
Gr. Ranch 134/+18
Independence 103/+9
Tonopah 89/+4
Columbia 94/+4 NW
Las Vegas 112/+8 S
Barstow 108/+7 W
Oasis Ranch 95 SW
Lone Pine 102 S
There were some significant temperature jumps from the 9th to the 10th. Independence and Greenland Ranch both came up 5 degrees. Las Vegas and Lone Pine came up three degrees and Columbia two, but Tonopah and Barstow had no change. Though Greenland Ranch was a full 18 degrees above its long-term average for July, none of the surrounding stations were more than 9 degrees above average. The 103F maximum at the USWB station in Independence was the hottest since a 105F reading in July, 1898. There were a few more years (later) with 103F at Independence before it hit 106F in 1925 (Greenland Ranch was 124F on July 13, 1925, when Independence was 106F). The 112F maximum at Las Vegas, at “Pop” Squires new cooperative station, was not exceeded until the late 1920s. The intense heat waves of the early 1930s resulted in maximums of 127F at Greenland Ranch, 118F at Las Vegas, 98F at Tonopah, and 109F at Independence. Why would the much more impressive heat waves of 1931 and 1933 cause much hotter temperatures at Las Vegas, Tonopah and Independence as compared to July 1913, while Greenland Ranch comes nowhere near the 134F it attained in 1913?
Fred Corkill, in a letter to his superiors at Pacific Coast Borax Company (PCBC, in Oakland) and which he also sent to Willson of the USWB (in San Francisco),
refers to the record-setting day of July 10, 1913. This letter was written two years afterwards. (Corkill was superintendent of Greenland Ranch, and the boss of caretaker and observer Oscar Denton. Cornell’s duties for PCBC kept him primarily at Death Valley Junction and Ryan, east of Death Valley.) Corkill states that he was at Greenland Ranch on the day after the 134-day, when it was 129F. He says that he does not doubt the reading. And he says that the wind was blowing hard from the south or the north, as described by the chauffeur of a man who perished due to the heat on the 10th (north of the ranch). In Willson’s article in MWR in 1915, it is noted that the July 1913 climate form for Greenland Ranch arrived with a note attached. “The observer stated that he doubted if the record was sufficiently high because other ordinary thermometers at the ranch showed a much higher temperature.”
The main takeaways from this information, and I apologize for repeating the same information, but these are all important! Denton was comparing the readings in the official shelter with the readings from more than one thermometer at the ranch. The unofficial thermometers “at the ranch” apparently showed temperatures in the upper 130s or higher. Corkill, a schooled and professional mining engineer; a former weather observer for the USWB at Candelaria, Nevada; and the one who installed the Greenland Ranch weather station; BELIEVED that the 134F reading should be trusted. Corkill says that he was at the ranch on July 11, 1913; but he does not say that he personally checked or inspected the thermometer shelter and the thermometers. Corkill also states that Denton was not capable of interpreting the humidity tables after taking the wet and dry bulb thermometer readings.
So, what might have happened on this day, July 10, 1913, to cause such a high maximum temperature report? I think we can assume that the strong wind was out of the south, as that is the normal direction on hot summer afternoons. Typically, on the hottest days in mid-summer, the wind at Furnace Creek is not strong. On the hottest days with no local convective storms in the region, the wind in the morning is generally light. By around noon and into the early afternoon it is out of the south around 5-10 mph, and during the peak mixing of the mid and late afternoon speeds of 10-20 mph would not be unusual, though somewhat slower speeds are probably the norm at the ranch on the very hottest days. The generally lighter wind speeds on the hottest afternoons allow the hot near-surface air to linger and build at shelter level. On very windy afternoons, the increased mixing does not allow hot air to build and linger near the surface. One would expect the very hottest temperatures on record at desert stations to be on sunny afternoons with relatively light winds, and not during conditions of “terrific winds” as described by the chauffeur. Of course, the high temperature for July 10, 1913 could have occurred during the typical mid-to-late afternoon timeframe with light winds, and the “terrific wind” could have developed shortly thereafter. It is not unusual to have a pronounced increase in wind speed towards the late afternoon and evening hours on the hottest days of the summer in the Death Valley region and the Mojave Desert. The report of the strong wind on July 10, 1913, by Corkill does not help to validate the 134F temperature.
Court (How Hot Is Death Valley) postulated that hot sand might have blown into the shelter and affected the readings, but nothing like this has ever been documented. Court postulated that the shelter might have been “blackened” due to the white paint peeling off, which might cause readings which were too high. Again, there is no documentation that this might have been the case, and the pictures of the shelter in its first two decades of operation show no problems with regard to this. Court also postulates that there could have been a “short-lived” bubble in the maximum thermometer, causing the ultra-high reading. There is nothing to support this possibility, though.
It is this writer’s belief that the observer was tinkering inappropriately with the official instrumentation, and/or was relying more on the temperatures that he was seeing on the other thermometers at other locales at the ranch, for the official maximum temperature entries during this (and other) period(s) of hot weather at the ranch. The early photographs of the station show that the Greenland Ranch shelter was moved without documentation during its first decade. It is this researcher’s belief that Oscar Denton was not satisfied with the relatively low and conservative maximum temperature reports from the official USWB instrumentation, and he felt the need to “fix” the perceived problem by moving the shelter to a hotter spot, above bare ground. And, in 1913, he simply relied on other thermometers (or devised some other inappropriate exposure of the official thermometers) and recorded their readings which he felt much better represented actual conditions. Recall that Denton sent in that note saying that he did not think that the maximums that he had entered were high enough! This suggests that he had a keen interest in the reports. Recall that scientific surveys and others with official instrumentation had recorded temperatures of 130F and above in Death Valley prior to 1913, and that previous caretakers at the ranch had routinely observed temperatures well into the 130s on the “ordinary” thermometers at the ranch. It was probably dumbfounding to Denton that the official instrumentation was showing temperatures well short of the 130s during this decent hot spell of July, 1913 (assuming that the standardized instrumentation was still in its proper place). It seems likely that Denton simply “jacked-up” the maximums inappropriately in some fashion during the first half of July 1913. He “cooked the books” so that the official Death Valley maximums were at levels that he thought were more appropriate, more legitimate, more representative, more accurate.
August 1913
August 1 to August 8 hot spell
1913 Aug Great Basin CD 1913 Aug CA CD 1913 Aug Colo Riv Vly CD
Greenland Ranch 1913 Aug 1913 Aug Barstow 1913 Aug Independence
1913 Aug Lone Pine 1913 Aug Columbia 1913 Aug Jean
1913 Aug Las Vegas 1913 Aug Lida 1913 Aug Oasis Ranch
August 1913
August 19 to August 27 heat wave
June and July 1914
June 26 to July 4 heat wave
Greenland Ranch 1914 Jun 1914 Jun Barstow 1914 Jun Independence
1914 Jun Lone Pine 1914 Jun Columbia 1914 Jun Jean
1914 Jun Las Vegas 1914 Jun Pahrump 1914 Jun Lida
1914 Jun Rhyolite 1914 Jun Indian Springs 1914 Jun Oasis Ranch
Greenland Ranch 1914 Jul 1914 Jul Barstow 1914 Jul Independence
1914 Jul Lone Pine 1914 Jul Columbia 1914 Jul Jean
1914 Jul Las Vegas 1914 Jul Lida 1914 Jul Indian Springs
1914 Jul Oasis Ranch 1914 Jul Leeland
August 1914
July 1915
July 14 to July 27 hot spell
1915 Jul Barstow 1915 Jul Lone Pine 1915 Jul Columbia
1915 Jul Jean 1915 Jul Las Vegas 1915 Jul Lida 1915 Jul Rhyolite
1915 Jul Indian Springs 1915 Jul Oasis Ranch Greenland Ranch 1915 Jul
August 1915
August 5 to August 20 hot spell
Greenland Ranch 1915 Aug 1915 Aug Barstow 1915 Aug Lone Pine
1915 Aug Columbia 1915 Aug Jean 1915 Aug Las Vegas
1915 Aug Lida 1915 Aug Rhyolite 1915 Aug Indian Springs
July 1916
July 19 to July 27 heat wave
Greenland Ranch 1916 Jul 1916 Jul Barstow 1916 Jul Lone Pine
1916 Jul Columbia 1916 Jul Las Vegas 1916 Jul Pahrump
1916 Jul Lida 1916 Jul Rhyolite 1916 Jul Indian Springs
July 1917
July 5 to July 25 heat wave
Greenland Ranch 1917 Jul 1917 Jul Barstow 1917 Jul Independence
1917 Jul IndependenceB 1917 Jul Lone Pine 1917 Jul Goldfield
1917 Jul Las Vegas 1917 Jul Oasis Ranch
July 1922
July 2 to July 9 heat wave
1922 Jul Greenland Ranch 1922 Jul Bagdad 1922 Jul Goldfield
1922 Jul Las Vegas 1922 Jul Pahrump 1922 Jul Beatty
1922 Jul Trona 1922 Jul Trona b
July 1922
July 12 to July 20
July 1927
July 9 to July 21 heat wave
1927 July Greenland Ranch 1927 Jul Independence 1927 Jul Haiwee
1927 Jul Tonopah 1927 Jul Goldfield 1927 Jul Las Vegas
1927 Jul Clay City 1927 Jul Beatty 1927 Jul Trona
The tables below summarize much of the above for heat waves during the Greenland Ranch period of record (1911-1960).
Table A —— Below are listed the average maximum temperatures and
the associated “departures from the average daily maximum for July” for stations in the Death Valley region for the hottest summertime periods from 1911 to 1960. The departures are based against averages for the stations’ period of record through 1930, if available. Here are the averages:
Greenland Ranch 116.0/87.6 (20 years, 1911-1930)
Lone Pine, CA 94.1/55.2 (14 years through 1919)
Independence, CA 93.6/62.5 (33 years)
Barstow, CA 101.4/67.2 (11 years through 1920)
Tonopah, NV 85.3/61.0 (22 years)
Columbia/Goldfield 89.8/56.6 (25 years)
Las Vegas, NV 103.6/67.8 (20 years)
Notes:
The average maximum for 1911 to 1930 at Greenland Ranch was reduced (by me) from the value of 116.4°F per the “Climatic Summary of the United States” to 116.0°F, to account for suspect data during the Denton summers.
Columbia, Nevada, was one mile north of Goldfield, and the averages incorporate data from both Columbia and Goldfield.
————
June 10-12, 1911, 3 days
Greenland Ranch/el. -178’ 117.3 +1.3
Barstow, CA/el. 2105’ 104.7 +3.3
Lone Pine, CA/el. 3728’ 94.0 +0.1
Independence, CA/el. 3957’ 94.0 +0.4
Columbia, NV/el. 5750’ 90.3 +0.5
Tonopah, NV/el. 6090’ 85.7 +0.4
July 5-19, 1911, 15 days
Greenland Ranch/el. -178’ 118.3 +2.3
Barstow, CA/el. 2105’ 104.6 +3.2
Lone Pine, CA/el. 3728’ 94.3 +0.2
Independence, CA/el. 3957’ 94.0 +0.4
Columbia, NV/el. 5750’ 92.3 +2.5
Tonopah, NV/el. 6090’ 87.3 +2.0
August 16-21, 1911, 6 days
Greenland Ranch/el. -178’ 119.0 +3.0
Barstow, CA/el. 2105’ 108.7 +7.3
Lone Pine, CA/el. 3728’ 95.2 +1.1
Independence, CA/el. 3957’ 96.7 +3.1
Columbia, NV/el. 5750’ 94.7 +4.9
Tonopah, NV/el. 6090’ 88.5 +3.2
June 2-6, 1912, 5 days
Greenland Ranch/el. -178’ 117.6 +1.6
Barstow, CA/el. 2105’ 105.4 +4.0
Lone Pine, CA/el. 3728’ 96.2 +2.1
Independence, CA/el. 3957’ 95.2 +1.6
Columbia, NV/el. 5750’ 91.6 +1.8
Tonopah, NV/el. 6090’ 87.0 +1.7
July 8-11, 1912, 4 days
Greenland Ranch/el. -178’ 116.0 0.0
Barstow, CA/el. 2105’ 100.5 -0.9
Lone Pine, CA/el. 3728’ 96.3 +2.2
Independence, CA/el. 3957’ 94.3 +0.7
Columbia, NV/el. 5750’ 90.8 +1.0
Tonopah, NV/el. 6090’ 86.3 +1.0
August 4-10, 1912, 7 days
Greenland Ranch/el. -178’ 116.0 0.0
Barstow, CA/el. 2105’ 100.3 -1.1
Lone Pine, CA/el. 3728’ 92.0 -2.1
Independence, CA/el. 3957’ 95.6 +2.0
Columbia, NV/el. 5750’ 93.0 +3.2
Tonopah, NV/el. 6090’ 86.3 +1.0
May 23-26, 1913, 4 days
Greenland Ranch/el. -178’ 114.6 -1.4
Las Vegas, NV/el. 2033’ 97.8 -5.8
Barstow, CA/el. 2105’ 95.2 -6.2
Lone Pine, CA/el. 3728’ 88.0 -6.1
Independence, CA/el. 3957’ 87.8 -5.8
Columbia, NV/el. 5750’ 84.4 -5.4
Tonopah, NV/el. 6090’ 80.6 -4.7
June 18-25, 1913, 8 days
Greenland Ranch/el. -178’ 115.4 -0.6
Las Vegas, NV/el. 2033’ 99.0 -4.6
Barstow, CA/el. 2105’ 94.3 -7.1
Lone Pine, CA/el. 3728’ 91.6 -2.5
Independence, CA/el. 3957’ 87.4 -6.2
Columbia, NV/el. 5750’ 82.4 -7.4
Tonopah, NV/el. 6090’ 76.8 -8.5
July 1-15, 1913, 15 days (average max and average min)
Greenland Ranch/el. -178’ 125.7/83.1 (+9.7/-4.5)
Las Vegas, NV/el. 2033’ 105.9/73.3 (+2.3/+5.5)
Barstow, CA/el. 2105’ 104.5/75.6 (+3.1/+8.4)
Lone Pine, CA/el. 3728’ 98.7/56.6 (+4.6/+1.4)
Independence, CA/el. 3957’ 96.8/65.2 (+3.2/+2.7)
Needles, CA/el. 477’ 107.7/80.0 (+1.1/+4.6)
Columbia, NV/el. 5750’ 92.2/56.7 (+2.4/+0.1)
Tonopah, NV/el. 6090’ 88.2/61.4 (+2.9/+0.4)
Jean, NV/el. 2864’ 105.3/72.5
Oasis Ranch, CA/el. 5106’ 94.9/55.9
Lida, NV/el. 6037’ 85.0/57.4
August 1-8, 1913, 8 days
Greenland Ranch/el. -178’ 117.8 +1.8
Las Vegas, NV/el. 2033’ 101.3 -2.6
Barstow, CA/el. 2105’ 103.1 +1.7
Lone Pine, CA/el. 3728’ 92.8 -1.3
Independence, CA/el. 3957’ 90.4 -3.2
Columbia, NV/el. 5750’ 89.5 -0.3
Tonopah, NV/el. 6090’ 84.0 -1.3
June 26-July 4, 1914, 9 days
Greenland Ranch/el. -178’ 118.2 +2.2
Las Vegas, NV/el. 2033’ 104.2 +0.6
Barstow, CA/el. 2105’ 103.3 +1.9
Lone Pine, CA/el. 3728’ 94.0 +0.1
Independence, CA/el. 3957’ 94.0 +0.4
Columbia, NV/el. 5750’ 91.5 +1.7
Tonopah, NV/el. 6090’ 86.9 +1.6
July 16-26, 1915, 11 days
Greenland Ranch/el. -178’ 116.1 +0.1
Las Vegas, NV/el. 2033’ 100.8 -2.8
Barstow, CA/el. 2105’ 102.6 +1.2
Lone Pine, CA/el. 3728’ 96.0 +1.9
Independence, CA/el. 3957’ 95.2 +1.6
Columbia, NV/el. 5750’ 91.8 +2.0
Tonopah, NV/el. 6090’ 86.6 +1.3
August 8-13, 1915, 6 days
Greenland Ranch/el. -178’ 120.7 +4.7
Las Vegas, NV/el. 2033’ 105.0 +1.4
Barstow, CA/el. 2105’ 101.8 +0.4
Lone Pine, CA/el. 3728’ 94.2 +0.1
Independence, CA/el. 3957’ 94.7 +1.1
Columbia, NV/el. 5750’ 92.7 +2.9
Tonopah, NV/el. 6090’ 86.7 +1.4
July 19-27, 1916, 9 days
Greenland Ranch/el. -178’ 121.9 +5.9
Las Vegas, NV/el. 2033’ 104.0 +0.4
Barstow, CA/el. 2105’ 103.0 +1.6
Lone Pine, CA/el. 3728’ 95.2 +1.1
Independence, CA/el. 3957’ 96.1 +2.5
Columbia, NV/el. 5750’ 93.7 +3.9
Tonopah, NV/el. 6090’ 87.0 +1.7
July 10-15, 1917, 6 days
Greenland Ranch/el. -178’ 122.2 +6.2
Las Vegas, NV/el. 2033’ 107.8 +4.2
Barstow, CA/el. 2105’ 106.0 +4.6
Lone Pine, CA/el. 3728’ 98.7 +4.6
Independence, CA/el. 3957’ 100.8 +7.2
Goldfield, NV/el. 5700’ 100.0 +10.2
Tonopah, NV/el. 6090’ 93.5 +8.2
July 26-30, 1917, 5 days
Greenland Ranch/el. -178’ 122.6 +6.6
Las Vegas, NV/el. 2033’ 92.6 -11.0
Barstow, CA/el. 2105’ 96.8 -4.6
Lone Pine, CA/el. 3728’ 89.0 -5.1
Independence, CA/el. 3957’ 89.4 -4.2
Goldfield, NV/el. 5700’ 85.4 -4.4
Tonopah, NV/el. 6090’ 80.4 -4.9
July 2-9, 1922, 8 days
Greenland Ranch/el. -178’ 121.8 +5.8
Trona/el. 1656’ 110.6 +5.1
Las Vegas, NV/el. 2033’ 105.9 +2.3
Independence, CA/el. 3957’ 99.4 +5.8
Goldfield, NV/el. 5700’ 94.0 +4.2
Tonopah, NV/el. 6090’ 91.4 +6.1
July 12-16, 1922, 5 days
Greenland Ranch/el. -178’ 122.6 +6.6
Trona/el. 1656’ 111.4 +5.9
Las Vegas, NV/el. 2033’ 109.0 +5.4
Independence, CA/el. 3957’ 99.8 +6.2
Goldfield, NV/el. 5700’ 97.2 +7.4
Tonopah, NV/el. 6090’ 93.6 +8.3
July 9-21, 1927, 13 days
Greenland Ranch/el. -178’ 121.5 +5.5
Trona/el. 1656’ 109.2 +4.7
Las Vegas, NV/el. 2033’ 109.2 +5.6
Independence, CA/el. 3957’ 100.5 +6.9
Tonopah, NV/el. 6090’ 90.2 +4.9
July 16-28, 1931, 13 days
Greenland Ranch/el. -178’ 122.3 +6.3
Las Vegas, NV/el. 2033’ 113.3 +9.7
Independence, CA/el. 3957’ 102.1 +8.5
Goldfield, NV/el. 5700’ 96.2 +6.4
Tonopah, NV/el. 6090’ 94.4 +9.1
July 12-16, 1933, 5 days
Greenland Ranch/el. -178’ 124.6 +8.6
Trona/el. 1656’ 113.4 +7.9
Independence, CA/el. 3957’ 102.2 +8.6
Goldfield, NV/el. 5700’ 99.4 +9.6
Tonopah, NV/el. 6090’ 94.0 +8.7
July 24-28, 1933, 5 days
Greenland Ranch/el. -178’ 125.0 +9.0
Trona/el. 1656’ 113.0 +7.5
Las Vegas, NV/el. 2033’ 109.2 +5.6
Independence, CA/el. 3957’ 101.4 +7.8
Goldfield, NV/el. 5700’ 96.8 +7.0
Tonopah, NV/el. 6090’ 93.4 +8.1
August 10-14, 1933, 5 days
Greenland Ranch/el. -178’ 125.0 +9.0
Trona/el. 1656’ 114.8 +9.3
Independence, CA/el. 3957’ 103.6 +9.0
Goldfield, NV/el. 5700’ 100.0 +10.2
Tonopah, NV/el. 6090’ 93.6 +8.3
July 26-29, 1934, 4 days
Greenland Ranch/el. -178’ 121.8 +5.8
Trona/el. 1656’ 112.5 +7.0
Las Vegas, NV/el. 2033’ 111.3 +7.7
Independence, CA/el. 3957’ 104.0 +10.4
Goldfield, NV/el. 5700’ 98.5 +8.7
Tonopah, NV/el. 6090’ 93.8 +6.4
July 14-25, 1936, 12 days
Greenland Ranch/el. -178’ 122.3 +6.3
Cow Creek/el. -152’ 121.8 +5.8
Trona/el. 1656’ 111.2 +5.7
Las Vegas, NV/el. 2033’ 110.3 +5.7
Independence, CA/el. 3957’ 99.8 +6.2
Goldfield, NV/el. 5700’ 96.8 +7.0
Tonopah, NV/el. 6090’ 91.8 +6.5
July 21-26, 1942, 6 days
Greenland Ranch/el. -178’ 122.8 +6.8
Cow Creek/el. -152’ 124.5 +8.5
Trona/el. 1656’ 115.3 +9.8
Las Vegas, NV/el. 2033’ 110.3 +6.7
Independence, CA/el. 3957’ 100.2 +6.6
Goldfield, NV/el. 5700’ 97.5 +7.7
Tonopah, NV/el. 6090’ 95.7 +10.4
July 24-27, 1945, 4 days
Greenland Ranch/el. -178’ 120.8 +4.8
Cow Creek/el. -152’ 121.8 +5.8
Trona/el. 1656’ 115.0 +9.5
Las Vegas, NV/el. 2033’ 110.3 +6.7
Goldfield, NV/el. 5700’ 98.5 +8.7
Tonopah, NV/el. 6090’ 95.8 +10.5
July 14-18, 1949, 5 days
Greenland Ranch/el. -178’ 122.6 +6.6
Cow Creek/el. -152’ 124.2 +8.2
Trona/el. 1656’ 113.2 +7.7
Las Vegas, NV/el. 2033’ 109.0 +5.4
Goldfield, NV/el. 5700’ 95.4 +5.6
Tonopah, NV/el. 6090’ 94.0 +8.7
July 16-20, 1959, 5 days
Greenland Ranch/el. -178’ 122.4 +6.4
Cow Creek/el. -152’ 123.4 +8.2
Trona/el. 1656’ 114.4 +8.9
Barstow/el. 2142’ 110.6 +8.0
Las Vegas AP, NV/el. 2162’ 112.6 +8.1
Goldfield, NV/el. 5700’ 98.4 +8.6
July 15-20, 1960, 6 days
Greenland Ranch/el. -178’ 123.3 +7.3
Cow Creek/el. -152’ 125.0 +9.0
Trona/el. 1656’ 114.8 +9.3
Barstow/el. 2142’ 111.5 +8.9
Las Vegas AP, NV/el. 2162’ 111.5 +7.0
Goldfield, NV/el. 5700’ 98.2 +8.4
TABLE B
The departure from average for the maximum temperatures for Greenland Ranch (first figure), for the heat waves listed in Table A, are compared to the average of the departures for the stations listed (second figure). The difference of these two values is also shown (third figure).
June 10-12, 1911, 3 days +1.3/+0.9/+0.4
July 5-19, 1911, 15 days +2.3/+1.7/+0.6
Aug 16-21, 1911, 6 days +3.0/+5.0/-2.0
June 2-6, 1912, 5 days +1.6/+2.2/-0.6
July 8-11, 1912, 4 days 0.0/+0.8/-0.8
August 4-10, 1912, 7 days 0.0/+0.6/-0.6
May 23-26, 1913, 4 days -1.4/-5.7/+4.3
June 18-25, 1913, 8 days -0.6/-6.1/+5.5
July 1-15, 1913, 15 days +9.7/+3.1/+6.6
July 9-13, 1913, 5 days +14.6/+5.7/+8.9
August 1-8, 1913, 8 days +1.8/-1.2/+3.0
June 26-July 4, 1914, 9 days +2.2/+1.1/+1.1
July 16-26, 1915, 11 days +0.1/+0.8/-0.7
August 8-13, 1915, 6 days +4.7/+1.2/+3.5
July 19-27, 1916, 9 days +5.9/+1.9/+4.0
July 10-15, 1917, 6 days +6.2/+6.2/ 0.0
July 26-30, 1917, 5 days +6.6/-5.7/+12.3
July 2-9, 1922, 8 days +5.8/+4.7/+1.1
July 12-16, 1922, 5 days +6.6/+6.6/ 0.0
July 9-21, 1927, 13 days +5.5/+5.5/ 0.0
July 16-28, 1931, 13 days +6.3/+8.4/-2.1
July 12-16, 1933, 5 days +8.6/+8.7/-0.1
July 24-28, 1933, 5 days +9.0/+7.2/+1.8
Aug 10-14, 1933, 5 days +9.0/+9.2/-0.2
July 26-29, 1934, 4 days +5.8/+8.0/-2.2
July 14-25, 1936, 12 days +6.3/+6.2/+0.1
July 21-26, 1942, 5 days +6.8/+8.3/-1.5
July 24-27, 1945, 4 days +4.8/+8.2/-3.4
July 14-18, 1949, 5 days +6.6/+7.1/-0.5
July 16-20, 1959, 5 days +6.4/+8.4/-2.0
July 15-20, 1960, 6 days +7.3/+8.5/-1.2

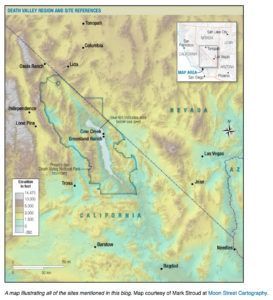

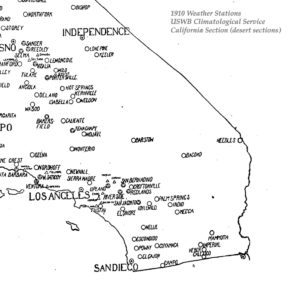


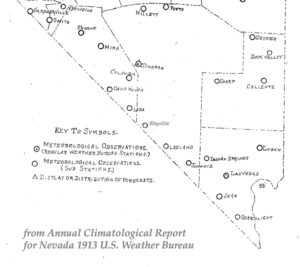

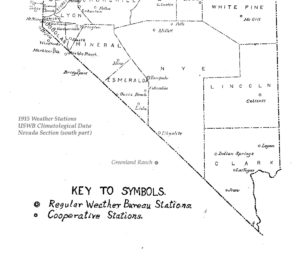
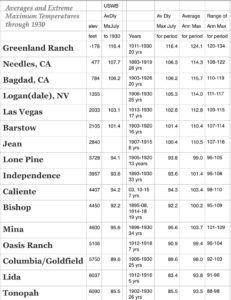
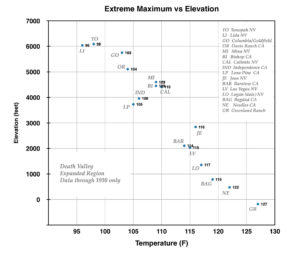
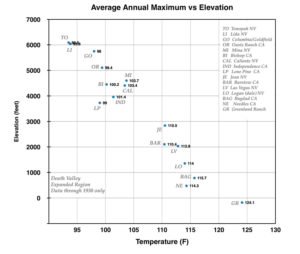
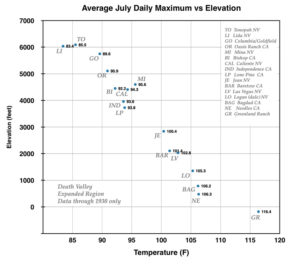
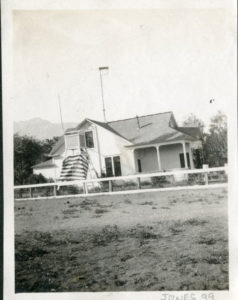


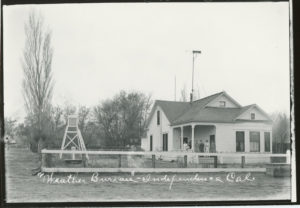
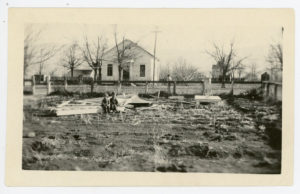

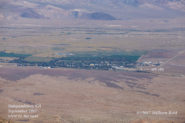

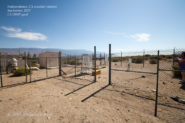
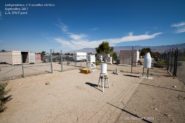

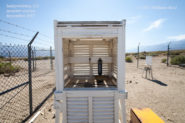
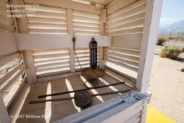

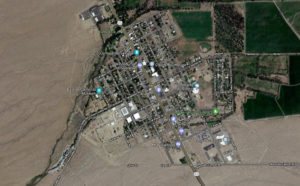
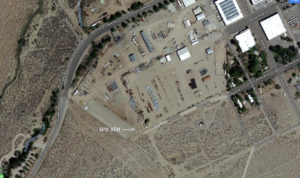
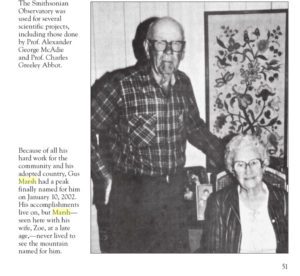
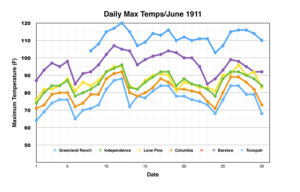
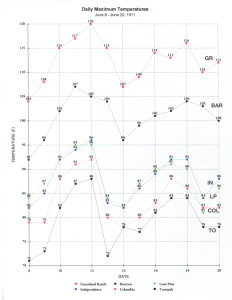
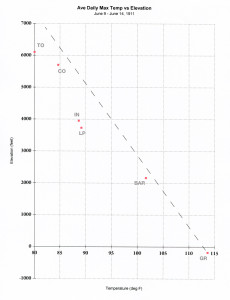


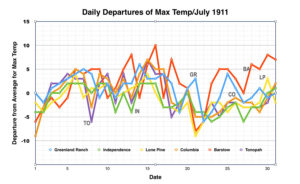

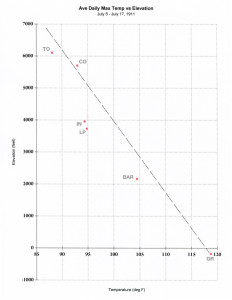


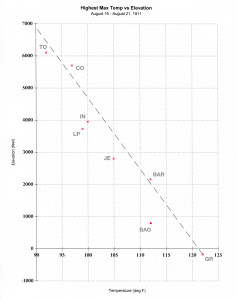
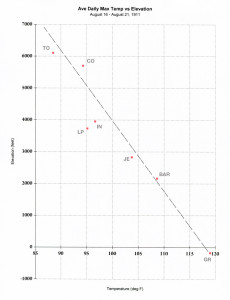
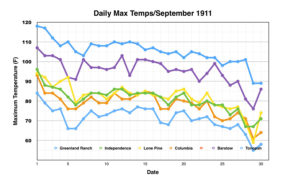
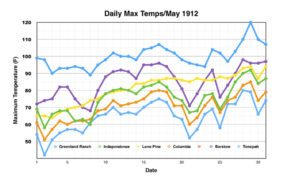
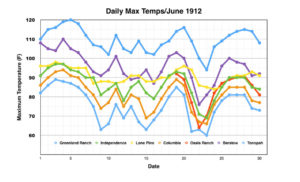
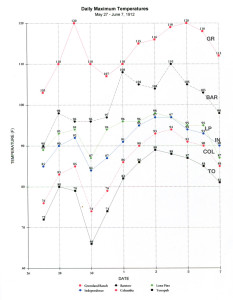

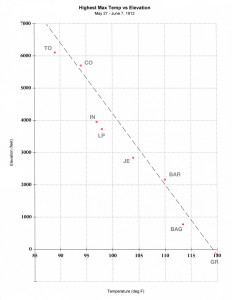


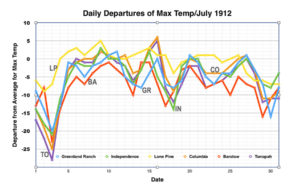
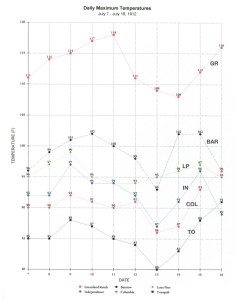
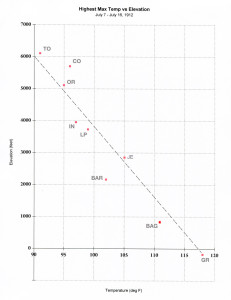
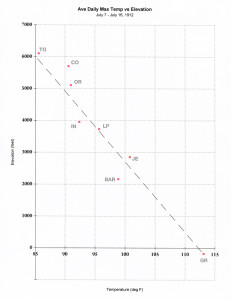
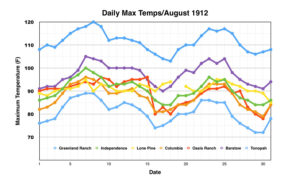
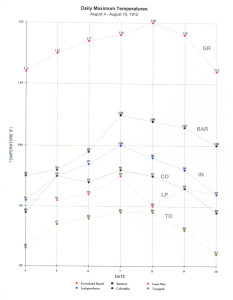

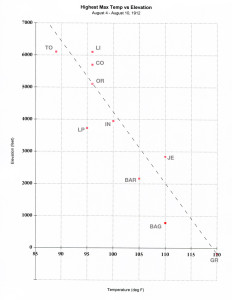
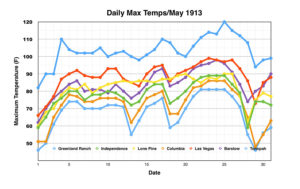
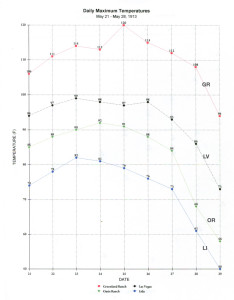
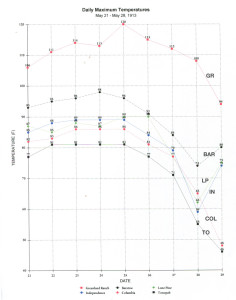
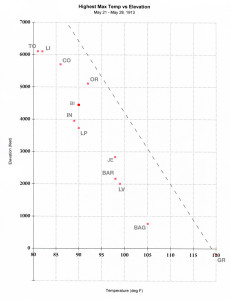

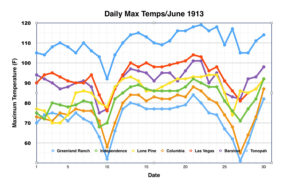
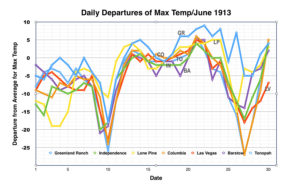
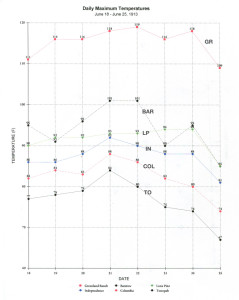
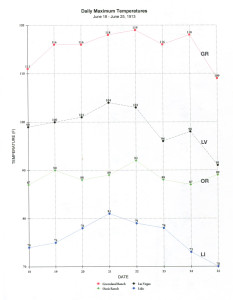


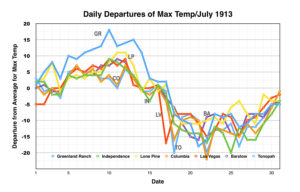
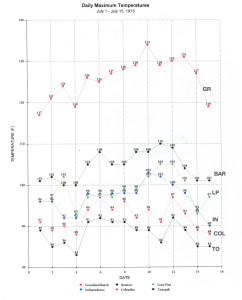
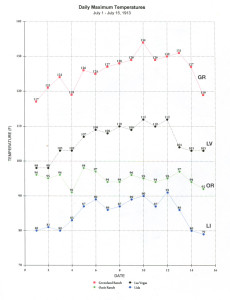
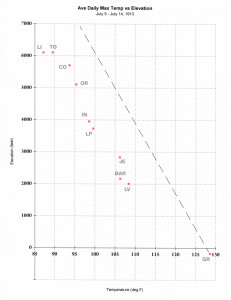

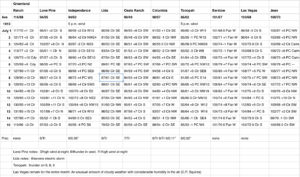
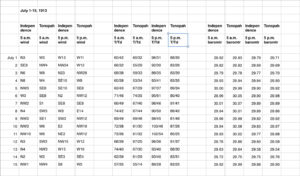
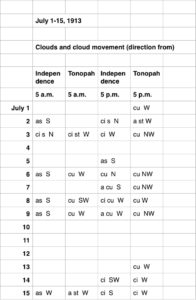


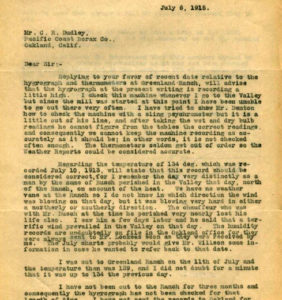
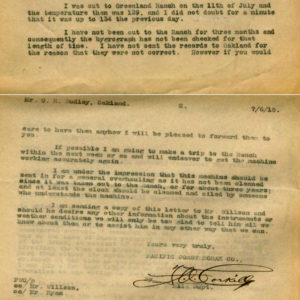
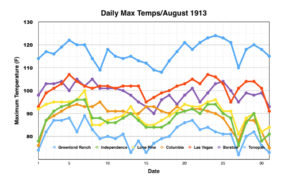
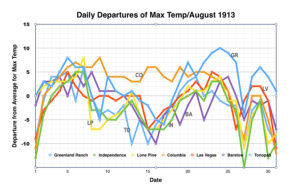


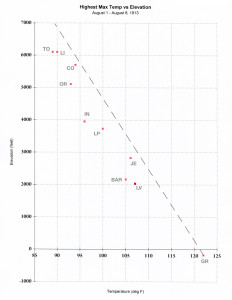
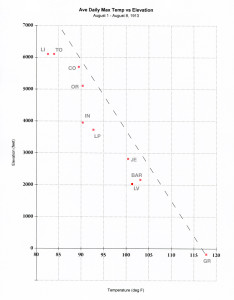
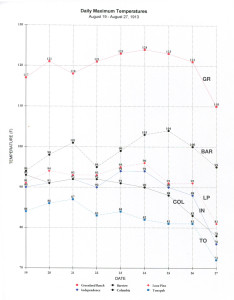
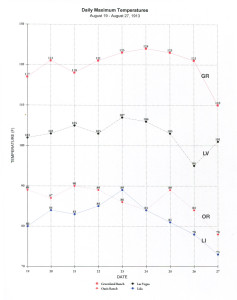
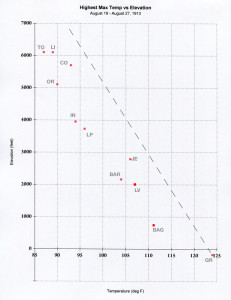
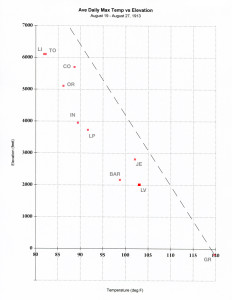
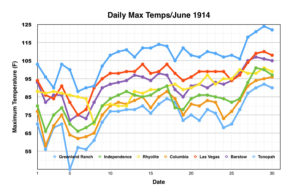

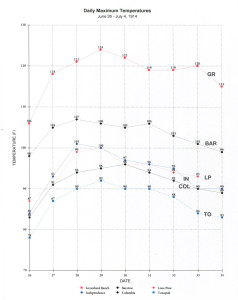


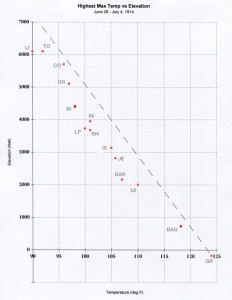


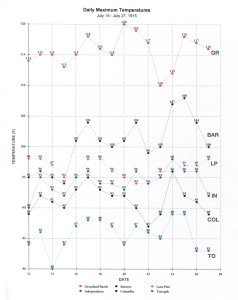
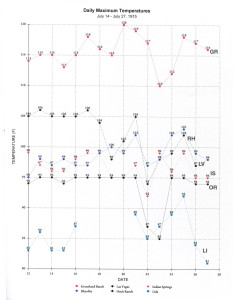

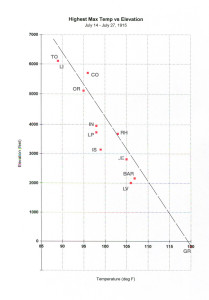


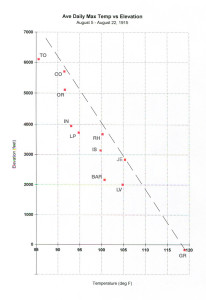
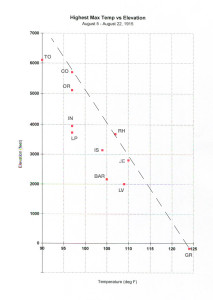

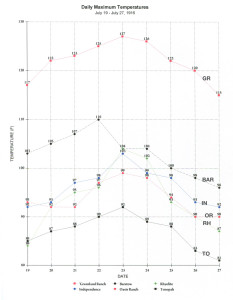
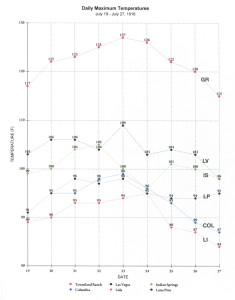
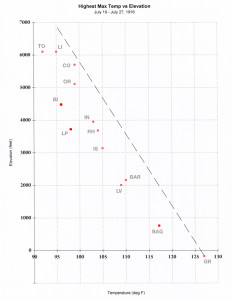
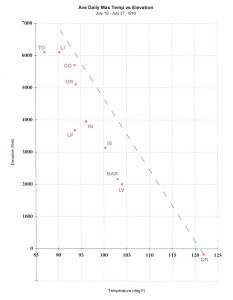

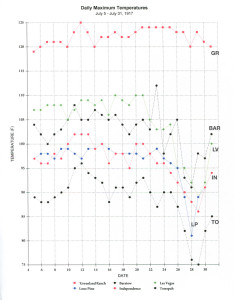
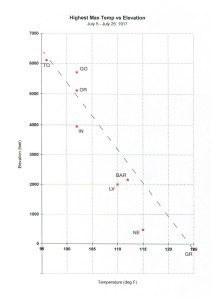
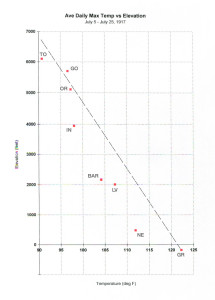
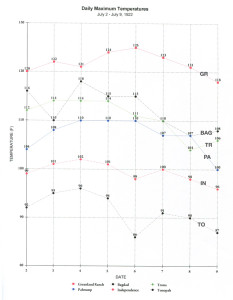
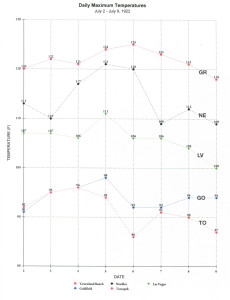


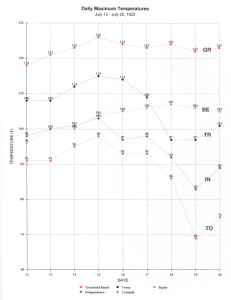
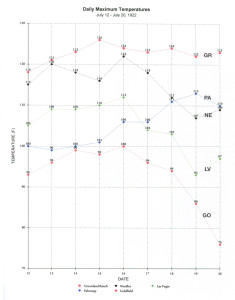
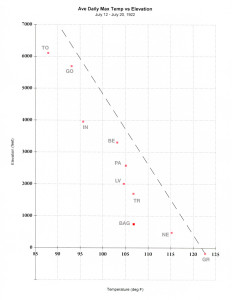
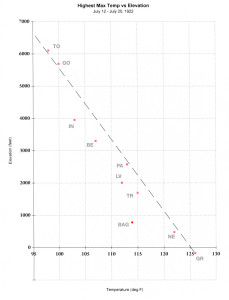

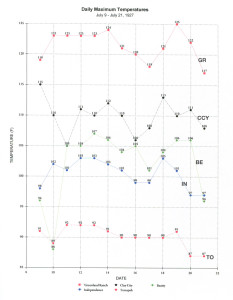
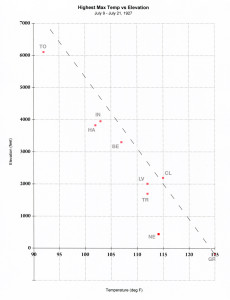


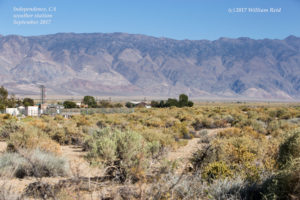
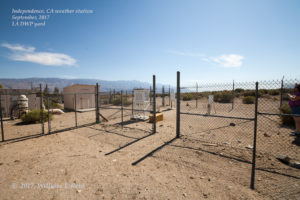


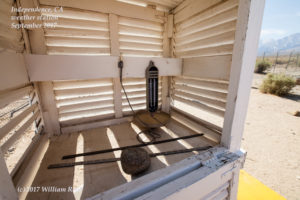


Leave a Reply
You must be logged in to post a comment.